UNLV Retrospective Theses & Dissertations 1-1-2008 Evaluating the use of system dynamics for improving stakeholder Evaluating the use of system dynamics for improving stakeholder decision maKing decision maKing Marcia Lynne Turner University of Nevada, Las Vegas Follow this and additional works at: https://digitalscholarship.unlv.edu/rtds Repository Citation Repository Citation Turner, Marcia Lynne, "Evaluating the use of system dynamics for improving stakeholder decision maKing" (2008). UNLV Retrospective Theses & Dissertations. 2858. http://dx.doi.org/10.25669/7maq-mtz7 This Dissertation is protected by copyright and/or related rights. It has been brought to you by Digital Scholarship@UNLV with permission from the rights-holder(s). You are free to use this Dissertation in any way that is permitted by the copyright and related rights legislation that applies to your use. For other uses you need to obtain permission from the rights-holder(s) directly, unless additional rights are indicated by a Creative Commons license in the record and/or on the work itself. This Dissertation has been accepted for inclusion in UNLV Retrospective Theses & Dissertations by an authorized administrator of Digital Scholarship@UNLV. For more information, please contact [email protected].
Transcript
UNLV Retrospective Theses & Dissertations
1-1-2008
Evaluating the use of system dynamics for improving stakeholder Evaluating the use of system dynamics for improving stakeholder
decision maKing decision maKing
Marcia Lynne Turner University of Nevada, Las Vegas
Follow this and additional works at: https://digitalscholarship.unlv.edu/rtds
Repository Citation Repository Citation Turner, Marcia Lynne, "Evaluating the use of system dynamics for improving stakeholder decision maKing" (2008). UNLV Retrospective Theses & Dissertations. 2858. http://dx.doi.org/10.25669/7maq-mtz7
This Dissertation is protected by copyright and/or related rights. It has been brought to you by Digital Scholarship@UNLV with permission from the rights-holder(s). You are free to use this Dissertation in any way that is permitted by the copyright and related rights legislation that applies to your use. For other uses you need to obtain permission from the rights-holder(s) directly, unless additional rights are indicated by a Creative Commons license in the record and/or on the work itself. This Dissertation has been accepted for inclusion in UNLV Retrospective Theses & Dissertations by an authorized administrator of Digital Scholarship@UNLV. For more information, please contact [email protected].
EVALUATING THE USE OF SYSTEM DYNAMICS FOR IMPROVING
STAKEHOLDER DECISION MAKING
By
Marcia Lynne Turner
Bachelor of Arts University of San Diego
1988
Master of Arts University o f Nevada, Las Vegas
1997
A dissertation submitted in partial fulfillment of the requirements for the
Doctor of Philosophy Degree in Environmental Science Department of Environmental Studies Greenspun College of Urhan Affairs
Graduate College University of Nevada, Las Vegas
December 2008
UMI Number: 3352190
Copyright 2008 by Turner, Marcia Lynne
All rights reserved.
INFORMATION TO USERS
The quality of this reproduction is dependent upon the quality of the copy submitted. Broken or indistinct print, colored or poor quality illustrations and photographs, print bleed-through, substandard margins, and improper alignment can adversely affect reproduction.
In the unlikely event that the author did not send a complete manuscript and there are missing pages, these will be noted. Also, if unauthorized copyright material had to be removed, a note will indicate the deletion.
UMIUMI Microform 3352190
Copyright 2009 by ProQuest LLC.
All rights reserved. This microform edition is protected against
unauthorized copying under Title 17, United States Code.
ProQuest LLC 789 E. Eisenhower Parkway
PC Box 1346 Ann Arbor, Ml 48106-1346
Copyright by Marcia Lynne Turner 2008 All Rights Reserved
Dissertation ApprovalThe Graduate College University of Nevada, Las Vegas
November 6 . 20 08
The Dissertation prepared by
M arc ia Lynne T u rn e r
Entitled
E v a lu a t in g th e Use o f System D ynam ics f o r
Im prov ing S ta k e h o ld e r D é c is io n M aking
is approved in partial fulfillment of the requirements for the degree of
D o c to r o f P h ilo s o p h y in E n v iro n m e n ta l S c ien c e ________
CoU^gè Faculty Representative
Exam inm ton CbmmitVee Chair
ExaminM ion C o m m itta l M em ber
irmimn Com m ittee M em ber
Dean o f the G raduate College
11
ABSTRACT
Evaluating the Use of System Dynamics for Improving Stakeholder Decision Making
By
Marcia Lynne Turner
Dr. Krystyna Stave, Examination Committee Chair Associate Professor and Graduate Coordinator
Department of Environmental Studies University o f Nevada, Las Vegas
When lay stakeholders are involved in complex environmental decision making,
the ensuing decision does not always effectively solve the problem of focus. This can be
due to the fact that standard facilitation methods commonly used to manage such efforts
frequently fail to promote thorough and rational decision analysis. A review of classical
and behavioral decision theory, stakeholder research and standard facilitation practices
suggests that standard facilitation methods tend to enable behavioral decision making
strategies which oversimplify decision making tasks, rather than employing classical
rational strategies which stress a more thorough decision analysis and maximization of
decision outcomes.
To test this hypothesis, I conducted a comparative experiment involving 196
stakeholders who attended a solid waste management public meeting in Los Angeles.
Participants were randomly assigned to a control and experimental group. The control
group was facilitated with standard methods and the experimental group was facilitated
111
with a more classically rational method, specifically system dynamics-based facilitation.
Pre- and post-intervention surveys were administered to measure participants’ ability to
identify effective solutions, their level o f focus on the presented materials and their level
of procedural satisfaction. I hypothesized that the experimental group would score higher
in each of these areas.
The results supported my first two hypotheses by showing that the experimental
group was better at helping its participants identify more effective outcomes and maintain
a greater focus on relevant information. However, the results failed to support the third
hypothesis that the experimental group would have a higher level o f procedural
satisfaction than the control group. Instead, the results showed that the standard
facilitation methods used in the control group were better at promoting participant
satisfaction and self confidence than were the system dynamics methods.
If the objective o f stakeholder involvement in complex environmental decision
making is the development of effective decisions to solve pressing environmental
problems, this experiment shows that system dynamics-based facilitation is an effective
tool for managing stakeholder involvement. The results also show that the identification
of effective solutions does not guarantee participant satisfaction and confidence.
IV
TABLE OF CONTENTS
ABSTRACT................................................................................................................................. iii
LIST OF FIGURES ..............................................................................................................vii
LIST OF TABLES.................................................................................................................... viii
ACKNOWLEDGEMENTS................................................................................................. ix
CHAPTER I PROBLEM............................................................................................................. ILegislative M andates.............................................................................................. 2Pragmatic Motivation............................................................................................................... 3Examples o f Failure to Implement Effective Solutions.......................................................5
Example #I : Mass-Transit Development Diluted and Delayed.................................... 5Example #2: Freev^ay Development Delayed and Defeated........................................ 7
General Research Question................................... 9Classical and Behavioral Decision Theory................................... 10
Classical Decision Making Theory Overview................................................................10Behavioral Decision Making Theory Overview............................................................ 14
Implications o f Decision Theory.......................................................................................... 22Analysis of Standard Group Decision Making Facilitation Practice.............................. 28Hypothesis................................................................................................................................36
CHAPTER 2 APPROACH................................................................................ 37Overview o f System Dynamics-Based Facilitation...........................................................38
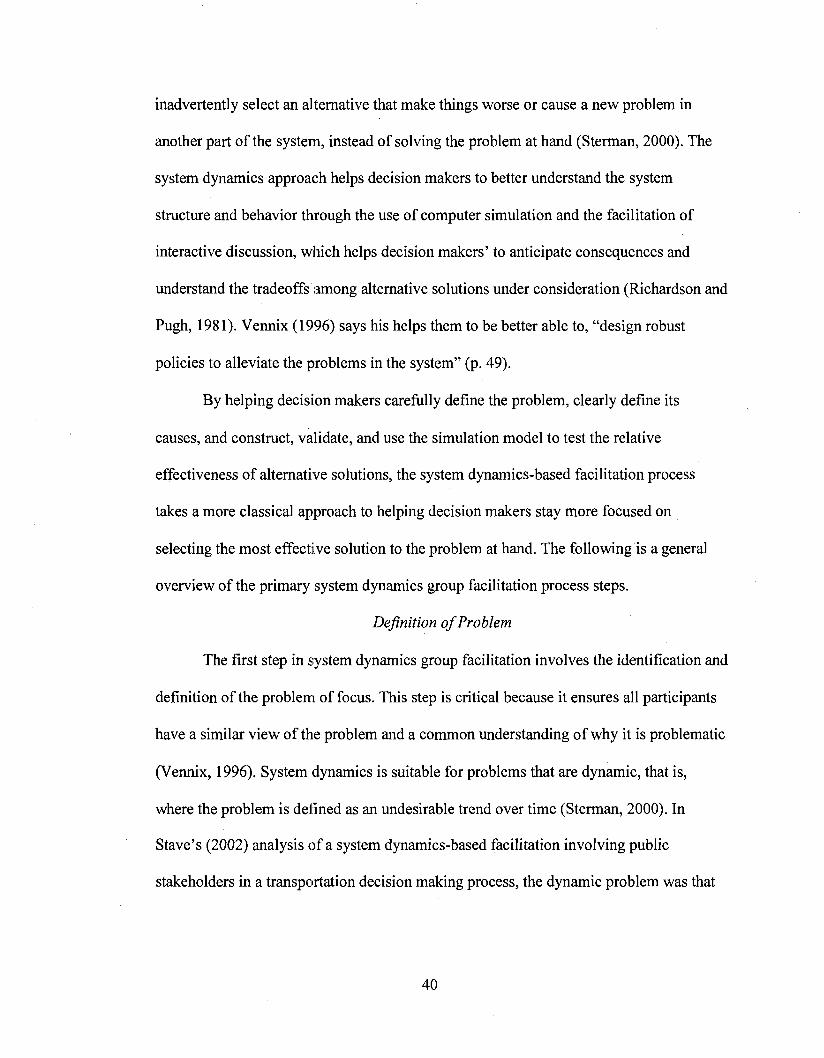
Definition o f Problem ....................................................................................................... 40Identification o f Problem Causes.....................................................................................41Construction and Validation of Model............................................................................ 44Model U se........................................................................................................................... 45Policy A nalysis.................................................................................................................. 46
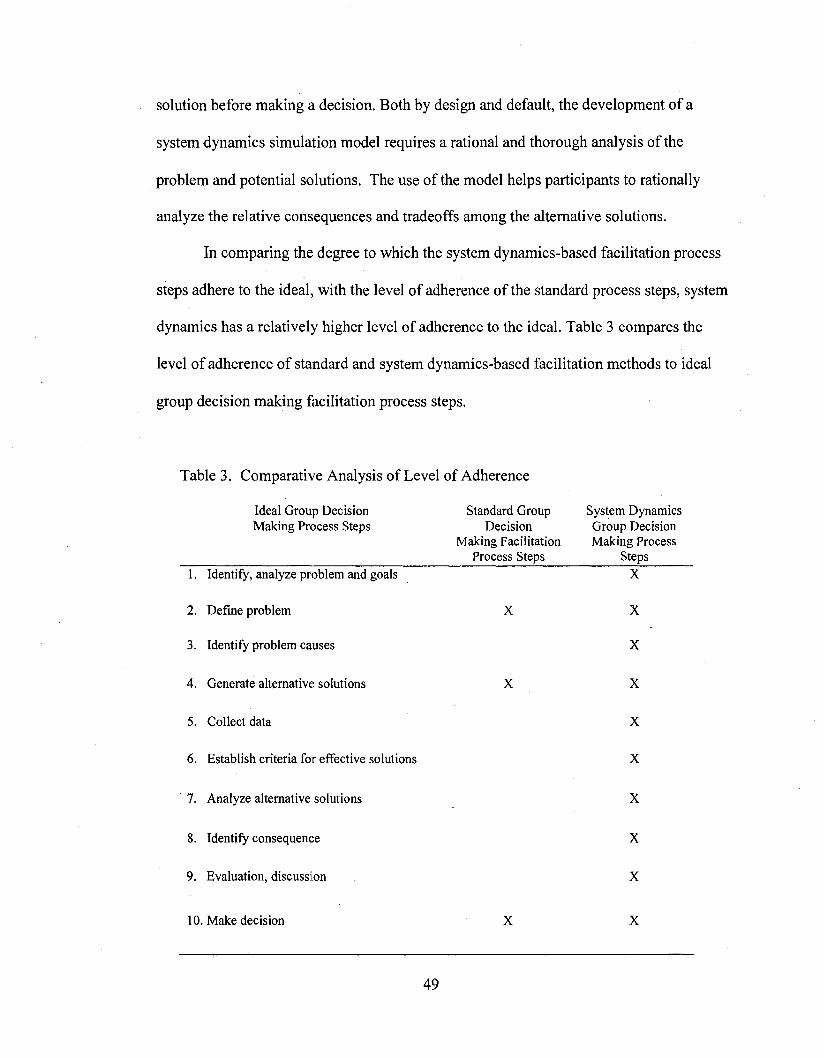
Analysis of System dynamics-based facilitation Adherence to Ideal............................. 48Related Research.....................................................................................................................50
CHAPTER 3 M ETHOD............................................. 54Experimental Procedures .................................... 54Experimental Controls............................................ 57Experimental Setting............................................... 59Conference Schedule and A genda....................................................................................... 61Small-Group Work Session Assignment ............................................................. 62
Leverage Point Evaluation Criteria...................................................................................... 66Group Facilitation Intervention.............................................................................................67Measurement Instrument....................................................................................................... 69
Demographic and Descriptive Questions........................................................................70Pre- and Post-lnten:ention Survey Questions Design................................................... 73
Demographics and Descriptions...................................................................................... 84Questions Related to Research Hypotheses....................................................................93
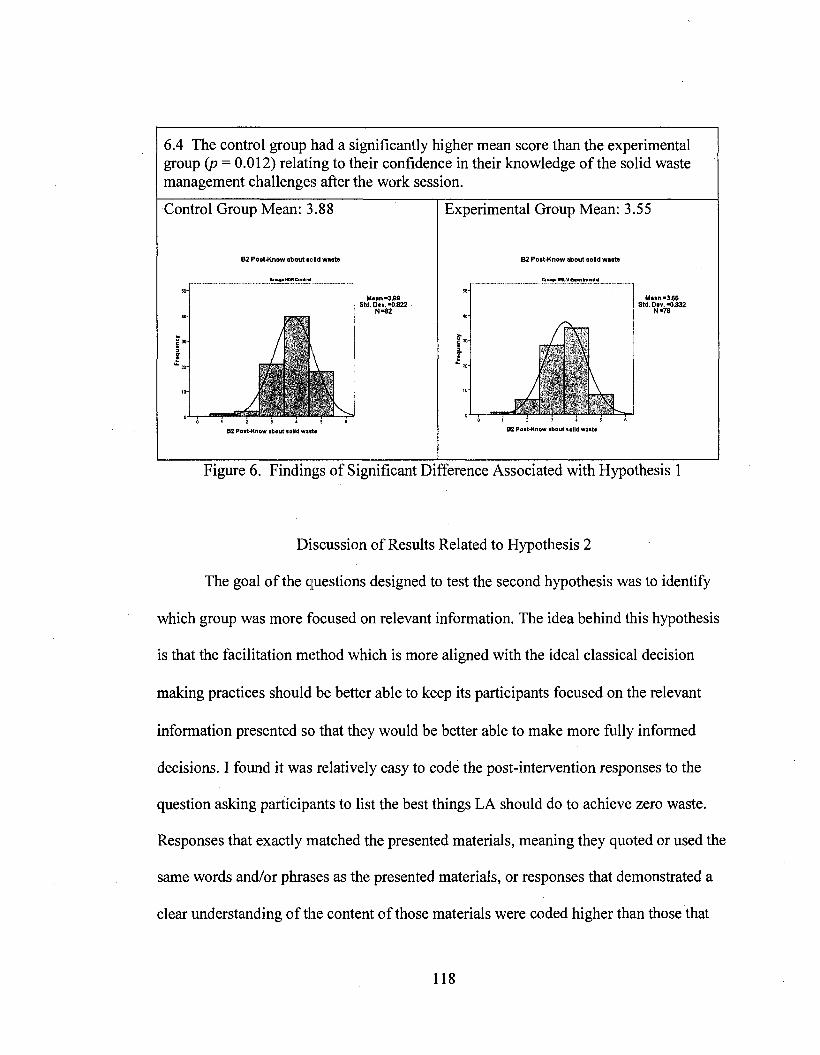
CHAPTER 5 DISCUSSION........................................... ......................................................111General Summary and Implications of Results.................................................................I l lDiscussion o f Results Related to Hypothesis 1.................................................................112Discussion o f Results Related to Hypothesis 2 .................................................................118Discussion of Results Related to Hypothesis 3 .................................................................121Strengths and Limitations....................................................................................................129
Suggestions for Future Research............................................................................... 136Confirm Effectiveness of System dynamics-based facilitation with PublicStakeholders ............................................................................................................. 136Study the Effectiveness o f System Dynamics at Different Points Along a Spectrumof Involvement Intensity.................................................................... 138Study the Effectiveness o f Traditional Facilitation Outcomes Independently, Not inComparison with System Dynamics..............................................................................139
APPENDIX................................................................................... 143Standard Facilitation Process Analysis..............................................................................143Pre-Intervention Survey.......................................................................................................159Post-Intervention Survey......................................................................................................163Demographic and Descriptive D ata................................................................................... 169Data Related to Hypothesis 1................................................................ 183Data Related to Hypothesis 2 ................................................................ 185Data Related to Hypothesis 3 .............................................................................................. 187
Figure 1. Causal Loop Diagram..............................................................................................43Figure 2. Solid Waste Integrated Resouree Planning.......................................................... 60Figure 3. Reeycling Loop.........................................................................................................63Figure 4. SWIRP Model........................................................................................................... 69Figure 5. Démographie and Deseriptive Responses............................................................ 93Figure 6. Findings o f Signifieant Difference Assoeiated with Hypothesis 1................... 118Figure 7. Findings o f Signifieant Differenee Assoeiated with Hypothesis 2................... 120Figure 8. Findings o f signifieanee related to Hypothesis 3.................................. 129
V ll
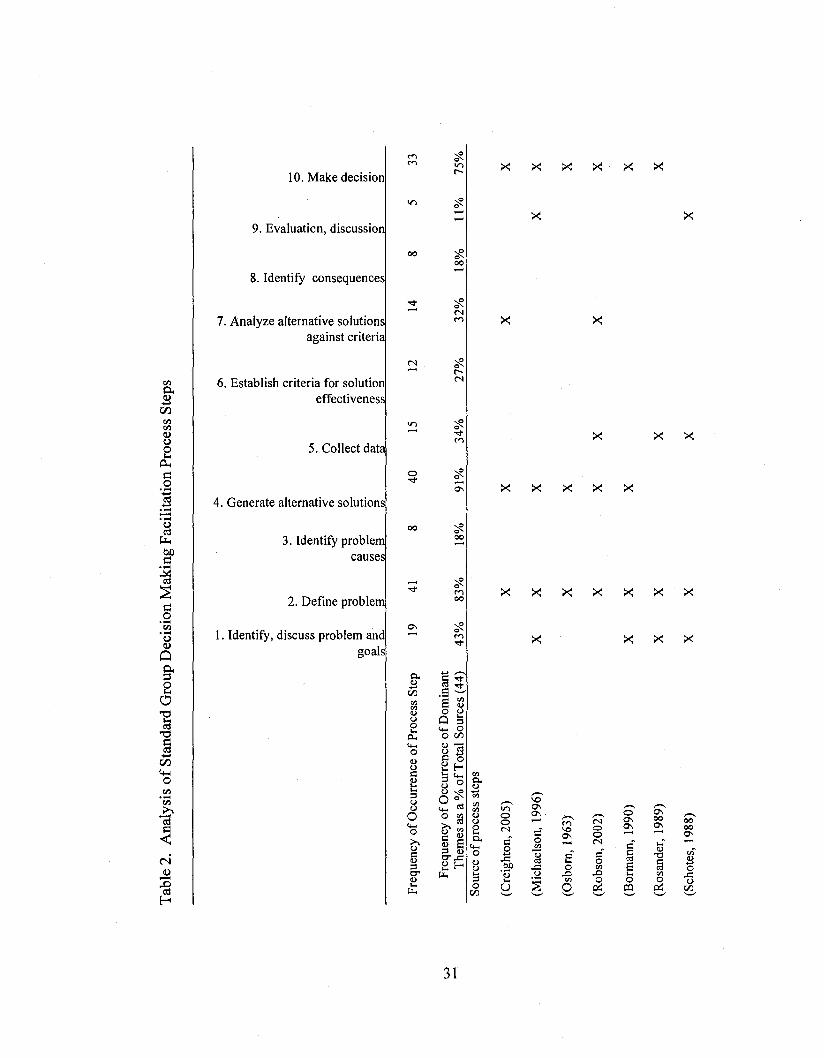
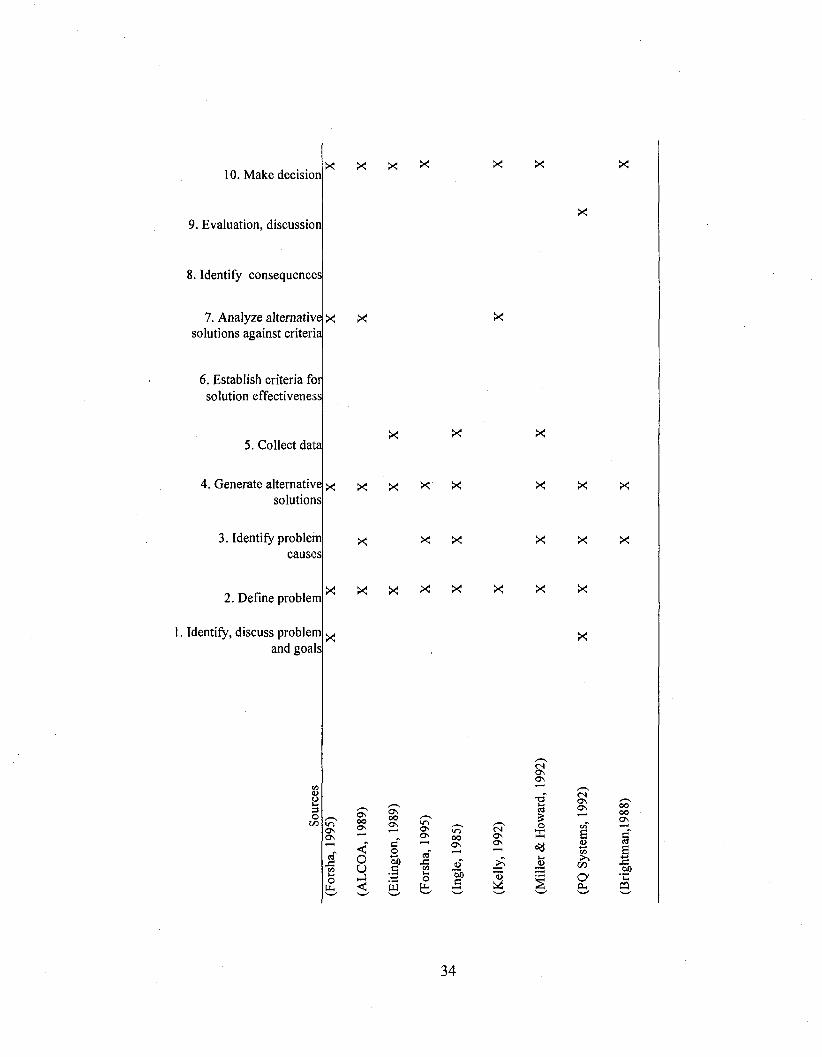
LIST OF TABLES
Table 1. Summary o f Rational Group Decision Making Process S teps.......................... 24Table 2. Analysis of Standard Group Decision Making Facilitation Process Steps 31Table 3. Comparative Analysis of Level of Adherence..................................................... 49Table 4. Demographic and Descriptive Survey Questions................................................72Table 5. Hypothesis 1 and Related Survey Questions....................................................... 76Table 6. Hypothesis 2 and Related Survey Questions....................................................... 78Table 7. Hypothesis 3 and Related Research Questions.................... 81Table 8. Demographic and Descriptive Questions..............................................................85Table 9. Number o f Past SWIRP Meetings Attended........................................................ 86Table 10. Reeyeling Behavior.................................................................................................. 86Table 11. Years Living in L A .................................................................................................. 87Table 12. Zip Code/Regional “Wasteshed” ........................................................................... 87Table 13. Sex.............................................................................................................................. 88Table 14. Education Level........................................................................................................88Table 15. A ge............................................. 89Table 16. Housing Type............................................................................................................89Table 17. Own or Rent................................................................ 89Table 18. Number in Household..............................................................................................90Table 19. Income........................................................................................................................90Table 20. Systemic Value Coding K ey...................................................................................96Table 21. Summary o f Statistieal Analysis o f Hypothesis 1 Questions............................100Table 22. Ranking Scale for Hypothesis 2 ............................................................................101Table 23. Summary o f Statistieal Analysis of Hypothesis 2 Questions............................104Table 24. Summary o f Statistical Analysis o f Hypothesis 3 Questions............................108Table 25. Sample participant feed back regarding what did not go well......................... 132
Vlll
ACKNOWLEDGEMENTS
Dr. Krystyna Stave introduced me to system dynamics-based facilitation some
years ago and ever since, I’ve had a hunch that it was a tool which could help improve
stakeholder participation in environmental decision making. Dr. Stave has mentored me
at each stage of my quest to test my hunch and 1 am sincerely thankful to her for sharing
her knowledge, expertise and friendship over the years.
1 would also like to acknowledge and thank my Examination Committee
Members Dr. Timothy Famham, Dr. Anthony Ferri, and Dr. Jerry Simich for their time,
their sage advice and their kindness. Thank you too, to Chancellor James Rogers, Dr.
Etienne Rouwette and Dr. Maurizio Trevisan, and the late Dr. Hal Rothman for their
support and encouragement.
Without the help of Dr. Stave, Steve Coyle, Ruth Abbe and the leadership at the City of
Los Angeles, 1 would not have been able to conduct such a robust experiment. 1 am very
grateful to them for their willingness to enable and assist with this research project. 1 also
appreciate assistance o f the following system dynamics facilitators who helped make this
experiment possible; Dan Andersen; Mike Dwyer; Stephanie Fincher; Nick Grenier; Leah
This first phase of the SWIRP process began in May 2007 and concluded in
May 2008. During this first phase, six public workshops were held in each o f the six
waste eolleetion regions in the eity, for a total o f 36 workshops. In addition to the
workshops, the City condueted three city-wide eonferenees to give stakeholders from
the six regions the opportunity to interaet with one another. 1 condueted my
experiment at the seeond eity-wide eonferenee.
Figure 2 shows the representatives o f the City presentation used to illustrate
the SWIRP process and the organization o f the various workshops (WS) and city-
60
wide conferences. The arrows represent the six waste collection or “wasteshed”
regions.
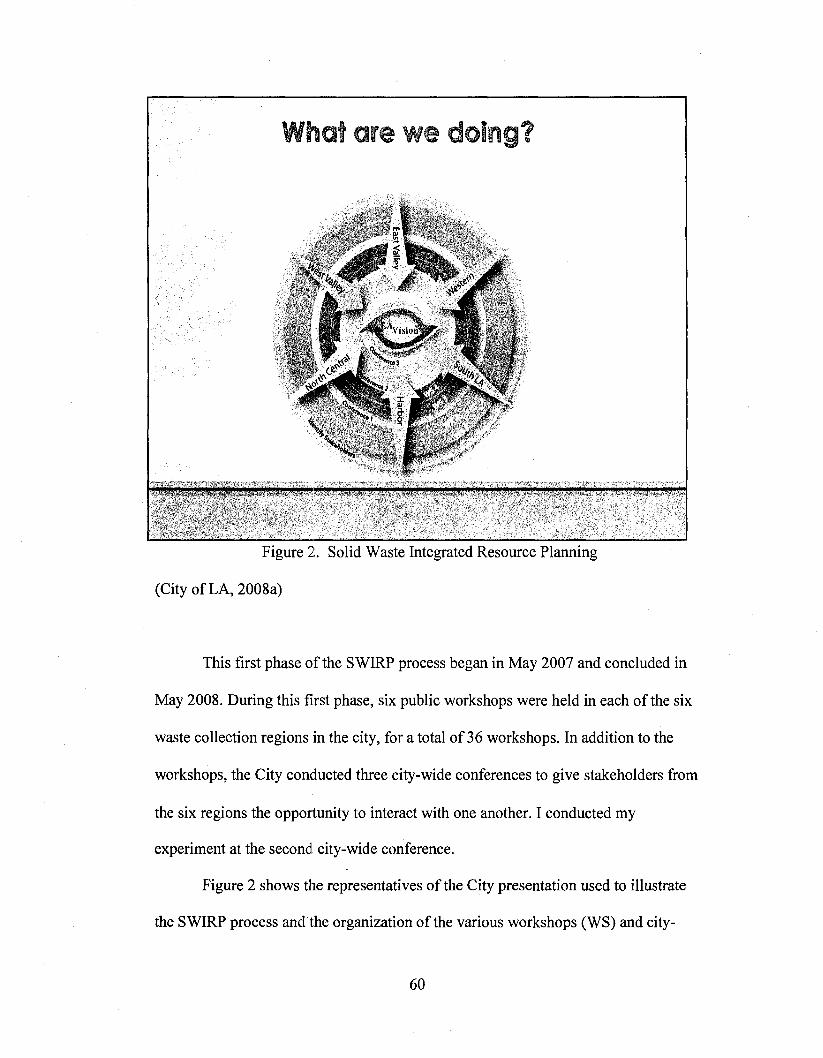
Conference Schedule and Agenda
I conducted my experiment during the City’s second city-wide conference,
which was designed to solicit input from LA stakeholders regarding alternative
“leverage points” or policy options to help LA waste managers in prioritizing their
efforts during the SWIRP process. The meeting began with presentations to all
participants, and then transitioned into two work sessions in which participants were
asked to gather in small groups to enable discussion about the policy options under
consideration. My experiment took place during the 90-minute Work Session #1.
General City of LA “Zero Waste” SWIRP City-Wide Conference Schedule
7:30 - 8:30 AM: Zero Waste Film Festival, Stakeholder Registration and Continental Breakfast• Provide attendees with a name tag• Provide each attendee with an agenda of the day’s activities and schedule• Have short clips o f zero waste videos from other cities or entities playing in
the room while attendees have breakfast.8 :3 0 - 10:00 AM: Welcome by City Officials• Welcome remarks and presentations from City of Los Angeles officials 10:00 - 10:15 AM: Welcome by City and HDR (the City’s SWIRP consulting
firm)• Introduction of day and activities by City staff• Explain break up groups and simulation objectives by representative of HDR
consulting firm10:30 - 12:00 PM: Work Session #1• Purpose: To give participants a chance to discuss and provide feedback on
leverage points under consideration12:00 - 1:30 PM: Lunch with Panel Discussion 1:30 - 3:00 PM: Work Session #2• Purpose: Continue discussion from work session #1 3 :0 0 - 3:30 PM: Wrap up and Conclusion
61
Small-Group Work Session Assignment
A representative from the City’s waste management agency and a
representative o f HDR (the City’s SWIRP consulting firm) provided overview
presentations about the day’s activities and the objective of the work sessions prior to
the beginning of the first small-group work session. The overview presentation
reminded partieipants of the purpose and need for the Zero Waste initiative and
provided a summary of the public participation efforts and feedback to date.
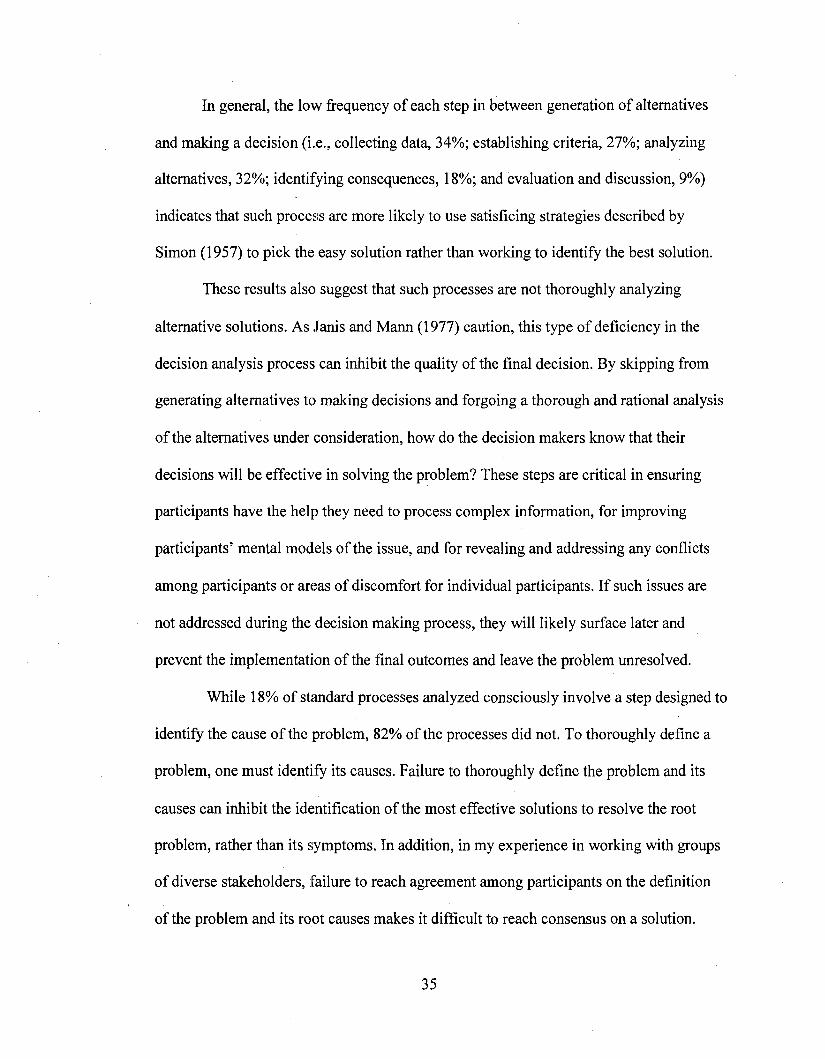
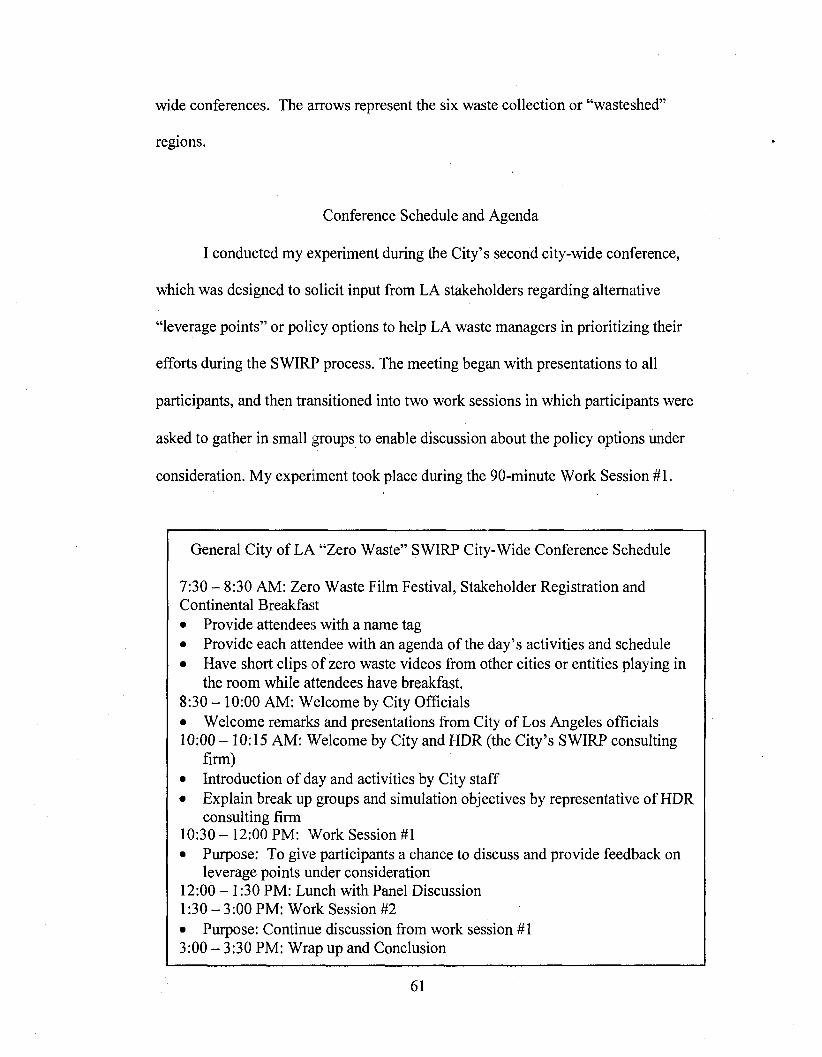
During this presentation, the HDR representative also provided an overview
of the reeyeling loop to help ensure that partieipants understood the strueture of the
recycling system. She also introduced the eore policy areas in which leverage could
be applied to ehange the amount o f solid waste sent to the landfills. For instance,
mandated eolleetion sendee or disposal fee sureharge, eould be implemented to
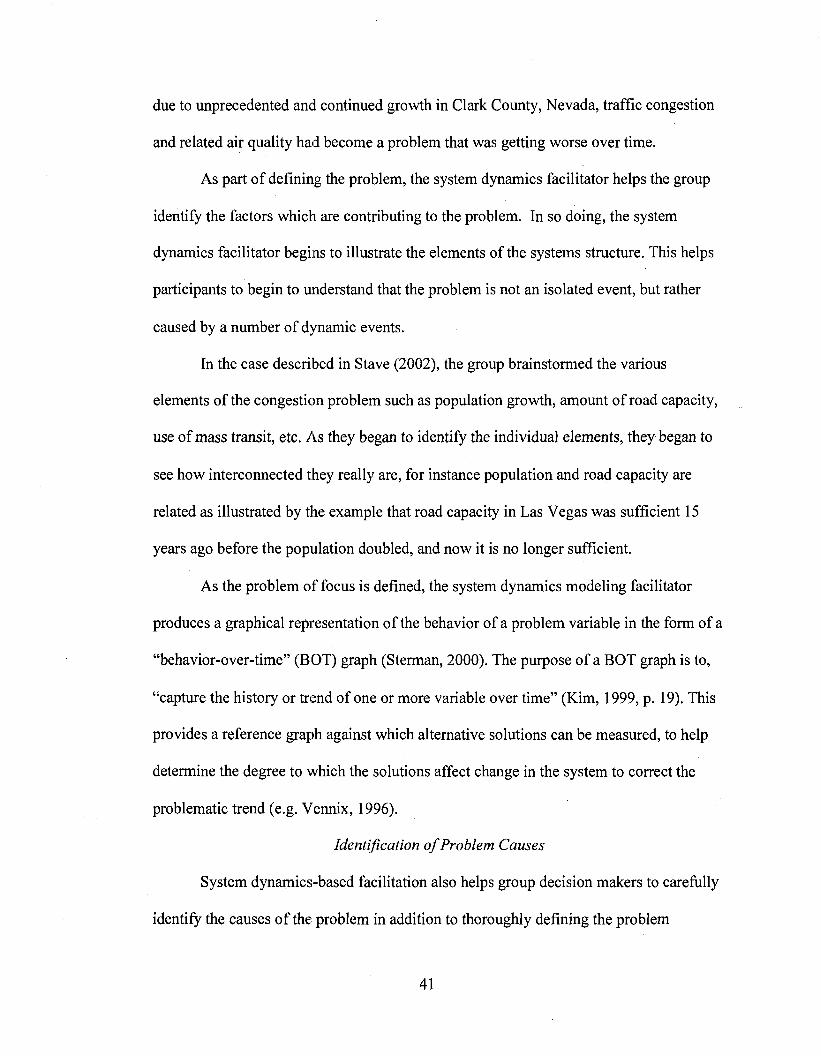
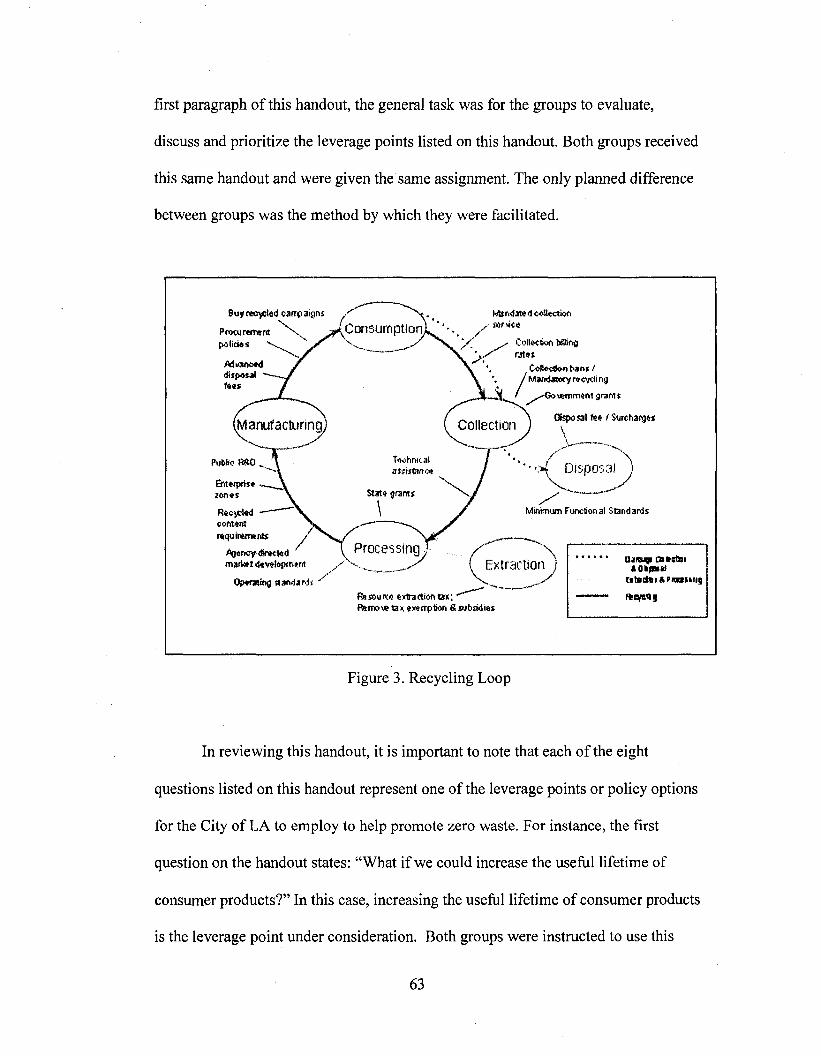
eneourage people to reuse and reeyele more. Figure 3 is similar to the graphie used
by the HDR representative to illustrate the “extraetion, proeessing, manufacturing,
consumption, collection disposal” sectors of the reeyeling loop (Stave, 2008). This
illustration also introduced examples of alternative policy leverage points, or areas in
the system in which a policy change could be made to reduce the amount o f waste
that ultimately ends up in the landfill. Figure 4 is a copy of the handout that was given
to all partieipants to provide additional information on these policy leverage points.
In addition to the overview presentation, all attendees o f the conference were
given a copy o f the following handout to provide them with instruetions for the work
session, and additional information on the alternative leverage points under
consideration. While the assignment for the work session is well artieulated in the
62
first paragraph of this handout, the general task was for the groups to evaluate,
discuss and prioritize the leverage points listed on this handout. Both groups received
this same handout and were given the same assignment. The only planned difference
between groups was the method by which they were facilitated.
B u y r e c y o l e d c a r r p a i s i n s / '
P r o c u r « m n « ^ ^ ( C o n S U m p t l O n
, A d t f a n c * d
hit
PuWtc moE f r t « i p r f î «zone;
R e c v c l e d c o n t e n t r a q u i r e t m n t s
M b n d a t e d c o l t e c w n «nice
C ollection t # n g
rate ICotlecdonbans /M a n d W w y r » c y d i n g
■Gotemment grant;
% p o s a l ( e e f S u r o h a n j o s
\ ____M an u fac tu rin g Collection
TechnicalDisposal J
grants\
Processing .Extraction
M i n i m u m F u n c t i o n a l S t a n d a r d s
AgencyAectod m a d * : d e e e l o p m e f i t
O p e r a t m g t t a n d a r d i i
F l j s o u n c e e x t r a c t i o n t a x ; ^ R e m o t e t a x e x e m p t i o n S t u b b i e s
OaibV GBtetui «OitBiP tilBdti Aznaiilig
Figure 3. Recycling Loop
In reviewing this handout, it is important to note that each o f the eight
questions listed on this handout represent one of the leverage points or policy options
for the City of LA to employ to help promote zero waste. For instance, the first
question on the handout states: “What if we could increase the useful lifetime of
consumer products?” In this case, increasing the useful lifetime of consumer products
is the leverage point under consideration. Both groups were instructed to use this
63
handout as the basis for their discussion, evaluation and prioritization of these eight
leverage points or basis for a policy LA could use to promote zero waste. The
following is a copy o f the handout all participants of both groups were given at the
beginning o f the work session;
ZERO CItywide C onference 2
WASTE PLAN Policies, Program an d FacilitiesSolid W aste in teg ra ted Resources Plan
Listed below are the leverage points in the recycling loop and exam p le strategies identified by LA stakeholders for reaching, zera w aste . The id ea at these leverage paints is ta say: it w e could c h a n g e something by a certain am ount, w hat im pact would it hove? Today, w e will discuss these lev era g e points, describe their individual strengths and w eak n esses an d the oppartunities and constraints that c o m e with e a c h leverage point. We will then rote their potential im pact (high, medium, law) with respect ta w aste reduction, environmental benefit, cast effectiveness, and e a s e at implementatian. Finally, w e will c a m e up with a recom m endatian far haw aggressively the City shauld pursue e a c h leverage paint.UPSTREAM Production Sector1. What if w e cauld increase the a v e r a g e useful lifetime at
consum er products?Examples:■ Increase praduct durability■ Educate cansumers an the c a n s e q u e n c e s at excess
cansumiption■ Encaurage repair and reuse
2. What if w e cauld red u ce the am ount of w aste in products an d packaging?Examples:■ Implement praduct and pack ag in g bans or take backs far
an w a ste reduction■ Require manufacturers ta red u ce the w eight at packaging
3. What if w e could increase the recycled can ten t at praducts and packag ing?
64
Examples:■ Promote “buy recycled" com p oign■ Require manufocturers to increose tine use of recycled
con ten t in products ond pockoging4. Whot if w e could m oke products ond p ock og in g more
recycloble?Exemples:■ Implement product ond pockoging bons or toke bocks
focu sed on recycled content■ Require monufocturers to c h o n g e tine con ten t of ttneir
products ond pock og in g to m oke ttiem more recyclobleDOWNSTREAMConsumption Sector5. Wtnot if w e could c h o n g e the o v e r o g e am ount of moteriol
co n su m ed by e o c h consumer?Exemples:■ Mossive ond sustoined public outreoch on d educotion
co m p o ig n focu sed on w oste prevention (olso colled “source reduction")
Collection Sector6. Whot if w e could increose consumer diversion rotes?
Exemples:■ Massive ond sustoined public outreoch on d educotion
Com poign focu sed on recycling■ Mondotory porticipotion in recycling ond orgonics
programs (single-fomily, multi-fomily, com merciol) - no trosh in the recycling ond no recycling in the trosh
■ Roll-out recycling ond orgonics contoiners to oil multi- fomily buildings
■ Roll-out recycling ond orgonics contoiners to oil com m erciol generotors
■ Roll-out recycling on d orgonics contoiners to oil schools in Los Angeles Unified School District
Processing Sector7. Whot if w e could increose the processing c o p o c ity for
diverted moteriols?Exemples:
■ Increose the p resen ce of neighborhood sco le focilities such as reuse centers ond fix-it shops through technicol ossistonce, gronts, and incentives
■ Increose the processing co p o c ity of existing recycling ond com posting focilities through focility exponsion or by odding more shifts
65
■ MRP first (process residual w aste prior to disposal to rem ove recyclobles an d com postobles)
■ Site n ew mulctiing and com posting facilities■ Site n ew SAFE centers for collection of tiousehold
hazardous w aste and electronics■ Site n ew resource recovery porks for self-houled moteriols
RESIDUAL WASTE MANAGEMENTDisposol Sector8. Whot if w e could increose the co p o c ity for olternotive
technologies?Exemples:
■ Biological treotment of residuol w oste through onoerobic digestion
■ Thermol treotment of residuol w oste through woste-to- energy
■ Conversion of residuol w oste to biofuels
(City of LA, 2008 b)
Leverage Point Evaluation Criteria
As the participants discussed, evaluated and prioritized each of these leverage
points, they were directed to compare them in terms of the following criteria: the
amount o f waste sent to the landfill, the relative costs, the relative greenhouse gas
emissions, and relative level of effort to implement. For instance a leverage point
could rank high in reducing the amount of waste sent to the land fill, producing low
greenhouse emissions, but it could be very costly and hard to implement. Participants
of both groups were asked to evaluate each of the eight leverage points against these
criteria and provide feedback to the City of LA on which of the eight leverage points
it should devote its time pursuing.
66
Group Facilitation Intervention
Both the control and experimental groups were given the same list of leverage
points and the same four criteria upon which to evaluate the leverage points. The
difference between the two groups was the method by which they were facilitated.
The control group was facilitated with standard methods and the experimental group
was facilitated with system dynamics-based methods.
The purpose of this experiment was to compare the relative differences in the
responses o f groups facilitated with standard and system dynamics-based facilitation
methods. The goal was to measure whether groups facilitated with a method that
adhered more closely with the ideal process steps, system dynamics-based
facilitation, would yield a higher level o f effectiveness, focus, and procedural
satisfaction than standard facilitation methods.
The control group was facilitated with standard facilitation methods. The
standard methods used to facilitate the control group were consistent with those
outlined in Chapter 1. The facilitators were instructed to focus on generating
discussion about the issue through soliciting input on the participants’ opinions o f the
strengths, weaknesses, opportunities, and constraints about the various leverage
points under consideration. They also encouraged participants to discuss how to
prioritize the leverage points and decide which ones the City should focus its efforts
on. The primary tools used in the facilitation of the control group’s small groups, was
a flip chart on an easel amd colored pens. These tools were used to summarize and
record the groups’ feedback and help them to focus on developing a set of
recommendations for the City.
67
The experimental group was facilitated with system dynamics-based
facilitation methods. The facilitators of the experimental group used a system
dynamics simulation model to help participants to better understand the nature of the
problem, and the relative effectiveness of the alternative leverage points in helping
the City of LA to achieve zero waste.
Because there was not sufficient time during this conference to involve
participants in the development of the model, the model that was used in this
experiment was designed in advance by an expert system-dynamics modeler who
worked in collaboration with representatives from LA and HDR to develop a system
dynamics model which accurately represented the solid waste system in the LA
region. The model is described in Stave (2008).
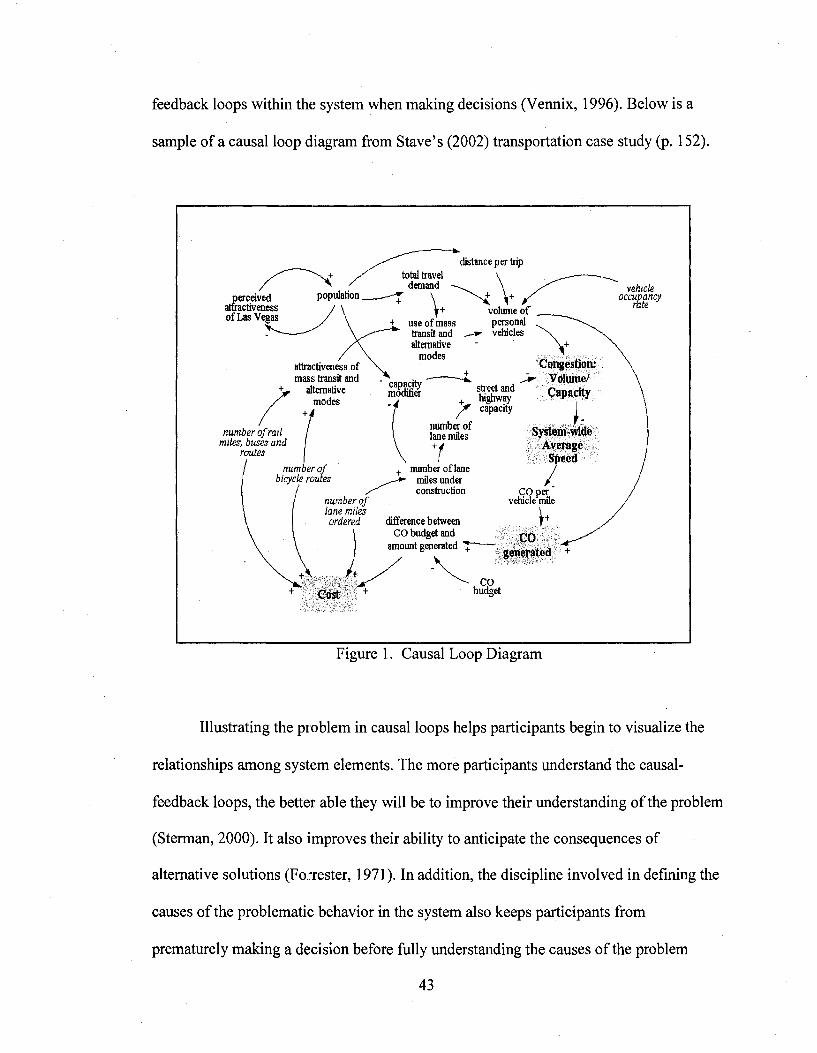
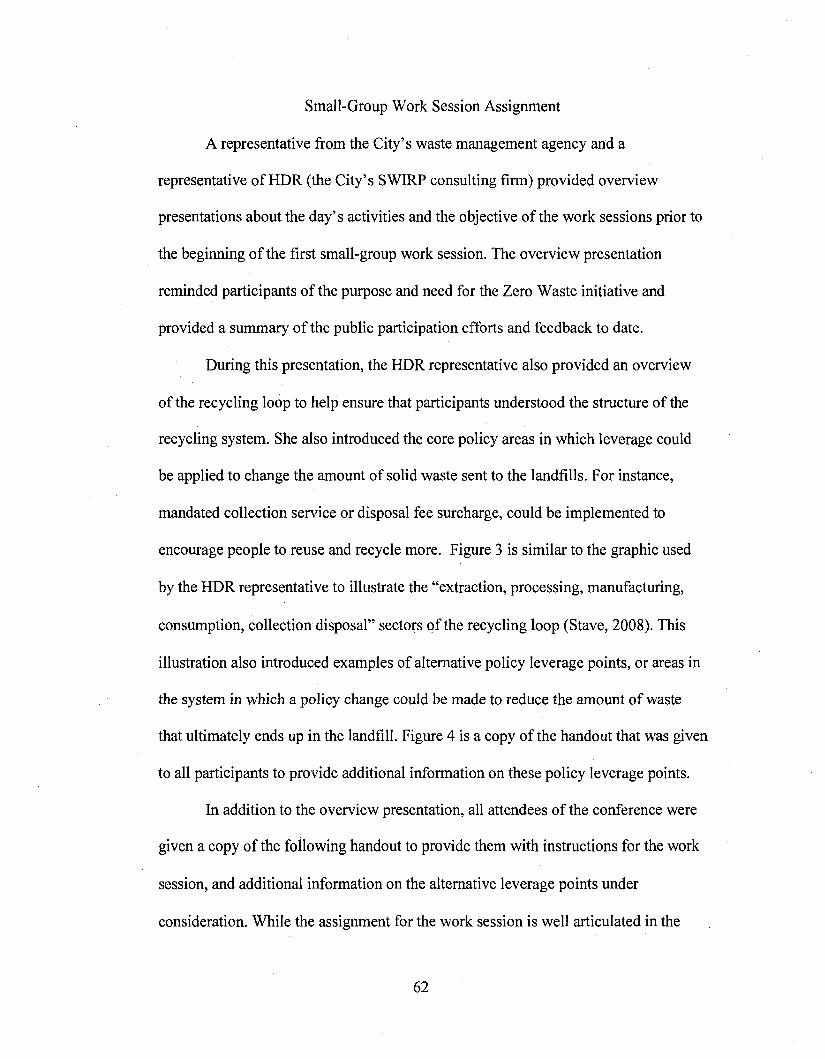
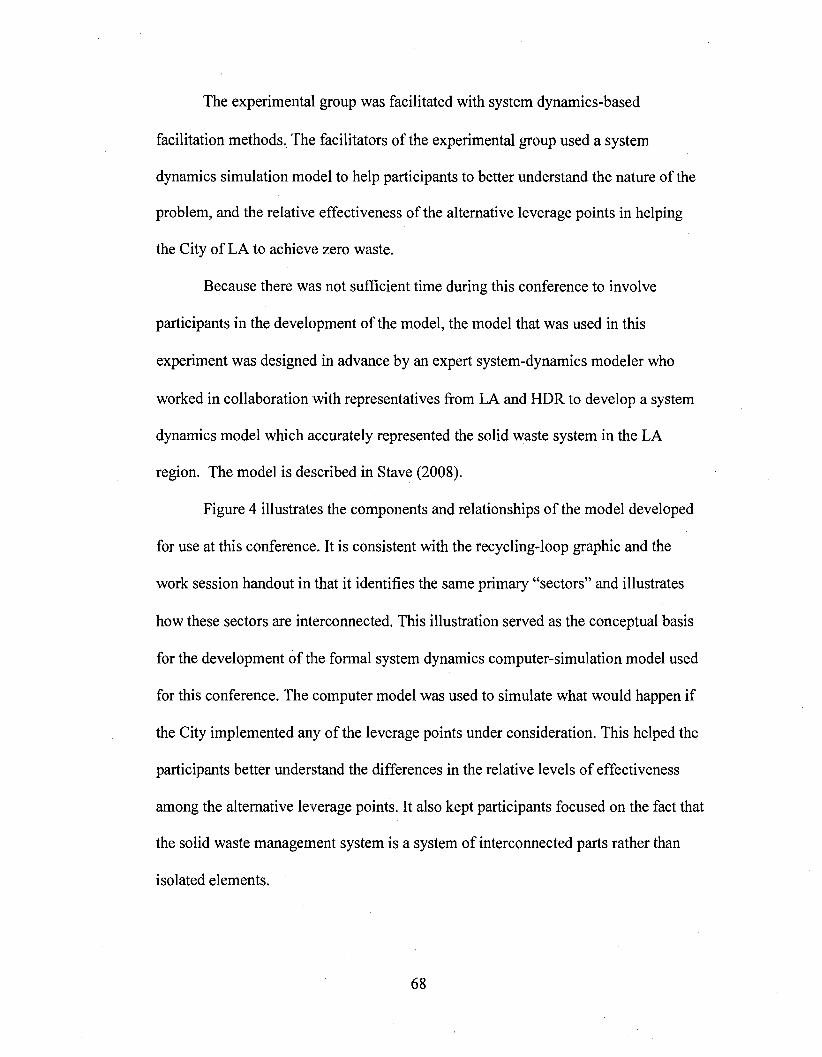
Figure 4 illustrates the components and relationships of the model developed
for use at this conference. It is consistent with the recycling-loop graphic and the
work session handout in that it identifies the same primary “sectors” and illustrates
how these sectors are interconnected. This illustration served as the conceptual basis
for the development of the formal system dynamics computer-simulation model used
for this conference. The computer model was used to simulate what would happen if
the City implemented any of the leverage points under consideration. This helped the
participants better understand the differences in the relative levels of effectiveness
among the alternative leverage points. It also kept participants focused on the fact that
the solid waste management system is a system of interconnected parts rather than
isolated elements.
68
Consumption
Collection
Recydhg
Processing
Production
(Stave, 2008)Figure 4. SWIRP Model
Measurement Instrument
I designed the pre- and post-intervention survey as a means of collecting data
to compare the relative differences between two groups’ responses. The pre
intervention survey instrument established a baseline for comparing respondents’
attitudes before the intervention (Dillman, 1978). This determines the degree to which
the intervention affects the responses (Moser & Klaton, 1972).
The format of the questions in the pre-intervention survey included restricted
questions, closed-ended questions with ordered alternatives (Dillman, 1978). It also
69
included partially open ended questions, and Likert-scale questions (Bordens &
Abbott, 1991). Six of the questions that were asked in the pre-intervention survey
instrument were also asked in the post-intervention survey instrument.
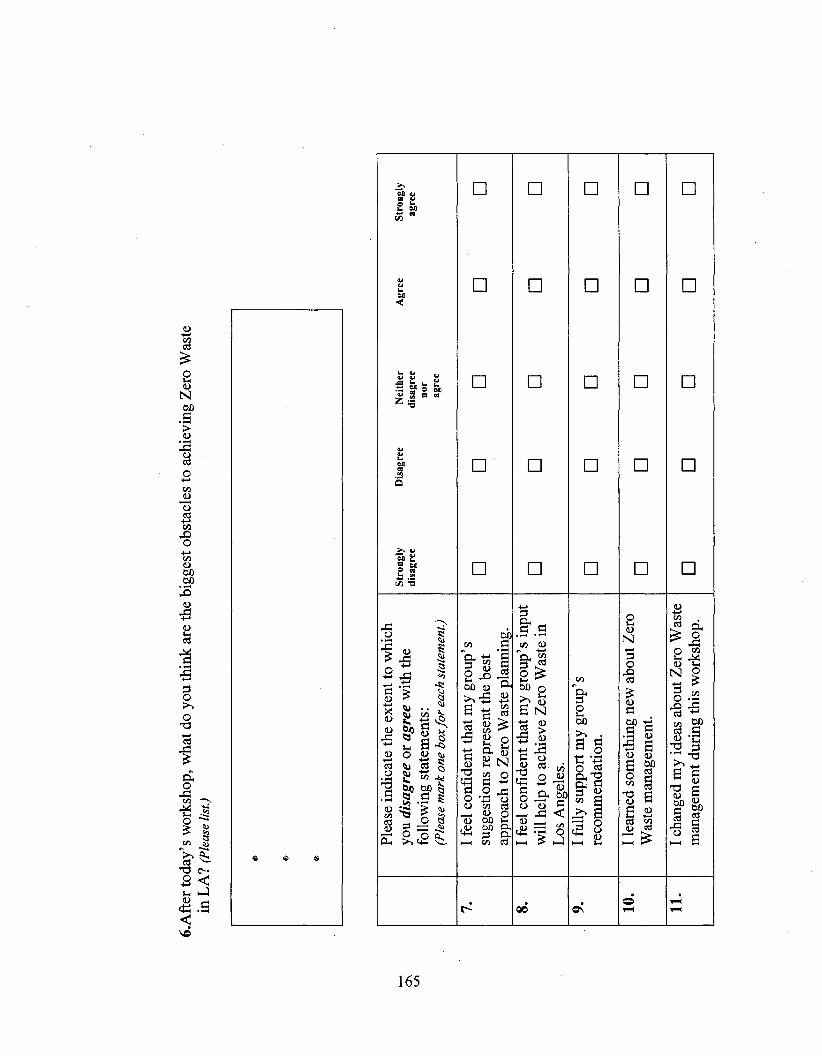
The post-intervention survey instrument included a variety o f different types
of questions. In addition to the six pre-intervention, it also included Likert-scale
questions to measure if participants strongly disagree to strongly agree with a series
of 20 statements. These questions were modeled after various process assessment
survey instruments and related research developed by Wilson (2005), Gottlieb (2003),
and Brilhart (1968).
Demographic and Descriptive Questions
The pre-intervention survey instrument included 12 demographic and
descriptive questions designed to gain a better understanding o f the characteristics of
the participants. The primary goal o f these questions was to gather data to determine
whether there was a significant difference in the composition o f participants of the
experimental and control groups in terms of their past experience with the SWIRP
process, their general recycling behavior, and other questions related to general
demographics.
The general demographic questions included in this survey instrument (e.g.,
sex, age, household income) are very common in survey instruments; however, the
wording o f these questions was mostly modeled after Dillman (2000). The recycling
behavioral questions were modeled after similar questions geared towards measuring
behavior developed by Nardi (2003), and the interest in participation questions were
modeled after Brilhart’s (1968) “work in group process assessment.” Dillman and
70
Nardi are experts in the field of survey research and Brilhart is an expert in the
research o f group performance.
The first two questions I included were intended to collect some descriptive
information. The first question asked participants to identify how many SWIRP
meetings they had attended in the past. I assumed that those who had participated in
past SWIRP meetings would be more knowledgeable about the subject and process
than those who had not attended past meetings. This question identified if there was
an even distribution betv/een the two groups o f participants who had and had not
attended past SWIRP meetings.
Next I asked participants to indicate their recycling behavior by selecting one
of these statements, “no, not at all; a little; some but not everything I can recycle;
most o f what I can recycle; everything I can recycle.” This also helped me measure if
there was a significant difference between the group members’ recycling behavior. If
one group had been made up o f those who did not recycle and the other group was
composed of those who recycled everything they could, this difference between the
two groups could have skewed the results o f the other questions. Therefore, it was
important to establish whether there was a significant difference in the two groups’
participants’ recycling behavior between the participants in the two groups.
The other questions collected demographic data for both groups. I gathered
data on how long they had lived in the area, their zip code to identify in which regions
participants resided to ensure there were no significant differences between the
groups knowledge of the area, and ensure that there was an even mix o f regional
representation between groups. I also asked questions to identify sex, education
71
level, age, dwelling type, whether they owned or rented, the number of people living
in their household, and their annual income level. The validity of the results of the
other questions would have been called into question if there had been a significant
difference between groups in any of these areas. The structure o f these questions
were modeled after samples provided by Dillman (2000).
Table 4 lists the demographic and descriptive questions asked in the
pre-intervention survey.
Table 4. Demographic and Descriptive Survey Questions
Questions:
How many SWIRP meetings have you attended before this one?
Do you recycle?
How many years have you lived in Los Angeles?
Current Zip Code? (coded by zip codes within the six regional collection“wastesheds”)
Sex?
Highest level o f education?
Age?
What kind o f housing do you live in?
Do you own or rent?
How many people in your household?
Annual household income?
72
Pre- and Post-Intervention Survey Questions Design
The following is a list o f questions posed to address each o f the three
hypotheses o f this study. The questions that were asked in the pre-intervention and
post-intervention survey instruments are indicated as such in the lists below and the
rest o f the questions were asked only in the post-intervention instrument. The
research references upon which the individual questions are modeled are listed for
each individual question. I selected Huz (1999) and Rouwette (2003) from my review
of the system dynamics literature for relevant qualitative survey instruments to serve
as the central sources after which I modeled many of the questions in my survey
instrument.
I modeled many of my survey questions after the instruments used in research
conducted by Huz (1999) and Rouwette (2003). Both o f these studies involved a
between-groups experimental design and administered surveys to measure the level of
effectiveness o f system dynamics modeling. While each had a different research
focus, both research projects sought to measure participants’ responses to questions
regarding their experience. The focus o f these questions was very close to what I was
seeking to measure in my study. While I was tempted to replicate a blending of the
specific questions asked in these two studies, the focus of my study was different
enough that I chose not to replicate these prior survey instruments exactly. In the
listing o f my survey questions below I referenced these authors next to the questions
that were influenced by their work. I also was able to get input from Rouwette as I
was developing my survey instrument. His guidance helped me to refine the focus of
my questions.
73
The other primary research areas I drew upon in developing my survey
instruments were the areas of group process and group performance research. The
primary sources from these areas I referenced in crafting my survey questions were
Brilhart (1968), Gottlieb (2003), Wilson (2005), Rees (2005), and Zakay (1984).
Brilhart (1968) is one of the leading researchers on group performance and Gottlieb
(2003) has also done extensive research in the area as well. Their research focuses on
understanding how group process affects group performance. Wilson (2005) and Rees
(2005) focus on understanding how facilitation affects group process and
performance. Zakay’s (1984) research focuses on studying group performance in a
business setting. I modeled many o f my procedural satisfaction questions after the
work of these researchers. Some of the demographic and descriptive questions, and
some of the questions designed to measure the participants self-reported knowledge
and ability about the issue were also modeled after these researchers’ work. In the
listing of the questions I have identified which of my questions were influenced by
these researchers.
Questions testing the first hypothesis were intended to measure whether there
was a difference in the degree to which the facilitation method helped participants to
process information and anticipate consequences of alternative solutions. The goal
was to identify which group was able to identify more solutions that have a relatively
greater potential o f resolving the problem o f focus upon implementation.
Specifically, I tested whether or not the group facilitated with system dynamics
modeling was better able to identify the leverage points with a higher level of
74
potential in effecting positive change in helping LA achieve zero waste, than the
group facilitated with standard methods.
Other questions related to this first hypothesis measured which group had
higher level of confidence in their ability to understand and select the solutions with
the highest level of potential effectiveness in solving the problem of focus and their
confidence in their overall knowledge of the issue. The intent with these questions
was to measure if there vvas a correlation between actual and perceived ability to
select the most effective solutions to the problem at hand. The coding methodology
for this question is described in detail in the next chapter.
The question asking participants to identify “ ... the best things for the City to
focus on in order to move towards Zero Waste;” and the question asking participants
how much they " ... know about the solid waste challenges in LA,” were asked both
in the pre and post-inten/ention surveys. I asked these questions before the work
session to establish a baseline understanding of whether or not the groups
demonstrated a significant difference in their responses to these two questions. In
both cases, there was not a significant difference in the pre-intervention responses.
Table 5 lists the first hypothesis and the specific questions that were asked in
an effort to measure the differences between groups with respect to this hypothesis.
75
Table 5. Hypothesis 1 and Related Survey Questions
Hypothesis 1 : Participants in group decision making facilitation processes that adhere more closely to the ideal group decision making facilitation process steps will identify more effective solutions to resolve the stated problem, than will participants in groups using standard facilitation methods.
Goal o f Comments & Questions
Comments & Questions Posed Source after which comments & questions were modeled
Goal: Identify which group actually identified solutions that were objectively more effective in helping achieve zero waste.
What do you think is the best thing for the City to focus on in order to move towards Zero Waste? (Preintervention, as coded for systemic value)
After this morning’s workshop, what do you think would be the best things for the City to focus on in order to move towards Zero Waste in LA? (Post-intervention, as coded for systemic value)______
(Huz, 1999; Rouwette, 2003, Brilhart, 1968)
Goal: Identify which group had higher level o f confidence in their ability to select the best solutions.
We are helping the City o f Los Angeles discover the best options for achieving Zero Waste.
How much do you know about the solid waste challenges in LA? (Pre-intervention)
(Wilson, 2005)
After this morning’s workshop, how much do you know about the solid waste issue in LA? (Post- intervention)____________________
(Wilson, 2005)
76
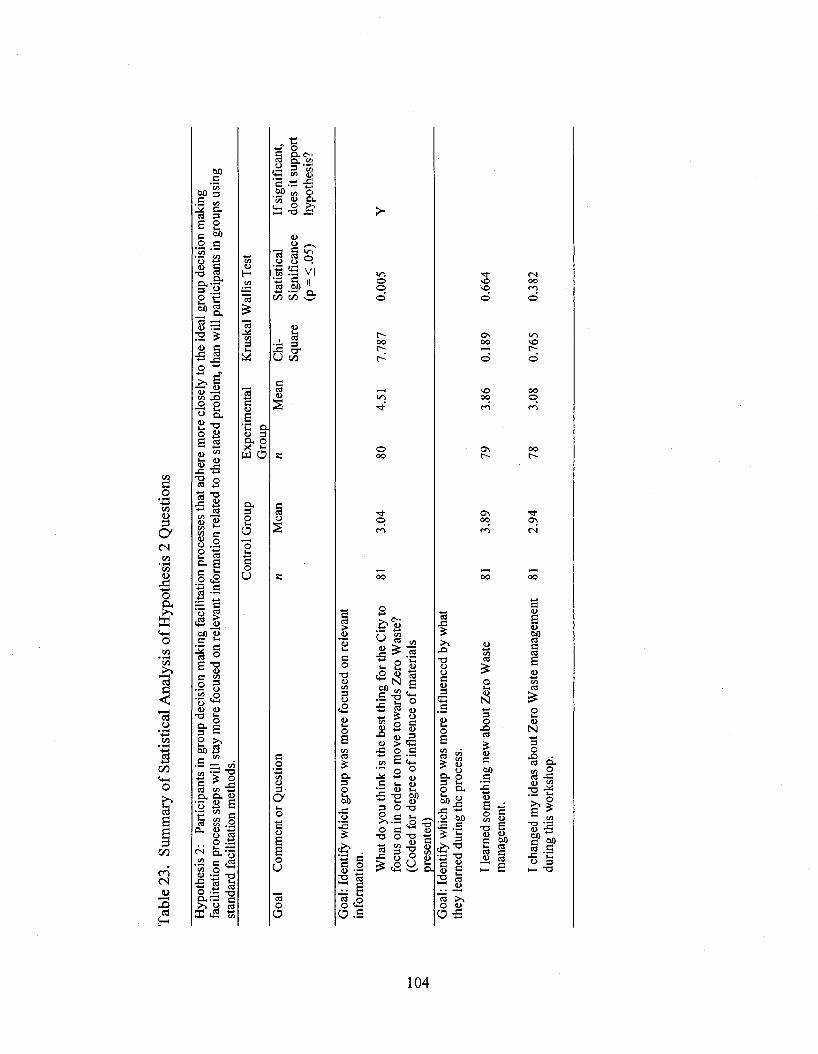
Questions related to the second hypothesis measured the degree to which
participants focused on relevant information. The logic behind this hypothesis was
that the facilitation process that helps its participants stay more focused on relevant
information will be better able to help its participants to improve their understanding
of the problem and solutions. This improved focus and understanding should then
help participants to be more able to make more fully informed and better decisions in
selecting the best solution to a problem.
The first goal in designing questions to address this hypothesis was to identify
a way to measure the degree to which participants are focused on the relevant
information provided to the group. To measure focus, “the best things for the City to
focus on in order to move towards Zero Waste,” was coded to identify the degree to
which the participants of both group specifically referenced the materials presented.
Because the same materials were presented to both groups, and the fact that these
materials listed the relevant information to help participants understand the nature of
the eight leverage points, this question was designed to help measure which group
was more focused on these materials.
The second goal o f questions testing this second hypothesis was to identify
which group was more influenced by what they learned during the process. One
question measured the degree to which participants of both groups were aware that
they had learned something new, and another question was designed to test if they
had consciously changed their mind about the subject based on what they had learned
during the experience. These two questions measured whether there was a difference
77
between the two facilitation methods in helping participants to be focused on if the
process helped them to improve their understanding of the issue.
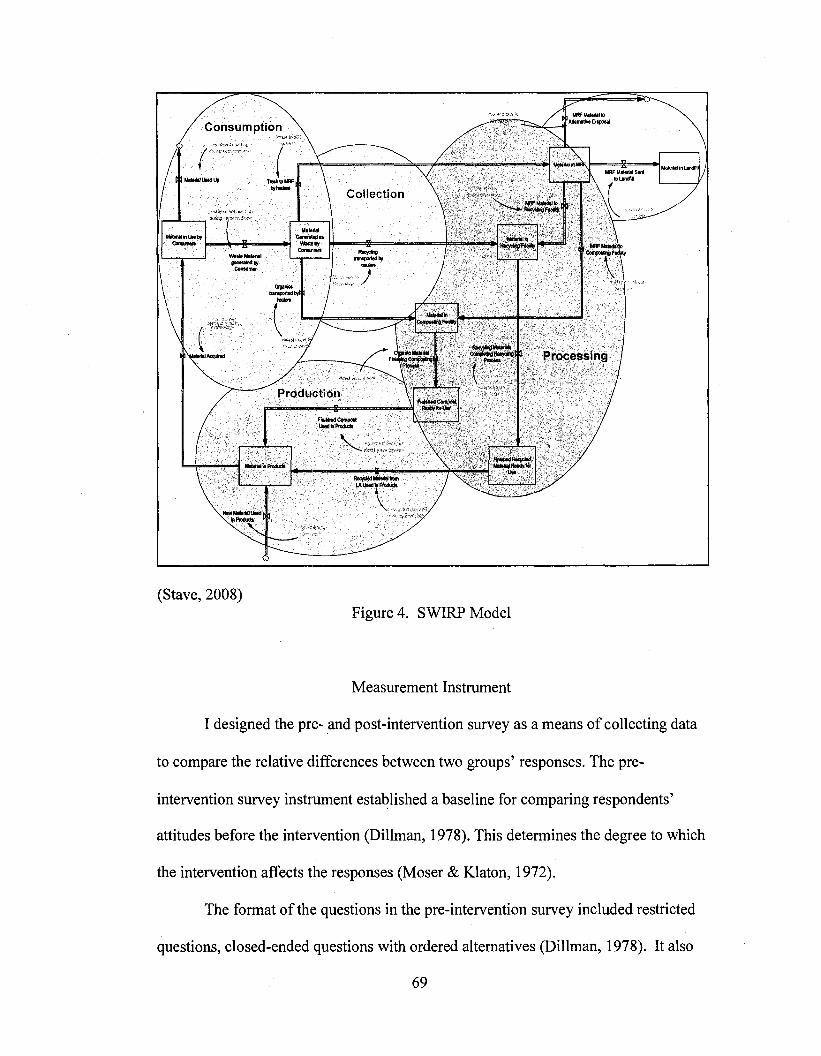
Table 6 lists the second hypothesis and the specific questions that were asked
in an effort to measure tlie differences between groups with respect to this hypothesis.
Table 6. Hypothesis 2 and Related Survey Questions
Hypothesis 2: Participants in group decision making facilitation processes that adhere more closely to the ideal group decision making facilitation process steps will stay more focused on relevant information related to the stated problem, than will participants in groups using standard facilitation methods.
Goal o f Comments & Questions
Comments & Questions Posed Source after which comments & questions were modeled
Goal: Identify which group was more focused on relevant information.
What do you think is the best thing for the City to focus on in order to move towards Zero Waste?(Coded for degree o f influence o f materials presented)
(Gottlieb, 2005; Brilhart, 1968)
Goal: Identify which group was more influenced by what they learned during the process.
I learned something new about Zero Waste management.
(Rouwette, 2003; Huz, 1999; Wilson, 2005)
I changed my ideas about Zero Waste management during this workshop.
(Rouwette, 2003; Huz, 1999; Wilson, 2005)
Questions testing the third and final hypothesis in this study sought to identify
which facilitation method was better at garnering a higher level o f procedural
satisfaction among its members. Procedural satisfaction is a way of referring to a
general level o f satisfaction that participants of a group process feel about the overall
78
interpersonal dynamics, the process structure and the ensuing outcomes of a group
effort Creighton (1980).
My first goal in measuring the relative levels of procedural satisfaction
between groups was to identify how participants felt about the interpersonal dynamics
of their group experience. Participants were asked to respond to statements intended
to identify how they felt about; the level of inclusion, the degree to which they felt
they could share and explain their ideas; the degree to which they felt respected by
other participants and that all participants had an equal opportunity to participate; the
degree to which the group interacted and dealt with disagreement; the degree to
which participants agreed on their recommendations, and the likelihood that they
would attend another SWIRP meeting in the future. Each of these statements sought
to measure how much the participants felt the process sincerely included them and
valued their input.
The second goal in measuring procedural satisfaction among participants was
to measure the degree to which participants felt satisfied with the structure and level
of rigor of the process. If people give up a Saturday to participate in an event like
this, they want their time to be spent productively. The statements included in the
post-intervention survey to measure process structure and rigor sought to identify
how much participants felt that the group worked hard, and worked well together.
They also were intended to measure participants’ feelings about how well the
discussion was structured and if the tools used to facilitate the discussion were
helpful.
79
The third goal in measuring proeedural satisfaetion was to identify whether
there was a differenee between the two groups in the level of eonfidenee they felt for
their final reeommendations. In addition to directly measuring the partieipants’
eonfidenee that their input will help, and their support for the group’s
reeommendations, I also sought to measure if they were enthusiastic about the goal of
reaching zero waste and if they felt that LA valued their input. I also asked questions
to determine how possible they felt it would be to aehieve zero waste. This series of
statements and questions was intended to measure the degree to which participants
felt proud of their accomplishments, and if they felt enthusiastie and optimistic about
the City’s goal of achieving zero waste.
In all three of these areas, the idea was that the higher a group’s response
would be with regard to these issues, the greater their over all level of procedural
satisfaction would be. My hypothesis was that the group faeilitated with the system
dynamies methods would have a higher level of procedural satisfaction then the group
faeilitated with standard means.
Table 7 lists the third hypothesis and the specific questions that were asked in
an effort to measure the differenees between groups with respeet to this hypothesis.
80
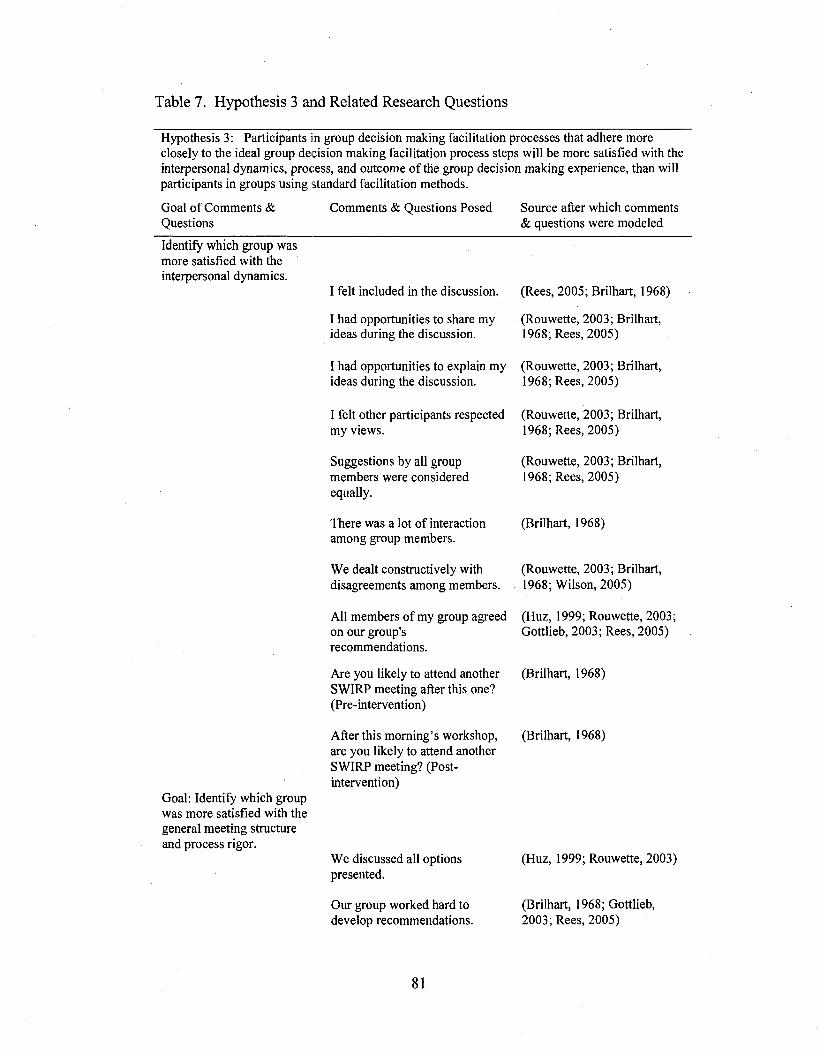
Table 7. Hypothesis 3 and Related Researeh Questions
Hypothesis 3: Participants in group decision making facilitation processes that adhere more closely to the ideal group decision making facilitation process steps will be more satisfied with the interpersonal dynamics, process, and outcome o f the group decision making experience, than will participants in groups using standard facilitation methods.
Goal o f Comments & Questions
Comments & Questions Posed Source after which comments & questions were modeled
Identify which group was more satisfied with the interpersonal dynamics.
I felt included in the discussion. (Rees, 2005; Brilhart, 1968)
I had opportunities to share my ideas during the discussion.
(Rouwette, 2003; Brilhart, 1968; Rees, 2005)
I had opportunities to explain my (Rouwette, 2003; Brilhart,ideas during the discussion. 1968; Rees, 2005)
I felt other participants respected (Rouwette, 2003; Brilhart,my views. 1968; Rees, 2005)
Suggestions by all group members were considered equally.
(Rouwette, 2003; Brilhart, 1968; Rees, 2005)
There was a lot o f interaction among group members.
(Brilhart, 1968)
We dealt constructively with disagreements among members.
(Rouwette, 2003; Brilhart, 1968; Wilson, 2005)
All members o f my group agreed (Huz, 1999; Rouwette, 2003; on our group's Gottlieb, 2003; Rees, 2005)recommendations.
Are you likely to attend another SWIRP meeting after this one? (Pre-intervention)
(Brilhart, 1968)
Goal: Identify which group was more satisfied with the general meeting structure and process rigor.
After this morning’s workshop, are you likely to attend another SWIRP meeting? (Postintervention)
We discussed all options presented.
(Brilhart, 1968)
(Huz, 1999; Rouwette, 2003)
Our group worked hard to develop recommendations.
(Brilhart, 1968; Gottlieb, 2003; Rees, 2005)
81
Hypothesis 3: Participants in group decision making facilitation processes that adhere more closely to the ideal group decision making facilitation process steps will be more satisfied with the interpersonal dynamics, process, and outcome o f the group decision making experience, than will participants in groups using standard facilitation methods.
Goal: Identify which group was more satisfied with the general meeting structure and process rigor. (Continued)
M y group worked well together to develop its recommendations.
(Brilhart, 1968; Gottlieb, 2003; Rees, 2005)
Goal: Identify which group demonstrated a higher level o f support for process/outcome.
The discussion was well structured.
The tools we used in the discussion were helpful.
I feel confident that my group's input will help to achieve Zero Waste in Los Angeles.
I fully support my group's recommendation,
I am enthusiastic about the idea o f working towards Zero Waste in LA.
I analyzed pre-and post-intervention surveys from 197 participants (101 surveys
from the control group and 96 surveys from the experimental group). Only participants
who completed both the pre- and post-intervention questionnaires were included in the
analysis. Data from the questionnaires were entered into spreadsheets and verified to
correct data entry error. Responses to open-ended questions were entered verbatim and
later coded. Special efforts were made to hide the unique participant identification
numbers and sort participant responses prior to coding the responses, so that the coders
would not know whether the respondent was in the control or experimental group.
I used the Statistical Package for Social Sciences (SPSS), version 16.0, to conduct
statistical analyses o f the results after all the results were recorded. The normality
distribution of each variable was tested using the Kolmogorov-Smimoff test, and all
variables proved to be non-normally distributed. The control and experimental groups
were compared for pre-and post-intervention values using the Kruskal-Wallis Test. A
level o f statistical significance of p < 0.05 was used to determine statistical significance. I
developed summary tables based on the results o f the Kruskal-Wallis test, which provide
information for each question regarding the total number o f responses (tt) and the mean
83
scores for both groups. I also included details on the level of significance o f the
difference between the groups’ responses, as well as the chi-square for each question to
provide additional detail on the strength of the significance. Finally, I included a column
to indicate for questions in which a significant difference between groups of;? < 0.05 was
observed, whether or not the results support the research hypothesis.
Demographics and Descriptions
The first step in analyzing the data from this experiment involved a frequency
analysis o f the demographic and descriptive responses of all participants who completed
both pre- and post-intervention questionnaires in both the control and experimental
groups. I conducted the Kolmogorov-Smimov test, which revealed the groups were not
normally distributed. Therefore, I conducted a Kruskal-Wallis Test to determine whether
there was a significant difference between groups in their responses to the demographic
and descriptive questions. This analysis revealed no significant differences between
groups with respect to these demographic and descriptive questions.
Table 8 summarizes the results of this statistical analysis of the demographic and
descriptive responses. I also included frequency tables (Tables 9-19) to demonstrate the
results of each individual question to provide additional background, including the
response scale used for each of these questions.
84
Control Group ExperimentalGroup
Kruskal Wallis Test
Question n Mean N Mean Chi-Square
Asymp. Sig. (p = < .0 5 )
How many SWIRP meetings have you attended before this one?
100 1.76 92 1.62 0.196 0.658
Do you recycle? 101 4.24 96 4.17 0.497 0.481
How many years have you lived in Los Angele?
94 3.52 91 3.56 0.225 0.635
Current Zip code: 94 2.77 95 2.39 2.058 0.151
Sex: 99 1.58 94 1.49 1.439 0.23
Highest level o f education
97 3.52 94 3.48 0.029 0.864
Age: 97 2.64 95 2.74 0.506 0.477
What kind o f housing do you live in?
98 1.43 95 1.38 0.809 0.368
Do you own or rent? 96 1.42 93 1.31 2.228 1.36
How many people live in your household?
98 2.76 94 2.76 0.008 0.93
Annual household income:
90 2.71 89 2.7 0.046 0.83
85
Table 9. Number o f Past SWIRP Meetings Attended Group # o f past SWIRP Frequency Percent
mtgs. Attended
Control Group 0 38 37.6
1 15 14.9
2 18 17.8
3 9 8.9
4 10 9.9
5 3 3
6 6 5.9
7 1 1
Total 100 99
Experimental 0 35 36.5Group 1 20 20.8
2 13 13.5
3 7 7.3
4 8 8.3
5 4 4.2
(3 5 5.2
Total 92 95.8
Table 10. Recycling BehaviorGroup Recycling Behavior Frequency Percent
Control Group Not at all 0 0
A little 4 4
Some 16 15.8
Most 33 32.7
Everything 48 47.5
Total 101 100
Experimental Not at all 1 1Group A little 2 2.1
Some 16 16.7
Most 38 39.6
Everything 39 40.6
Total 96 100
86
Table 11. Years Living in LAGroup Y ears Living in LA Frequency Percent
Control Group 0 6 5.9
Less than 2 years 10 9.9
3 to 5 years 5 5
6 to 15 years 13 12.9
16 to 30 years 28 27.7
Over 30 years 32 31.7
Total 94 93.1
Experimental 0 9 9.4Group Less than 2 years 5 5.2
3 to 5 years 6 6.2
6 to 15 years 16 16.7
16 to 30 years 16 16.7
Over 30 years 39 40.6
Total 91 94.8
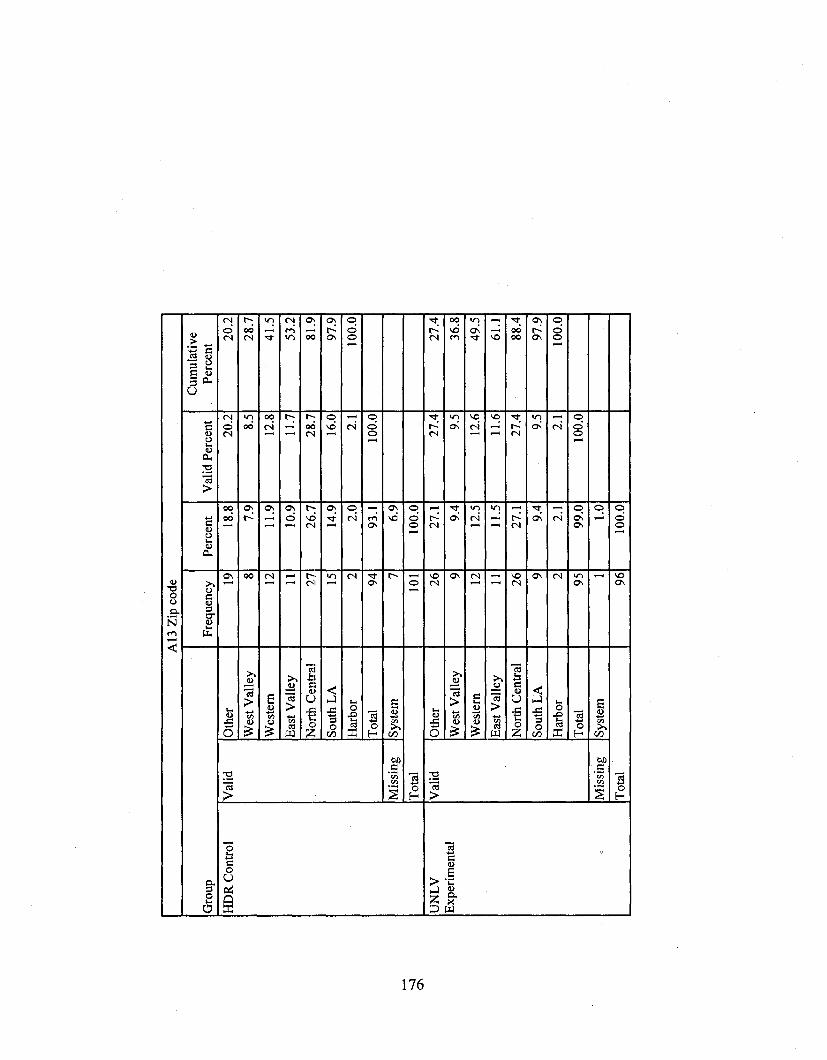
Table 12. Zip Code/Regional “WasteshedGroup Zip Code Frequency Percent
Control Group Other 19 18.8
West Valley 8 7.9
Western 12 11.9
East Valley 11 10.9
North Central 27 26.7
South LA 15 14.9
Harbor 2 2
Total 94 93.1
Experimental Other 26 27.1Group West Valley 9 9.4
Western 12 12.5
East Valley 11 11.5
North Central 26 27.1
South LA 9 9.4
Harbor 2 2.1
Total 95 99
87
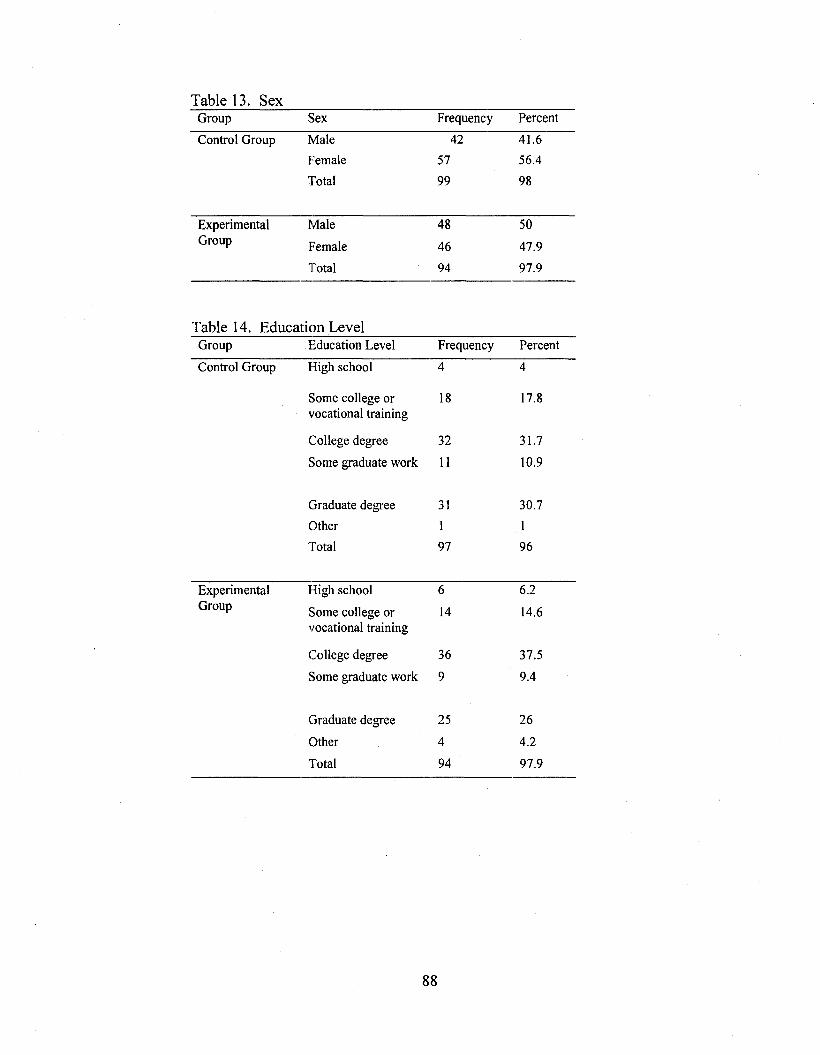
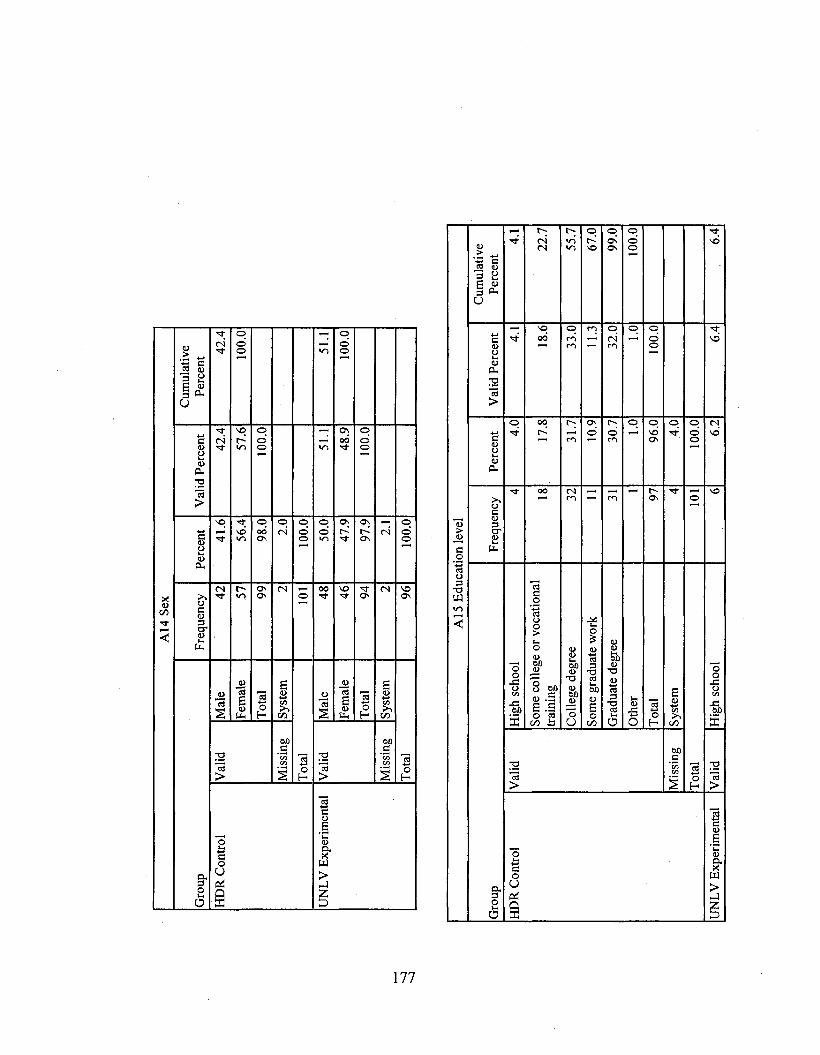
Table 13. SexGroup Sex Frequency Percent
Control Group Male 42 41.6
Female 57 56.4Total 99 98
Experimental Male 48 50Group Female 46 47.9
Total 94 97.9
Table 14. Education LevelGroup Education Level Frequency Percent
Control Group High school 4 4
Some college or 18 17.8vocational training
College degree 32 31.7
Some graduate work 11 10.9
Graduate degree 31 30.7
Other 1 1
Total 97 96
Experimental High school 6 6.2Group Some college or 14 14.6
vocational training
College degree 36 37.5
Some graduate work 9 9.4
Graduate degree 25 26
Other 4 4.2
Total 94 97.9
88
Table 15. AgeGroup Age Frequency Percent
Control Group 18-25 11 10.9
26-45 30 29.7
45-65 39 38.6
Over 65 17 16.8
Total 97 96
Experimental 18-25 8 8.3Group 26-45 29 30.2
45-65 38 39.6
Over 65 20 20.8
Total 95 99
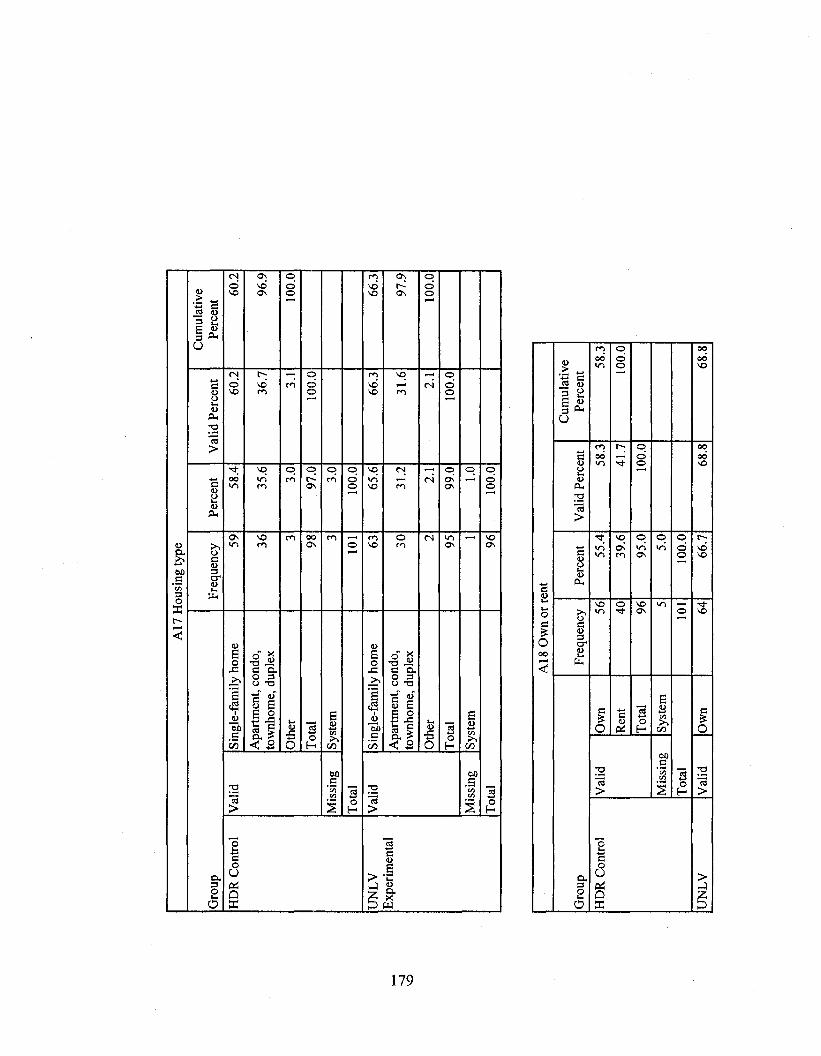
Table 16. Housing TypeGroup Housing Type Frequency Percent
Control Group Single-family home 59 58.4
Apartment, condo. 36 35.6townhome, duplex
Other 3 3
Total 98 97
Experimental Single-family home 63 65.6Group
Apartment, condo. 30 31.2townhome, duplex
Other 2 2.1
Total 95 99
Table 17. Own or RentGroup Own or Rent Frequency Percent
Control Group Own 56 55.4
Rent 40 39.6
Total 96 95
Experimental Own 64 66.7Group Rent 29 30.2
Total 93 96.9
89
Table 18. Number in HouseholdGroup Number in
householdFrequency Percent
Control Group 1 18 17.8
2 37 36.6
3 15 14.9
4 16 15.8
5 7 6.9
6 3 3
8 2 2
Total 98 97
Experimental 1 18 18.8Group 2 37 38.5
3 11 11.5
4 14 14.6
5 9 9.46 4 4.29 1 1
Total 94 97.9
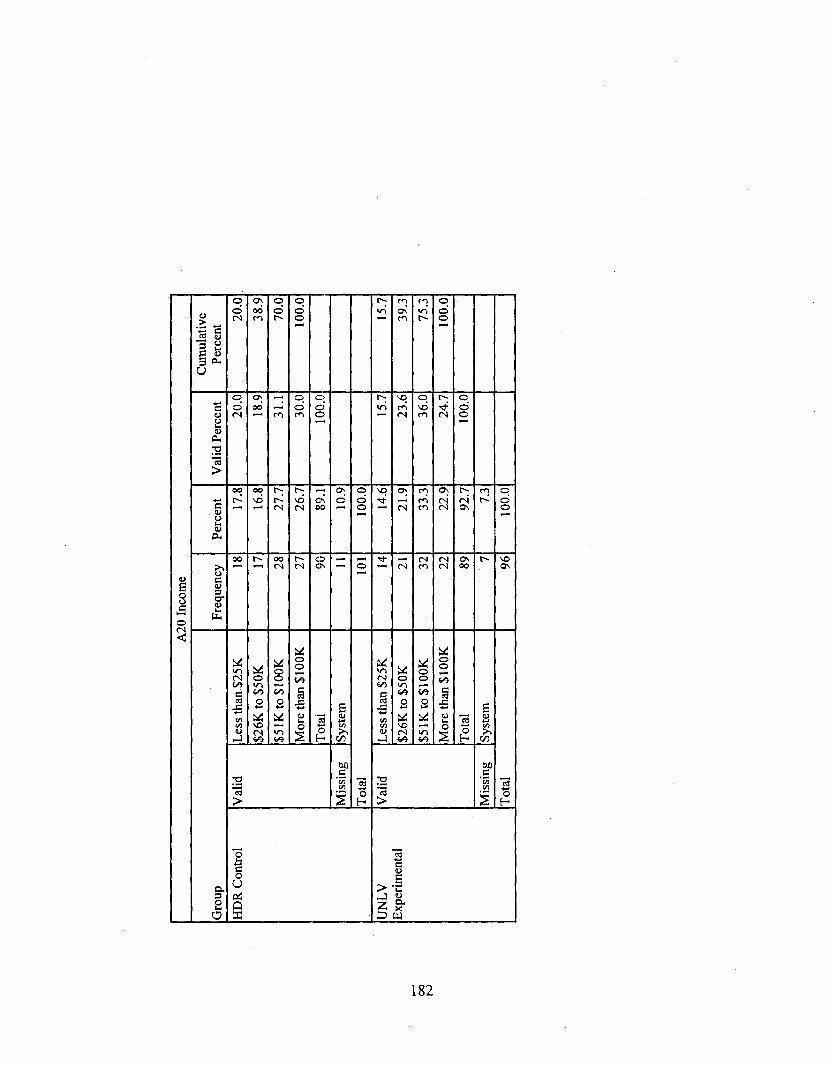
Table 19. IncomeGroup Income Frequency Percent
Control Group Less than $25K 18 17.8
$26K to $50K 17 16.8
$51K to$100K 28 27.7
More than $100K 27 26.7
Total 90 89.1
Experimental Less than $25K 14 14.6Group $26K to $50K 21 21.9
$51K to$100K 32 33.3
More than SlOOK 22 22.9
Total 89 92.7
90
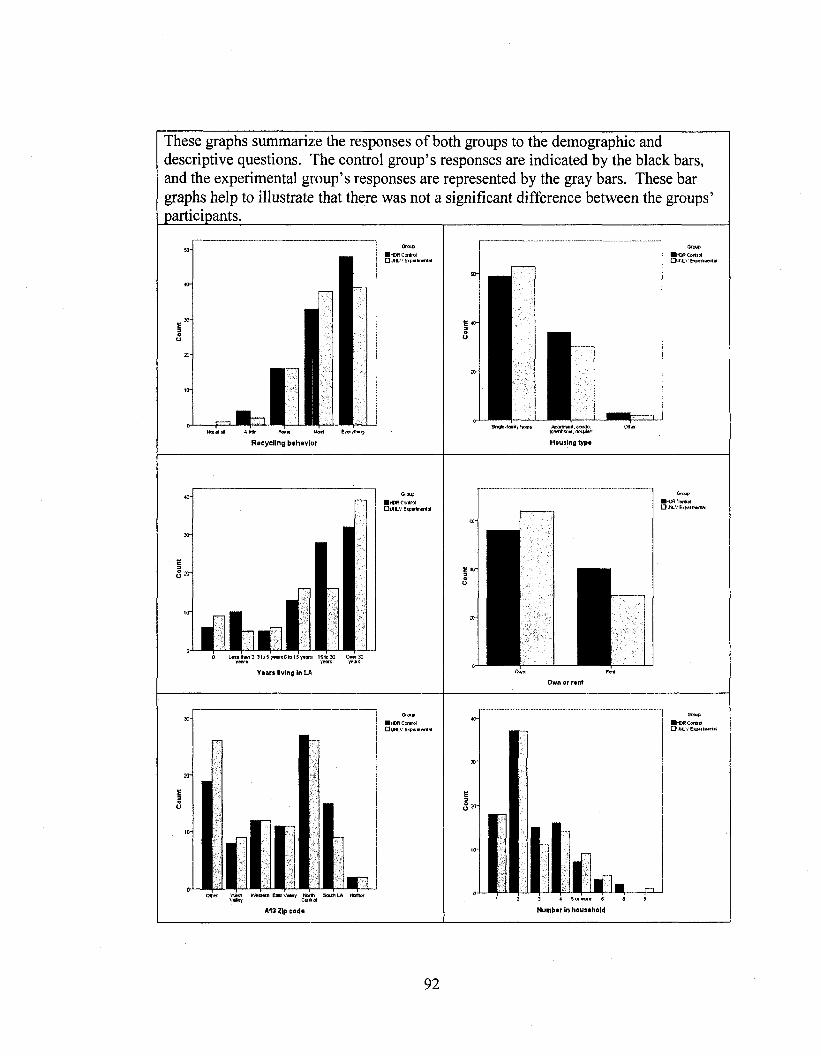
The following figure (Figure 5) is an analysis of the frequency data for the
responses to the demographic and descriptive questions in bar chart format. This analysis
shows that the groups were very similar in these demographic and descriptive
characteristics. It also helps to provide a general description of the participants of this
experiment. For instance, most of participants of both groups had not attended a SWIRP
meeting before. Most participants in both groups recycle most or all of what they can,
and most have lived in LA for over 16 years. There was a balance of women and men
participating and most participants were over the age o f 26. More participants owned than
rented, and more had less than two people in their household. The annual income was
fairly evenly distributed among each o f the income categories from which they could
choose on the survey. Figure 5 illustrates demographic and descriptive responses of this
study. In each o f these graphs below, the black bars indicates the responses of the control
group and the grey bars indicate the responses of the experimental group. The
demographic question subject is listed below each of the graphs. These graphs help to
illustrate that there is not a significant difference in the makeup of the participants of the
two groups in any of the demographic or descriptive areas. This means that it is
reasonable to compare the differences in the groups’ responses as a measure of the affect
of the intervention rather than such changes being due to differences in the pool of
participants in both groups.
91
These graphs summarize the responses of both groups to the demographic and descriptive questions. The control group’s responses are indicated by the black bars, and the experimental group’s responses are represented by the gray bars. These bar graphs help to illustrate that there was not a significant difference between the groups’ participants.__________________________
I
R e c y c l in g b e h a v io r
Cortrol UutV EopsiknMal
E «-
■hCRCortiol □ U | . \ ’ E « p e r k n e r ta (
H o u sin g ty p e
I
Y e a rs liv ing In LA
■hoR Cnnrol □i*iv
A13 Zip c e d e
92
□iM -V E»p«rtn«ital■K )R Conrol O l.f tV 6>v«'*n«ntal
La»*man|2Sl< »261UO*50K »5ll<.l0l1CO'. h»r« tlian »1 OCh
5=0*
E d u c a tio n lovo l
■hCRCortrd □LM-V E<pw*iwrt.«
Figure 5. Demographic and Descriptive Responses
Questions Related to Research Hypotheses
I prepared a table for the set o f questions associated with each of the three
hypotheses that summarized the question, the total number o f responses and the mean for
both groups, along with the chi-square and statistical significance determination for each
question. I included a column on the summary tables when a significant difference {p <
0.05) was identified between the groups’ responses to indicate whether or not the
difference supported the research hypothesis.
93
Summary o f Results Related to Hypothesis 1
The first hypothesis of this study states: Participants in group decision making
facilitation processes that adhere more closely to the ideal group decision making
facilitation process steps will identify more effective solutions to resolve the stated
problem, than will participants in groups using standard facilitation methods. The
following question was asked before and after the intervention, “What do you think is the
best thing for the City to focus on in order to move towards Zero Waste?” The first step
in analyzing the responses to these questions was to review each participant’s pre- and
post post-intervention responses to determine if their suggestions changed from before to
after the intervention. If the participant listed the exact same suggestions in their pre- and
post-intervention response, I would not be able to determine if the post-intervention
responses was affected by the intervention. I eliminated these participants from the
analysis o f the responses to this question in order to prevent ambiguity in my results. In
total, responses from 35 participants (16 from the control group and 18 from the
experimental group) were eliminated for this reason. These 35 participants were also
excluded from the analysis of the remaining questions so that consistency was maintained
throughout this analysis and to enable me to be able to directly compare the results of
different questions.
The next step in the process involved coding the responses from the remaining
162 participants; 82 in the control group and 80 in the experimental group. The responses
were coded to determine the “systemic value” of comments. The process used to code
these responses is described below. The term “systemic value” refers to the level of
potential effectiveness o f a given leverage point or solution identified by participants
94
relative to the other leverage points. For instance, increasing the capacity to process
diverted materials will do more to reduce the amount of waste sent to the landfills than
increasing consumer diversion rate. The relative effectiveness o f the eight leverage points
was determined by solid waste management experts from the City o f Los Angeles and the
HDR consulting firm. The system dynamics model developed to simulate the LA waste
management system for this experiment was used to further validate the effectiveness
ranking for each of the eight leverage point.
The pre- and post-intervention suggestions the participants listed for the best
things LA should focus on to achieve zero waste was coded for systemic value using the
ranking listed in Table 20. To help minimize coding bias, I worked with another
researcher to code these responses. This provided a “check-and-balance” in the coding of
responses to ensure that the analysis of the responses was objective and consistent. We
used the scale listed in Table 20 to code the participants’ responses. This scale ranks the
leverage points identified at the workshop based on their relative level o f systemic value
in terms of their relative potential effectiveness of achieving “zero waste.” The
determination o f ranking for each leverage point was determined by “running” each
leverage point through the system dynamics simulation model designed for this SWIRP
process. Since the model was developed in eonsultation with the solid waste
management experts from the City o f LA and its consulting firm, the model was tested to
ensure that it accurately represent LA solid waste system. Each of the eight leverage
points was “run” through the model to determine the degree to which it affected the four
evaluation criteria: amount of waste sent to the landfill, the relative cost, the relative
greenhouse gas emissions, and the relative level of effort to implement. The resulting
95
ranking of these leverage points is listed in Table 20, and was used in the coding of the
systemic value of participant responses.
Table 20. Systemic Value Coding Key
Rating Scale: 0-10
Leverage Points
0 No response, no reference to leverage point or systemic comment
1
2
Non-specific or general mention o f leverage point or systemic comment
3 Reference to:
Increase o f consumer diversion rate
4 Reference to:
Reduced waste in products and packaging
5 Reference to:
Increase recycled content o f products and packaging
Increase recyclability o f products and packaging
Increase capacity for alternative technologies
6 Medium level o f specificity or frequency o f reference to leverage points or systemic comments
7 Reference to:
Increase processing capacity for diverted materials
8 High level o f specificity or frequency o f reference to leverage points or systemic comments
9 Reference to:
Increase useful lifetime o f consumer products
Reduce consumption
10 Very high level o f specificity or frequency o f reference to leverage points or systemic comments
We coded these responses on a scale from “0” to “ 10.” If no reference of systemic
comment or leverage point was made, the response was coded a 0. If two or more high
96
leverage points, sophisticated or well articulated systemic comments were included, the
response was scored a “ 10.” If a leverage point was specifically listed, it received the
ranking corresponding to the leverage point. If the leverage point was not specifically
listed, but is adequately articulated in other words, it received the ranking for the
corresponding leverage point. The degree or frequency of reference to leverage points or
systemic comments affected the ranking. As for degree, if the reference was weak or
strong, the coding would reflect a slightly higher or lower degree o f ranking.
As for frequency, if more than one leverage point was mentioned, the response for
the highest value leverage point was identified, and an additional point was added for
each additional leverage point mentioned. If a leverage point was not specifically listed
and not adequately articulated, but there was some indication o f awareness o f leverage
points or systemic value, the response was ranked a “1” or “2.” If no reference to
leverage point or systemic concept was mentioned, the response was ranked a “0.”
The following are few examples of actual suggestions offered by participants of
this experiment as to what the best things LA could do to achieve zero waste, as coded
for systemic value. The coding score is in parenthesis to demonstrate the range of
rankings. The coding values ranged from 0 to 10, with 10 as the highest in parenthesis.
• Reduce amount of packaging, increase diversion rates, increase capacity for
The results o f the analysis of the final questions in this section did not reveal a
significant difference between groups: “I believe the City o f Los Angeles values my
input” ip = 0.144), “How possible do you think it is to achieve Zero Waste?” (pre
intervention,/? = 0.412; post-intervention,/? = 0.361), and “How possible do you think it
is to achieve Zero Waste by 2030?” (pre-intervention,/? = 0.909; post-intervention,/? =
0.487). Since no significance was demonstrated in the pre- and post-intervention
responses to these questions, I could not reject the null hypothesis.
110
CHAPTER 5
DISCUSSION
General Summary and Implieations o f Results
The overarehing question of this study was how to improve group deeision
making faeilitation methods to better help participants to select the most effective
deeision outeome to solve a given problem. Beeause standard facilitation processes do
not suffieiently adhere to elassieal deeision making proeedures, they enable and at times
reinforce behavioral deeision making tendencies which limit the scope of decision
analysis and inhibit the partieipants’ abilities to identify the most effeetive solutions. This
study showed that a non-standard group deeision making faeilitation proeess that adhered
more elosely to the ideal elassieal decision making methodologies; yielded the
identifieation o f more effeetive solutions.
I hypothesized that the facilitation method that adhered more elosely to the
elassieal methodology system dynamies would yield a higher degree of effeetiveness,
foeus, and proeedural satisfaction than the standard facilitation methods which do not
adhere elosely to the elassieal decision making methodologies. The results o f my
experiment supported the first two hypotheses that the system dynamics method would
yield a higher degree o f effectiveness and focus; the results did not support the final
hypothesis that system dynamics would yield a higher degree of procedural satisfaction.
I l l
The overarching research question of this study was to ask how could stakeholder
involvement facilitation methods be improved to facilitate better, more effective
outeomes? I believe the results of this analysis demonstrate that a facilitation process that
adhered more closely to more thorough and rigorous methods was able to help its
participants identify more optimal outcomes.
Specific details on the results related to each o f the three research hypotheses of
this study are provided in the following seetion. While there were some surprise findings
related to participants proeedural satisfaetion and level of self confidence, the findings of
this experiment support the general hypothesis that facilitation method, that follows more
closely to the classical, rational decision making steps, like system dynamics, will do
more to help participants identify solutions that are more effective in solving a give
problem once implemented, than will standard facilitation methods.
Discussion of Results Related to Hypothesis 1
The goal of the first two questions asked in relation to the first hypothesis was to
determine whieh group was better able to identify the more effective solutions for solving
the solid waste problem in LA. Both groups were given the same background materials
for their deliberations. Participants were asked both before and after the work session to
identify the best things LA could do to achieve zero waste. The results showed that while
there was no significant difference between groups in their pre-intervention responses {p
= 0.567), there was a significant difference in the post-intervention responses {p - 0.028).
This means that in the post-intervention responses, the experimental group’s mean score
was higher than the control group, which shows that the experimental group participants
112
were better able to identify more of the more effective leverage points than were the
control group members after the intervention. These combined pre- and post-intervention
results help to strengthen the reliability that the post-intervention difference is attributable
to the intervention rather than chance.
While these results are based on a coding of subjective comments, I made special
efforts to ensure that the coding procedures were consistent, objective, and unbiased. The
responses were consistently coded based on an objective ranking o f the relative level of
effeetiveness of the eight leverage points under analysis that was developed based on
information from the City and HDR solid waste management experts. I also made special
efforts to reduce coding bias by hiding the participant’s identification information and
randomly sorting the responses so that I could not determine if the responses came from
the control or experimental group.
Beeause o f the design and coding methods I used to determine whieh group was
better able to identify the more effective solutions, I am confident in the unbiased nature
of this analysis. While there may have been other ways in whieh to word the questions or
measure partieipants ability to identify the relative effeetiveness of alternative solutions, I
believe that the method I used in this analysis was sufficient to accurately capture
genuine responses from both groups for the sake of group comparison. These results
show that a faeilitation method that adheres more elosely to the ideal group decision
making facilitation steps was indeed better able to help its participants to identify more
effective solutions.
In addition to the first two questions asked to test this hypothesis, I asked three
supplemental questions to measure which group’s participants felt more confident in their
113
abilities to select more effective solutions. Since I thought the group facilitated with the
system dynamies processes would be better able to identify the best solutions, I also
assumed that they would have a higher degree of self confidence in their abilities and
knowledge. However, the control group demonstrated a higher level of confidence in
their knowledge of the issue although they demonstrated a lower level o f understanding
of whieh solutions will be more effeetive in achieving zero waste.
This inversion of self confidence and ability could be related to the idea that the
when one learns new things, it often challenges their previous understanding of how
things work and causes them to doubt themselves. The lower level of confidence in the
experimental group could also mean that the participants do not recognize that they have
improved their understanding. Research by Ajzen (1991) shows that people are often
unaware that they have learned something and they are also frequently are unable to
identify the provenance o f the new knowledge. Since this experiment involved a
computer model with which participants did not have time to become fully familiar, this
lack of familiarity eould have caused participants to have less trust in the output of the
model. And even though on some level the partieipants absorbed the model output
enough to identify better solutions, it is possible that there was not enough time for the
information to truly sink in and transcend from information to a genuine understanding.
I was surprised to find that the results of the three questions related to confidence
in abilities and knowledge showed that the control group had a higher mean seore than
the experimental group, meaning that the control group felt more confident than the
experimental group did in these areas. The level o f signifieanee o f the differences in
responses between groups to these questions is as follows: “We are helping the City of
114
Los Angeles discover the best options for achieving Zero Waste” (p = 0.017); “I feel
confident that my group's suggestions represent the best approach to Zero Waste
planning” {p = 0.001); and “After this morning’s workshop, how much do you know
about the solid waste issue in LA” {p = 0.012). The control group’s mean score was
higher than the experimental group in each of these areas.
When analyzing the results of all questions related to Hypothesis 1, the results
show that system dynamics-based facilitation methods were better at helping participants
identify the more effective solutions, but the standard facilitation methods were better at
helping the participants feel confident about their abilities. The lesson to be learned from
these data are two fold: (1) Just because the system dynamics-based facilitation process
helps participants identify more effective solutions does not automatically mean that they
are confident in their findings, and (2) Just because the standard facilitation process helps
participants feel self confident in their findings does not mean that they have identified
more effective solutions.
One potential explanation for these results is that the control group’s higher level
of procedural satisfaction could have created a positive image o f the process and a false
sense of confidence in the outcome. Conversely, the experimental group’s lower level of
procedural satisfaction could be artificially reducing their self confidence in the outcome.
Given the available data, I cannot determine with certainty the cause of this inverse
relationship between ability and confidence. If I were to conduct this analysis again, I
would design additional questions to more specifically address this issue.
Figure 6 illustrates the findings related to the analysis o f the questions designed to
test the first hypothesis. As you will see, the graphs in 6.1 show that the experimental
115
group had a higher mean seore than the control group, which indicates that the control
group was better able to identify more effective solutions than the control group. The
graphs in 6.2 through 6.4, show that the control group had a higher level o f confidence in
their ability to identify the best options, the best approach, and that felt they knew more
about the solid waste issue than did the experimental group. These graphs help to
illustrate the inversion in actual ability and self confidence between groups.
6.1 The experimental group had a significantly higher mean score {p = 0.028) than the control group in the coding o f the systemic value o f participants post-intervention suggestions for the best things LA should do to achieve zero waste.
Control Group Mean: 3.49
A7/B3 P o attea t Syatamic Valua
Gr<H*;HDRCwitr«l
M ean *3.49 Std.O «v. -2.764
N -7 9
A7/B3 P o ttta it Syttamle Valut
Experimental Group Mean: 4.7
A7/B3 Poattea t S yatem ic Valua
Gtmw UULV EqiHtnMital
A7/B3 P e m a irS y ita in k Valut
Mean -4.7 Std. Oav. >3.436
N -80
116
6.2 The control group had a significantly higher mean score than the experimental group {p = 0.017) relating to their confidence that they had identified the best options for LA to implement to achieve zero wastes.
Control Group Mean: 4.2
B26 B est op tions idantified
GrouiuHORCanirol
M ean- 4 2 S td. D av .-0.833
N -8 0
B t » t o p tle n i idan ttflad
Experimental Group Mean: 3.92
B26 B e s t o p tions Identified
Cf Mi|K IM.V
Mean "3 3 2 Std. D av.-0.84
N -74
B2S B a s t «pTlont Idan tlflad
6.3 The control group had a significantly higher mean score than the experimental group {p = 0.001) relating their confidence that they had identified the best approach for LA to take when striving for zero waste.
Control Group Mean: 3.79
B7 B eat app roach
Crew HDA Cenlrel
Mean -3.79 Std. Dev. -0.807
N -8 0
Experimental Group Mean: 3.39
B 7 B e a t app roach
Group: UNLV taperkiMMal
M ean-3.39 Std. D ay .-0.863
N -7 5
B7 B ast approach
117
6.4 The control group had a significantly higher mean score than the experimental group (p = 0.012) relating to their confidence in their knowledge of the solid waste management challenges after the work session.
Control Group Mean: 3.88 Experimental Group Mean: 3.55
B2 Po«t*K now a b o u t so lid w a s ts
B2 Post-Know about solid wasto
B2 P o st-K n o w a b o u t so lid w a s ts
rB2 Post-Know about solid w asts
M oan * 3 5 6 S td . D sv .* 0 5 3 2
N *78
Figure 6. Findings of Significant Difference Associated with Hypothesis 1
Discussion of Results Related to Hypothesis 2
The goal o f the questions designed to test the second hypothesis was to identify
which group was more focused on relevant information. The idea behind this hypothesis
is that the facilitation method which is more aligned with the ideal classical decision
making practices should be better able to keep its participants focused on the relevant
information presented so that they would be better able to make more fully informed
decisions. I found it was relatively easy to code the post-intervention responses to the
question asking participants to list the best things LA should do to achieve zero waste.
Responses that exactly matched the presented materials, meaning they quoted or used the
same words and/or phrases as the presented materials, or responses that demonstrated a
clear understanding of the content o f those materials were coded higher than those that
118
did not. The results of the coding for level of reference to presented materials showed that
there was a significant difference between groups ip = 0.005) and that the experimental
group scored higher than the control group in making more references to the materials.
Again, because I consistently coded these responses after hiding the identifying
information and sorting them so that I could not tell which group the participant came
from, I was able to reduce coding bias. As a result, I am confident that these results
indicate the true difference in the amount of focus both facilitation methods placed on the
presented materials.
Two additional questions were asked in relationship to this hypothesis in an
attempt to identify which group was more influenced by what they learned during the
process. I asked a question to identify whether participants felt they had learned
something new and had changed their views about the issue, but in both cases no
significant difference was observed between the two groups’ responses.
While I was unable to determine if one group learned more or changed its views
more than the other group, I was able to determine that the group facilitated with the
system dynamics method was more focused on the presented materials than the group
facilitated with standard methods. These results are important because the more a group
of lay stakeholders are focused on relevant information, the less likely they will be to go
off on tangents that will distract participants’ attention away from the core issues. By
focusing on the relevant information, it is also more likely that the participants will be
able to improve their general level o f understanding of the issues, be better able to
improve incomplete or incorrect mental models. By keeping a group o f diverse
participants focused on a common set o f relevant facts, it also helps the facilitator to be
119
able to productively address and resolve any eonfliets that may exist among participants.
Finally, the more foeused participants are on relevant information on the causes and
effects of the problem, the better they will be at making more fully-informed decisions on
the best solutions to the problem.
Figure 7 illustrates the findings related to the results of the coding of responses to
determine the level o f focus on the presented materials. The graphs shown in this figure
show that the experimental group was significantly more focused on the presented
materials than was the control group. As you can see in these graphics, the experimental
group had higher mean seore, as illustrated with the higher level o f bars on the right side
of the graphs, than the control group. This means that the experimental group
participants’ suggestions for the best things that LA should do to achieve zero waste were
more reflective o f the presented materials than the suggestions offered by the control
group.
7.1 The experimental group had a significantly higher mean score {p = 0.005) than the control group on the coding for the influence o f the presented materials on participants’ suggestions for the best things LA could do to achieve zero waste. Influenced by Materials (Post-intervention Only) Control Group
Control Group Mean: 3.04
A7fB3 In fluenced b y M atériels
DrouesHDRCmaiol
A7/B3 Influenced by Meterlele
M ean «3.04 S td. Dev. «2.883
N -B 1
Experimental Group Mean: 4.51
A7/B3 In fluenced b y M aterials
UtouiR IHLV Eiqief «neilt»!
N
M ean «4.51 » d . D ev. " 3 2 9 6
N "8 0
A71B3 Influenced by Materials
Figure 7. Findings of Significant Difference Associated with Hypothesis 2
120
Discussion of Results Related to Hypothesis 3
The analysis o f responses to questions designed to measure the level of procedural
satisfaction o f participants in both groups showed that the group facilitated with standard
methods had a higher level o f procedural satisfaction that is, they were more satisfied
with the overall experience, than did the participants of the group facilitated with the
system dynamics method. This result does not support the third hypothesis of the research
study, which proposed that the system dynamics-based facilitation method would yield a
higher degree of procedural satisfaction.
The questions designed to test procedural satisfaction were divided into three
areas. The first measured satisfaction with interpersonal dynamics, the second set of
questions measured satisfaction with process, and the final set measured the level of
support for the outcome and the zero waste initiative. In each of these areas a significant
difference was observed, and in each case o f significance the control group had a higher
mean score than the experimental group. The specific levels of significance are listed on
the following bar charts.
I was surprised to find that the experimental group did not have a significantly
higher mean score than the control group in response to any of the questions designed to
measure procedural satisfaction. Since I measured procedural satisfaction in three
different ways, through a number o f different questions, and the results consistently
showed that the control groups mean score was significantly higher than the experimental
groups, I am confident that this finding accurately measured the procedural satisfaction of
participants o f this experiment.
121
In my experience, standard and system dynamies-based facilitation processes
prior to this study, I have observed that the use of the simulation model does more to
draw participants into the substance of the decision analysis than I have seen in standard
practices. Therefore, I hypothesized that system dynamies-based facilitation would yield
a higher degree o f procedural satisfaction than would standard methods. However, this
assumption was based on my observation of the system dynamies-based facilitation that
involves a group model-building exercise in which participants help to determine the
assumptions upon which the model is built and the help to test and validate the accuracy
of the model prior to using the model to test alternative solutions. In the experiment
conducted for this study, there was not enough time during the conference to involve the
participants in a group model building exercise. In addition, there also was not enough
time allotted during this work session to provide a thorough introduction and orientation
to participants. Participants did not have sufficient time to understand and trust the
assumptions of the model, nor did they have time to become proficient with running the
model. The time constraints, coupled with the necessity to focus on the computer model
inhibited participants’ ability to interact with one another. While the computer model
provides a neutral platform that can help prevent interpersonal conflicts, in this case, the
participants were so foeused on the model they did not have enough time to interact with
each other and discuss the output with other participants. This model-eentrie focus may
have negatively affected the experimental groups’ procedural satisfaction with the
interpersonal dynamics o f their experience. The use of the computer model could have
also made some participants who were not computer savvy to feel intimidated and
uncomfortable with the experience.
122
Among the anecdotal feedback from participants o f the experimental group which
may shed some light on their lower level of procedural satisfaction is that some wished
that the model had been explained better, that there was not enough information about
how the figures were calculated, and that they didn’t have enough time to get comfortable
with the model. Many of these challenges were a byproduct of insufficient time. In each
of these eases, such comments illustrate they may have felt less satisfied with their
experience.
The relative difference between the control and experimental group eOuld be
interpreted to mean that the control group was better at promoting procedural satisfaction,
or that the experimental groups’ dynamics due to time constraints inhibited the promotion
of procedural satisfaction. In either ease, the results show that the group facilitated with
standard methods yielded significantly higher level of procedural satisfaction than did the
group facilitated with system dynamics methods. In addition to increasing the amount of
time participants have to work with a fully developed model, another thing that may have
helped improve the procedural satisfaction level of experimental group is if I had had
sufficient time to involve participants in a group model-building exercise. Such group
model building exercises are more common in system dynamics-based facilitation, but
with just 90 minutes in which to conduct the experiment, I could not involve participants
in building a model. If I had had time to conduct a group model building exercise I
suspect that the procedural level would have been higher than the experimental groups’
levels measured in this study. In my experience in observing group model building
exercises, the interactive and shared learning experience builds camaraderie and
123
confidence among participants, which can lead to a higher sense o f satisfaction with the
process.
As a result of limitations associated with the time constraints, I am less confident
in my ability to correctly interpret these procedural satisfaction-related findings than I am
of my interpretation of the other findings of this study. However, these results should not
be ignored. If it is true that the system dynamies-based facilitation method yields better
results but less satisfied participants, it may be difficult to implement the solutions.
Likewise, if the standard facilitation method yields happy participants but less effective
solutions the usefulness o f the implementation of these solutions could be limited. I think
it is fair to say that the ultimate goal of involving stakeholders in such decision making
efforts is to promote the development of effective solutions through a process the
participants are satisfied with and will support. These results demonstrate that the
coupling of effective outcomes and procedural satisfaction should not be taken for
granted. It also identifies an area that requires further analysis.
Figure 8 illustrates the findings related to the analysis of the questions designed to
test the third hypothesis. The graphs in Figure 8 help to illustrate the differences in the
mean scores between groups. In each o f the pairs of graphs listed in this figure, the
control group had a significantly higher mean seore than the experimental group. For
instance the graphs in 8.1 show that there were more participants in the control group
who scored a 5, or the highest possible level, than did participants in the experimental
group. In summary, these nine pairs o f graphs illustrate that the control group
participants were more satisfied with their experience than were participants of the
experimental group.
124
8.1 The control group had a significantly higher mean score than the experimental groupip = 0.022) relating to their satisfaction with their ability to share their ideas during thesession.
Control Group Mean: 4.39
B21 S h v a d idaaa
Std. 0 « If.-0 .733
B21 Shared ideas
Experimental Group Mean: 4.16
B21 S h v e d Ideas
II
B21 Shared Ideas
M «an-d.16 Std. Dev. -0.769
N -74
8.2 The control group had a significantly higher mean score than the experimental group ip = 0.022) relating to their satisfaction with their ability to explain their ideas during the work session.
Control Group Mean: 4.33
B22 E xplained ideas
Mean -4.33 S td. D ev .-0.771
N -6 2
Experimental Group Mean: 4.1
B22 E xplained Ideas
J__
Mean -4.1 Std. D ev.-0.748
N -73
125
8.3 The control group had a significantly higher mean score than the experimental groupip = 0.022) relating to their satisfaction with others respecting their views during thesession.
Control Group Mean: 4.34
C r«v: HM Conlral
Mean *4.34 Std. Dev. -0.674
N -8 0
Experimental Group Mean: 4.03
B24 R eapec t
_ iaa.V E^hm *nW
I /A\
/J-,-« . A ---V
V
Mean -4.03 Std. D ev.-0.765
N -71
8.4 The control group had a significantly higher mean score than the experimental group ip = 0.006) relating to their satisfaction with the interactive nature of the session.
Control Group Mean: 4.26
B17 Interactive
e iM f lN D R C w e * * !
Mean «4.26 Std. Dev. «0.766
N -81
B17 In terac tiv e
Experimental Group Mean: 3.91
B17 Interactive
CrMipsniLV beMrtnteMil
Mean «3.91 Std. Dev. «1.068
N -75
B17 In terac tive
126
8.5 The control group had a significantly higher mean score than the experimental group(p = 0.0) relating to their satisfaction that all options for achieving zero waste werediscussed during the work session.
Control Group Mean: 3.74
B12 D Itcu esed all option»
812 D ite u io d all opdent
M»an *3.74 Std. Dev. *0.981
N-B1
Experimental Group Mean: 3.13
8 1 2 D iecusB ed all op tions
Cta^UHUV EwwiliMeiil;
Mean *3.13 Std. Dev. *1.147
N*76
812 DUeueeed all option»
8.6 The control group had a significantly higher mean score than the experimental group (p = 0.014) in their satisfaction that their group worked hard during the work session.
Control Group Mean: 4.05
B13 W orked hard
&MeK HDHCfWol
.0-
«-
/\
//k 5 -
V813 W orked hard
M ean *4.05 S td. Dev. *0.757
N -8 1
Experimental Group Mean: 3.66
B13 W orked h a rd
M ean *3.68 S td. D ev. *1.024
N *74
II
127
8.7 The control group had a significantly higher mean score than the experimental group{p = 0.001) relating to their satisfaction that the discussion was well structured during thework session.
Control Group Mean: 3.79
B14 Well structured
M ean-3.79 Std. Dev. -0.926
N -8 2
Experimental Group Mean: 3.18
B14 Well s truc tu red
(Si UM.V E|VW<>n«e<l
0
M ean-3.10 Std. D ev.-1.151
N -74
8 1 4 Well s tru c tu re d
8.8 The control group had a significantly higher mean score than the experimental group {p = 0.003) relating to their satisfaction that their input will help LA in its planning efforts to achieve zero waste.
Control Group Mean: 3.94
0 8 Input will help
8 8 Inpu t win he lp
Mean -3.94 Std. D ev .-0.891
N -8 0
Experimental Group Mean: 3.58
BB Input will help
Ofcup; wa.vBi|iwim>iii«i
Mean -3.58 S td. D ev .-0.868
N -7 6
128
8.9 The control group had a significantly higher mean score than the experimental group ip = 0.018) relating to their level of support for their group’s recommendations.
Control Group Mean: 3.95
G(O(^HDftC0Mr«l
J r
M«an "3.95 Std. D av ."0S 96
N -7 8
Experimental Group Mean: 3.64
69 Suppon
M«an -3.64 SM. Dev. "0.872
N "73
Figure 8. Findings of significance related to Hypothesis 3
Strengths and Limitations
Strengths
One of the things that helped to strengthen the validity of the findings of this
experiment was the fact that it took place in a real-world setting. Because the experiment
took place during an actual stakeholder group decision-making event regarding a real
public policy issue instead of a simulated exercise the setting was more realistic and the
discussion was more genuine than if I had assembled a group o f students to role play in a
simulated public participation exercise. I was able to bolster the external validity and
applicability of the results beyond this setting and sample population by conducting a
field experiment without having to simulate the problem-solving effort or the stakeholder
participation.
129
The recruitment of participants for my experiment was much easier because of the
fact that my experiment took place during an actual public participation conference. The
extent of my recruitment efforts included inviting all those who attended the SWIPR
conference to volunteer to participate in my experiment. I did not have to send out
invitations to get people to the meeting. The City o f LA sent invitations to all residents to
encourage them to attend this city-wide SWIRP conference. Because the invitation list
was so vast, and the attendees came on their own volition, the pool of people who came
to the conference provided a random and representative sample o f City residents. This
city-wide invitation to encourage residents to attend this conference yielded a far larger
sample size than I could have otherwise generated if I had conducted the recruitment of
experiment participants on my own.
Because this experiment was part of an actual public participation event, it also
made it easier to promote mundane realism. As Aronson and Carl smith (1968) explain,
“mundane realism” is an effort to take the focus off the experiment and make the setting
as normal as possible. The general meeting logistics including invitation method,
location, parking, food, agenda, etc. were coordinated by the City of LA, and were
consistent with the format they have used for past SWIRP meetings. For instance, the
morning agenda included presentations by a number of City officials prior to dividing the
group into small groups for discussion as past SWIRP meetings had been structured.
Another attribute that helped to strengthen the results of this experiment was that
the control and experimental groups were assigned to two different rooms. This was done
so that the experimental and control group could not see the activities of the other group.
This discussion also helped to prevent the participants of both groups from noticing that
130
one group had computers and the other group did not. It also helped to keep the
participants focused on their tasks and to increase the likelihood that their responses were
reflective on their particular group experience, not distracted with a curiosity about how
their group differed from the other group’s experiences.
Perhaps the most important strength of this experiment was related to the
development o f the system dynamics simulation model that was developed in advance of
the SWIRP conference. A great deal o f time and effort went into the development of the
simulation model in advance of the meeting, to ensure that it accurately reflected the
relationship of elements o f the solid waste management system in Los Angeles. In
addition, the model had a very “user-friendly” interface.
Limitations
There were also some limitations to the study. Table 25 lists a sampling of
anecdotal comments o f what participants felt did not go well in the experiment. In total,
71 participants from the control group and 67 participants from the experimental group
responded to this question. The list below provides a representation o f the types of
comments offered and it sheds some light on what the participants o f both groups thought
could have been better in the facilitation of their decision making effort. This list also
identified areas in which I could have improved the testing o f my hypothesis. For
instance, it is possible that time constraints limited the effectiveness o f my ability to test
my hypotheses.
131
Table 25. Sample participant feed back regarding what did not go well
Control Group To many issues, not enough time
Too many divergent ideas
One person tended to dominate the discussion.
Negative “Worksheet focused the substance and emphasis o f the discussion.
We had trouble sticking to the format and kept going o ff on tangents or side discussions. Too loosely structured.
Not enough time for discussion.
Too many suggestions and conflicting views.
Goals o f the disc ussion were unclear.
The facilitator did not keep to the outline and keep the discussion moving.
Experimental Group The time given to complete the workshop with the computer. There are too many
variables that need to be readjusted and that was kind o f challenging and time consuming
I wish we had the model explained better to us.
Technology approach required significant learning for given time and setting.
The computer model was a little weird and vague.
The computer program was cumbersome and wasted our time! It would have been better to be given information that the computer program could generate, and make a decision based on facts.
The computer model should have been able to record inputs. Parameters should have been more obvious.
Not enough infoirmation about how the figures were computed.
I don’t trust the way the program was written and have questions about the variables.
Time constraints were one of the primary limitations of this experiment.
Unfortunately the time allotted for the experiment was only approximately two hours. As
is evidenced in the participant feedback in Table 27, both groups felt that they did not
have enough time to complete their task. While these comments are not representative of
all 197 participants they do help to illustrate the range o f comments related to the things
participants did not think went well during the experiment.
132
Because the experiment took place during a 90-minute workshop, not during a
standard six-month CAC setting like the case study cited by Stave (2002), it was not
possible to conduct a full group model-building exercise.
As a result o f this limitation, the participants o f this experiment did not have the
opportunity to develop shared ownership of and trust in the model. Researchers such as
Akkermans and Vennix (1997) and Rouwette and Vennix (2006) have found to be a
standard byproduct of group model building efforts. In addition, there was not enough
time for the facilitators to sufficiently introduce the model and provide a robust tutorial to
help the participants to become completely familiar with and proficient in the use of the
model.
As such, the experimental group participants did not have enough time to become
completely comfortable with running the model or enough time to truly digest and
discuss the output of the model. This shortage of time in the orientation, the use and
evaluation of the model output may have negatively affected the responses of participants
in the experimental group relating to procedural satisfaction and confidence in their
knowledge and abilities.
If I were to conduct an experiment to test these hypotheses again, I would follow
one o f two design strategies. First, if I were using a model that was developed by experts
in advance o f the use by public stakeholders, I would ensure that the engagement lasted a
full day. This would enable participants to spend a significant amount of time learning
about the model and how it worked, and giving them sufficient time to uses the model to
run different scenarios and still have time to discuss the output o f the model to make
133
policy recommendations. While this would still constitute an abbreviated timeframe, I
believe it would be sufficient for testing the hypotheses.
The second strategy I would use would be to design a full group model-building
exercise over a series o f individual meetings. This would enable participants to
thoroughly be able to define and develop a shared vision of the problem, understand its
causes, and identify the core assumptions that would be included in the formal computer
model. It would also give them more time to use the model to develop, test, and analyze
alternative scenarios prior to making a policy decision.
In both o f these alternative experimental design strategies a companion standard
process would be implemented in the same timeframes to enable direct comparison and
testing o f the hypotheses. In both design strategies, the participants o f the system
dynamics and standard facilitation groups would have more time to understand and
discuss the issues prior to making a policy decision.
In addition to time constraints, resource constraints were also a factor in this
experiment. Because o f the large sample size, it was difficult to find enough trained
system dynamics facilitators to accommodate the individual small groups in the
experimental group. This meant that some system dynamics facilitators had to facilitate
more than one group at the same time. In the control group, the opposite situation existed
and in some cases the control group had more than one facilitator for an individual group.
This limitation of facilitator availability in the experimental group reduced the amount of
one-one-one time that the facilitators could spend with individual participants. This too
could have negatively affected the participants’ satisfaction with their experiment or their
confidence in their abilities to run or interpret the model.
134
Equipment limitations also existed. Laptop computers were used for each
individual group to run the simulation model. Some participants found the smaller laptop
screen view difficult to see, especially with a cluster of people sharing one laptop. Other
participants expressed a desire to have a printer so that they could print the output of each
run to better track the various options for consideration.
Another potential limitation with this experiment relates to the pool of
participants. As seen in the demographic analysis, the makeup of the participants was
relatively homogeneous. In general, the participants were highly educated, long-time
residents o f LA, between the age of 45-65, and claimed to recycle all or most of what
they can, etc. In some ways, this high level o f horriogeneity contributed to the internal
validity o f the experiment. As Campbell and Stanley (1963) explain, internal validity can
control the confounding variables and ensure that the experiment measures what it is
intended to test.
However, this high degree o f homogeneity of participants could also have
negatively affected the external validity o f the results. External validity is the extent to
which findings can be extended outside a particular experimental setting and specific
group o f subjects (Fisher, 1935). The results o f this experiment indicate that when
working with stakeholders who are relatively homogeneous, and generally supportive of
an issue, system dynamics is an effective facilitation tool. However, I must be careful not
to overstate these results. These results could have been very different if the participants
had come from a more diverse group, from a group o f adversaries, or if some o f the
participants were opposed to the objective or the policy options under consideration
(e.g., NIMBYs, NOPEs) instead of those generally supportive o f the initiative.
135
A final potential limitation to the results of this analysis is that the experiment
took place in a particular moment in time on the morning of February 2, 2008. As I write
this analysis in October 2008, amid the recent financial crisis through the nation and the
world, I cannot help but wonder if the results of this experiment would be different if I
were conducting the experiment today instead of last February. For instance, if we
conducted the experiment on asking for input on how best to reduce the amount of waste
sent to landfills, it is possible that some of the participants would have been more
inclined to make suggestions related to reduction of consumption rather due to the more
frugal mindset caused by tight economic times, rather than desire to reduce waste. As
such, it is important to recognize that every experiment is affected by its timing, and the
assessment of the ability to generalize the results should take that into consideration.
Suggestions for Future Research
It is my hope that the experiment conducted for this study provides some useful
insight for other system dynamics or traditional group decision making facilitation
researchers and practitioners. While this analysis has answered some questions, it has left
some unanswered and has raised ones that I had not previously considered.
Confirm Effectiveness o f System dynamics-based facilitation with Public Stakeholders
The results of this experiment yielded some anticipated and some surprising
results. It would be interesting to replicate this experiment under the same basic
conditions o f a real-life public stakeholder engagement (large total sample size, small
group workshop the same experimental design, and the same pre- and post-intervention
survey instruments) to confirm whether the results of this experiment can be replicated.
136
However, if I were to conduct this experiment again I would design it to last a minimum
of eight hours. It would also be beneficial to arrange in advance a follow up interview
with participants six months after intervention to measure if their responses to the same
post-intervention questions change over time.
With the exception of the present experiment and the research conducted by Stave
(2002, 2003, 2008), system dynamics research projects such as those conducted by
Vennix (1996), Huz (1999), Rouwette (2003) and others, tend to focus on the analysis the
use of system dynamics with subject matter experts, rather than lay public stakeholders.
As this experiment illustrates, system dynamics simulation modeling can have a positive
affect on improving public stakeholder participants’ ability to identify and understand the
relative difference between alternative solutions. However, these findings would be
stronger if this experiment could be replicated with another public stakeholder group
decision making effort.
In addition to replicating this exact study with another public stakeholder group, I
would conduct this same experiment with subject matter stakeholders instead of lay
public stakeholders. This experiment could provide one other way to test the relative
effectiveness between traditional and system dynamics-based facilitation methods. It
could also help to measure if participants’ level of subject matter awareness plays a role
in the relative effectiveness of traditional and system dynamics-based facilitation
methods.
137
Study the Effectiveness o f System Dynamics at Different Points Along a Spectrum o f
Involvement Intensity
While this experiment focused on comparing the difference between traditional
and system dynamics-based facilitation methods, it would also be helpful to conduct an
experiment focusing solely on system dynamics-based facilitation methods. One way in
which to approach such a study would be to identify the varying levels of participant
interaction with the simulation model along a spectrum from a low level of involvement
to a high level of interaction. For instance, the experiment I conducted would be placed at
the lower end o f the interaction spectrum since my experiment only lasted 90 minutes,
and the participants were not involved in the development of the model. At the higher end
of this spectrum would be interaction such as the transportation CAC in Nevada (Stave,
2002) in which participants were involve in a comprehensive group model-building
exercise, which took a year o f regular monthly meetings to complete.
The first step in conducting such a study is to identify the different levels of
interaction along the continuum beyond these two examples, to provide examples of the
full range o f levels o f interaction along a spectrum. The next step would be to develop an
appropriate methodology for understanding the similarities and differences among these
different levels of interaction. Identifying the pros and cons o f each step would also be
instructive.
The goal o f this study would be to help system dynamics practitioners to study the
level o f effort and relating efficacy of each type o f interaction along the spectrum. This
information could help them to be better able to prescribed the most appropriate and
effective level o f intervention to address the problem at hand. For instance, in a relatively
138
simple problem within a relatively simple system it may not be necessary to conduct a
full, group model-building effort. Research on this spectrum of participant involvement
in system dynamics simulation modeling would also be helpful for training new system
dynamics facilitators, as well as helping to better manage the expectations of those clients
who engage system dynamics facilitators. The results of the present experiment could
provide a data point on the lower-involvement end o f the spectrum, but clearly more data
is needed to fully understand this spectrum of participant involvement in system
dynamics simulation modeling.
Study the Effectiveness o f Traditional Facilitation Outcomes Independently, Not in
Comparison with System Dynamics
While this study demonstrated that the group facilitated with traditional method
scored lower in its ability to identify effective decision outcomes relative to the control
group, this study did not specifically measure why the groups scores were different in this
area. The findings suggest that the traditional facilitation may overly employ behavioral
decision making techniques which tend to promote sub-optimal decision outcomes.
However, it would be interesting to conduct another experiment focusing solely on the
use of traditional facilitation, to focus on measuring the degree to which the facilitators
use behavior or classical decision-making strategies. For instance, it would be interesting
to specifically measure if they use anchoring and adjusting (Tversky & Kahneman, 1974)
in their discussions, or if they appear to be satisficing (Simon, 1957), or being
hypervigiliant (Janis & Mann, 1977) when selecting the final solutions. This study would
provide important findings for improving traditional facilitation methods
139
One reason why this type of study is necessary is to ensure that stakeholder group
decision-making efforts are rigorously and sincerely administered, not just an effort to
placate participants and check a federal regulatory box. Public stakeholder engagement
processes can help promote better decisions, especially if the public stakeholders are
given all the information and assistance to be able to make fully informed decisions. It is
important to meet the spirit of the law, not just the letter of the law. The results of the
present experiment suggest that the traditional facilitation methods did more to promote
satisfaction and confidence, than decision effectiveness. This suggests that more could be
done in traditional facilitation to help public stakeholders to make more informed
decisions in complex environmental decision making efforts. A study such as the one
proposed here, could provide information about what can be done to improve the
effectiveness of traditional group decision making facilitation methods.
Conclusion
In my 20 years o f work in the field o f stakeholder participation in environmental
and public policy decision making, I have learned a great deal about the importance of
creating an effective and sincere process for soliciting and incorporating stakeholder
input into the final decision. In addition to incorporating information on the technical
feasibility and the financial affordability of alternative solutions in a decision making
process, it is also essential to incorporate public acceptability before making decisions to
solve environmental problems. Stakeholders provide invaluable data which can greatly
improve the quality and effectiveness of the ultimate solutions to the problem at hand.
However, if the stakeholders are not given the proper tools and assistance in accessing
140
and processing the relevant facts related to the causes of the problem and the relative
effectiveness of the alternative solutions, the stakeholders will not be able to make fully
informed decisions. Whien this occurs, it is more likely that the stakeholder participation
process will be insufficient and the outcomes will be ineffective.
The general question posed in this study was related to the examination of how
stakeholder group decision making facilitation could be improved to enhance the
effectiveness o f the decision outcomes of such processes. This analysis confirmed that
standard stakeholder group decision making facilitation methods enable participants to
employ behavioral decision making strategies which are more likely to avoid thorough
decision analysis and result in ineffective outcomes. It also showed that facilitation
methods which stress more classical decision making strategies, such as system
dynamics-based facilitation, are more likely to promote a more thorough decision
analysis and result in more effective outcomes. And finally, the results showed that the
just because a group is better able to identify more effective solutions does not guarantee
that they feel satisfied and self confident as a result of their participation in the decision
making effort.
While not every environmental problem is dynamically complex enough to justify
the extra time and effort needed to use system dynamics-based facilitation methods, this
study demonstrates that for complex, dynamic problem-solving efforts, the system
dynamics-based facilitation methods can help participants to be better able to identify
more objectively effective decision outcomes. The results also provide two cautionary
notes. First, it reminds system dynamics-based facilitators to ensure that the process
promotes satisfaction and confidence in addition to effectiveness. It also reminds to those
141
using standard facilitation methods when involving stakeholders in decision making
efforts to solve complex environmental problems, to ensure that the process is not
focusing too much on the promotion of satisfaction and self confidence, rather than
identifying effective solutions to resolve the problem at hand.
142
X
g<
tI
PL,
§
cê{Xi
Ic/3
Bt/3
III
!g
8C3
IÜ
1'53
!
10. Make decision
9. Evaluation, discussion
8. Identify consequences
7. Analyze alternative solutions against criteria
6. Establish criteria for solution effectiveness
5. Collect data
4. Generate alternative solutions
3. Identify problem causes
2. Define problem
I. Identify, discuss problem and goalssdoiS SS300J(J
Young, R. M. (1983). SuiTogates and mapping: Two kinds o f conceptual models for
interactive devices. In D. Centner and A.L. Stevens (Eds.), Mental models
(pp. 35-53). Hillsdale, NJ: Lawrence Erlbaum, Inc.
Zagonel, A. (2004). Reflecting on Group Model Building Used to Support Welfare
Reform in New York State. Unpublished doctoral dissertation. University at
Albany.
Zakay, D. (1984). The evolution of managerial decision quality by managers. Acta
Psychologica, 56, 49-57.
228
VITA
Graduate College University o f Nevada, Las Vegas
Marcia Lynne Turner
Home Address:1301 Birch StreetLas Vegas, Nevada 89102
Degrees:Bachelor o f Arts, Philosophy and Speech Communication (double major), 1988 University of San Diego
Master of Arts, Speech Communication, 1997 University o f Nevada, Las Vegas
Special Honors and Awards:Phi Kappa Phi National Honor Society, 1998Public Relations/Advertising Manager of the Year 1996: Las Vegas Women in
CommunicationBronze Quill Award, Integrated Marketing, International Assn. Business
Communicators National Health Policy Fellow, National Assn. Public Hospitals
Dissertation Title: Evaluating the Use of System Dynamics for Improving Stakeholder Decision Making
Dissertation Examination Committee:Chairperson, Dr. Krystyna Stave, Ph.D.Committee Member, Dr. Anthony Ferri, Ph.D.Committee Member, Dr. Timothy Famham, Ph.D.Graduate Faculty Representative, Dr. Jerry Simich, Ph.D.