Evaluating willingness to pay for rising agricultural and household water costs in a developing Himalayan economy: The case of Nepal Krishna Lal Poudel 1 , Thomas G. Johnson 1 Rachna Tewari 2 and Joey Mehlhorn 2 1 University of Missouri, Columbia 2 University of Tennessee, Martin
Transcript
Evaluating willingness to pay for rising agricultural and household water costs in a developing Himalayan economy:
The case of Nepal
Krishna Lal Poudel1, Thomas G. Johnson1
Rachna Tewari2 and Joey Mehlhorn2
1 University of Missouri, Columbia
2 University of Tennessee, Martin
Problems observed in Himalaya region
• Rising temperatures causing the retreat of glaciers worldwide including the Himalayan region (Aryal and Rajkarnikar, 2011; Erickson et al. 2009).
• Glacier retreat - rising temperatures lead to permanent decreases in glacier mass and volume.
• Uncertainty in projections of future changes in precipitation and temperature
•
• Shifts in location and intensity of snow and rain over time can help forecast water flows in rivers and streams.
Problems and rational of the study in Nepal
• Rising temperatures (𝑎𝑣𝑔 𝑎𝑛𝑛𝑢𝑎𝑙 𝑖𝑛𝑐𝑟𝑒𝑎𝑠𝑒 0.06𝑜𝐶)• Sporadic rainfall-water flow in the rivers/creeks• Retreating glaciers (landslides, floods & droughts)• Decreasing water availability • Low agricultural productivity • Rising demand for water• Rural-urban migration, specially from Hill and
Mountain• Smallholders 75% of total population – 33% of GDP• Low investment capacity (40% population have <$1
day)
Recent problems in the research area
4
5
Water management practices in Nepal
• No efficient property right enforcement in water management
• Seller-buyer transaction of water rights is relatively uncommon in developing world (Young and Loomis, 2014).
• Community based water management emerging;
• Willingness to Pay (WTP) – may determine success of water management policies
• Riparian water right- exercise in rural areas
• Prior appropriation: very limited in summer/winter
6
Objective and Hypothesis
• To compare the willingness to pay of water users in two ecological zones in Nepal (Terai, Hill).
• To examine the impact of demographic and spatial explanatory factors that affect the differences in willingness to pay.
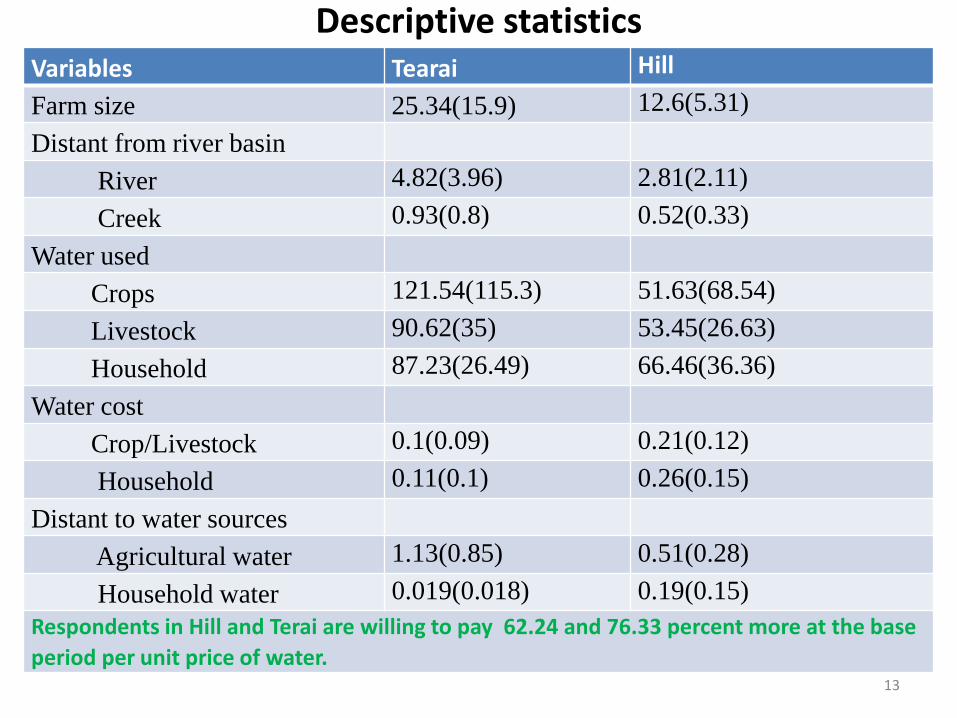
• Residents of the three regions have positive willingness-to-pay for additional agricultural and household water
7
Willingness to Pay and Water markets
• Increasing demand for water coupled with the development of new water sources will lead to water market development.
• When the market emerges, price will ideally reflect the equilibrium between minimum WTA (willingness to accept) of suppliers and the maximum WTP (willingness to pay) of buyers.
WTP
WTA
Pri
ce
E
Water right
Without water
With water
InputXj
Y2
Y1
Fig. Hypothesized effect of water on farm yield
Fig. Market for water right
8
Ou
tpu
t
Cont..
• For non-marketed goods including water in some cases, WTP is the theoretical basis on which shadow prices are best calculated (Young and Loomis, 2014).
• VMP of water resource derived from any production function that incorporates water as a decision inputs approximately reflects the maximum WTP by producers.
• Scarcity-alternative uses- market develop- marginal value
• Examples of leasing and sale of water rights- in the arid and semi-arid western USA ; china, Australia, Chile (Brewer et al. 2008)
• Markets for water rights are relatively uncommon in the developing world (Young and Loomis, 2014)
9
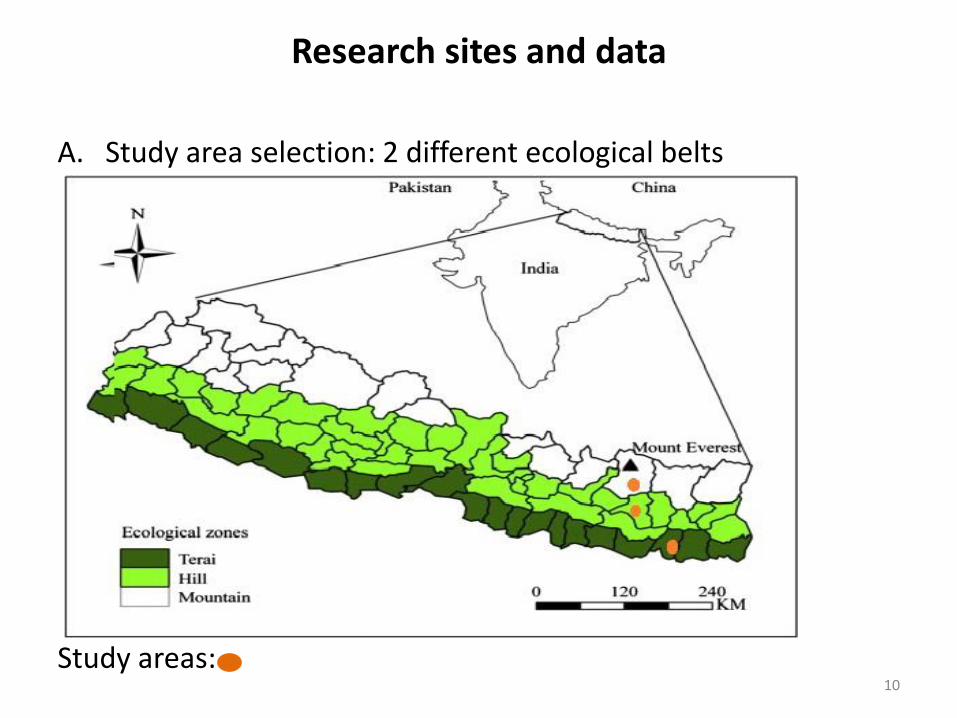
Research sites and data
A. Study area selection: 2 different ecological belts
Study areas: 10
Sampling (frame, unit and size)
• Koshi river basin: Biggest, 720 km,
61,000 km2 basin area
• originates from the northern slopes of the Himalayas (Tibet), drain via Nepal through Northern India- confluences to Gang
• carries silt during monsoon and floods the Terai region of Nepal
• 3 ecological belts ( Mountain, Hill & Terai)
• 2 VDCs from each regions
• Primary data from 300 HH survey (150 from each ecologies): simple random sampling technique
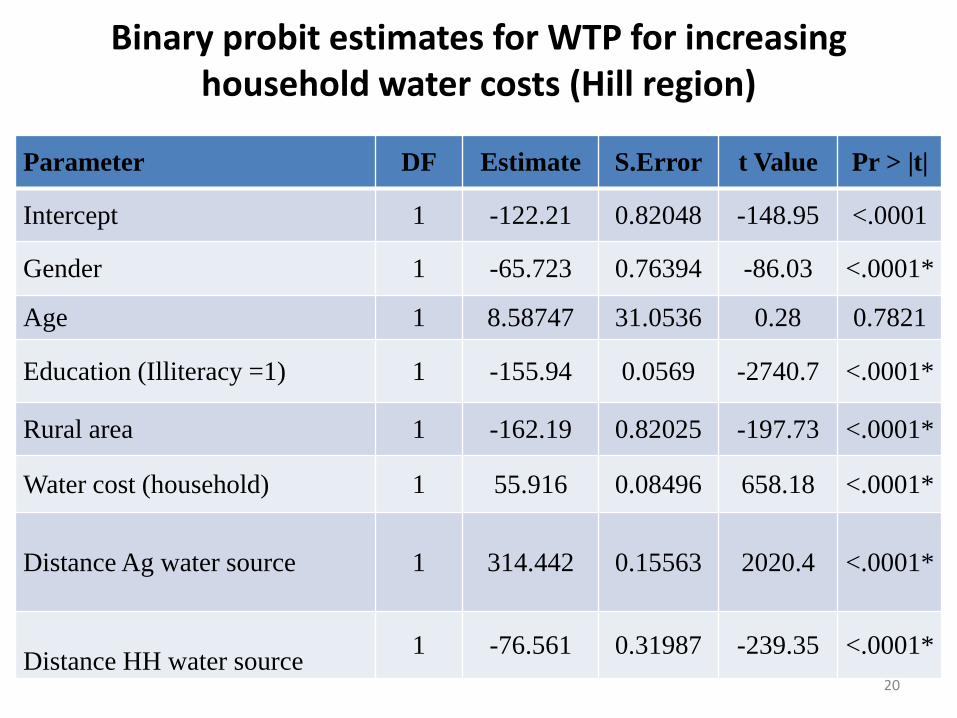
Water cost (household) 1 55.916 0.08496 658.18 <.0001*
Distance Ag water source 1 314.442 0.15563 2020.4 <.0001*
Distance HH water source1 -76.561 0.31987 -239.35 <.0001*
20
Major findings
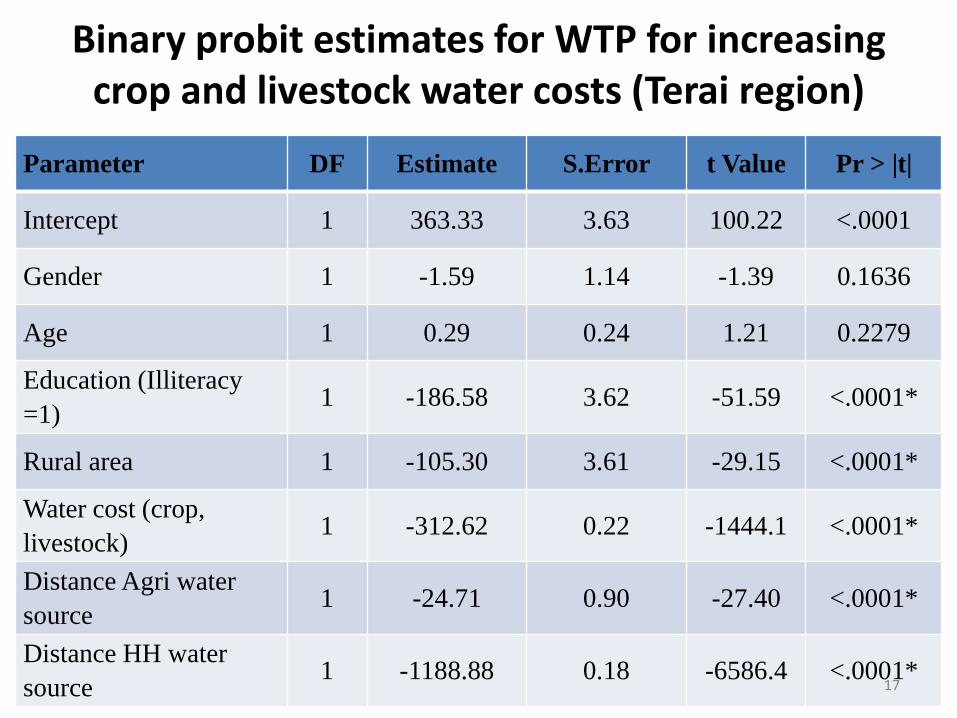
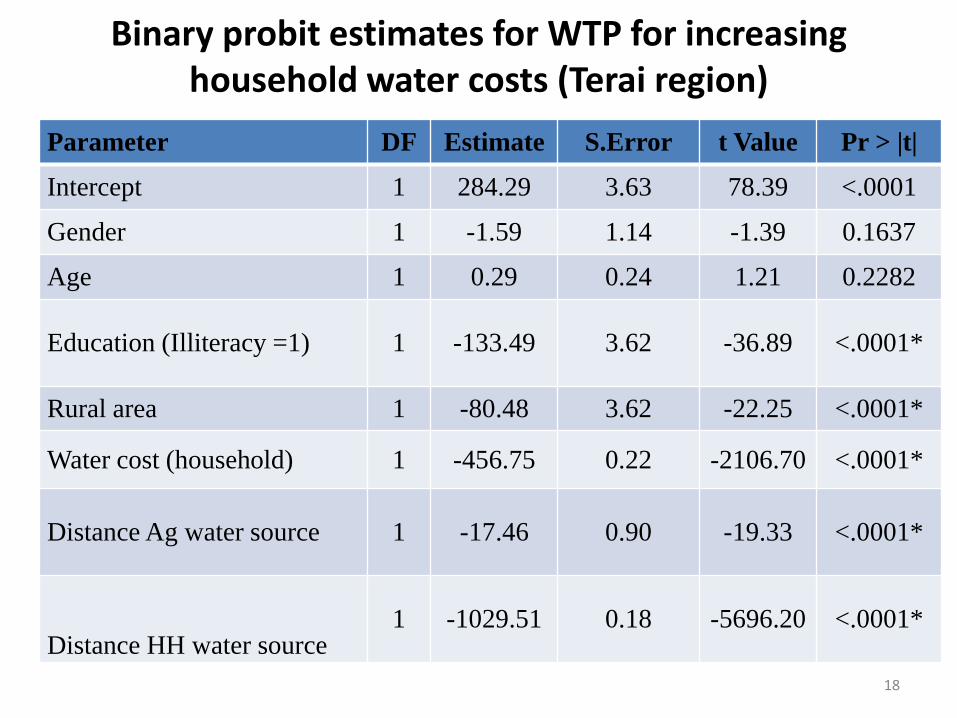
• Terai region - negative effect on WTP for increased costs for Ag and HH use.
•
• Hill region - positive effect on WTP for increased costs for Ag and HH use.
• Reason? - Hill region – higher marginal benefit from additional unit of water for high value-low volume cash crops (medicinal crops), off-seasonal vegetable production.
• Improved farm income enables a possibility for higher WTP towards both Ag and HH use.
21
Conclusion and Policy suggestions
• Climate change and urbanization present challenges for effective water resource management in Nepal.
• Expected solutions necessitate inter-disciplinary approaches and cross-sectorial partnerships.
• Evaluated differences in WTP among water users for increase in Ag and HH water costs in Terai and Hill.
• Future work - economically feasible and viable water management policies from the perception of stakeholders.