Electronic copy available at: http://ssrn.com/abstract=1590942 34 Evaluation and Comparison of Market and Rating Based Country Default Risk Assessment Alexander Karmann Dominik Maltritz Abstract We compare two different approaches to assess country default risk by evaluating their forecast accuracy. In particular we analyze whether market based or rating based risk assessment is superior. To evaluate the forecast accuracy we analyze the differences between several default risk measures and realizations of defaults/non defaults in the forecast period. The consid- ered risk measures are, on the one hand, default probabilities and binary cri- sis forecasts (default/non default), on the other. Within a sample of 19 emerging market countries in 1998 to 2007 we find that risk measures de- rived by reduced form credit risk models from market data outperform rat- ings of S&P. Keywords: sovereign risk, ratings, yield spreads, forecast accuracy, country default JEL classification: F34 Mail to: [email protected]or [email protected]We would like to thank the participants of the workshop on “FDI and County Risk” in January 2008 organized by Deutsche Bundesbank and TU Dresden as well as an anonymous referee for helpful comments.
Transcript
Electronic copy available at: http://ssrn.com/abstract=1590942
34
Evaluation and Comparison of Market and Rating Based
Country Default Risk Assessment
Alexander Karmann
Dominik Maltritz
Abstract We compare two different approaches to assess country default risk by evaluating their forecast accuracy. In particular we analyze whether market based or rating based risk assessment is superior. To evaluate the forecast accuracy we analyze the differences between several default risk measures and realizations of defaults/non defaults in the forecast period. The consid-ered risk measures are, on the one hand, default probabilities and binary cri-sis forecasts (default/non default), on the other. Within a sample of 19 emerging market countries in 1998 to 2007 we find that risk measures de-rived by reduced form credit risk models from market data outperform rat-ings of S&P. Keywords: sovereign risk, ratings, yield spreads, forecast accuracy, country default JEL classification: F34
Mail to: [email protected] or [email protected] We would like to thank the participants of the workshop on “FDI and County Risk” in January 2008 organized by Deutsche Bundesbank and TU Dresden as well as an anonymous referee for helpful comments.
Electronic copy available at: http://ssrn.com/abstract=1590942
Alexander Karmann, Dominik Maltritz - Evaluation and Comparison of Market and Rating Based Country Default Risk Assessment – Frontiers in Finance and Economics – Vol. 7 No.1 – April 2010, 34 - 59
35
I - Introduction
International lending to developing countries is influenced by the risk that these countries are not able or willing to repay their debt. Hence, country default or sovereign risk is an important determinant of international capital flows and the availability of capital for emerging markets. For the borrowers as well as the lenders it may be favourable to have proper tools for risk assessment on hand. In the present paper, we compare different ap-proaches to assess country default risk. We especially evaluate the forecast accuracy, i.e. we contrast forecasts of defaults and default probabilities with realizations of defaults/non defaults in the forecast period. A sample of 19 emerging market countries between 1998 and 2007 is considered. This sam-ple comprises all countries the required input data is available for. We con-sider default probabilities derived from market data, given by the Emerging Market Bond Index+ (EMBI+) by JP Morgan, and compare the results with those of risk measures based on ratings of S&P to analyze whether rating or market based risk assessment is superior. The assessment of country risk is a complex task. In some sense it is even more difficult than the assessment of corporate default risk. This is be-cause besides economic issues also political issues may influence default risk. The special importance of political issues is pointed out within theoretical contributions telling us that a country’s willingness to pay plays an important role, whereas a country’s ability to pay also may depend on political issues.1 Both the ability to pay and – even more – the willingness to pay of a country are difficult to quantify. A multitude of factors exists which can influence the default risk. Many of them are not easy to quantify or even unobservable.
The most popular measures of country default risk are sovereign or country ratings. Country ratings are published by several business magazines, as Euromoney and Institutional Investor. The former produces ratings by us-ing a scoring model, whereas the ratings of the latter results from surveys, with representatives of 100 leading international banks are asked for their opinion. Multinational operating banks themselves use internal rating systems to assess the credit risk of countries. The most prominent ratings, however, are those assigned by the leading rating agencies, as S&P’s, Moody’s and
1 Ability to pay issues are tackled, for example in Domar (1950), Avramovic et al. (1964), Diaz-Alejandro (1984), Simonsen (1985) or Clark (1997). The willingness to pay problem is discussed, for example, in Eaton and Gersovitz (1981) Eaton, Gersovitz and Stiglitz (1986), Grossman and van Huyck (1988), Bulow and Rogoff (1989), Atkeson (1991), Cole, Down and English (1995) or Eaton and Fernandez (1995).
Alexander Karmann, Dominik Maltritz - Evaluation and Comparison of Market and Rating Based Country Default Risk Assessment – Frontiers in Finance and Economics – Vol. 7 No.1 – April 2010, 34 - 59
36
Fitch. These rating agencies deal with the problems mentioned above by building up their ratings on qualitative and subjective assessments done by experts of the agencies. These assessments are based on scoring models and country reports, whereby also a multitude of observable quantitative eco-nomic numbers is considered.2 Another medium processing information on country default risk is the market for countries’ government bonds. The bond prices are supposed to reflect an assessment of the default risk (made by the market participants), since the value of bonds depends on the default risk. To derive the default probability from observed market prices, so-called pricing models can be used. These models link the prices of defaultable claims to the default prob-ability. When it comes to pricing models, one has to distinguish two sub-classes: structural models and reduced form models. In reduced form models, the present value of a security affected by default risk is the discounted value of expected future payment. The expected payment is the sum of the contractual promised payment times the probability of survival and the expected payment in the case of default (recovery rate) times the probability of default. Thereby these models assume that an exoge-nously specified stochastic process describes the default probability. They do not rely on an economic model which generates the default probabilities. The main difficulty in the applications is to estimate parameters for both the re-covery rate and the default probability. This issue is discussed in more detail in the next section.
In structural models (see Uhrig-Homburg (2002) for an overview), by contrast, the default probability is generated by an underlying economic mechanism. Thereby it is assumed that a stochastic state variable determines whether a default occurs. This happens when the value of the state variable falls below a certain threshold value. The threshold value can be the debt value, whereas the stochastic state variable is the amount of funds the gov-ernment is able or willing to pay. In comparison to reduced form models one advantage of structural models is that the estimation of these parameters yields an assessment of the economic situation of the country, giving more information than the default probability. On the other hand, the economic model of default adds more complexity and makes it more difficult to apply structural models. Since our paper focuses on default risk rather than on eco-nomic situation we choose a reduced form approach to derive default prob-abilities from market data.
2 A more detailed description of the rating process can be found in Bhatia (2002) for S&P’s and in Hilderman (1999) for Moody’s.
Alexander Karmann, Dominik Maltritz - Evaluation and Comparison of Market and Rating Based Country Default Risk Assessment – Frontiers in Finance and Economics – Vol. 7 No.1 – April 2010, 34 - 59
37
Whereas ample literature exists on the issue of estimating country de-fault risk, only a few papers focus on evaluating the derived risk estimates and comparing different approaches to risk measurement. With respect to ratings, Reinhart (2002) conducts a study for a broad data sample, considering 59 countries in the years 1970 to 1999 for which 113 debt crises and 151 cur-rency crisis are to observe. Thereby, she regresses crisis dummies on lagged rating changes (for lags of 6, 12, 18 and 24 month). The ratings of Moody’s, S&P’s and “Institutional Investor” are considered. The results are mixed. No significant dependency between currency crisis indicators and rating changes can be found, which means that ratings fail to predict currency crisis. This may not be seen as a problem since ratings aim to predict debt crises rather then currency crises. However, even for debt crisis indicators the results are mixed. Depending on the debt crisis indicators used, no or only a weak influ-ence (at the 5% level in the best case) of rating changes is to observe. Sy (2004) conducts a similar study focusing, however, on a more recent data sample which contains data form 1994 to 2002 for 13 countries. He considers ratings of Moody’s and S&P. The results partly confirm those obtained by Reinhart (2002), but he also obtains different results. With respect to currency crises he finds that there exists no significant dependency to ratings. On the other hand, Sy finds a significant dependency between ratings and debt crisis indicators. This may be due to the fact that he uses a shorter time lag (three months) between rating changes and debt crisis indicators. In the evaluation of pricing models sometimes the errors in pricing of securities (i.e. differences between observed prices and prices calculated using the model) rather than the default probabilities are considered. An example is Andritzky (2004), who applies a reduced form model with time dependent hazard rate and a simple model with constant hazard rate. Applying the mod-els to Argentina and Russia he finds that the more complex model does not outperform the simple model. Keswani (2000) compares the reduced form model of Duffee (1999) with the structural model of Longstaff and Schwartz (1995). For in-sample application he finds smaller pricing errors for the re-duced form model, whereas for out-of-sample estimations the results are quite similar. In contrast to Andritzky and Keswani, Huschens et al. (2007) con-sider default probabilities instead of pricing errors. In their paper several like-lihood ratio tests are developed for the case where few and heterogeneous probabilities are to be tested, which is typically the case in assessing country default probabilities. These tests are applied on one-year default probabilities estimated by using a structural model of the Merton type for a sample of 19 countries in the years 1998 to 2005. Statistical significance is found for the hypothesis that the calculated probabilities are good estimates for default risk.
Alexander Karmann, Dominik Maltritz - Evaluation and Comparison of Market and Rating Based Country Default Risk Assessment – Frontiers in Finance and Economics – Vol. 7 No.1 – April 2010, 34 - 59
38
Also Maltritz (2006) compares different approaches to country risk assessment. Instead of statistical tests he focuses on the quadratic probability score, which aggregates the differences between default probabilities and crisis dummies. Additionally to default probabilities, he considers results of binary default forecasts (default/non default). He applies a structural credit model of the Geske (1977) type, which is estimated by using market data of government bonds, and compares it with rating based risk assessments. He finds that market based risk estimates derived using the Geske model are no-ticeably better in predicting observed defaults than ratings. The use of more complex models may improve the risk estimations, but it has the drawback that the required data are only available for a small country sample. So, the sample is restricted to 13 countries since the approach used in Maltritz (2006) requires market data given only for these countries. He considers annual data of the years 1998 to 2004.
Our paper contributes to the literature by evaluating and comparing country risk assessments given by ratings (of S&P) with risk assessments derived from market data using a simple reduced form model. In doing so, we focus on the forecast accuracy: we contrast (annual) forecasts of defaults and default probabilities with realizations of defaults/non defaults in the forecast period. We use a simple reduced form model in deriving market based risk assessments to avoid restrictive data requirements. This enables us to use a large data sample, which comprises data from 1998 to 2007 for 19 countries.
In section 2, we explain and apply the reduced form model and de-scribe the ratings used in the evaluation. Section 3 deals with the evaluation of the risk measures. Section 4 concludes. 2 - Risk measures 2.1 Probabilities derived from bond market data by using a reduced form approach
Data from government bond markets can be used to gather informa-tion about country default risk, since the risk influences the prices of these bonds. We derive default probabilities – as measures of country risk – by using a simple reduced form approach. Reduced form models typically as-sume that market participants are risk neutral, or, at least, that default risk is diversifiable, which is a weaker assumption. The latter at least is not too unre-alistic, since in recent years markets for credit default swaps and other deriva-tive securities have developed and, hence, it is possible to diversify country default risk by combining default-able bonds with such derivatives.
Alexander Karmann, Dominik Maltritz - Evaluation and Comparison of Market and Rating Based Country Default Risk Assessment – Frontiers in Finance and Economics – Vol. 7 No.1 – April 2010, 34 - 59
39
To explain the basic idea of reduced form models, we consider a sim-ple zero bond. Under risk neutrality the current value, Ft, of a security is the expected repayment, FT, at time T = t + , discounted to the present day using the risk-less interest rate, rs:
sTtt rexp]F[EF (1)
The value of a default risky claim can also be calculated by discounting the promised or contractual payment, BT, with the risk-adjusted interest rate, rr, which is the sum of the risk-less interest rate and the yield spread, s:
rr
)sr(expBF sTt. (2)
The expectation value on the right hand side of equation (1) can be rewritten as the sum of the payments in the two possible states; default or non default; weighted by their respective probabilities. This means we consider the con-tractual non-default payment BT and multiply it with the probability of sur-vival, PoSt,T, as well as the payment in default, as given by the expected re-covery rate, times the contractual payment, multiplied with the probability of default, PoDt,T:
sTtT,tT
PoS
T,tt rexpBEPoDB)PoD1(F
T,t. (3)
By inserting equation (2) into (3) we can derive an expression for the prob-ability of default that depends solely on the spread and the expected recovery rate when setting BT equal to one:3
1E
1)sexp(PoD
t,t
. (4)
3 For a zero recovery rate we obtain the most simple reduced form or spread model.
Alexander Karmann, Dominik Maltritz - Evaluation and Comparison of Market and Rating Based Country Default Risk Assessment – Frontiers in Finance and Economics – Vol. 7 No.1 – April 2010, 34 - 59
40
Based on our simple model, we discuss important extensions made in the literature and their applicability for country risk assessment. Especially, we discuss alternatives to the following three basic assumptions implicitly made in the explanation above:
- time independency of the hazard rate , i.e. the default risk per (infinitesimal small) unit of time ( =
0lim
PoDt,),
- time independent recovery rates and - constant risk-less interest rates, rs.
4
In the first half of the nineties models including stochastic interest rates were developed (see, e. g., Jarrow und Turnbull, 1995). Later on also the hazard rate and the recovery rate had been modeled as stochastic variables (see Jar-row, Lando und Turnbull, 1997, or Madan und Unal, 1998). Some papers, thereby, consider stochastic dependencies between stochastic hazard rates, recovery rates and interest rates (see Lando, 1998, Duffee, 1999, and Duffie and Singleton, 1999).
For the resulting – more complex – models the simultaneous estima-tion of the unknown parameters describing the time dependency of hazard rate, recovery rate and interest rates as well as their stochastic dependencies is a major problem. Thus, we stick to the simple model outlined above, and ask whether market data can produce better results than rating agencies, even if a simple model is used to calculate default probabilities.
However, even in the simple case considered here the application causes some problems. As the expected recovery rate is not known we have to estimate two unknown parameters in the presence of just one equation given. Different approaches exist in the literature to solve this problem. For example, Duffie et al (2003) refrain from the separate estimation of recovery rate and hazard rate by using the so called mean loss rate instead, which is the product of these single variables. Typically in reduced form models only situations are considered where the borrower is not already in default in the time where the default probability is estimated. The estimation of switching from the default to the non default state has not been considered so far.5 Duffie et al. (2003),
4 Models relying on these restrictive assumptions, which are sometimes called spread models, were already published in the seventies (see, e.g. Biermann and Hass, 1975, and Yawitz, 1977). 5 The forecast of switching from a crisis state to a non crisis state may be rather different from estimating the probability of default, i.e. switching from a non crisis to a crisis state. In our paper we focus on the latter. Thus, in our empirical application we only include periods in which the considered country was not already in a crisis state.
Alexander Karmann, Dominik Maltritz - Evaluation and Comparison of Market and Rating Based Country Default Risk Assessment – Frontiers in Finance and Economics – Vol. 7 No.1 – April 2010, 34 - 59
41
however, consider the influence of former default events on the current de-fault probability.
In other papers, the recovery rate is exogenously given (see, e.g., Keswani (2000), Wade (2003) or Andritzky (2004)). Some even set it equal to zero (see Poignant-Eng (1992)). This results in the simplest possible model where the hazard rate equals the spread, s, at the cost that this assumption is not really realistic, since typically the recovery rates are far above zero, as the examples in table 1 show.
Table 1: Recovery ratios for several sovereign defaults Country Year of default Recovery rate Argentina 2001 30 Dominican Republic 2005 95 Ecuador 1999 60 Moldova 2002 95 Pakistan 1999 65 Russia 1998 50 Ukraine 2000 60 Uruguay 2003 85 Weighted Average 64
Source: Cantor et al. 2007 Using exogenous recovery rates raises the problem of a proper esti-mation. Keswani (2000), who considers prices of Brady bonds in estimating the model, uses the collateral of these bonds as recovery rate. However, since there is a positive probability that bond holders get a higher payment in case of default, the expected recovery rate should be higher than collaterals indi-cate. Others make ad hoc assumptions on the recovery rate (see Wade (2003)) or use average recovery rates observed in past defaults. For example, Lehrbass (2000) uses a recovery ratio of 40%, which is – according to Moody’s (see, Keenan et al. (1998)) – the average rate in corporate defaults. However, the case of sovereigns differs from that of corporates (as the com-parison with table 1 shows). Also, the use of average ratios for past sovereign defaults may be problematic. The most striking feature is that the rates vary considerably between the observed events. Hence, there is high uncertainty about the expectation value, which makes estimation by historical values not even reliable. In papers where the recovery rate and the hazard rate are simul-taneously estimated from market data (see for example Merrick (2001)), a large number of bonds is required for estimation. Such data are, however,
Alexander Karmann, Dominik Maltritz - Evaluation and Comparison of Market and Rating Based Country Default Risk Assessment – Frontiers in Finance and Economics – Vol. 7 No.1 – April 2010, 34 - 59
42
available only for a small number of countries. In the present paper, we take another approach. To provide more comprehensive information about possible default probabilities and their relation to possible hazard rates, we estimate default probabilities for a variety of given recovery rates instead of consider-ing just one possible value for the recovery rate.
To calculate the default probabilities we insert data on sovereign yield spreads, s, into formula (4). Here, we use data of the Emerging Market Bond Index Plus (EMBI+) provided by JP Morgan (see JP Morgan, 1995, for a de-scription). The EMBI spreads are calculated by averaging observations for several bonds issued by the considered country. Thus, distortions resulting from singular events concerning a single bond issue will have rather small influence on the results. To be included in the index, the bonds have to fulfill several liquidity criteria, which minimizes the influence of liquidity problems. 2.2 Ratings
The risk assessments by default probabilities derived from EMBI+ are contrasted with ratings to compare the forecast ability of markets and rating agencies. We choose ratings of S&P for several reasons. First, S&P is one of the leading rating agencies. Only Moody’s is able to keep up with S&P with respect to reputation for the assessment of default risks for corporates and countries. Whereas Moody’s ratings are designed to capture the expected loss, i.e. the default probability times the loss given default, S&P focuses on the default probability (see Bhatia, 2002). Thus, the risk assessment reflected by S&P ratings is better comparable to the default probabilities derived from market data.
However, contrary to default probabilities where risk is measured on a cardinal scale, the ratings provide ordinal measurement only. For the evalua-tion with binary forecasts we consider the rating scheme as precise as possi-ble: In addition to the ratings as displayed in table 2 we also consider the out-look, additionally assigned as “negative”, “stable” or “positive. We account also for watch-listings of a country, meaning that the rating agency at some date has announced that the country is under consideration for potential up-grade or downgrade.
Alexander Karmann, Dominik Maltritz - Evaluation and Comparison of Market and Rating Based Country Default Risk Assessment – Frontiers in Finance and Economics – Vol. 7 No.1 – April 2010, 34 - 59
43
Table 2: S&P ratings overview S&P Annual default
frequency for countries1)
(1975-2006) in %
Annual default fre-quency for corporates2)
(1981-2005) in %
AAA 0 0 AA+ AA AA-
0
0.01
A+ A A-
0
0.04
BBB+ BBB BBB-
0
0.027
BB+ BB BB-
1.0
1.12
B+ B B-
1.9
5.38
CCC+ CCC CCC-
CC C
41.2
27.02
SD/D 100 100 Sources: 1) Chambers et al 2007. 2) Aurora et al. 2006 A transformation of ratings into default probabilities at a similar level
of precision is not possible. This transformation can be done by approximat-ing default probabilities of certain rating classes by the frequency of observed defaults in the past, i.e. observed defaults divided by the number of observa-tions and years. Since defaults of sovereign borrowers are rare events – espe-cially those of rated borrowers – these frequencies are based only on a small number of observations.6,7 Thus, it is not possible to calculate the default fre-
6 The default frequencies are based on 202, 154 and 17 observations in total for the rating categories BB, B and CCC-C, respectively, which implies 2, 3 and 7 observed defaults.
Alexander Karmann, Dominik Maltritz - Evaluation and Comparison of Market and Rating Based Country Default Risk Assessment – Frontiers in Finance and Economics – Vol. 7 No.1 – April 2010, 34 - 59
44
quencies for each rating notch simply because of lack of sufficient observa-tions. Nevertheless, we use these rating based default probabilities as being calculated by transforming ratings with observed default frequencies, because this provides information additional to the evaluation approach based on bi-nary forecasts. The information should be handled with care, because of the problems mentioned above. However, providing the information seems to be better than abstain from using it.
7 Alternatively one could use default frequencies for corporates, where much more observations are available. However, this also is a raw measure since default frequencies for corporates may differ from that of sovereigns, as can be seen from table 2.
Alexander Karmann, Dominik Maltritz - Evaluation and Comparison of Market and Rating Based Country Default Risk Assessment – Frontiers in Finance and Economics – Vol. 7 No.1 – April 2010, 34 - 59
45
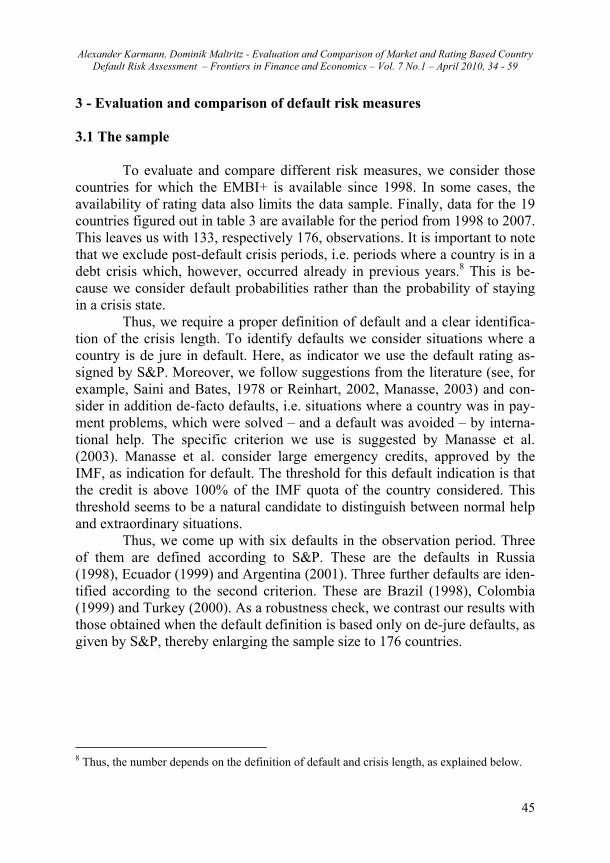
3 - Evaluation and comparison of default risk measures 3.1 The sample
To evaluate and compare different risk measures, we consider those countries for which the EMBI+ is available since 1998. In some cases, the availability of rating data also limits the data sample. Finally, data for the 19 countries figured out in table 3 are available for the period from 1998 to 2007. This leaves us with 133, respectively 176, observations. It is important to note that we exclude post-default crisis periods, i.e. periods where a country is in a debt crisis which, however, occurred already in previous years.8 This is be-cause we consider default probabilities rather than the probability of staying in a crisis state.
Thus, we require a proper definition of default and a clear identifica-tion of the crisis length. To identify defaults we consider situations where a country is de jure in default. Here, as indicator we use the default rating as-signed by S&P. Moreover, we follow suggestions from the literature (see, for example, Saini and Bates, 1978 or Reinhart, 2002, Manasse, 2003) and con-sider in addition de-facto defaults, i.e. situations where a country was in pay-ment problems, which were solved – and a default was avoided – by interna-tional help. The specific criterion we use is suggested by Manasse et al. (2003). Manasse et al. consider large emergency credits, approved by the IMF, as indication for default. The threshold for this default indication is that the credit is above 100% of the IMF quota of the country considered. This threshold seems to be a natural candidate to distinguish between normal help and extraordinary situations.
Thus, we come up with six defaults in the observation period. Three of them are defined according to S&P. These are the defaults in Russia (1998), Ecuador (1999) and Argentina (2001). Three further defaults are iden-tified according to the second criterion. These are Brazil (1998), Colombia (1999) and Turkey (2000). As a robustness check, we contrast our results with those obtained when the default definition is based only on de-jure defaults, as given by S&P, thereby enlarging the sample size to 176 countries.
8 Thus, the number depends on the definition of default and crisis length, as explained below.
Alexander Karmann, Dominik Maltritz - Evaluation and Comparison of Market and Rating Based Country Default Risk Assessment – Frontiers in Finance and Economics – Vol. 7 No.1 – April 2010, 34 - 59
46
Table 3: Country sample and debt crisis Country In default during the observation period Argentina 2001-2006 (according to S&P) Brazil 1998-2005 (according to IMF criterion) Bulgaria China Ecuador 1999-2001 (according to S&P) Colombia 1999-2006 (according to IMF criterion) Korea Malaysia Mexico Morocco Panama Philippines Poland, Peru Russia 1998-2000 (according to S&P) South Africa Thailand Turkey 2000 - (according to IMF criterion) Venezuela
With respect to the duration of a crisis we assume a de-jure defaulting
country to be in a crisis state as long as the default rating of S&P is still valid. If the default is identified by the second criterion, a country is assumed to pass from crisis state to non crisis state when the assigned help program ends and no new program is assigned.
We evaluate and compare the different risk measures by analyzing the accuracy of default forecasts in annual frequency with non-overlapping fore-cast periods. More exactly, for each year in the sample period and each coun-try we consider the respective default risk assessment, valid at the beginning of the year and compare it with the realization of default or non default during the respective year. For the estimation of default probabilities with equation (4) we set the time to maturity, , equal to one. A short overview about the resulting default probabilities and the ratings for our data sample is given in the next subsection.
Alexander Karmann, Dominik Maltritz - Evaluation and Comparison of Market and Rating Based Country Default Risk Assessment – Frontiers in Finance and Economics – Vol. 7 No.1 – April 2010, 34 - 59
47
3.2 Overview on the default risk measures
For the sample described in the last subsection we derive annual de-fault probabilities by using formula (4). As explained in subsection 2.1 it is difficult to derive the recovery rate in a proper way. Hence, we consider widely differing values for the recovery rate, RR, and the resulting default probabilities. Descriptive statistics are displayed in table 4. For each recovery rate the mean values are calculated over all 133 default probabilities fore-casted. We also report the minimum and maximum value observed in the sample.
For a given spread, the default probability is higher when a higher re-covery rate is assumed, as can be seen by mean values as well as by maxima and minima. The results demonstrate how sensitively the estimated default probabilities depend on the recovery rates. For the unrealistic case of a zero recovery rate, the average default probability is about 3.5%, whereas for a recovery rate of 67% we obtain an average default probability of about 10%. For the zero recovery rate, the highest value is 16.49 % and the lowest is 0.47%. For a recovery rate of 67% the respective values are 49.6% and 1.41%. The maximum value results for Ecuador at the beginning of 2003 and the minimum value for Poland at the beginning of 2007. It should be men-tioned that the estimated default probabilities typically rise considerably shortly before the default occurs (see Karmann and Maltritz, 2004), whereas here we consider the values estimated at the beginning of the year in which the default occurs. The observed defaults, however, typically occurred later in the year or even close to the end of the year.
Table 4: Descriptive statistics of risk measures Maximum Minimum Mean/Median*
Reduced Form Model (RR=0) 16.49% 0.47% 3.46%Reduced Form Model (RR=33%) 24.73% 0.71% 5.19%Reduced Form Model (RR=50%) 32.97% 0.94% 6.92%Reduced Form Model (RR=67%) 49.46% 1.41% 10.38%
Rating CCC+(negative) A(stable) BB+(stable) * For the reduced form models we report the mean, whereas for the ratings we report the median, because of the ordinal scaling of ratings.
Table 4 also presents an overview of the S&P ratings in the sample.
As for the default probabilities we consider the ratings assigned at the begin-ning of each year. Although ratings are ordinal values we can calculate the
Alexander Karmann, Dominik Maltritz - Evaluation and Comparison of Market and Rating Based Country Default Risk Assessment – Frontiers in Finance and Economics – Vol. 7 No.1 – April 2010, 34 - 59
48
averages by considering the numerical values resulting from the transforma-tion displayed in columns 2 of table 2. The median of all ratings in the sample assigned at the beginning of an observation period was BB+ with a stable outlook. The best one was A (stable), which was observed for China at the beginning of 2007. The worst rating was CCC+ with a negative outlook, which was observed for Venezuela at the beginning of 2003. 3.3 Evaluation results I: Default probabilities and the QPS
In this paper we evaluate the risk measures by considering the fore-cast accuracy. We compare the risk estimations produced for each sample period (at the beginning of this period) with the realization of default and non default in this period in the respective country. In our first evaluation ap-proach we consider the derived default probabilities. We analyze the results for different periods and countries using the quadratic probability score, as given by formula (5):
]2,0[)CDPoD(2N
1QPS
N
1n
2nn
. (5)
The QPS is something similar to the mean squared error, where forecasted and realized values of a quantity are considered. Since the default probability is even ex-post unobservable, instead of the default probability a dummy vari-able, CDn, is included in the QPS. This dummy takes the value one if default has occurred in the forecast period and zero otherwise. The difference be-tween this dummy and the estimated default probabilities, PoDn, is calculated for all N = 133 observed pairs of default probabilities and dummies in the sample. We obtain the QPS by averaging these differences and multiplying them by two. Possible values for the QPS are in the interval between zero and two, whereby smaller values indicate better results then higher ones. The results are shown in table 5. Whereas we obtain quite similar QPS values for the market based models, the lowest QPS results for the re-duced form model with a recovery rate of zero. Since a recovery rate of zero leads to the lowest default probabilities, this result may be driven by the fea-tures of the considered data set, with just six default events out of 133 obser-vations. Hence, one may ask whether a naive optimistic forecast, saying de-fault probability of zero in any case, may work out better than the more com-plex risk models. This is, however, not the case for the market based default probabilities. The ratings, however, do worse than the naïve forecast.
Alexander Karmann, Dominik Maltritz - Evaluation and Comparison of Market and Rating Based Country Default Risk Assessment – Frontiers in Finance and Economics – Vol. 7 No.1 – April 2010, 34 - 59
49
Overall the QPS values are quite low, compared to results of preview studies. Berg and Pattillo (1999), for example, obtain QPS values between 0.226 and 0.267 using probit models and the signal approach respectively in an in-sample estimation. For out-of-sample estimations their results are even worse. However, although such a comparison with other studies is interesting, it should be handled with care, since different samples, forecast intervals and even types of crises are considered. Berg and Pattillo focus on currency crises. If we assume that the differences in the results are not only due to differences in the sample and forecast intervals, they could be interpreted in two ways. On the one hand, it could mean that the risk measures developed for debt crisis are superior to currency crisis models, or, on the other, that debt crises are easier to foresee.
Reduced Form Model (RR = 0) 0.080 0.032Reduced Form Model (RR = 33%) 0.081 0.035Reduced Form Model (RR = 50%) 0.080 0.040Reduced Form Model (RR = 67%) 0.088 0.056
Ratings 0.092 0.049
The QPS value for ratings is slightly worse than the results for market data based risk assessment with our simple reduced form model(s). This may be interpreted as evidence that market based risk assessment is superior. One may argue, however, that rating agencies consider outright defaults only, wherefore the inclusion of quasi defaults indicated by IMF help distorts the results. To check the robustness of our results, we also evaluate the risk meas-ures by considering only the three de-jure defaults indicated by Standard and Poors. Since the observations in default periods and post-default periods for the other three countries are considered as non default periods, the number of observations increases to 176. The third column in table 5 reports the QPS values. The QPS values decrease for all risk measures, whereby the reduced form models except for this with a recover rate of 67% do better then ratings. Even if only 3 (de-jure) defaults are considered the naïve forecast is outper-formed by the reduced form model with a recovery rate of zero. As explained in section 2.2, the results for ratings have to be handled with care because of the described problems when transforming ratings into default probabilities according to observed default frequencies. Since these
Alexander Karmann, Dominik Maltritz - Evaluation and Comparison of Market and Rating Based Country Default Risk Assessment – Frontiers in Finance and Economics – Vol. 7 No.1 – April 2010, 34 - 59
50
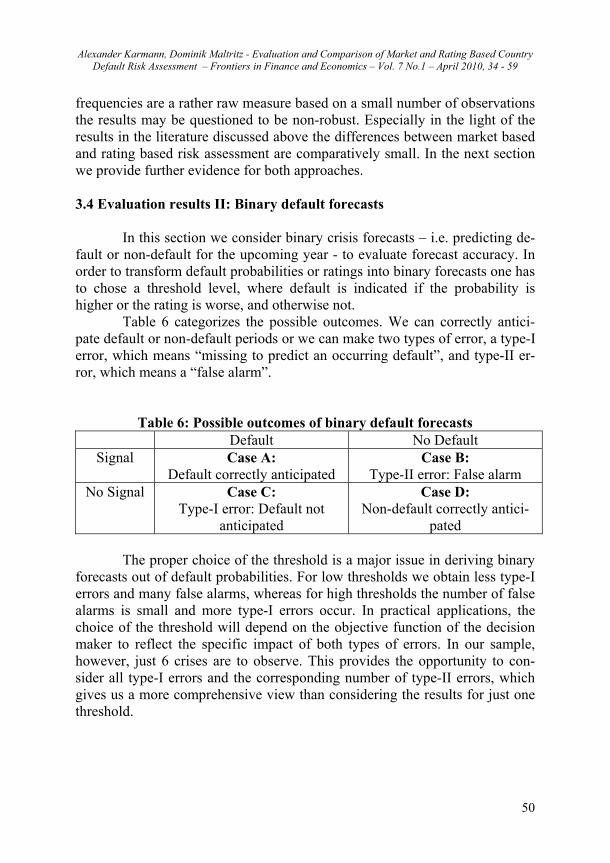
frequencies are a rather raw measure based on a small number of observations the results may be questioned to be non-robust. Especially in the light of the results in the literature discussed above the differences between market based and rating based risk assessment are comparatively small. In the next section we provide further evidence for both approaches. 3.4 Evaluation results II: Binary default forecasts
In this section we consider binary crisis forecasts – i.e. predicting de-
fault or non-default for the upcoming year - to evaluate forecast accuracy. In order to transform default probabilities or ratings into binary forecasts one has to chose a threshold level, where default is indicated if the probability is higher or the rating is worse, and otherwise not. Table 6 categorizes the possible outcomes. We can correctly antici-pate default or non-default periods or we can make two types of error, a type-I error, which means “missing to predict an occurring default”, and type-II er-ror, which means a “false alarm”.
Table 6: Possible outcomes of binary default forecasts Default No Default
Signal Case A: Default correctly anticipated
Case B: Type-II error: False alarm
No Signal Case C: Type-I error: Default not
anticipated
Case D: Non-default correctly antici-
pated
The proper choice of the threshold is a major issue in deriving binary forecasts out of default probabilities. For low thresholds we obtain less type-I errors and many false alarms, whereas for high thresholds the number of false alarms is small and more type-I errors occur. In practical applications, the choice of the threshold will depend on the objective function of the decision maker to reflect the specific impact of both types of errors. In our sample, however, just 6 crises are to observe. This provides the opportunity to con-sider all type-I errors and the corresponding number of type-II errors, which gives us a more comprehensive view than considering the results for just one threshold.
Alexander Karmann, Dominik Maltritz - Evaluation and Comparison of Market and Rating Based Country Default Risk Assessment – Frontiers in Finance and Economics – Vol. 7 No.1 – April 2010, 34 - 59
51
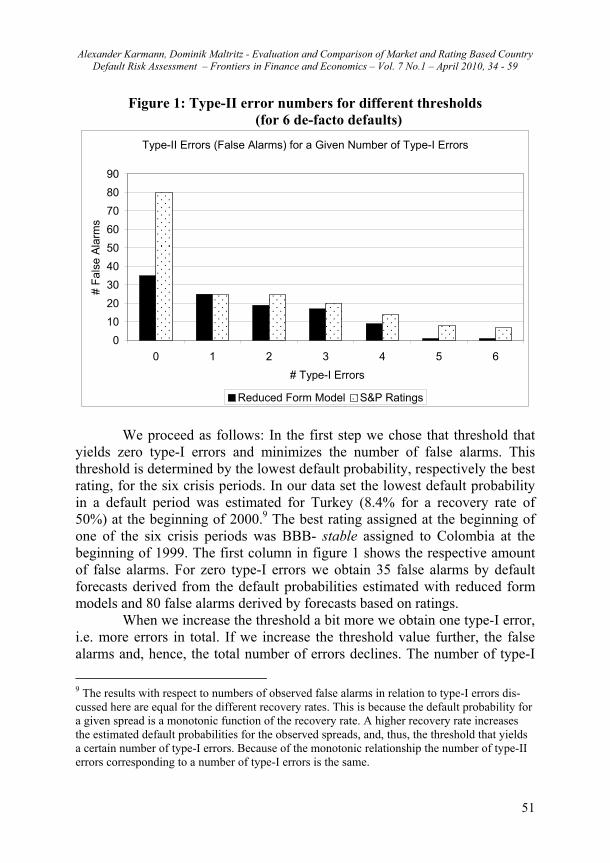
Figure 1: Type-II error numbers for different thresholds (for 6 de-facto defaults)
Type-II Errors (False Alarms) for a Given Number of Type-I Errors
0
10
20
30
40
50
60
70
80
90
0 1 2 3 4 5 6
# Type-I Errors
# F
alse
Ala
rms
Reduced Form Model S&P Ratings We proceed as follows: In the first step we chose that threshold that
yields zero type-I errors and minimizes the number of false alarms. This threshold is determined by the lowest default probability, respectively the best rating, for the six crisis periods. In our data set the lowest default probability in a default period was estimated for Turkey (8.4% for a recovery rate of 50%) at the beginning of 2000.9 The best rating assigned at the beginning of one of the six crisis periods was BBB- stable assigned to Colombia at the beginning of 1999. The first column in figure 1 shows the respective amount of false alarms. For zero type-I errors we obtain 35 false alarms by default forecasts derived from the default probabilities estimated with reduced form models and 80 false alarms derived by forecasts based on ratings.
When we increase the threshold a bit more we obtain one type-I error, i.e. more errors in total. If we increase the threshold value further, the false alarms and, hence, the total number of errors declines. The number of type-I
9 The results with respect to numbers of observed false alarms in relation to type-I errors dis-cussed here are equal for the different recovery rates. This is because the default probability for a given spread is a monotonic function of the recovery rate. A higher recovery rate increases the estimated default probabilities for the observed spreads, and, thus, the threshold that yields a certain number of type-I errors. Because of the monotonic relationship the number of type-II errors corresponding to a number of type-I errors is the same.
Alexander Karmann, Dominik Maltritz - Evaluation and Comparison of Market and Rating Based Country Default Risk Assessment – Frontiers in Finance and Economics – Vol. 7 No.1 – April 2010, 34 - 59
52
errors, however, remains unchanged as long as we chose a threshold below the second lowest default probability observed in one of the six crisis periods (which was 10.1% observed in Brazil at the beginning of 1998) or the second best rating in a crisis period (which was BB- negative assigned to Russia at the beginning of 1998). For these values we stick with one type-I error and obtain the minimum amount of false alarms given that there is no more than one type-I error. These are 25 errors for both default probabilities and ratings.
In this way we proceed to derive the minimum number of false alarms corresponding to every possible number of type-I errors. The results in figure 1 show that, of course, the number of false alarms is decreasing with more type-I errors. Except for the second lowest threshold, which yields one type-I error, ratings perform worse than market based risk assessment based on re-duced form models. Contrary to the QPS values we observe considerable differences in the error numbers of binary forecasts. This indicates that (bi-nary) default forecasts derived from default probabilities do better in predict-ing defaults then default forecasts based on ratings.
Since the literature (see, e.g., Kaminsky et al, 1997) often discusses the noise to signal ratio (NtSR) instead of the error numbers, we also report the results with respect to this ratio. The NtSR is calculated by:
CAA
DBB
NtSR
. (6)
It relates two single ratios. The first is the number of false alarms to possible false alarms, which means periods without crisis, B/(B+D). The second is the number of type-I errors to possible type-I errors, which means default periods, i.e. A/(A+C). The NtSR is a condensed measure that assesses the forecast accuracy by comparing the relative number of false alarms to the relative number of type-I errors, i.e. the missing of a crisis that actually happened. Both types of errors are related to the number of periods where it was possible to make the corresponding error, i.e. the number of non default and default periods, respectively. Also the NtSR depends on the threshold chosen since the number of errors of the respective type depends on the value of the threshold. Whereas in practical applications the threshold should depend on the objective function, in the scientific literature that threshold is chosen that minimizes the NtSR (see, e.g., Kaminsky et.al.). Often only the results for this single threshold are reported. In the present paper, we provide additional in-formation by reporting the noise to signal ratio for alternative thresholds. The
Alexander Karmann, Dominik Maltritz - Evaluation and Comparison of Market and Rating Based Country Default Risk Assessment – Frontiers in Finance and Economics – Vol. 7 No.1 – April 2010, 34 - 59
53
numbers for alternative threshold values are shown in figure 2. In comparing the risk measures, we obtain a similar ranking of different approaches to risk assessment to those obtained by looking on the error numbers.
Figure 2: Noise to signal ratios for different thresholds (for 6 de-facto defaults)
Noise to Signal Ratio for a Given Number of Type-I Errrors
0
0.1
0.2
0.3
0.4
0.5
0.6
0.7
0 1 2 3 4 5
# Type-I Errors
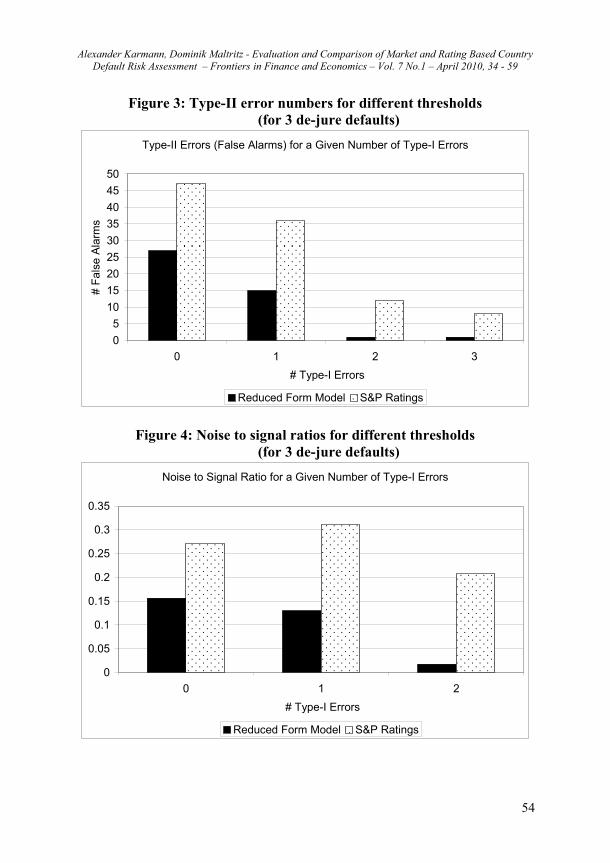
Reduced Form Model S&P Ratings As for the default probabilities, we also check for the binary forecasts the robustness of our results for the modified sample, where only the three defaults indicated by S&P are considered and the respective observations for the other three countries are understood as non default periods. As can be seen in figure 3, the market based risk measures derived with reduced form models again do better than ratings. The differences in the type-II error numbers are even higher.
Alexander Karmann, Dominik Maltritz - Evaluation and Comparison of Market and Rating Based Country Default Risk Assessment – Frontiers in Finance and Economics – Vol. 7 No.1 – April 2010, 34 - 59
54
Figure 3: Type-II error numbers for different thresholds (for 3 de-jure defaults)
Type-II Errors (False Alarms) for a Given Number of Type-I Errors
0
5
10
15
20
25
30
35
40
45
50
0 1 2 3
# Type-I Errors
# F
alse
Ala
rms
Reduced Form Model S&P Ratings
Figure 4: Noise to signal ratios for different thresholds (for 3 de-jure defaults)
Noise to Signal Ratio for a Given Number of Type-I Errors
0
0.05
0.1
0.15
0.2
0.25
0.3
0.35
0 1 2
# Type-I Errors
Reduced Form Model S&P Ratings
Alexander Karmann, Dominik Maltritz - Evaluation and Comparison of Market and Rating Based Country Default Risk Assessment – Frontiers in Finance and Economics – Vol. 7 No.1 – April 2010, 34 - 59
55
4 – Conclusion
During the last decades a broad strand of literature developed on the issue of assessing country default risk. Thereby different approaches are ap-plied, which rely either on observable determinants of default risk, mainly economic or socio-political variables, or on observable effects, as prices of default risky securities. However, only a few papers exist, which focus on evaluating and comparing different risk assessments. Our paper contributes by evaluating and comparing country risk assessments that are based on two different approaches using the same data sample. We compare ratings with default probabilities derived from market data using reduced form credit risk models. Ratings result from qualitative and subjective judgments of agencies about potential causes of defaults. The data underlying the market approach, by contrast, are observable market reactions on defaults risk. We compare these different approaches by considering the forecast accuracy. The ratings used in our analysis are provided by Standard and Poor’s – one of the world leading rating agencies. As market based risk assessment we use default probabilities derived from market data of government bonds. The input data are sovereign yield spreads provided by JP Morgan in its Emerging Market Bond Index+. To derive default probabilities from observed spreads we use a simple reduced form model. We avoid the problem of esti-mating the recovery rate by considering the results for a variety of possible values.
Whereas in the early nineties traded bonds existed only for a couple of emerging market countries, data on bonds for a broader sample of develop-ing countries became available during the last decade. Similarly also the number of countries rated by Standard and Poor’s has increased. This enables us to analyze data of 19 countries for which the EMBI+ spreads exist from 1998 onward. To evaluate the different risk measures we focus on forecast accuracy. This means we compare risk measures valid for a certain forecast period with the realization of default and non-default in this period. We consider forecasts for one year and annual default probabilities, given at the beginning of the respective year. We exclude observations for which the considered country was already in default at the beginning of the year, since we aim to forecast the occurrence of defaults and not the probability of remaining in a crisis state. Thus, the evaluation is based on 133 annual observations of the different risk measures and the corresponding default/non-default observations. We use two different methods to evaluate the forecast accuracy of the two risk measures. The first is based on directly considering estimated default
Alexander Karmann, Dominik Maltritz - Evaluation and Comparison of Market and Rating Based Country Default Risk Assessment – Frontiers in Finance and Economics – Vol. 7 No.1 – April 2010, 34 - 59
56
probabilities, which are derived from market data, on the one hand, and (em-pirical default frequencies of) ratings, on the other. The second evaluation approach considers binary default forecasts, i.e. default/non-default. Our mar-ket based risk assessment yield slightly better results than S&P ratings when we compare the default probabilities. Here, the results are aggregated using the Quadratic Probability Score (QPS). With respect to binary forecasts, the market based risk measures considerably outperform ratings. Thus, in improv-ing the existing risk management systems it seems to be a promising approach to estimate default risk from observed market data. Here, the use of more complex models and approaches for their estimation may yield further im-provements. References Andritzky, J. R., 2004. Analyzing the Default Risk of Sovereign Bonds: An
Application of the Kalman Filter on Russian and Turkish Bonds. Uni-versity of St. Gallen working paper.
Aurora, D., R. Schneck and D. Vazza, 2006. Annual 2005 Global Corporate Default Study and Rating Transitions, Standard and Poor’s Fixed In-come Research.
Avramovic, D., et al., 1964. Economic Growth and External Debt. (Johns Hopkins Press, Baltimore ).
Atkeson, A., 1991. International Lending with Moral Hazard and Risk of Re-pudiation. Econometrica, 59, 1069-1090.
Berg, A. and C. Pattillo, 1999. Predicting Currency Crises: The Indicators Approach and an Alternative. Journal of International Money and Fi-nance, 18, 561-586.
Bhatia, A. V., 2002. Sovereign Credit Ratings Methodology: An Evaluation. IMF-Working Paper 170.
Biermann, H. Jr. and J. H. Hass, 1975. An Analytic Model of Bond Risk Dif-ferentials. Journal of Financial and Quantitative Analysis, 10, 757-773.
Black, F. and J. Cox, 1976. Valuing Corporate Securities: Some Effects of Bond Indenture Provisions. Journal of Finance, 31, 351-367.
Bulow, J. and K. Rogoff, 1989. LDC Debt: Is to Forgive to Forget?. American Economic Review, 79, 43-50.
Cantor, R., K. Emery, V. Truglia and A. Zazzarelli, 2007. Sovereign Default and Recovery Rates. Moody’s Special Comment.
Alexander Karmann, Dominik Maltritz - Evaluation and Comparison of Market and Rating Based Country Default Risk Assessment – Frontiers in Finance and Economics – Vol. 7 No.1 – April 2010, 34 - 59
57
Chambers, J., J. Ontko and D. T. Beers, 2007. Sovereign Default and Rating Transition Data. Standard and Poor’s Research.
Clark, E. A., 1997. International Finance. (Thomson, London). Diaz-Alejandro, C. F., 1984. Latin American Debt: I Don’t Think We Are in
Kansas Anymore. Brookings Papers on Economic Activity, 2, 335-403.
Cole, H. L., J. Dow and W. B. English, 1995. Default, Settlement and Signal-ing: Lending Resumption in a Reputation Model of Sovereign Debt. International Economic Review, 36, 365-385.
Domar, E., 1950. The Effects of Investment on the Balance of Payments. American Economic Review, 40, 798-27.
Duffee, G. R., 1999. Estimating the Price Risk of Default. Review of Finan-cial Studies, 12, 197-226.
Duffie, D. and K. J. Singleton, 1999. Modeling Term Structures of Default-able Bonds. The Review of Financial Studies, 12, 687-720.
Duffie, D., L. H. Pedersen and K. J. Singleton, 2003. Modeling Sovereign Yield Spreads: A Case Study of Russian Debt. The Journal of Fi-nance, 58, 119-159.
Eaton, J. and M. Gersovitz, 1981. Debt with Potential Repudiation: Theoreti-cal and Empirical Analysis. Review of Economic Studies, 48, 289-309.
Eaton, J., M. Gersovitz and J. E. Stiglitz, 1986. The Pure Theory of Country Risk. European Economic Review, 30, 481-513.
Eaton, J. and R. Fernandez, 1995. Sovereign Debt. NBER Working Paper 5131.
Geske, R., 1977. The Valuation of Corporate Liabilities as Compound Op-tions. Journal of Financial and Quantitative Analysis, 12, 541-552.
Grossman, H. I. and J. B. van Huyck, 1988. Sovereign Debt as a Contingent Claim: Excusable Default, Repudiation and Reputation. American Economic Review, 78, 1088-1097.
Hilderman, M., 1999. Opening the Black Box: The Rating Committee Process at Moody’s. (Moody’s Investors Service, New York).
Huschens, S., A. Karmann, D. Maltritz and K. Vogl, 2007. Country Default Probabilities: Assessing and Backtesting. Journal of Risk Models Validation, 1, 3-26.
Jarrow, R. and S. Turnbull, 1995. Pricing Derivatives on Financial Securities subject to Credit Risk. Journal of Finance, 50, 53-85.
Alexander Karmann, Dominik Maltritz - Evaluation and Comparison of Market and Rating Based Country Default Risk Assessment – Frontiers in Finance and Economics – Vol. 7 No.1 – April 2010, 34 - 59
58
Jarrow, R., D. Lando and S. Turnbull, 1997. A Markov Modell for the Term Structure of Credit Risk Spreads. Journal of Financial Studies, 10, 481-523.
JP Morgan Securities Inc., 1995. Introducing the Emerging Market Bond In-dex +. New York. (via internet: http://www2.jpmorgan.com/MarketDataInd/EMBI/embi.html).
Kaminsky, G., S. Lizondo and C. M. Reinhart, 1997. Leading Indicators of Currency Crises. IMF-Working Paper 9/79.
Karmann, A. and D. Maltritz, 2004. Assessment of Sovereign Risk for South America: A Structural Approach. in: Frenkel, M., Karmann, A., Scholtens, B. (ed.), Sovereign Risk and Financial Crises. (Springer, Berlin – Heidelberg – New York), 51-74.
Keenan, S. C., L. V. Carty and I. Shtogrin, 1998. Historical Default Rates of Corporate Bond Issuers, 1920-1997. (Moody’s Investors Service, New York).
Keswani, A., 2000. Estimating a Risky Term Structure of Brady Bonds. Lan-caster University Management School Working Paper 28.
Lando, D., 1998. On Cox-Processes and Credit Risky Securities. Review of Derivatives Research, 2, 99-120.
Lehrbass, F. B., 2000. A Simple Approach to Country Risk. in: Franke, J., W. Härdle and G. Stahl (ed.), Meassuring Risk in Complex Stochastic Systems, (Springer, Berlin – Heidelberg - New York), 33-67.
Longstaff , F. and E. Schwartz, 1995. A Simple Approach to Valuing Risky Fixed and Floating Rate Debt. Journal of Finance, 50, 789-819.
Madan, D. B. and H. Unal, 1998. Pricing the Risks of Default. Review of De-rivatives Research, 2, 121-160.
Maltritz, D., 2006. Quantifizierung von Souveränrisiken. (Metropolis, Marburg). Manasse, P., N. Roubini and A. Schimmelpfennig, 2003. Predicting Sover-
eign Debt Crises. IMF-Working Paper 221. Merrick, J. J., 2001. Crisis Dynamics of Implied Default Recovery Ratios:
Evidence from Russia and Argentina. Journal of Banking and Fi-nance, 25, 1921-1939.
Poignant-Eng, C., 1992. Messung von Länderrisiken aufgrund von Finanz-marktdaten. PhD Thesis University of Zürich.
Reinhart, C. M., 2002. Default, Currency Crises and Sovereign Credit Rat-ings. NBER Working Paper 8738.
Alexander Karmann, Dominik Maltritz - Evaluation and Comparison of Market and Rating Based Country Default Risk Assessment – Frontiers in Finance and Economics – Vol. 7 No.1 – April 2010, 34 - 59
59
Saini, K. G. and P. S. Bates, 1978. Statistical Techniques for Determining Debt-Servicing Capacity for Developing Countries: Analytical Re-view of the Literature and Further Empirical Results. Federal Reserve Bank of New York – No. 7818.
Simonsen, M. H., 1985. The Developing Country Debt Problem. in: Smith, G. W. and J. T. Cuddington (ed.), International Debt an the Developing Countries. (World-Bank, Washington D.C.), 101-126.
Sy, A. N. R., 2004. Sovereign Ratings and Financial Crises. in: Frenkel, M., A. Karmann and B. Scholtens (ed.), Sovereign Risk and Financial Crises. (Springer, Berlin – Heidelberg – New York), 75-88.
Uhrig-Homburg, M., 2002. Valuation of Defaultable Claims: A Survey. Schmalenbach Business Review – Zeitschrift für betriebswirtschaftli-che Forschung, 54, 24-57.
Wade, M., 2003. Länderrisikoanalyse im Rahmen moderner Kreditrisikomo-delle bei Banken. (Peter Lang, Frankfurt).
Yawitz, E., 1977. An Analytic Model of Interest Rate Differentials and Dif-ferent Default Recoveries. Journal of Financial and Quantitative Analysis, 12, 481-490.