Evaluation of a Novel Hand Held Gamma Camera for Intra-operative Single Photon Emission Computed Tomography A Thesis Presented to The faculty of the School of Engineering and Applied Science University of Virginia In partial fulfillment of the requirements for the degree Master of Science by Surabhi Balagopal Nair December 2016
Transcript
Evaluation of a Novel Hand Held Gamma Camera for Intra-operative Single
Photon Emission Computed Tomography
A Thesis
Presented to
The faculty of the School of Engineering and Applied Science
University of Virginia
In partial fulfillment
of the requirements for the degree
Master of Science
by
Surabhi Balagopal Nair
December
2016
APPROVALSHEET
The thesis
is submitted in partial fulfillment of the requirements
for the degree of
Master of Science
The thesis has been read and approved by the examining committee:
Mark B. Williams Advisor
Craig H. Meyer
Lynn T. Dengel
Accepted for the School of Engineering and Applied Science:
Craig H. Benson, Dean, School of Engineering and Applied Science
December
2016
ABSTRACT
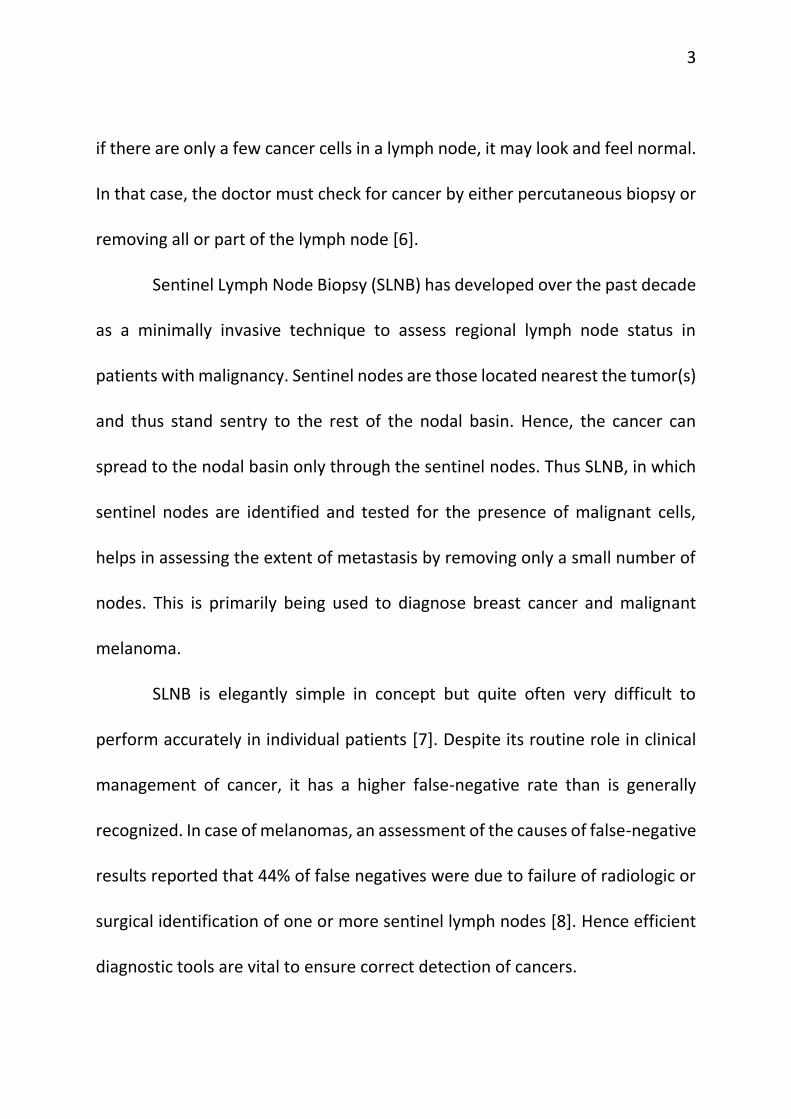
Cancer when detected at an early stage, before it has spread, can often
be treated successfully by surgery or local irradiation. However, when cancer is
detected only after it has metastasized, treatments are much less successful.
The lymphatic system is a primary path by which malignant cells can travel to
other organs in the body. Thus determination of the presence or absence of
malignant cells in lymph nodes to which a primary tumor drains is a key
component of cancer staging. Sentinel lymph node biopsy (SLNB) has been
developed over the past decade as a minimally invasive technique to assess
regional lymph node status in patients with malignancy.
Despite its routine role in clinical management of cancer, SLNB has a higher
false-negative rate (5- 10%) than is generally recognized. The current standard
of care in SLNB employs a non-imaging gamma probe to locate and excise the
sentinel nodes. We are exploring whether the use of a 3-D intraoperative
imaging system using a hand held gamma camera could provide advantages
compared to the use of the non-imaging probe. The 3-D intraoperative system
has been developed through a collaborative effort involving UVa, Dilon
Technologies Inc. (Newport News, Virginia), the Jefferson Lab (Newport News,
VA) and SurgicEye, (München, Germany).
iv
The system’s hand held camera has a circular field of view (FOV) of diameter
60 mm and comprises a pixelated NaI(Tl) crystal array coupled to an array of
silicon photomultipliers (SiPMs). In 3-D operation an optical tracking system
consisting of both visual and infrared (IR) cameras tracks the location and
orientation of the camera as it is moved by the surgeon. A fast iterative
reconstruction algorithm uses the streamed camera data to produce and display
the image of the nodes.
This thesis evaluates the 2-D and 3-D imaging performance of the hand
held gamma camera system. Performance metrics include energy resolution,
2D and 3D spatial resolution, gamma ray detection sensitivity, geometric
linearity, attenuation compensation, activity quantification accuracy, and the
effect of scatter radiation from the radiotracer injection site.
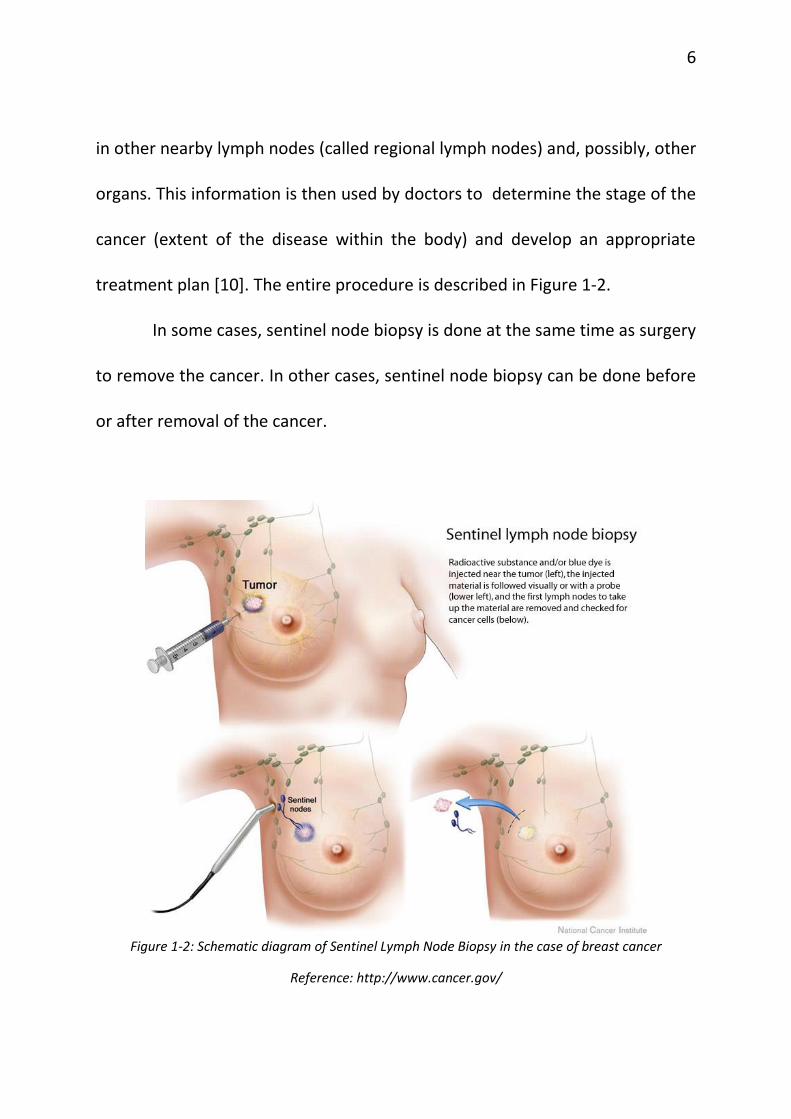
Chapter 1 gives an overview of the current practices of sentinel lymph
node biopsy and the various intra-operative surgical guidance modalities that
can be used for assistance in the detection of sentinel lymph nodes. This chapter
also throws light on some of the drawbacks associated with each of the
modalities. Chapter 2 gives a summary of some of the contemporary small
gamma cameras that have been developed and used for the detection of
cancerous masses and lesions. It also introduces the declipseSPECT system with
v
the gamma probe and the gamma camera, which forms the crux of this thesis.
Chapter 3 gives a detailed explanation of the performance evaluation
experiments that were carried out using this novel gamma camera. Chapter 4
concludes this thesis, summarizing the results and comparing them with the
other small gamma cameras. Chapter 5 briefly discusses the clinical studies
planned with the hand held SPECT system as the next step to validate the results
from this thesis.
ACKNOWLEDGMENT
I am very grateful to my adviser, Dr. Mark B. Williams for giving me the
opportunity to join his lab and fund me for the duration of the course. I thank
him for giving me this project, correcting me when I went the wrong way and
above all, teaching me how to do research in a scientific manner. He has been a
great motivator, helping me whenever I needed him. I would like to thank my
committee members, Dr. Craig Meyer for helping me with the ever important
statistical facet of research and Dr. Lynn Dengel for her enthusiasm and valuable
surgical point of view essential for this project. I thank my fellow lab-mates,
friends and family for giving me the support and encouragement, especially
when things hit a roadblock. They showed me the brighter side of the picture.
vii
TABLE OF CONTENTS Chapter 1 .............................................................................................. 1
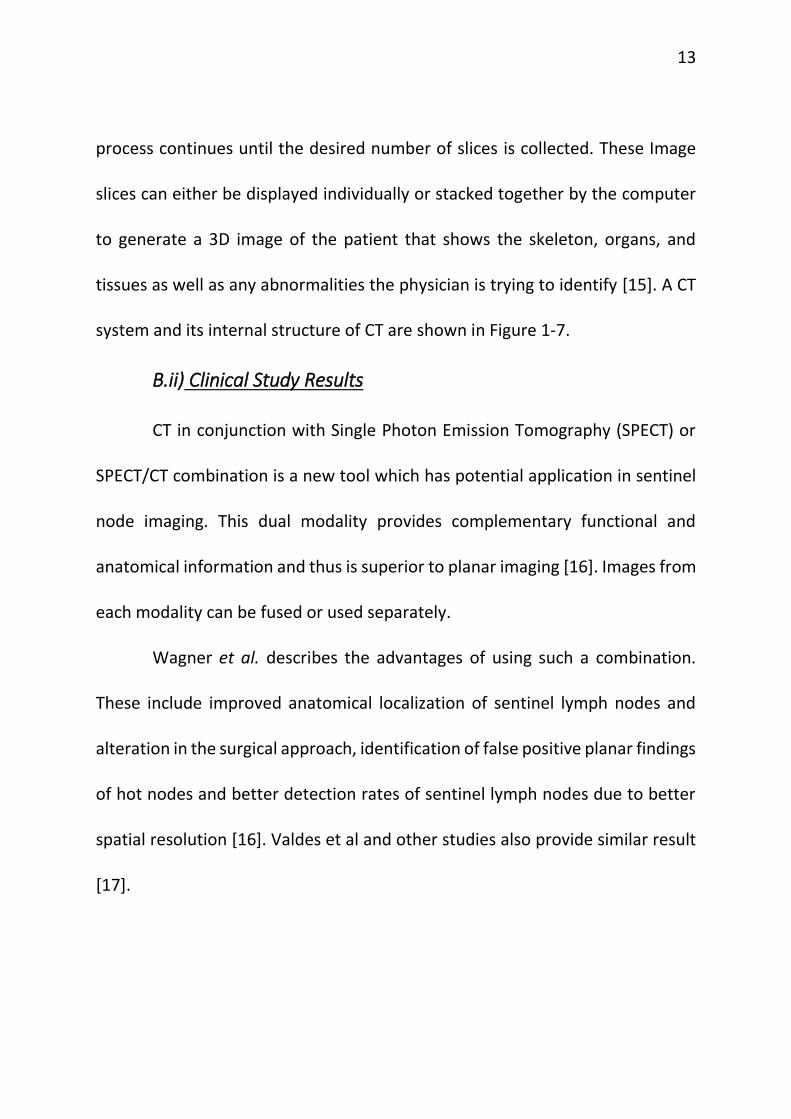
FIGURE 1-7: A GENERAL ELECTRIC CT SCANNER; THE INTERNAL COMPONENTS OF A CT SCANNER ................... 14
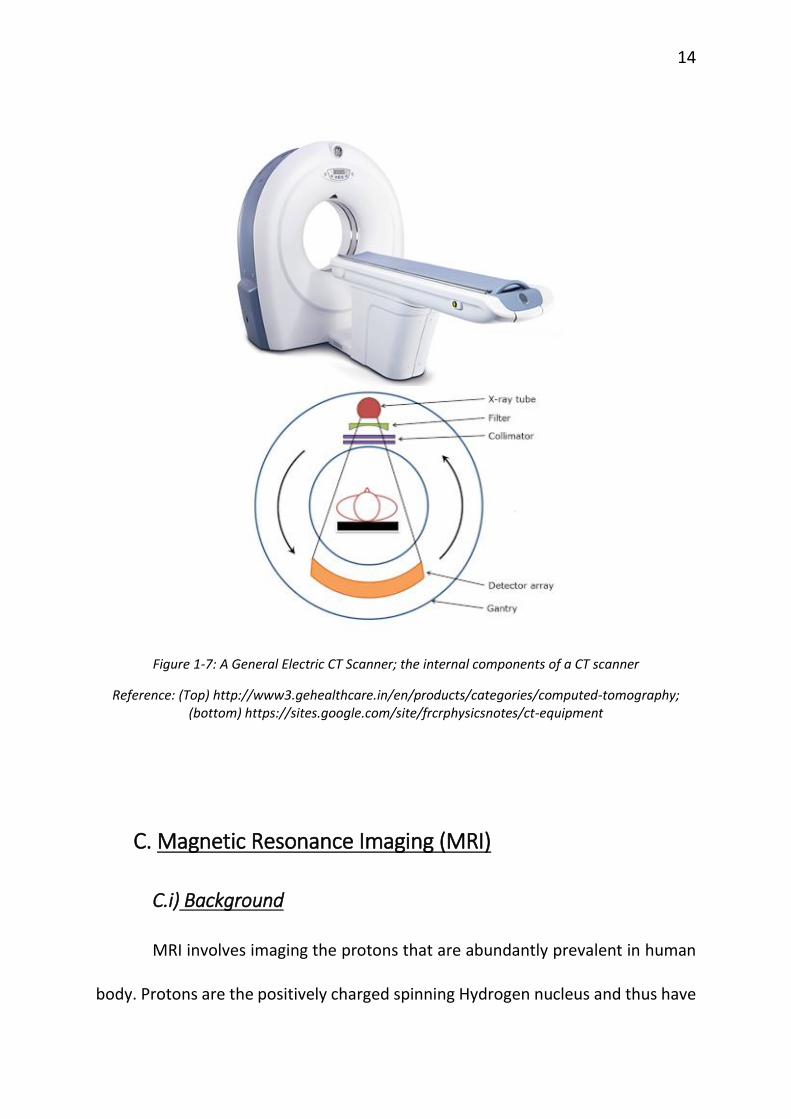
FIGURE 1-8: A) RANDOM ALIGNMENT OF HYDROGEN NUCLEI IN THE ABSENCE OF AN EXTERNAL MAGNETIC
FIELD. B) IN THE PRESENCE OF STRONG MAGNETIC FIELD B1, THE NUCLEI PRECESS IN THE DIRECTION OF
THE FIELD ................................................................................................................................................... 15
FIGURE 1-9: IMAGES OBTAINED USING MRI MODALITY ...................................................................................... 16
MAPPING IN SWINE ................................................................................................................................... 21
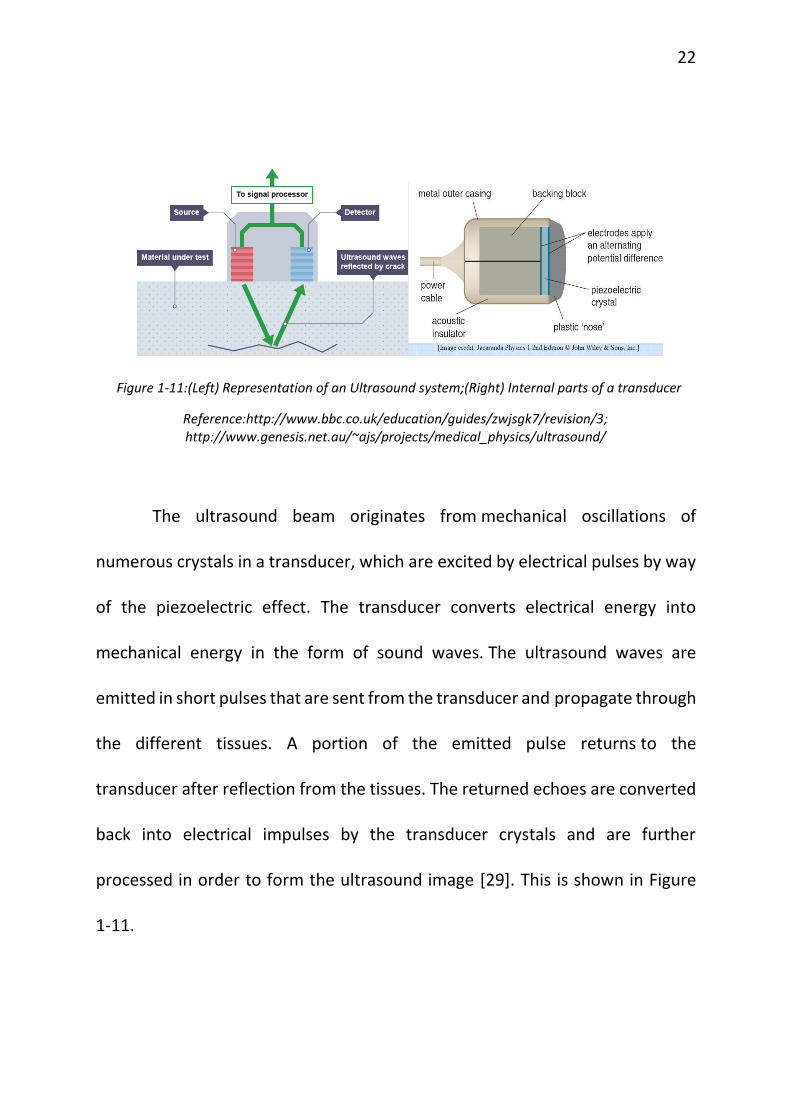
FIGURE 1-11:(LEFT) REPRESENTATION OF AN ULTRASOUND SYSTEM;(RIGHT) INTERNAL PARTS OF A
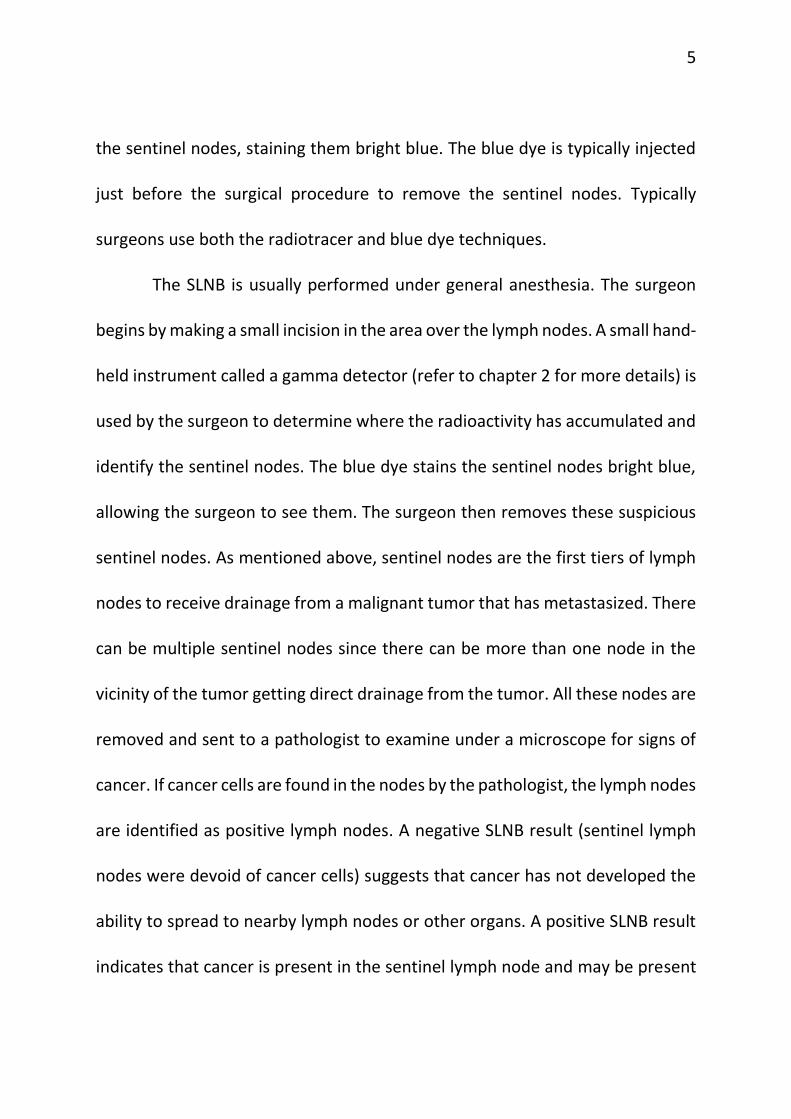
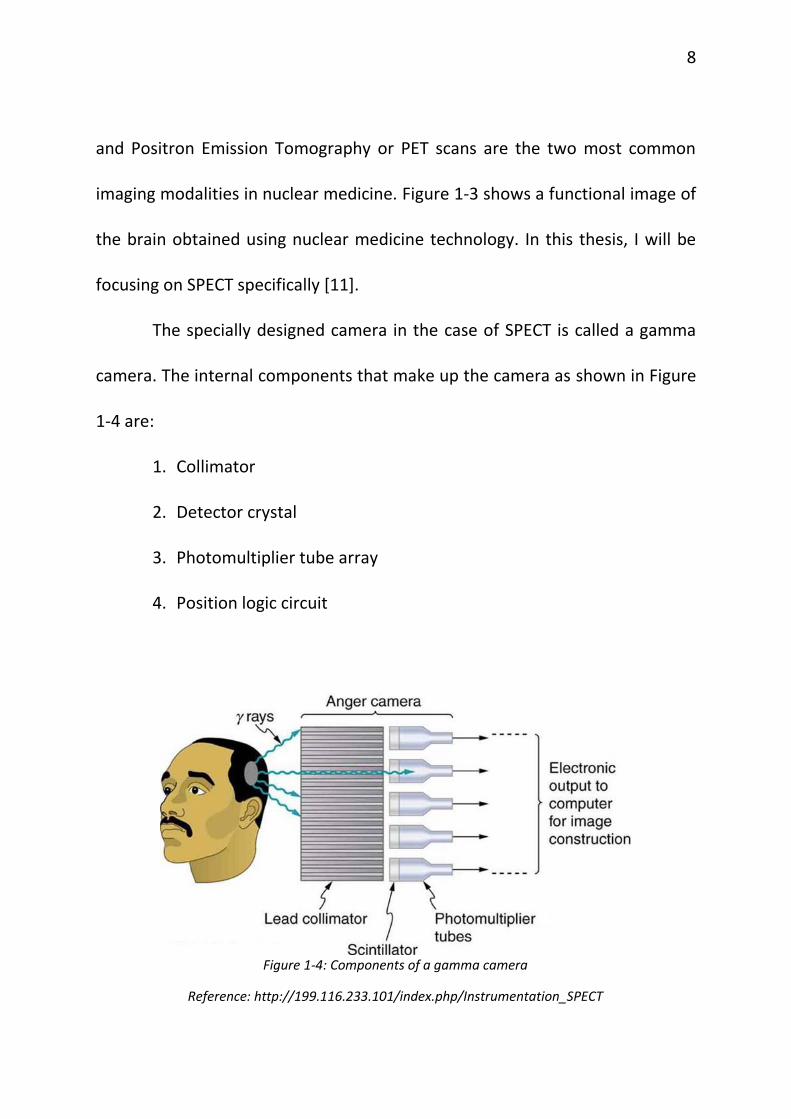
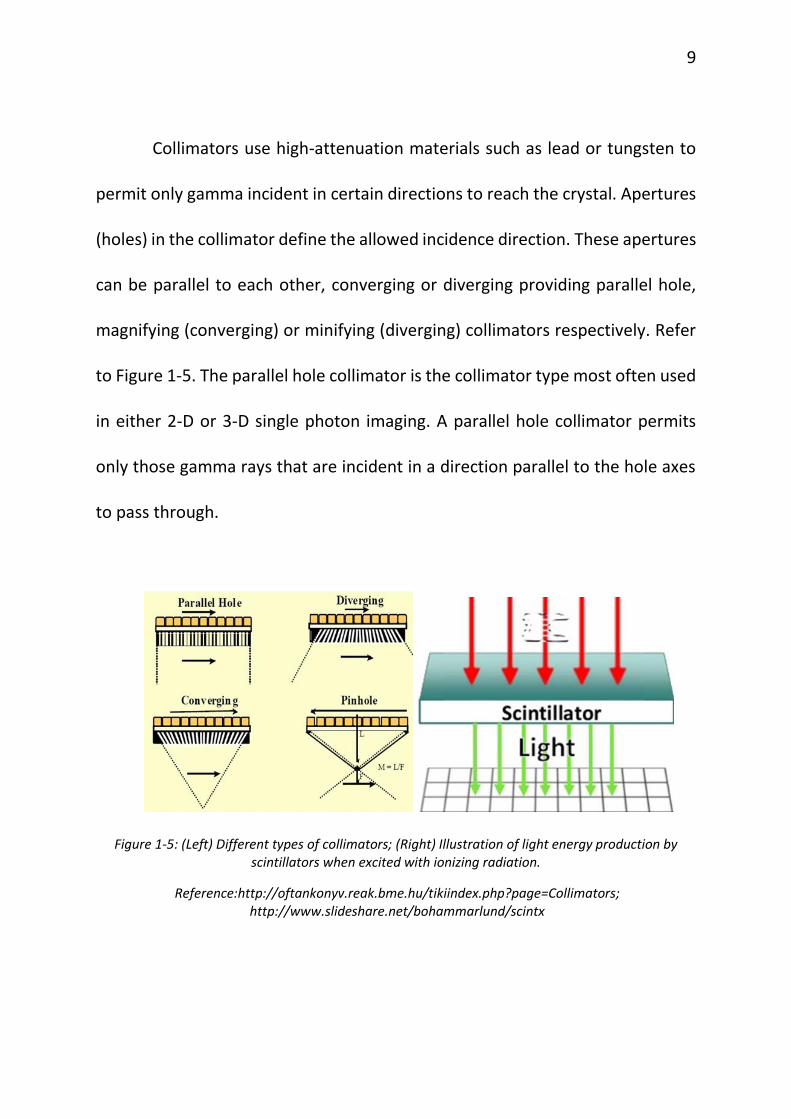
Collimators use high-attenuation materials such as lead or tungsten to
permit only gamma incident in certain directions to reach the crystal. Apertures
(holes) in the collimator define the allowed incidence direction. These apertures
can be parallel to each other, converging or diverging providing parallel hole,
magnifying (converging) or minifying (diverging) collimators respectively. Refer
to Figure 1-5. The parallel hole collimator is the collimator type most often used
in either 2-D or 3-D single photon imaging. A parallel hole collimator permits
only those gamma rays that are incident in a direction parallel to the hole axes
to pass through.
Figure 1-5: (Left) Different types of collimators; (Right) Illustration of light energy production by scintillators when excited with ionizing radiation.
a small magnetic field due to their spin and charge. Thus when a human body is
placed in a large magnetic field, many of the free hydrogen nuclei align themselves
with the direction of the magnetic field (Figure 1-8). The nuclei precess about the
magnetic field direction like gyroscopes. This behavior is termed Larmor
precession [18].
Figure 1-8: a) Random alignment of hydrogen nuclei in the absence of an external magnetic field. b) In the presence of strong magnetic field B1, the nuclei precess in the direction of the field
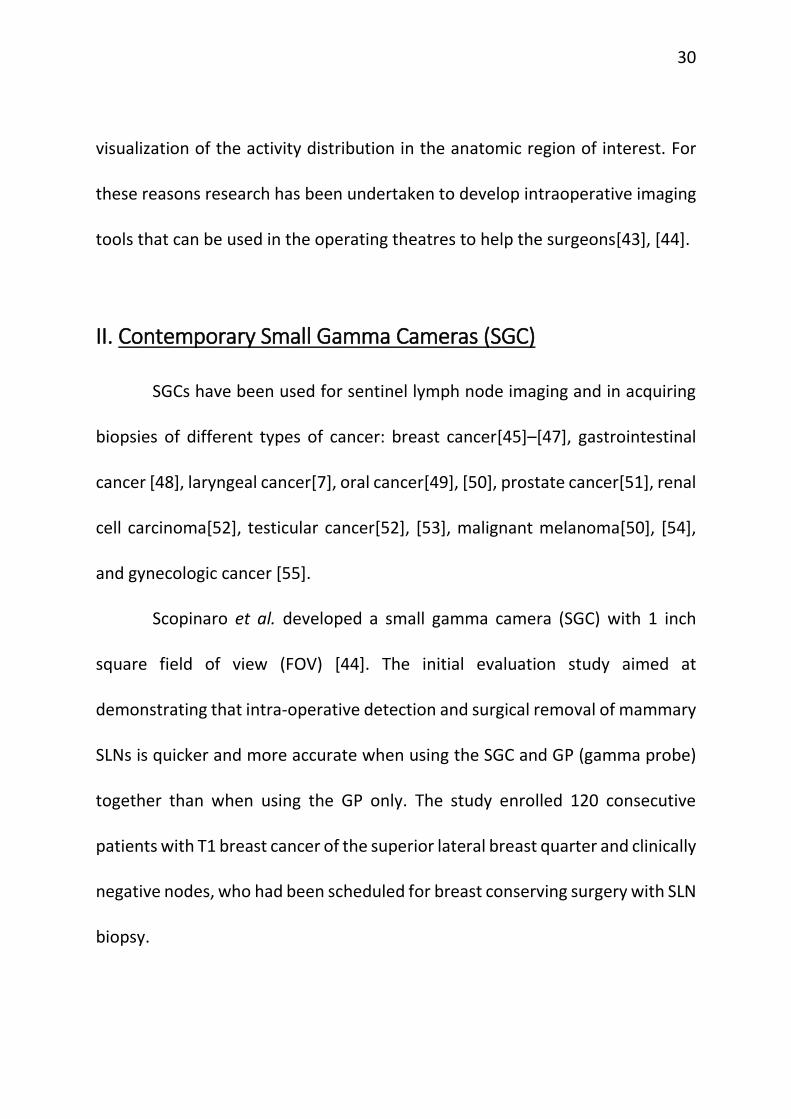
followed by ADCs, and a notebook computer serving as the acquisition console,
display, archive, and data processor for image revision. The spatial resolution
was calculated to be 3 mm at 1 cm distance from the source with an energy
window of 10% centered at the 140-keV peak.
a. b.
c. d.
Figure 2-1: a. Photo of the camera and control computer used in the study of reference [44]; b. the detector alone; c. conventional large FOV Anger camera image showing a single node (solid arrow)
and the injection site (dashed arrow); d. SGC image correctly showing 3 SNs (solid arrows)
32
The study showed that using the SGC, a larger number of sentinel nodes
was found. Figure 2-1 shows the SGC used in this study. All the three SLNs were
clearly seen while using the SGC whilst only one SLN was visible in case of Anger
camera image. When considering patients with more than one SLN, average
biopsy time was much shorter when both the SGC and the GP were used (6.0
minutes ± 2.8 minutes) than in cases where only the GP (10.29 minutes ± 4.9
minutes) was used [44].
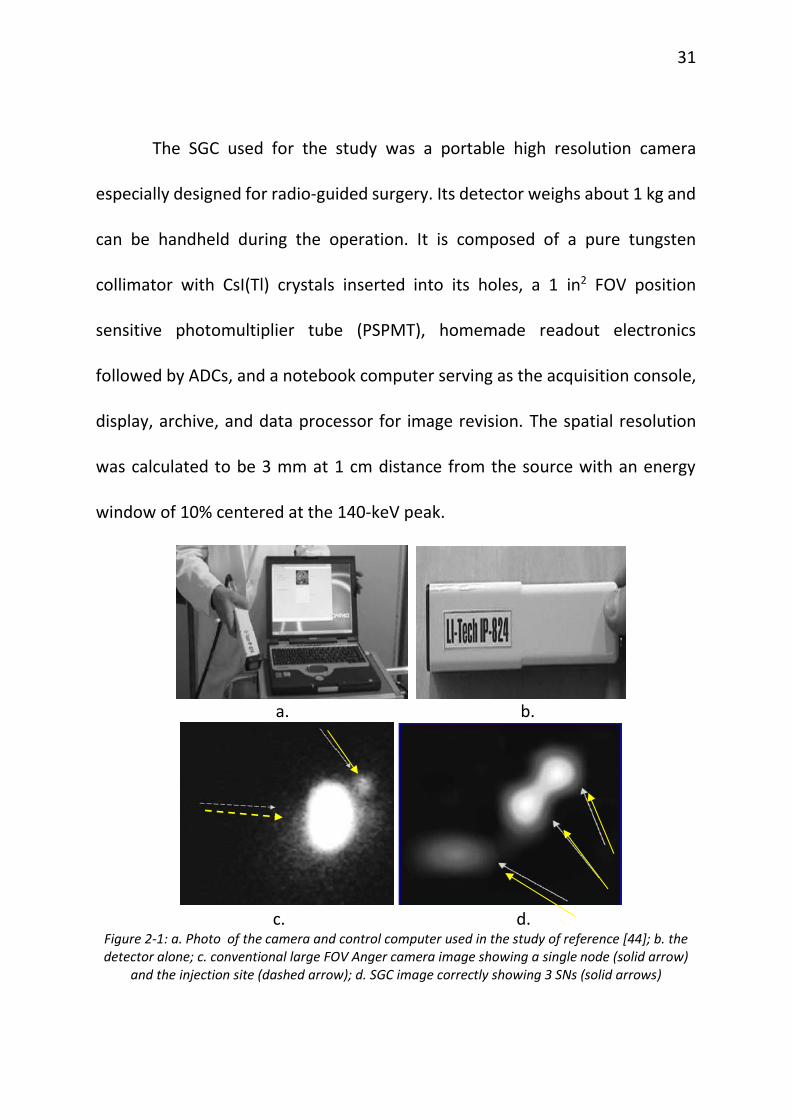
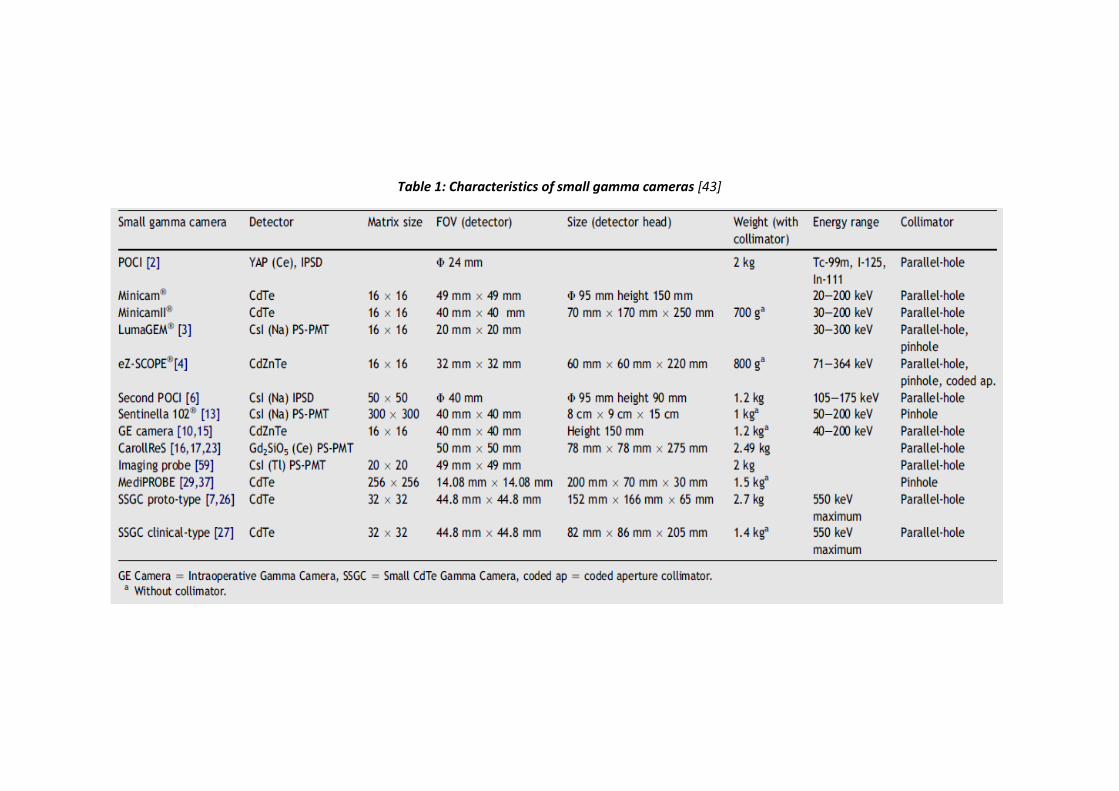
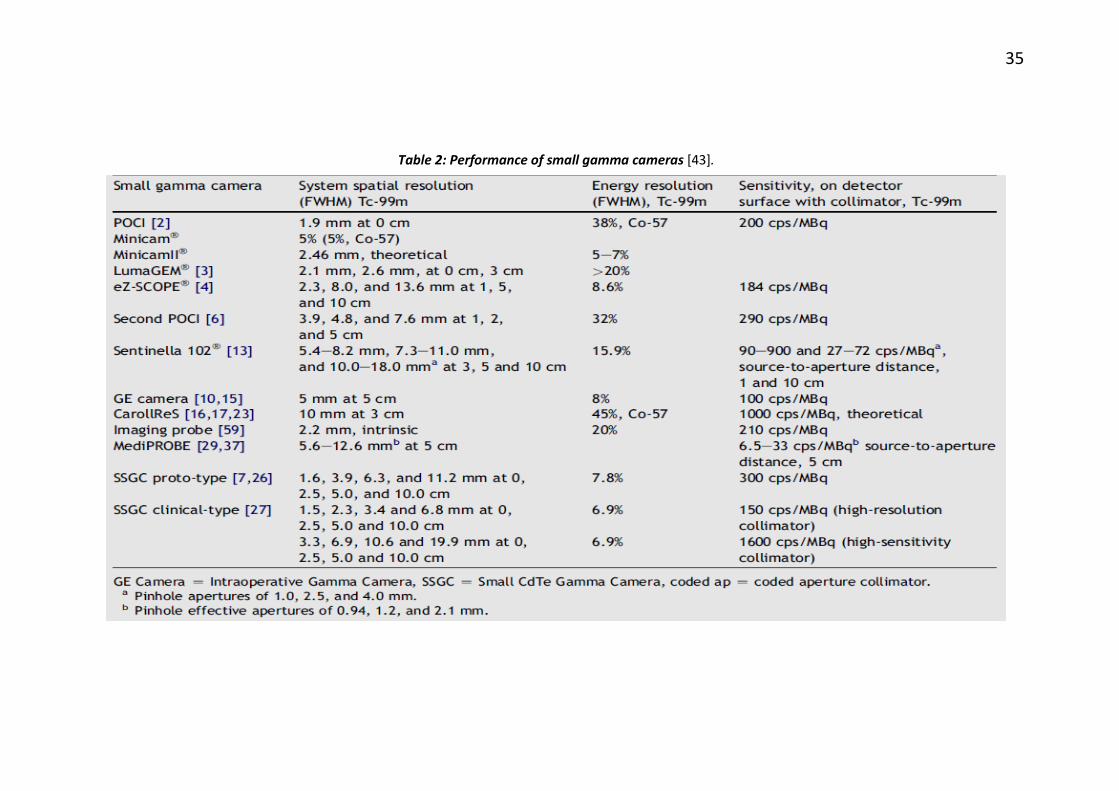
Tsuchimochi et al. have described several developmental and
commercially available SGCs [43]. Some of them are shown in Figure 2-2. Table
1 lists a number of SGCs along with some of their physical characteristics. Table
2 compares the performances of these SGCs on the basis of metrics like spatial
resolution, energy resolution and sensitivity.
a. b.
c. d.
Figure 2-2: a. The Small CdTe Gamma Camera system is composed of: detachable detector head which is mounted on the articulating arm, control unit, and power supply on the mobile cabinet;
b. Minicam II camera head (CdTe detector); c. (top) Bottom view of the MediPROBE head, c. (bottom) Open view of the disassembled MediPROBE compact gamma camera head without
the lead shield; d. MediPROBE mounted on an articulating arm [43].
Table 1: Characteristics of small gamma cameras [43]
35
Table 2: Performance of small gamma cameras [43].
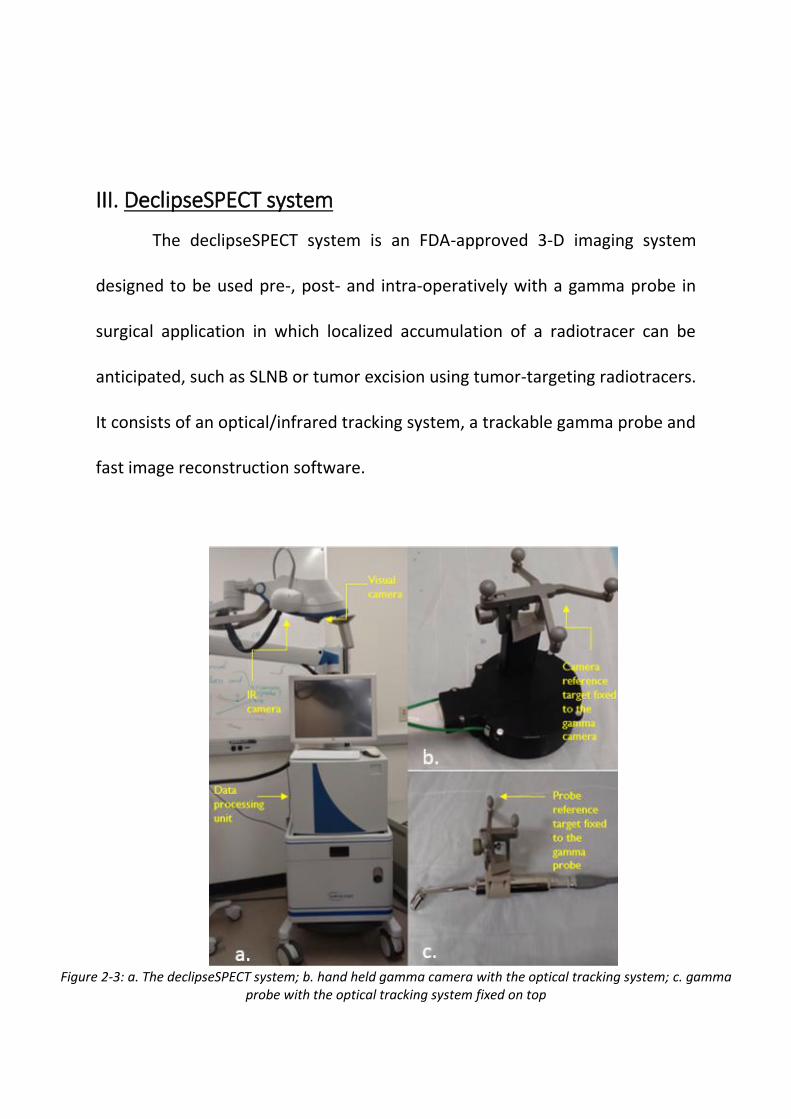
III. DeclipseSPECT system
The declipseSPECT system is an FDA-approved 3-D imaging system
designed to be used pre-, post- and intra-operatively with a gamma probe in
surgical application in which localized accumulation of a radiotracer can be
anticipated, such as SLNB or tumor excision using tumor-targeting radiotracers.
It consists of an optical/infrared tracking system, a trackable gamma probe and
fast image reconstruction software.
Figure 2-3: a. The declipseSPECT system; b. hand held gamma camera with the optical tracking system; c. gamma
probe with the optical tracking system fixed on top
37
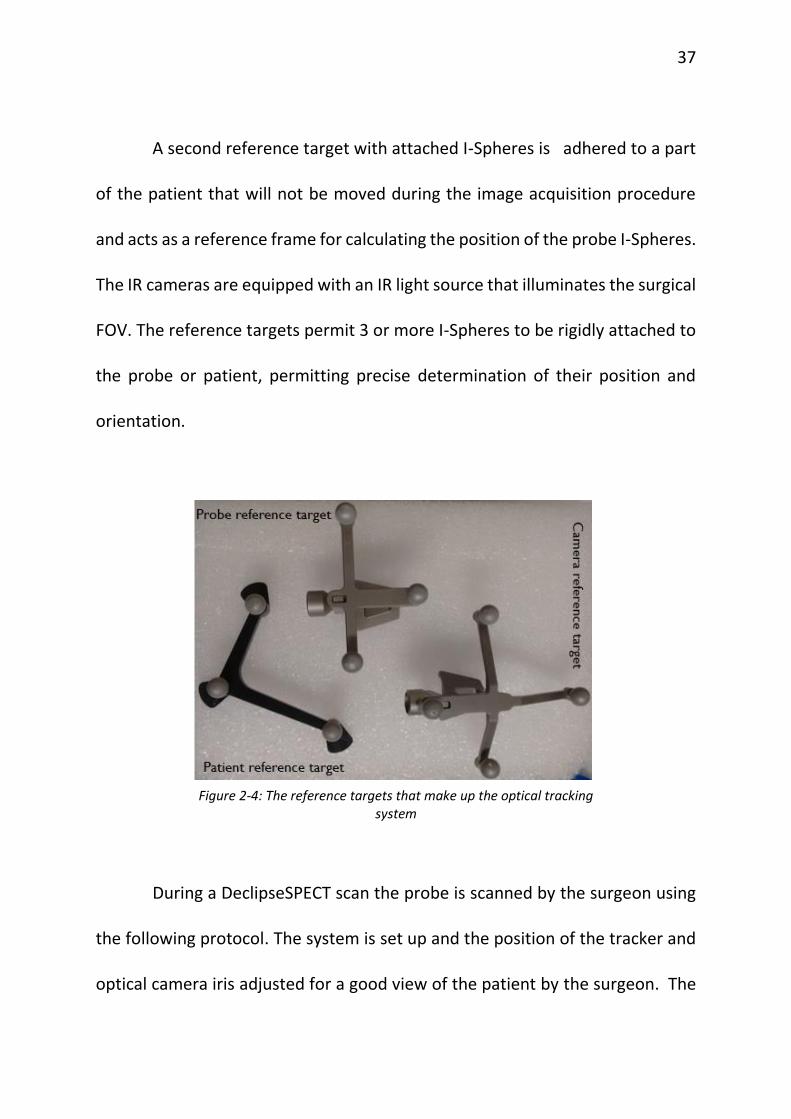
A second reference target with attached I-Spheres is adhered to a part
of the patient that will not be moved during the image acquisition procedure
and acts as a reference frame for calculating the position of the probe I-Spheres.
The IR cameras are equipped with an IR light source that illuminates the surgical
FOV. The reference targets permit 3 or more I-Spheres to be rigidly attached to
the probe or patient, permitting precise determination of their position and
orientation.
Figure 2-4: The reference targets that make up the optical tracking
system
During a DeclipseSPECT scan the probe is scanned by the surgeon using
the following protocol. The system is set up and the position of the tracker and
optical camera iris adjusted for a good view of the patient by the surgeon. The
38
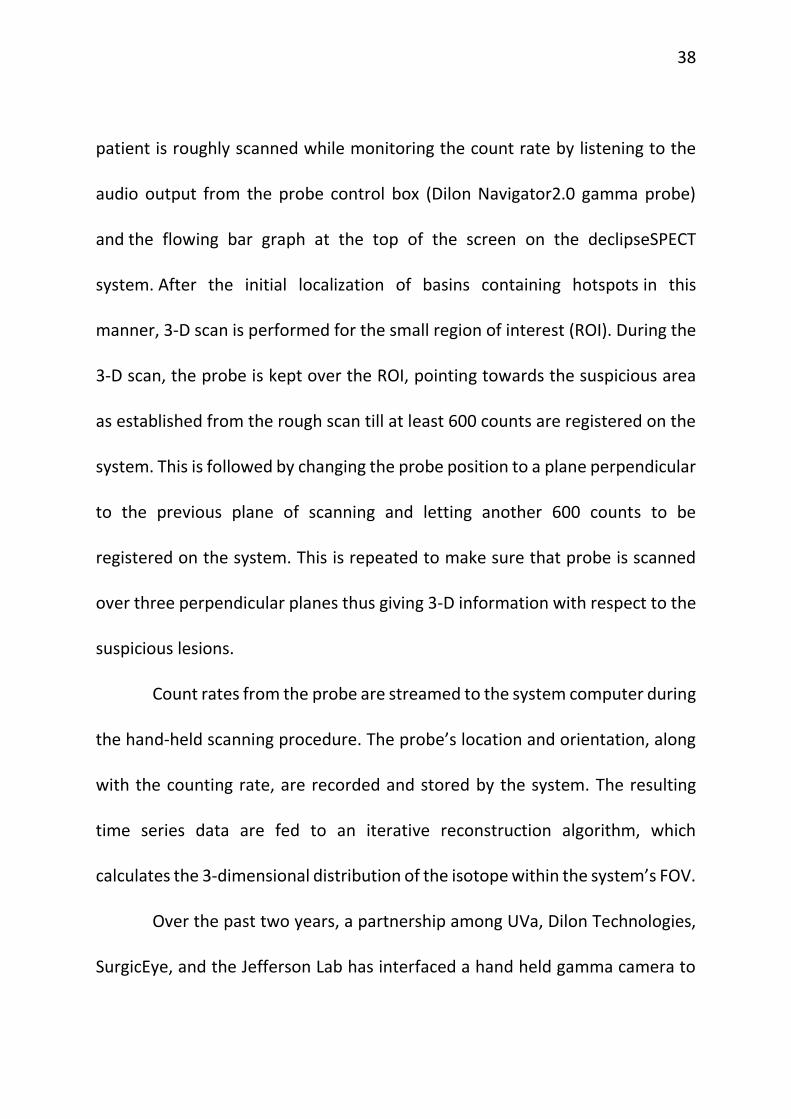
patient is roughly scanned while monitoring the count rate by listening to the
audio output from the probe control box (Dilon Navigator2.0 gamma probe)
and the flowing bar graph at the top of the screen on the declipseSPECT
system. After the initial localization of basins containing hotspots in this
manner, 3-D scan is performed for the small region of interest (ROI). During the
3-D scan, the probe is kept over the ROI, pointing towards the suspicious area
as established from the rough scan till at least 600 counts are registered on the
system. This is followed by changing the probe position to a plane perpendicular
to the previous plane of scanning and letting another 600 counts to be
registered on the system. This is repeated to make sure that probe is scanned
over three perpendicular planes thus giving 3-D information with respect to the
suspicious lesions.
Count rates from the probe are streamed to the system computer during
the hand-held scanning procedure. The probe’s location and orientation, along
with the counting rate, are recorded and stored by the system. The resulting
time series data are fed to an iterative reconstruction algorithm, which
calculates the 3-dimensional distribution of the isotope within the system’s FOV.
Over the past two years, a partnership among UVa, Dilon Technologies,
SurgicEye, and the Jefferson Lab has interfaced a hand held gamma camera to
39
the data acquisition and image reconstruction components of the
DeclipseSPECT system. The camera can be used as an alternative to the gamma
probe. The potential advantages of replacing the non-imaging probe with a
camera include the estimation of shape, extent and depth of the radiotracer
uptake from the reconstructed images, better detection of sentinel lymph nodes
in complicated situations like anatomic location of the nodes or proximity to the
high-activity injection site and the ability to visualize the lesion area pre-incision
thus improving the false negative rate associated with the gamma probe [56].
The evaluation of the 3D hand held gamma camera is the main object of this
thesis and will be discussed in detail in the following chapters.
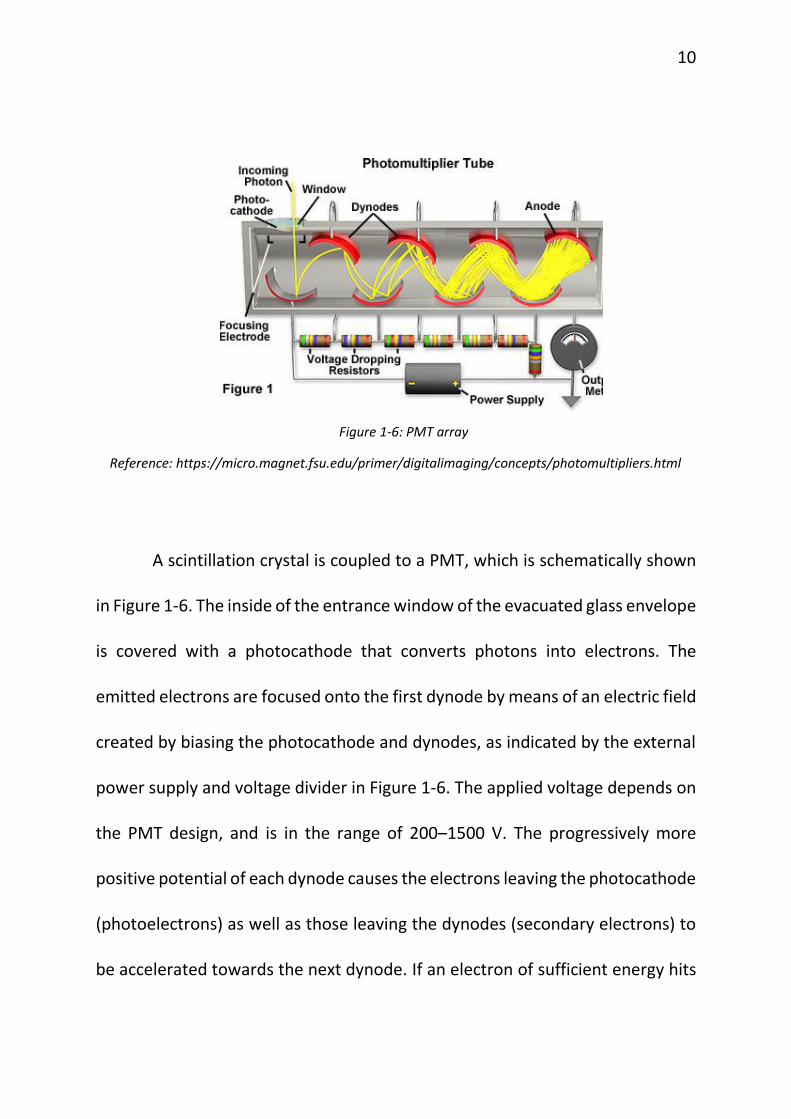
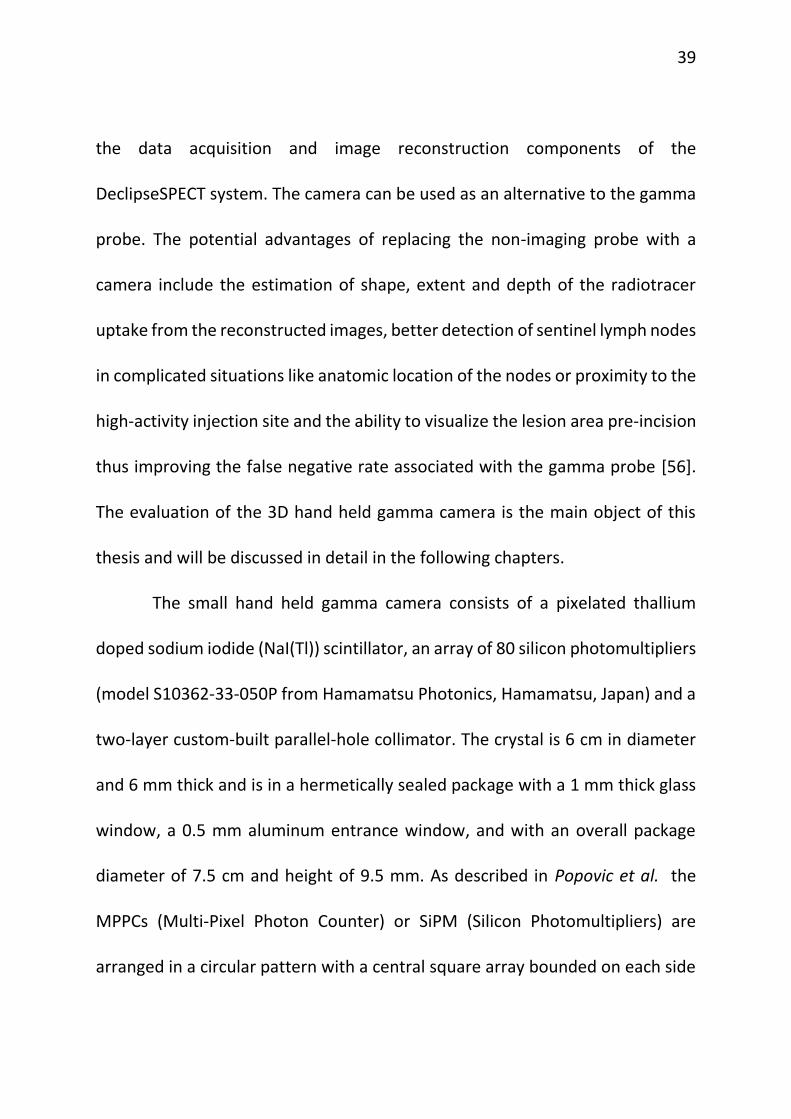
The small hand held gamma camera consists of a pixelated thallium
doped sodium iodide (NaI(Tl)) scintillator, an array of 80 silicon photomultipliers
(model S10362-33-050P from Hamamatsu Photonics, Hamamatsu, Japan) and a
two-layer custom-built parallel-hole collimator. The crystal is 6 cm in diameter
and 6 mm thick and is in a hermetically sealed package with a 1 mm thick glass
window, a 0.5 mm aluminum entrance window, and with an overall package
diameter of 7.5 cm and height of 9.5 mm. As described in Popovic et al. the
MPPCs (Multi-Pixel Photon Counter) or SiPM (Silicon Photomultipliers) are
arranged in a circular pattern with a central square array bounded on each side
40
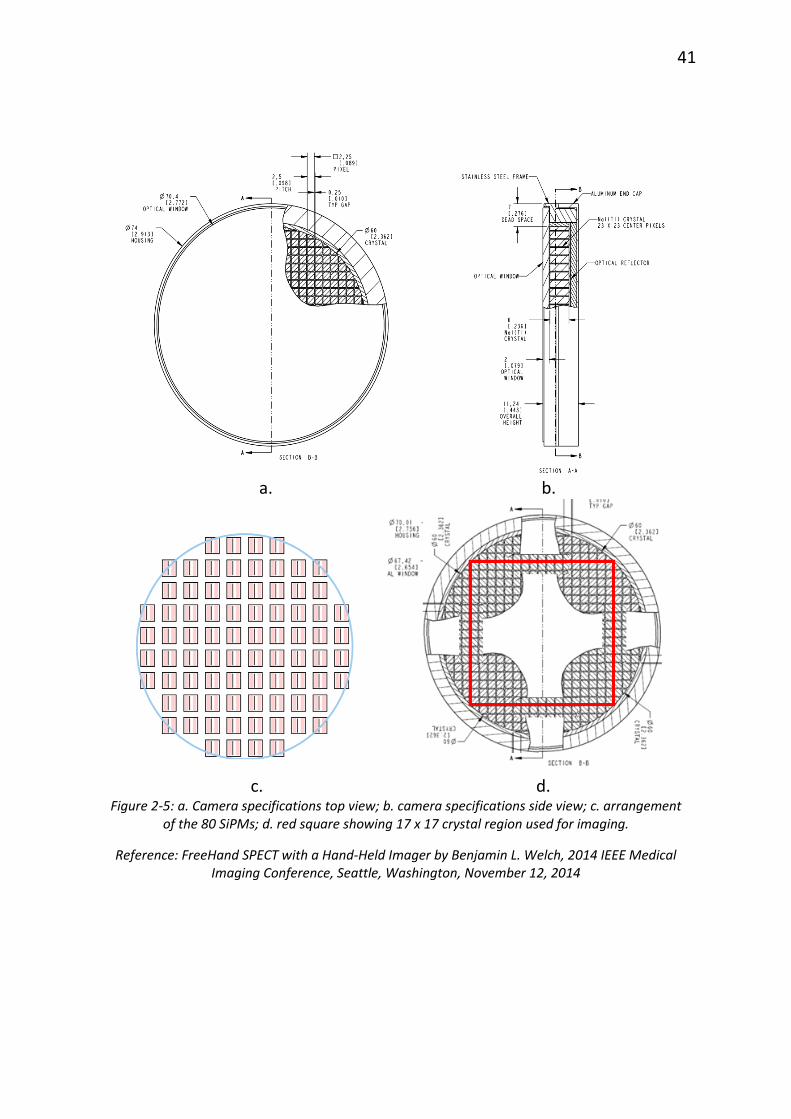
by another array, giving a circular field of view with a 60 mm diameter. As shown
in Figure 2-5d, a square region of 17 x 17 crystals makes the actual imaging
region. This is because the response function (detector response to the
radiations) is uniform in this region allowing standard techniques like crystal
mapping, energy calibration and flood correction to be incorporated in the
application program interface for the image processing software.
41
a. b.
c. d.
Figure 2-5: a. Camera specifications top view; b. camera specifications side view; c. arrangement of the 80 SiPMs; d. red square showing 17 x 17 crystal region used for imaging.
Reference: FreeHand SPECT with a Hand-Held Imager by Benjamin L. Welch, 2014 IEEE Medical Imaging Conference, Seattle, Washington, November 12, 2014
42
The disk-shaped camera housing is 75 mm in diameter, approximately
40.5 mm thick and has a mass of only 1.4 kg, permitting either hand-held or arm-
mounted use. The scintillator is coupled to the MPPC array using a
polydimethylsiloxane (PDMS) coupling compound to improve the scintillation
light transfer to the MPPCs and insure a sturdy coupling. All camera components
are integrated on a mobile cart that allows easy transport. The camera is
designed to be used in surgical procedures, including determination of the
location and extent of primary carcinomas, detection of secondary lesions, and
sentinel lymph node biopsy (SLNB) [57].
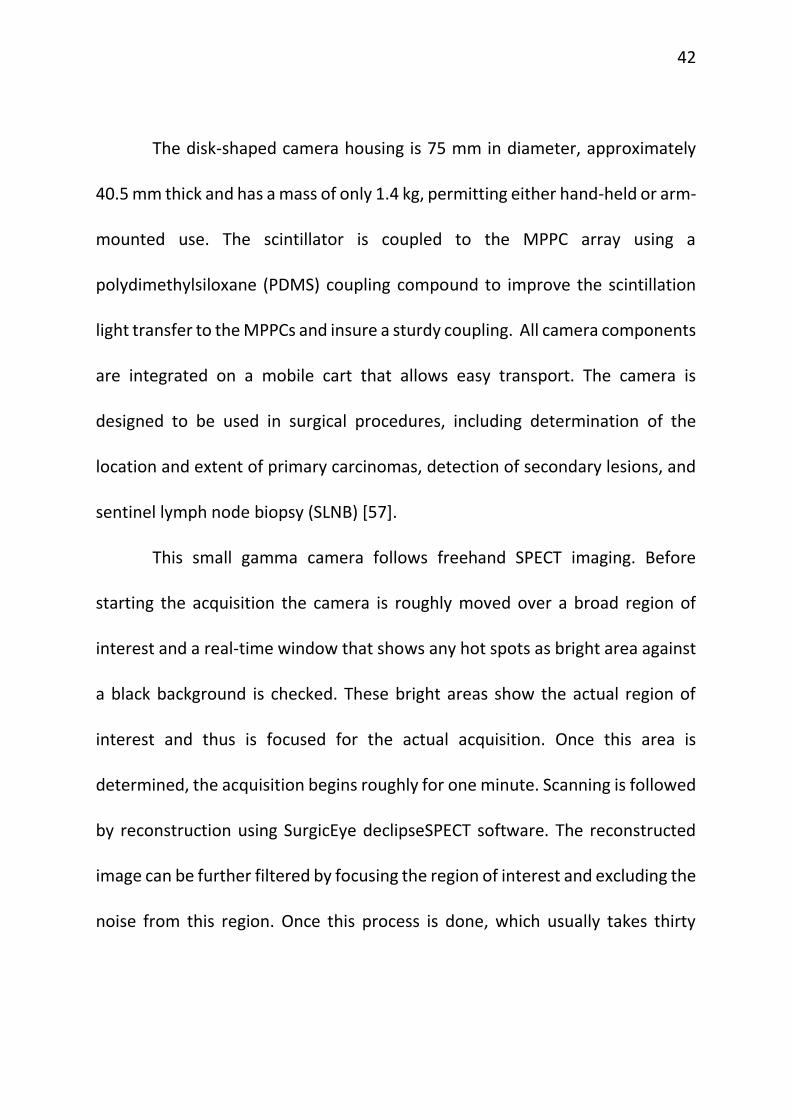
This small gamma camera follows freehand SPECT imaging. Before
starting the acquisition the camera is roughly moved over a broad region of
interest and a real-time window that shows any hot spots as bright area against
a black background is checked. These bright areas show the actual region of
interest and thus is focused for the actual acquisition. Once this area is
determined, the acquisition begins roughly for one minute. Scanning is followed
by reconstruction using SurgicEye declipseSPECT software. The reconstructed
image can be further filtered by focusing the region of interest and excluding the
noise from this region. Once this process is done, which usually takes thirty
43
seconds, the reconstruction image is overlaid on region scanned with the help
of the visual camera.
Figure 2-6: Reconstructed image overlaid on the phantom
A reconstructed image of a phantom with three posts having
radioactivity on top is shown in Figure 2-6. By tracking the camera’s location and
orientation using the NIR cameras, the system can display the continuously
updated separation between the camera surface and regions of reconstructed
44
focal radiotracer uptake (hotspots). As the camera is moved, the displayed
distance changes, thus letting surgeons know the location of the hotspots in
three dimensions relative to the camera. The software also calculates and
displays the relative activities of each separate hotspot expressed as a
percentage of the total activity within the reconstructed FOV of the system (see
Figure 2-6).
The next chapter deals with characterizing this small gamma camera
when operated in both 2-D and 3-D modes.
CHAPTER 3
SYSTEM CHARACTERIZATION
I. Introduction
Every imaging system needs to be evaluated based on its basic imaging
performance so that it can be used efficiently and capabilities and limitations
during human imaging can be predicted. This process also enables identification
of degraded performance, and troubleshooting to identify and correct the
source. This chapter discusses imaging performance evaluation of the hand held
gamma camera, used both in 2-D (scintigraphic) mode and in hand held SPECT
(3-D) mode in conjunction with the DeclipseSPECT system [58].
A. Intrinsic Performance
The International Atomic Energy Agency describes two general types of
gamma camera performance: extrinsic and intrinsic. Intrinsic performance is
generally evaluated for component of the imager under ideal conditions. For
gamma cameras, intrinsic performance is that with the collimator removed, and
characterizes the detector alone [58].
46
B. Extrinsic performance
Extrinsic or system performance characterization is usually done for the
entire nuclear medicine system under conditions that are clinically realistic. In
case of gamma cameras, it is done with the collimator in place. For 3-D (SPECT)
imaging characterization can include assement of image quality in reconstructed
images. The results of extrinsic performance measurements, when made with
realistic phantoms, can be indicators of clinical performance and may provide
useful information about system optimization for clinical studies.
In this thesis, all experiments were performed with the collimator on and
hence all results will be descriptive of extrinsic or system performance [58].
II. Performance Evaluation
A. Energy Resolution
A.i) Background
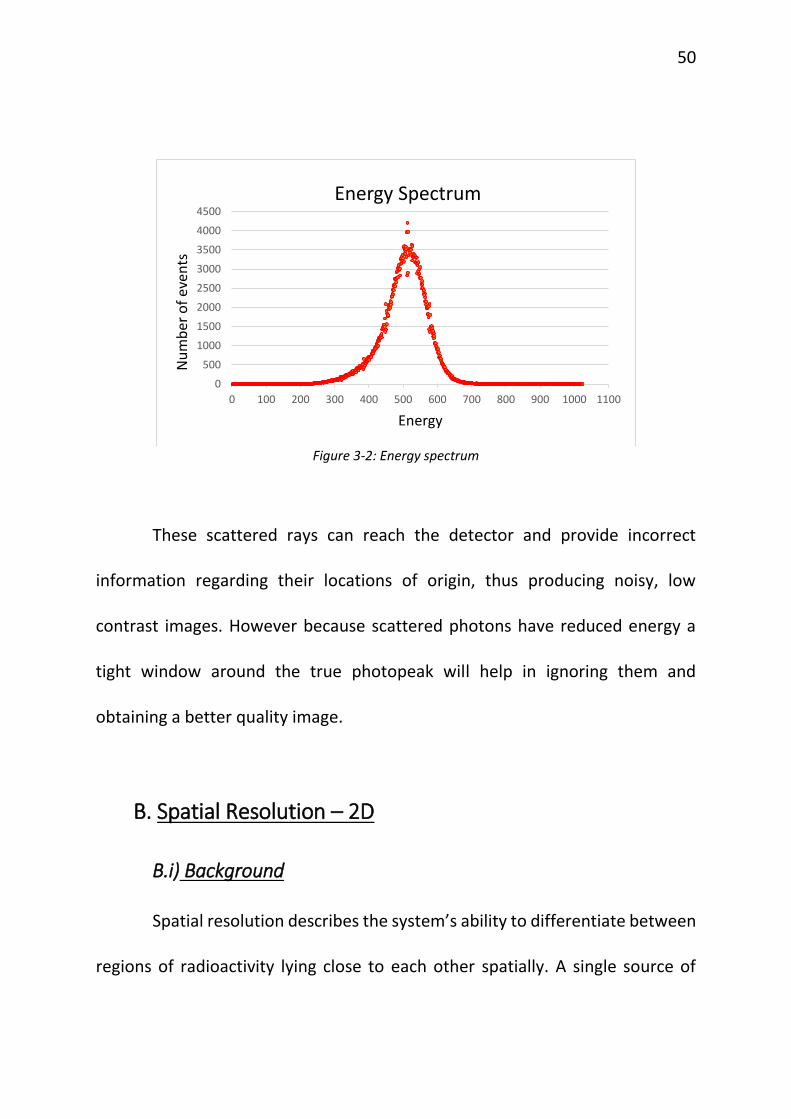
The amplitude of the signal obtained from the camera is directly
proportional to the energy deposited in the crystals by the γ-rays. The energy
spectrum of the detected gamma rays is obtained by plotting a histogram of the
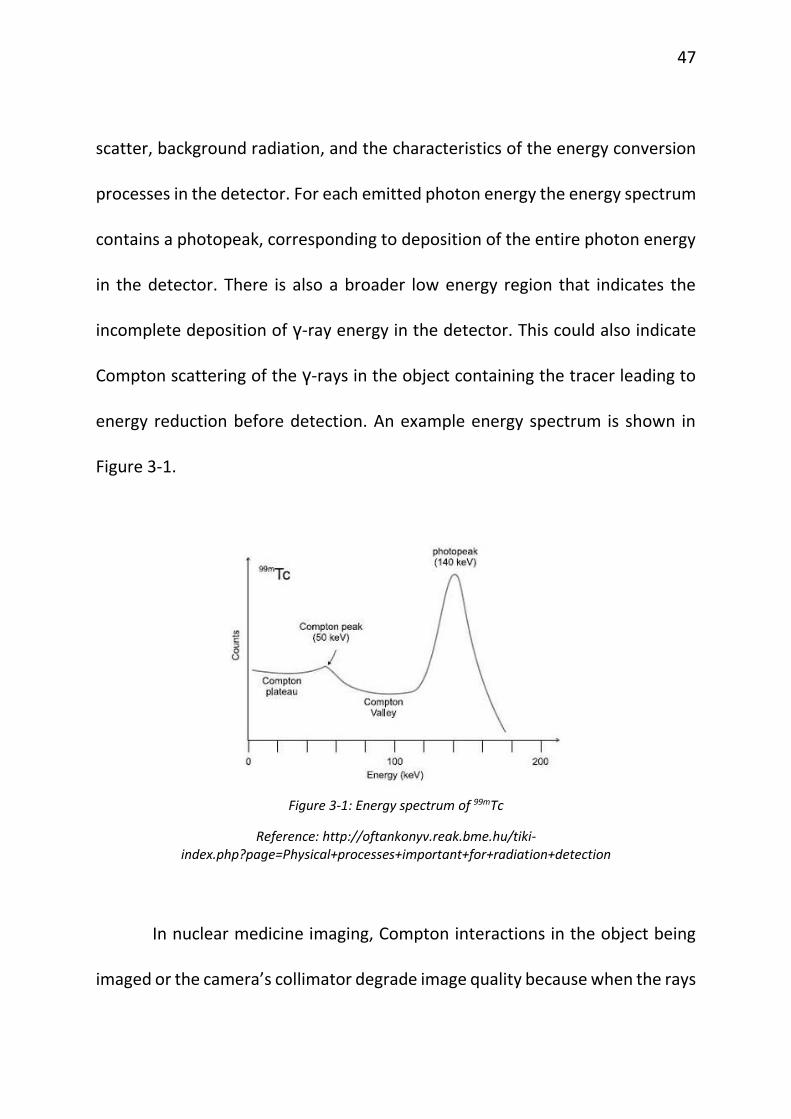
detector pulse amplitudes. The shape of this spectrum depends on multiple
factors including: the radiotracer emission spectrum, the amount of Compton
47
scatter, background radiation, and the characteristics of the energy conversion
processes in the detector. For each emitted photon energy the energy spectrum
contains a photopeak, corresponding to deposition of the entire photon energy
in the detector. There is also a broader low energy region that indicates the
incomplete deposition of γ-ray energy in the detector. This could also indicate
Compton scattering of the γ-rays in the object containing the tracer leading to
energy reduction before detection. An example energy spectrum is shown in
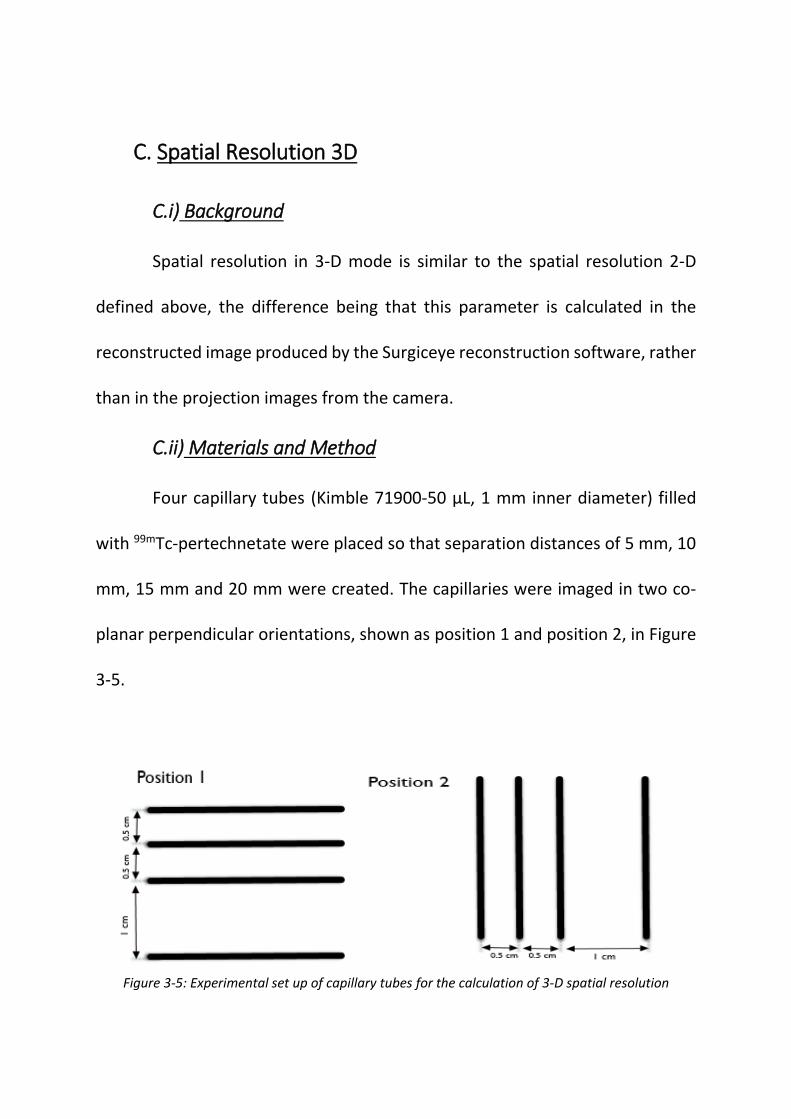
Spatial resolution in 3-D mode is similar to the spatial resolution 2-D
defined above, the difference being that this parameter is calculated in the
reconstructed image produced by the Surgiceye reconstruction software, rather
than in the projection images from the camera.
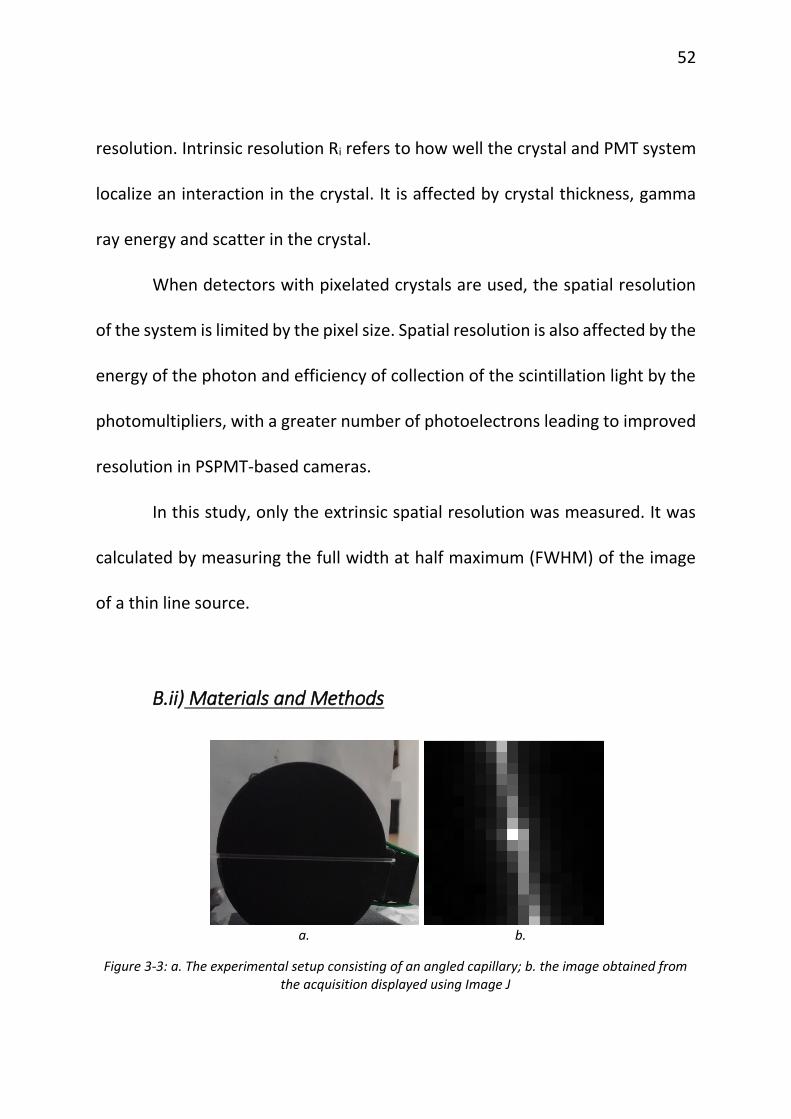
C.ii) Materials and Method
Four capillary tubes (Kimble 71900-50 µL, 1 mm inner diameter) filled
with 99mTc-pertechnetate were placed so that separation distances of 5 mm, 10
mm, 15 mm and 20 mm were created. The capillaries were imaged in two co-
planar perpendicular orientations, shown as position 1 and position 2, in Figure
3-5.
Figure 3-5: Experimental set up of capillary tubes for the calculation of 3-D spatial resolution
56
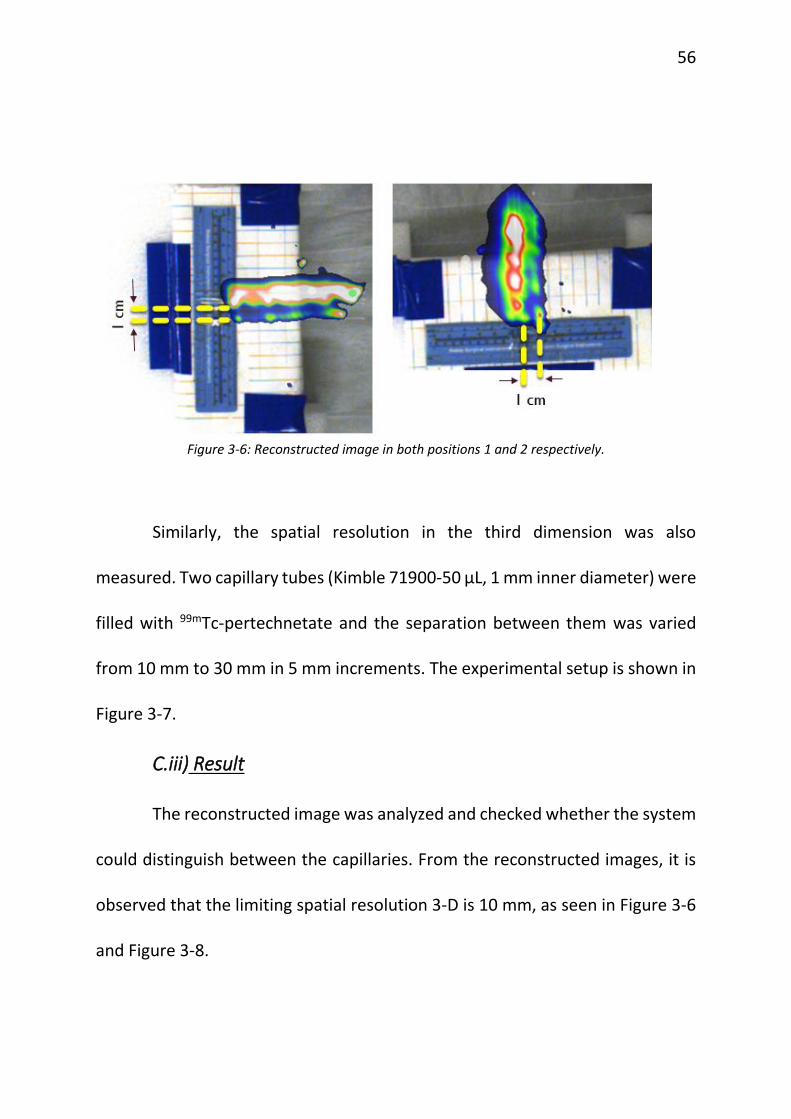
Figure 3-6: Reconstructed image in both positions 1 and 2 respectively.
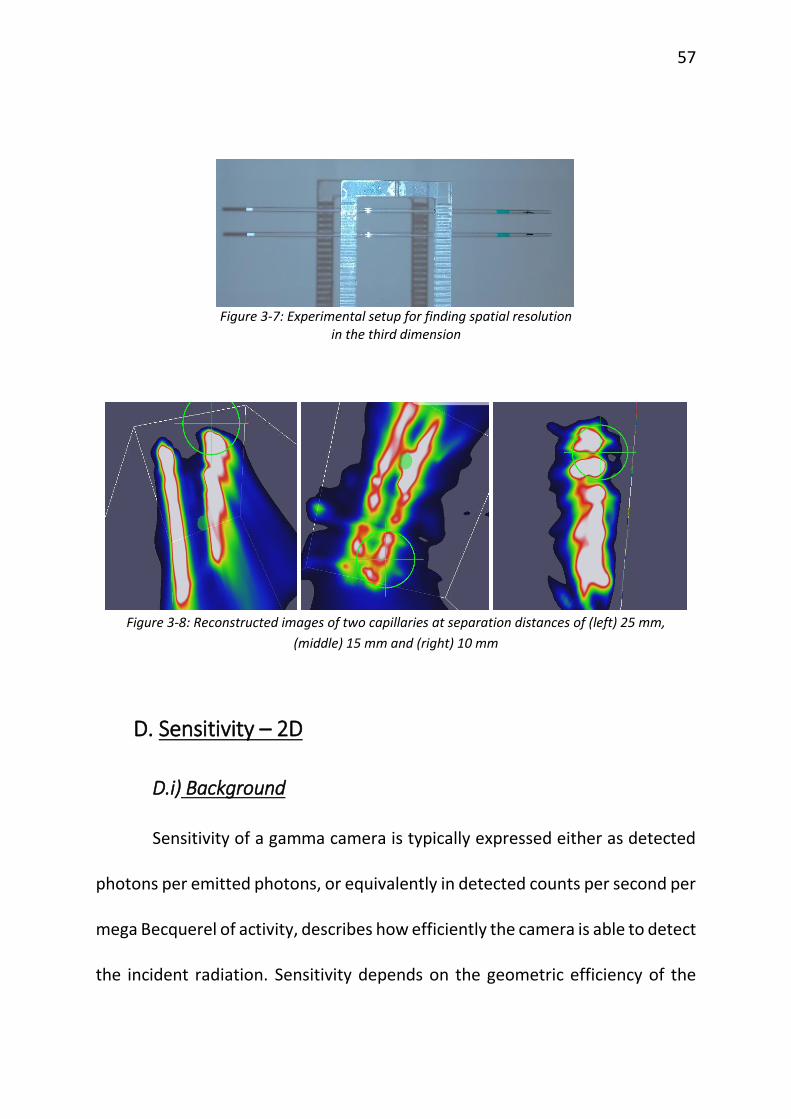
Similarly, the spatial resolution in the third dimension was also
measured. Two capillary tubes (Kimble 71900-50 µL, 1 mm inner diameter) were
filled with 99mTc-pertechnetate and the separation between them was varied
from 10 mm to 30 mm in 5 mm increments. The experimental setup is shown in
Figure 3-7.
C.iii) Result
The reconstructed image was analyzed and checked whether the system
could distinguish between the capillaries. From the reconstructed images, it is
observed that the limiting spatial resolution 3-D is 10 mm, as seen in Figure 3-6
and Figure 3-8.
57
Figure 3-7: Experimental setup for finding spatial resolution
in the third dimension
Figure 3-8: Reconstructed images of two capillaries at separation distances of (left) 25 mm,
(middle) 15 mm and (right) 10 mm
D. Sensitivity – 2D
D.i) Background
Sensitivity of a gamma camera is typically expressed either as detected
photons per emitted photons, or equivalently in detected counts per second per
mega Becquerel of activity, describes how efficiently the camera is able to detect
the incident radiation. Sensitivity depends on the geometric efficiency of the
58
collimator, the intrinsic photopeak efficiency of the detector, pulse height
analyzer discriminator settings, and the dead time of the system [59]. The
sensitivity has a direct impact on the radiotracer dose that must be injected into
the patient and/or the total imaging time.
D.ii) Materials and Method
The sensitivity of the gamma camera was experimentally determined
according to NEMA standards [60]. A flat bottomed petri dish with inner
diameter of 10 mm was placed at 100 mm distance from the camera surface. A
thin layer of 99mTc-pertechnetate was filled in the dish and image was acquired.
Care was taken to make sure that the dish was placed at the center of the FOV,
and that the entire periphery of the petri dish was visible in the image. The
sensitivity at 100 mm separation between the camera and source was then
calculated as the ratio of the total number of counts recorded in the image per
second and the activity of the source.
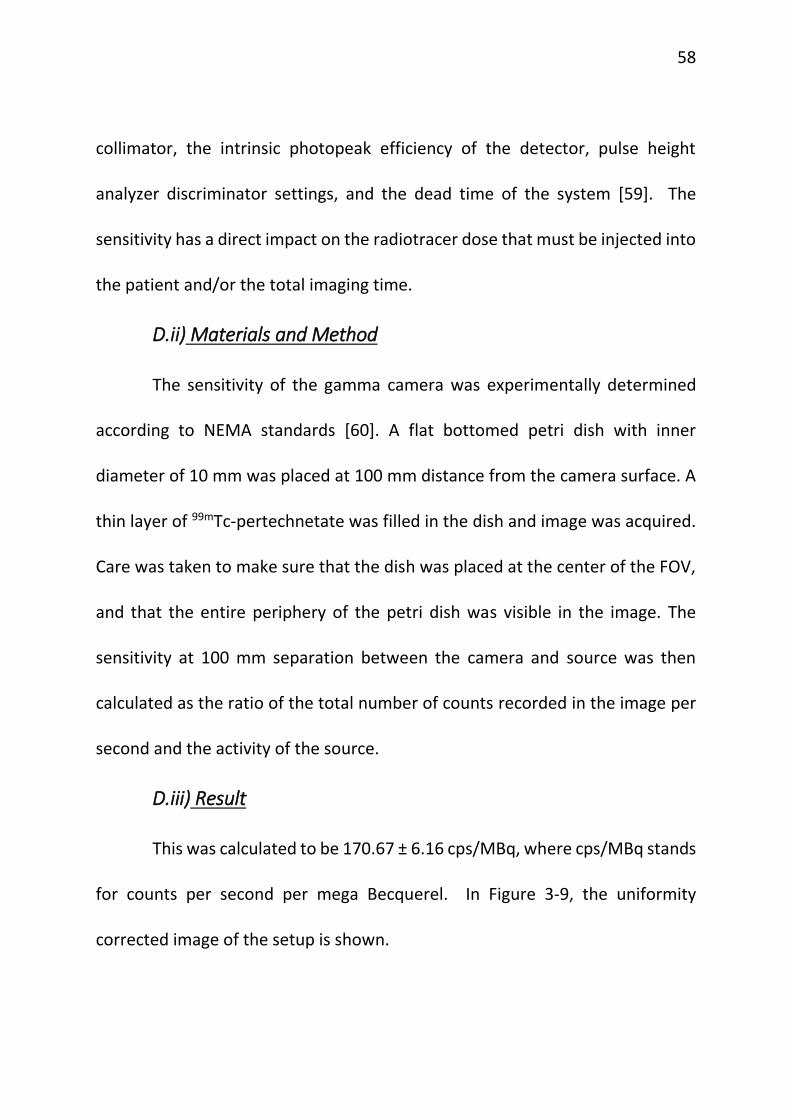
D.iii) Result
This was calculated to be 170.67 ± 6.16 cps/MBq, where cps/MBq stands
for counts per second per mega Becquerel. In Figure 3-9, the uniformity
corrected image of the setup is shown.
59
Figure 3-9: Corrected image of the 10 mm diameter petri dish at 100 mm from the camera surface
E. Sensitivity – 3D
E.i) Background
The 3-D sensitivity was based on the relative activities returned by the
system reconstruction algorithm. Similar to 2-D sensitivity, 3-D sensitivity was
defined as the ratio of total reconstructed image counts per second and the
activity of the source when the distance between the source and the camera
was 30 mm.
E.ii) Materials and Method
Eppendorf tubes were prepared with activities within the range of 3.59
µCi to 6060.27 µCi. The radioactive tube was then placed in the field of view of
the gamma camera at a distance of 30 mm. This set-up was scanned with the
gamma camera and the counts in each acquisition was noted down. The activity
60
sensitivity of the camera for each activity was then calculated as counts per
second per activity and is plotted in Figure 3-10.
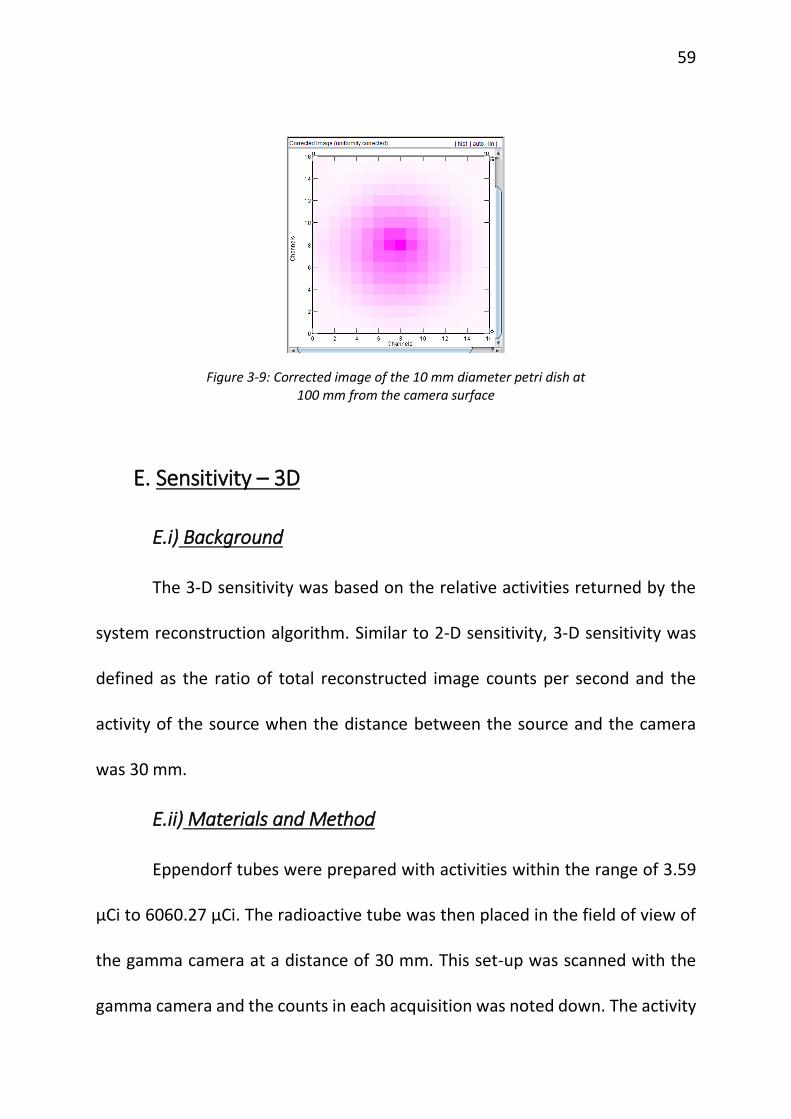
E.iii) Result
As can be seen in the Figure 3-10, the sensitivity is uniform in this range
of activity with a mean sensitivity of 202.97 ± 19.51 cps/MBq.
Figure 3-10: Plot of Sensitivity vs Activity
F. Depth Measurement
F.i) Background
In addition to providing the relative activity of the sources in the region
of interest, the declipseSPECT software also tracks and reports the locations
1.00
10.00
100.00
1,000.00
0.10 1.00 10.00 100.00 1,000.00
Sen
siti
vty
(cp
s/M
Bq
)
Activity (MBq)
Sensitivity (cps/MBq)
61
these individual sources relative to the input surface of the gamma camera. Thus
the distance of these sources from the camera can be obtained in real time after
reconstruction of the image. Knowing the depth of the lesion provides the
surgeons with useful information that could help them decide where to make
the incision efficiently, or whether the depth of the node might be too great to
justify its excision. This section describes experiments designed to test the
accuracy of the distance measurement as reported by the system.
F.ii) Materials and Method
In this experiment, distance was defined as the separation between the
camera collimator and the lesion. The true distance was measured using a ruler
and compared to the distance displayed by the reconstruction software. Lesions
were simulated using small spheres filled with average radioactivity of 25.71 µCi,
and having activities varying from 18.18 µCi to 52.17 µCi. The first set of distance
determination were obtained with the camera surface in contact with the
lesions and hence the true distance is 0 mm in this case. Multiple scans were
performed at this position and the distances were noted down. The second set
was obtained with the distance between the camera surface and lesions being
35 mm.
62
F.iii) Result
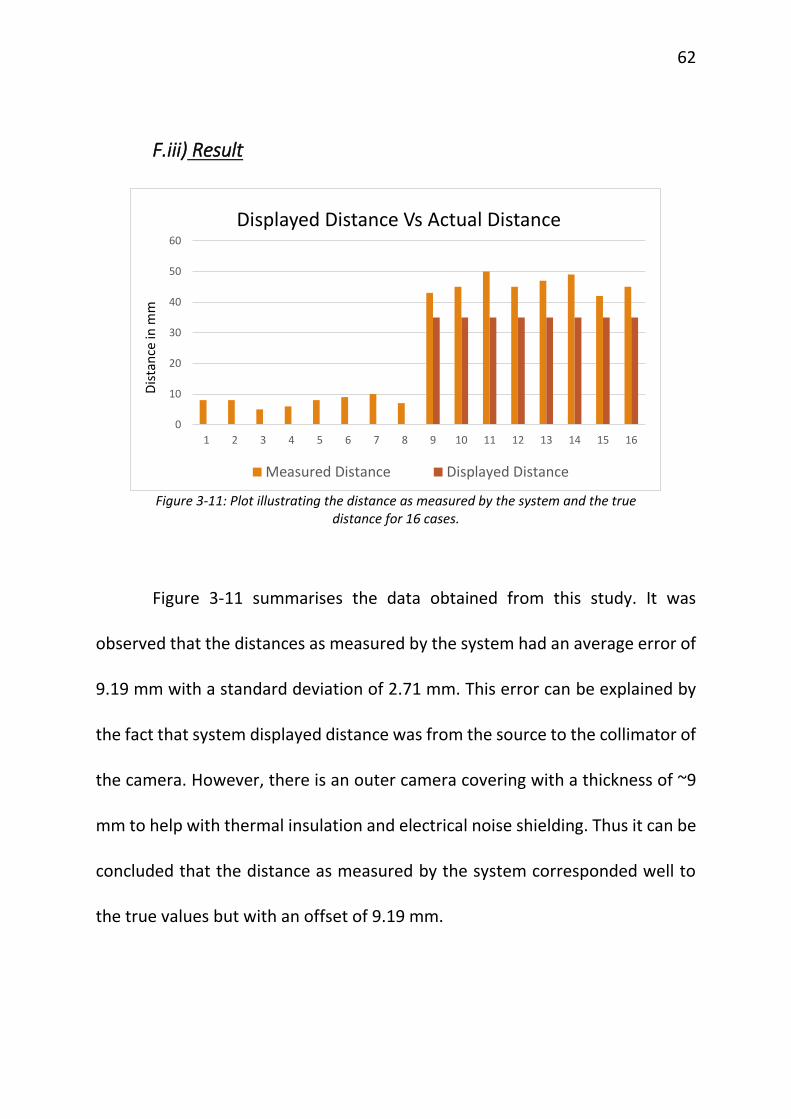
Figure 3-11: Plot illustrating the distance as measured by the system and the true
distance for 16 cases.
Figure 3-11 summarises the data obtained from this study. It was
observed that the distances as measured by the system had an average error of
9.19 mm with a standard deviation of 2.71 mm. This error can be explained by
the fact that system displayed distance was from the source to the collimator of
the camera. However, there is an outer camera covering with a thickness of ~9
mm to help with thermal insulation and electrical noise shielding. Thus it can be
concluded that the distance as measured by the system corresponded well to
the true values but with an offset of 9.19 mm.
0
10
20
30
40
50
60
1 2 3 4 5 6 7 8 9 10 11 12 13 14 15 16
Dis
tan
ce in
mm
Displayed Distance Vs Actual Distance
Measured Distance Displayed Distance
63
G. Geometric Linearity
G.i) Background
In a SLNB procedure the nodes can be at any depth inside the tissue and
they can be located in any arrangement among themselves, in the case of
multiple nodes. A geometrically accurate imaging system should be able to
return the spatial separations of the nodes without any geometric distortions;
i.e. straight lines should be imaged as straight lines. This will provide surgeons
with a good visualization of the lymphatic drainage system and help them in the
surgical removal of sentinel lymph nodes.
G.ii) Materials and Method
To evaluate this characteristic of the camera, two wells of height 0.5 cm
(A) and 2.5 cm (B) were placed on a box phantom with a separation distance of
2 cm between them. Point radioactivity ~60 µCi each was placed on top of the
wells. This set-up was then scanned by the system and the reconstructed image
was analysed.
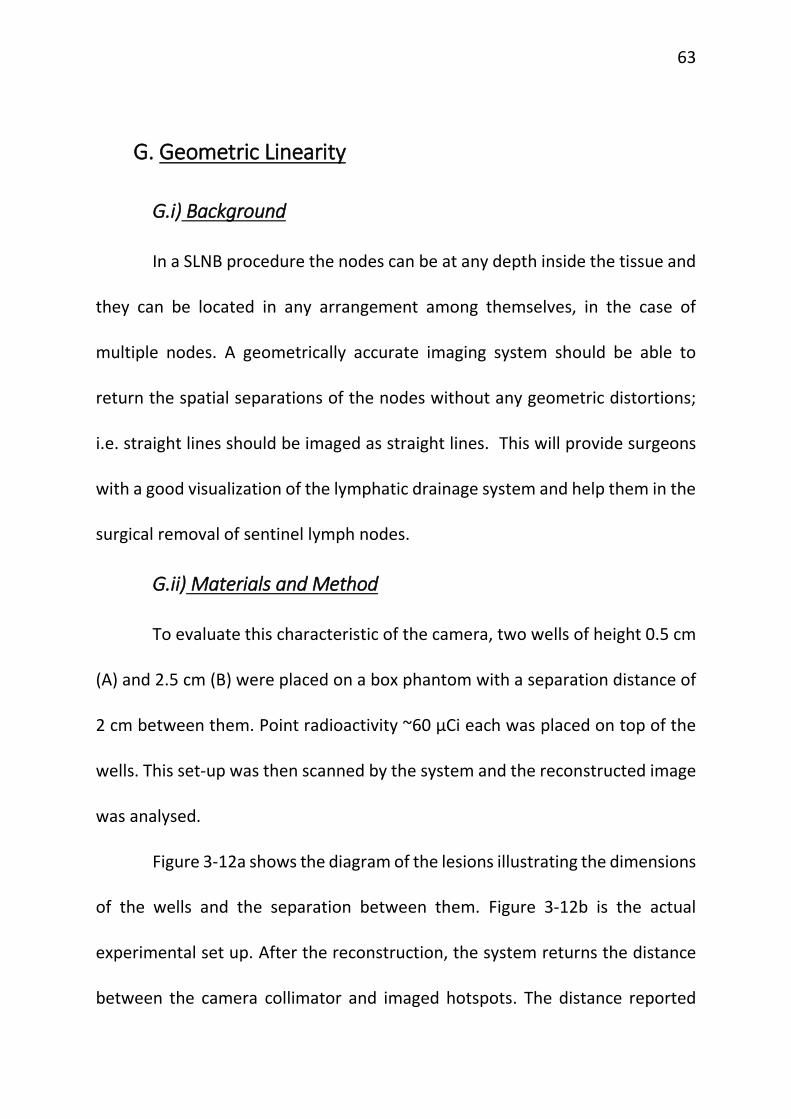
Figure 3-12a shows the diagram of the lesions illustrating the dimensions
of the wells and the separation between them. Figure 3-12b is the actual
experimental set up. After the reconstruction, the system returns the distance
between the camera collimator and imaged hotspots. The distance reported
64
changes the radioactive sources. Since the separation between the wells and the
difference in their heights could be measured with a ruler, these two values
were considered to constitute ground truth. The distances of the wells from the
camera, obtained from 4 different viewing directions after one scan: side view
1, side view 2, front view and top view, were recorded.
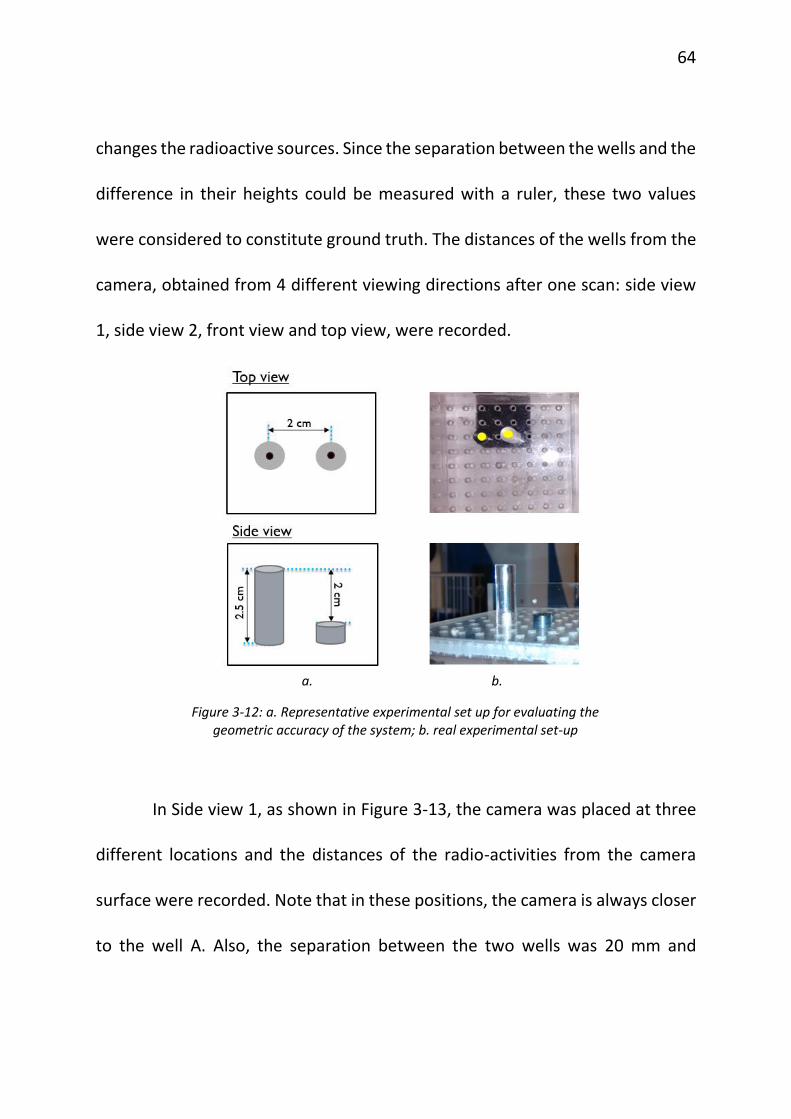
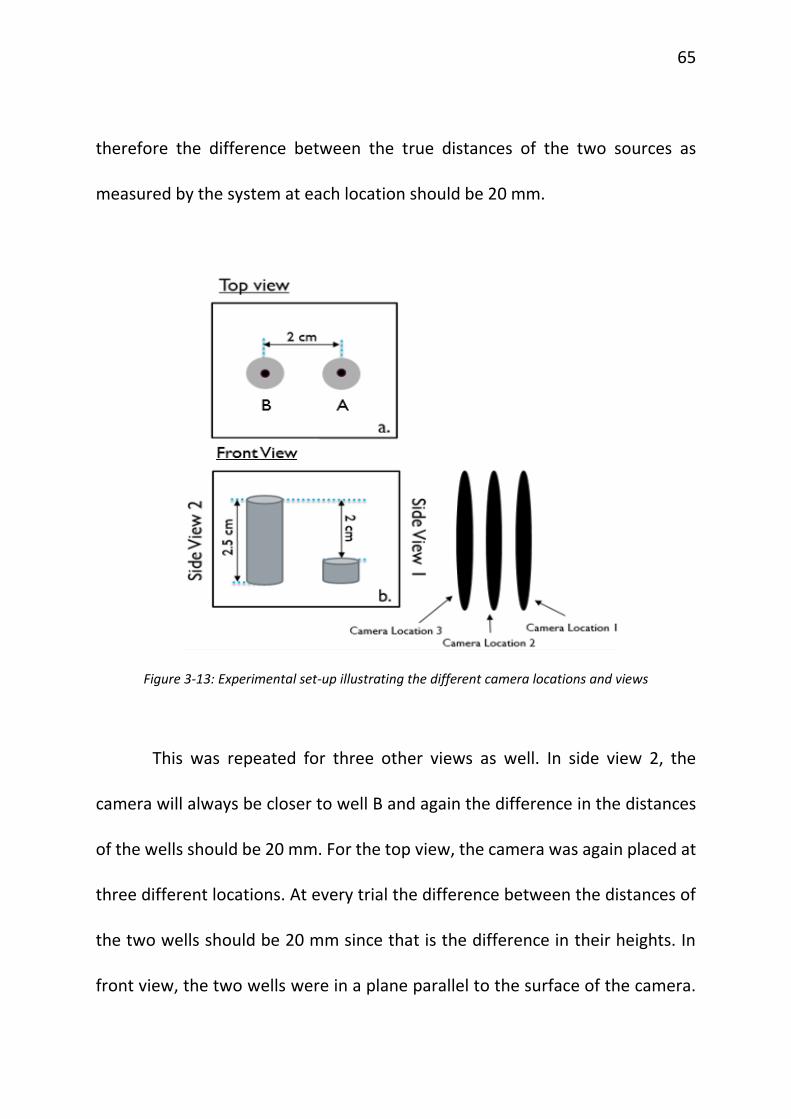
In Side view 1, as shown in Figure 3-13, the camera was placed at three
different locations and the distances of the radio-activities from the camera
surface were recorded. Note that in these positions, the camera is always closer
to the well A. Also, the separation between the two wells was 20 mm and
a. b.
Figure 3-12: a. Representative experimental set up for evaluating the geometric accuracy of the system; b. real experimental set-up
65
therefore the difference between the true distances of the two sources as
measured by the system at each location should be 20 mm.
Figure 3-13: Experimental set-up illustrating the different camera locations and views
This was repeated for three other views as well. In side view 2, the
camera will always be closer to well B and again the difference in the distances
of the wells should be 20 mm. For the top view, the camera was again placed at
three different locations. At every trial the difference between the distances of
the two wells should be 20 mm since that is the difference in their heights. In
front view, the two wells were in a plane parallel to the surface of the camera.
66
Hence they were at the same distance from the camera surface. Thus the
difference in their distances as measured by the camera should be 0 mm.
G.iii) Result
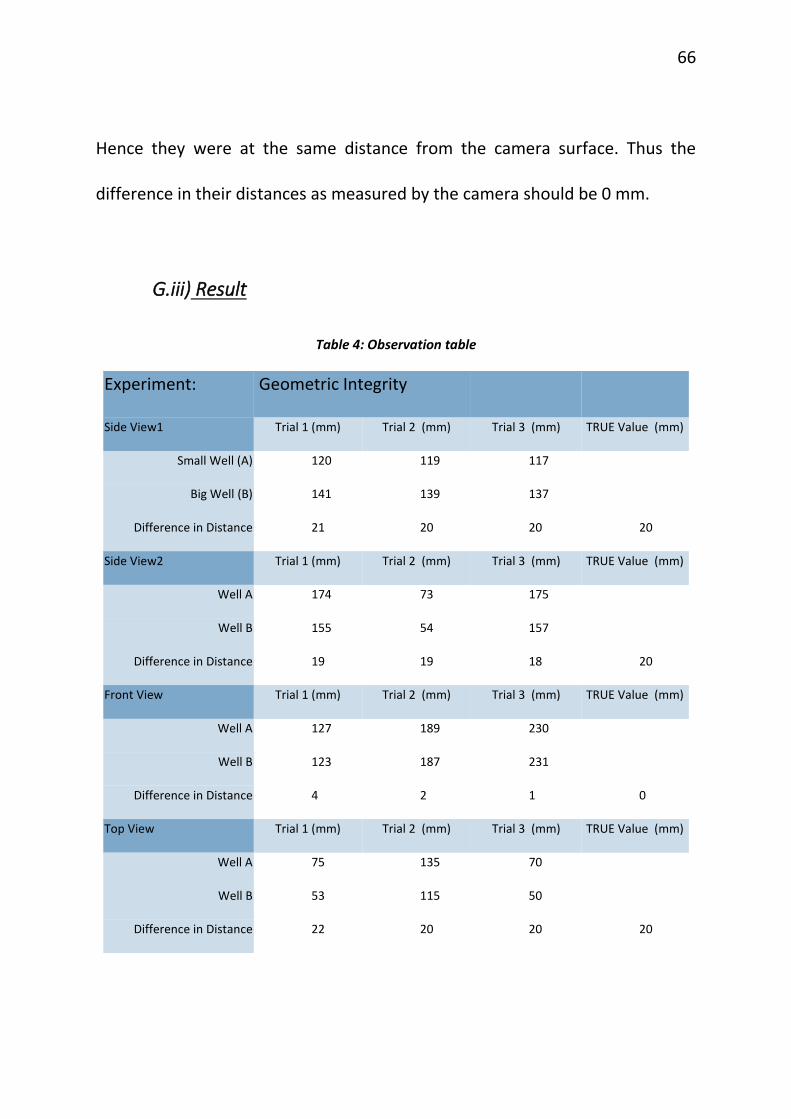
Table 4: Observation table
Experiment: Geometric Integrity
Side View1 Trial 1 (mm) Trial 2 (mm) Trial 3 (mm) TRUE Value (mm)
Small Well (A) 120 119 117
Big Well (B) 141 139 137
Difference in Distance 21 20 20 20
Side View2 Trial 1 (mm) Trial 2 (mm) Trial 3 (mm) TRUE Value (mm)
Well A 174 73 175
Well B 155 54 157
Difference in Distance 19 19 18 20
Front View Trial 1 (mm) Trial 2 (mm) Trial 3 (mm) TRUE Value (mm)
Well A 127 189 230
Well B 123 187 231
Difference in Distance 4 2 1 0
Top View Trial 1 (mm) Trial 2 (mm) Trial 3 (mm) TRUE Value (mm)
Well A 75 135 70
Well B 53 115 50
Difference in Distance 22 20 20 20
67
Table 4 summarises the observations obtained from this experiment.
From this data, error with which the system measures the distances of the
radioactive sources from the camera from all the different views was calculated.
The depth information of the lesions were accurately reproduced with a mean
absolute error of 1.2 ± 0.34 mm (95% confidence interval).
H. Quantification of the Activity
H.i) Background
As mentioned in Chapter 2III. , the system reports the relative activity of
the sources in terms of their percentage of the total activity imaged by the
system in the region of interest. This measure is clinically significant because of
the 10% rule followed by surgeons during sentinel lymph node biopsy. According
to this rule, all nodes with radiation activities more than 10% of that of the
hottest node and all blue dye stained nodes should be removed. Even though
recent studies show that following this rule results in removal of a larger number
of nodes than necessary, this is the current standard in hospitals [61], [62]. Thus
an attempt was made to test how well this investigational imaging system can
aide surgeons in making the decision about excision of nodes.
68
H.ii) Materials and Method
In this experiment, nodes were simulated using spheres of outer
diameter 50 mm filled with radioactivity ranging from 1.78 µCi to 859.52 µCi.
Sets of 2, 3 and 4 nodes were grouped together and scanned with the camera
using the declipseSPECT software. Their relative activities as measured by the
system were recorded. This was compared to the true relative activities of the
sources calculated using their true activities (measured using Capintec CRC-15R
dose calibrator).
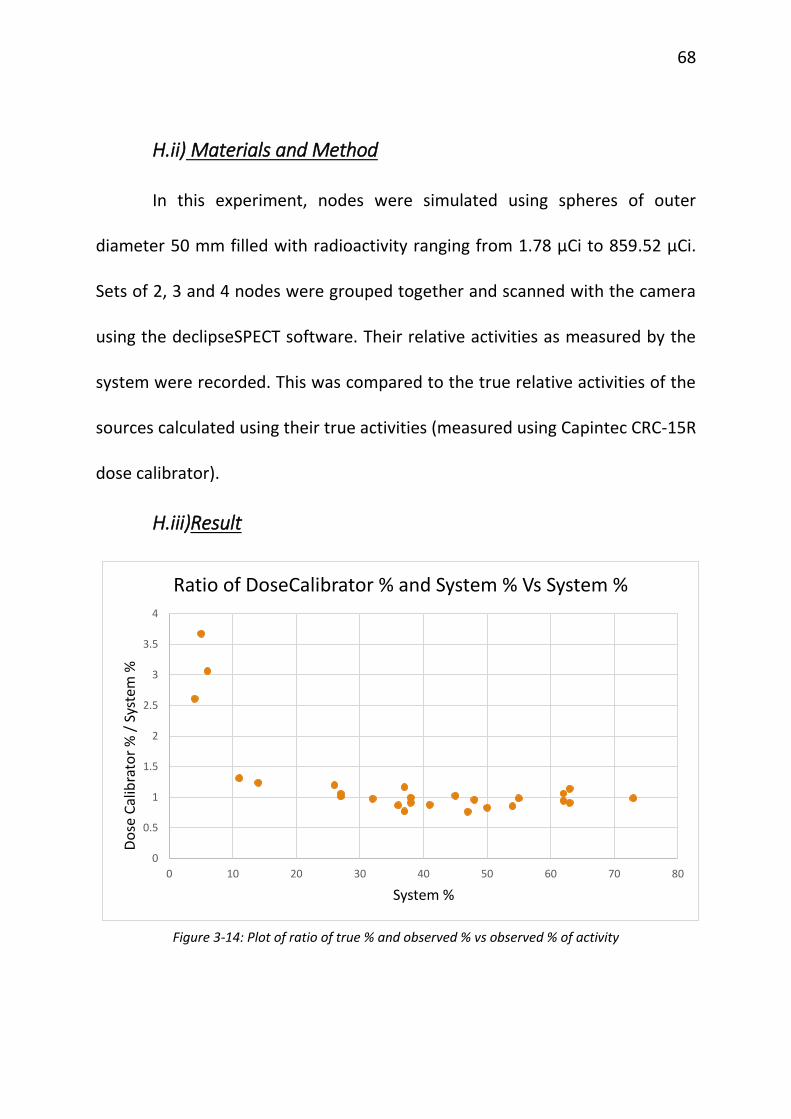
H.iii)Result
Figure 3-14: Plot of ratio of true % and observed % vs observed % of activity
0
0.5
1
1.5
2
2.5
3
3.5
4
0 10 20 30 40 50 60 70 80
Do
se C
alib
rato
r %
/ S
yste
m %
System %
Ratio of DoseCalibrator % and System % Vs System %
69
In Figure 3-14, a plot of the ratio of true % activity and observed %
activity against the observed % activity is shown. As can be seen, the ratio is
close to 1 for relative activities in the range of 10% and onwards as seen by the
system. This ratio deviates from 1 when the relative activity falls below 10%.
Based on the data shown in Figure 3-14 it was determined that for nodes whose
activity was more than 10% of the total activity in the scanned FOV, the system
calculates the relative measures of radioactivity accurately with an average error
of 18.0843% and standard deviation 20.1232%.
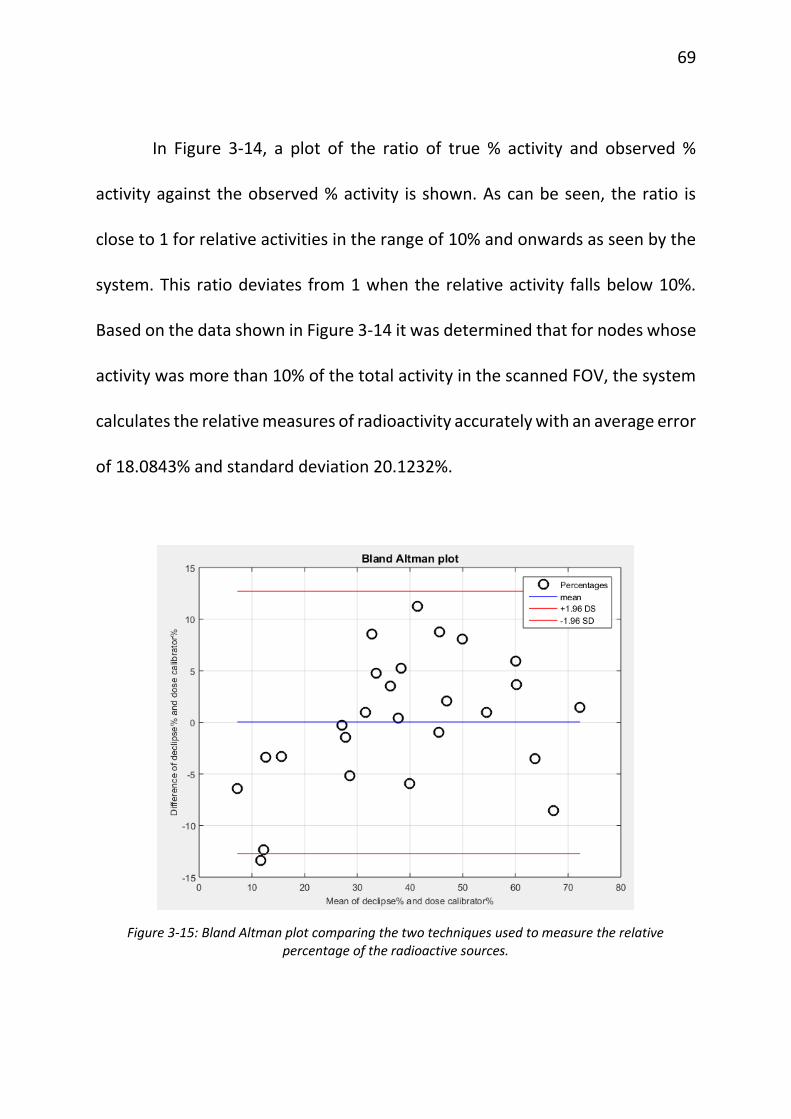
Figure 3-15: Bland Altman plot comparing the two techniques used to measure the relative percentage of the radioactive sources.
70
Figure 3-15 shows the Bland Altman plot comparing the two methods
used for the quantification of radio-activities. Since the mean of the difference
between observed % and true % is zero, there is no systematic bias associated
with the reporting of the relative activities by the system. The sentinel node was
correctly identified in each case with 100% accuracy.
I. Attenuation Correction
I.i) Background
Gamma rays emitted by a source (node or lesion) are attenuated
(absorbed and/or scattered) by any intervening material between the source
and the gamma camera. If a source is located deeper inside the tissue, the
gamma rays reaching the camera will be attenuated more than the rays reaching
the camera from a source located nearer to the camera in the same tissue. For
example this is a problem in SLNB when determining relative node activity using
a non-imaging probe, since deeper nodes appear to have lower activity than
they truly have. The activity of the rays Ao coming out of a material with linear
attenuation coefficient µ after travelling x distance in the attenuating material
is given by Beer’s law [63] as
𝐴𝑜 = 𝐴𝑖 ∗ 𝑒(−𝜇𝑥)
71
where Ai is the activity of the rays before entering the material.
However, attenuation compensation can be built into 3D reconstruction
algorithms if the attenuation of the intervening material is known or can be
approximated. These tests were performed to evaluate the degree to which the
investigational system’s reconstruction algorithm can perform attenuation
correction.
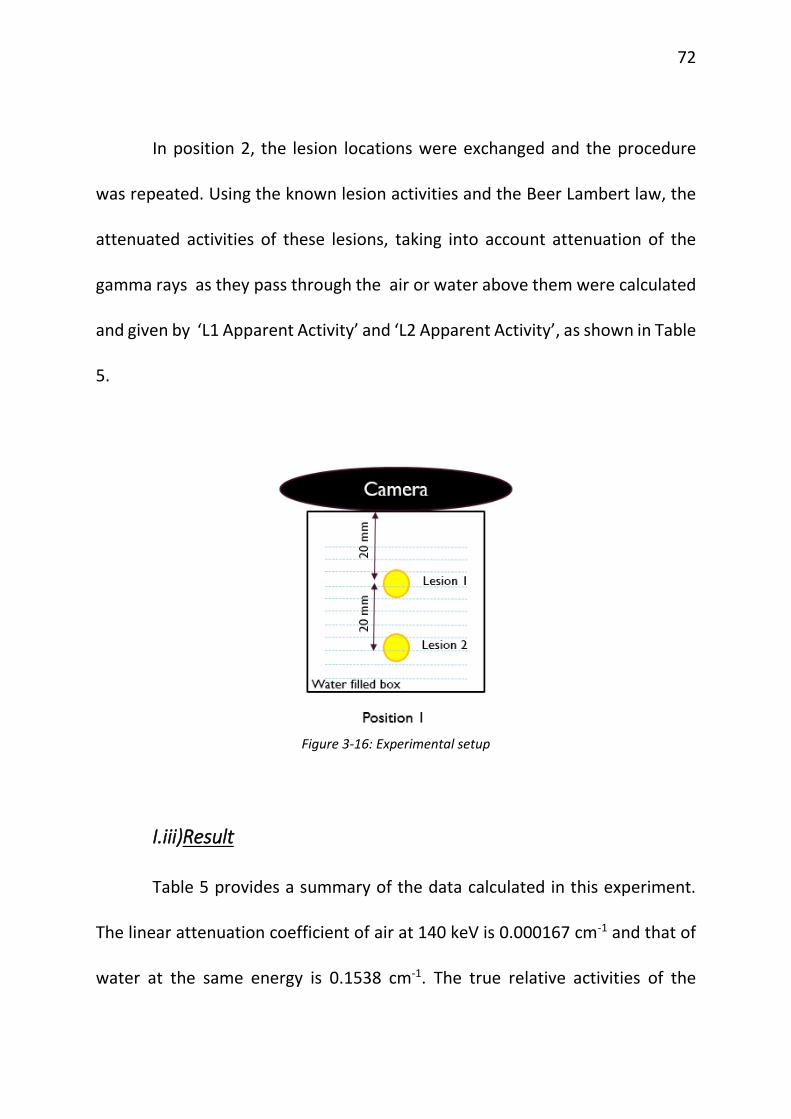
I.ii)Materials and Method
Two small spherical simulated lesions of average activity 24.5 µCi were
placed in a box phantom at varying depths (separation = 20 mm) from the
camera (see Figure 3-16). The camera surface is kept close to the box phantom
surface. In position 1, L1 was at a distance of 20 mm from the camera surface
and L2 was at 40 mm from the camera surface. This set-up was then scanned in
3D mode with the investigational system, first with no water in the box and next
with water in the box. For the in-water case two trials were performed. In all
cases the separation between the lesions was held fixed at 20 mm.
Following each scan the relative lesion activities calculated by the system
were recorded. This is represented by ‘System L1 percentage’ and ‘System L2
percentage’ in Table 5. Activities of lesions at the time of acquisition were given
by the quantities ‘True L1 Activity’ and ‘True L2 Activity’.
72
In position 2, the lesion locations were exchanged and the procedure
was repeated. Using the known lesion activities and the Beer Lambert law, the
attenuated activities of these lesions, taking into account attenuation of the
gamma rays as they pass through the air or water above them were calculated
and given by ‘L1 Apparent Activity’ and ‘L2 Apparent Activity’, as shown in Table
5.
Figure 3-16: Experimental setup
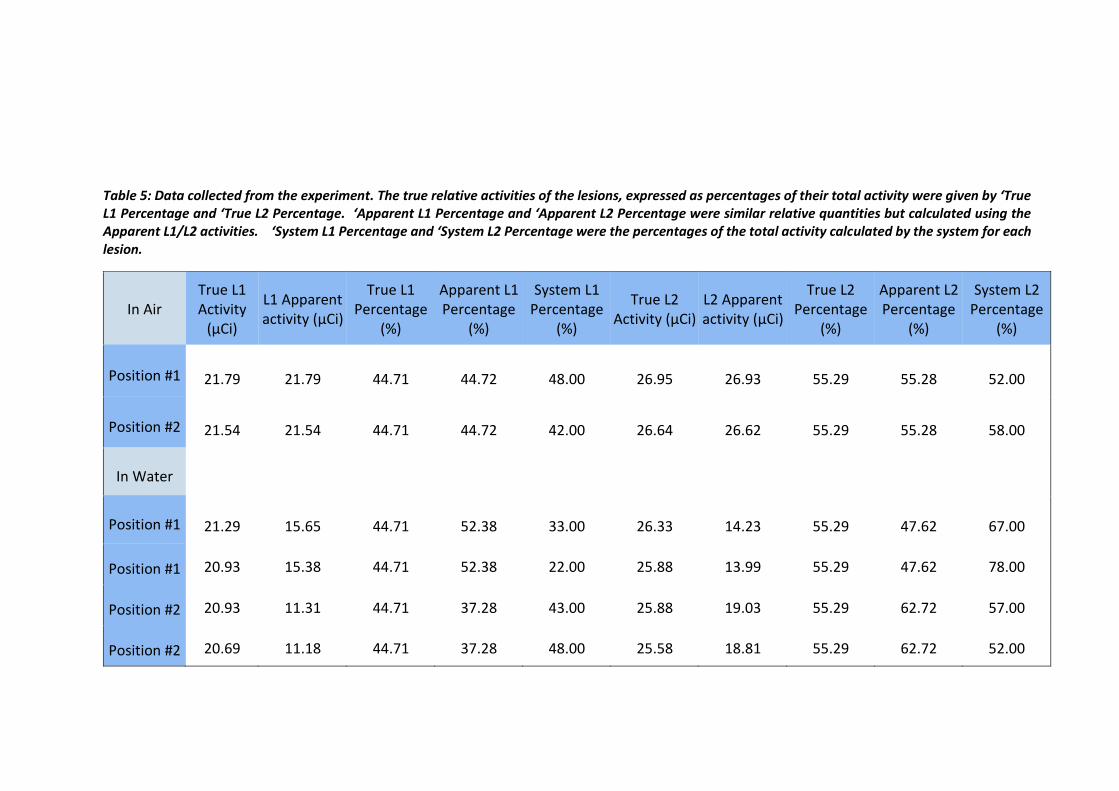
I.iii)Result
Table 5 provides a summary of the data calculated in this experiment.
The linear attenuation coefficient of air at 140 keV is 0.000167 cm-1 and that of
water at the same energy is 0.1538 cm-1. The true relative activities of the
73
lesions, expressed as percentages of their total activity were given by ‘True L1
Percentage and ‘True L2 Percentage. ‘Apparent L1 Percentage and ‘Apparent L2
Percentage were similar relative quantities but calculated using the Apparent
L1/L2 activities. ‘System L1 Percentage and ‘System L2 Percentage were the
percentages of the total activity calculated by the system for each lesion.
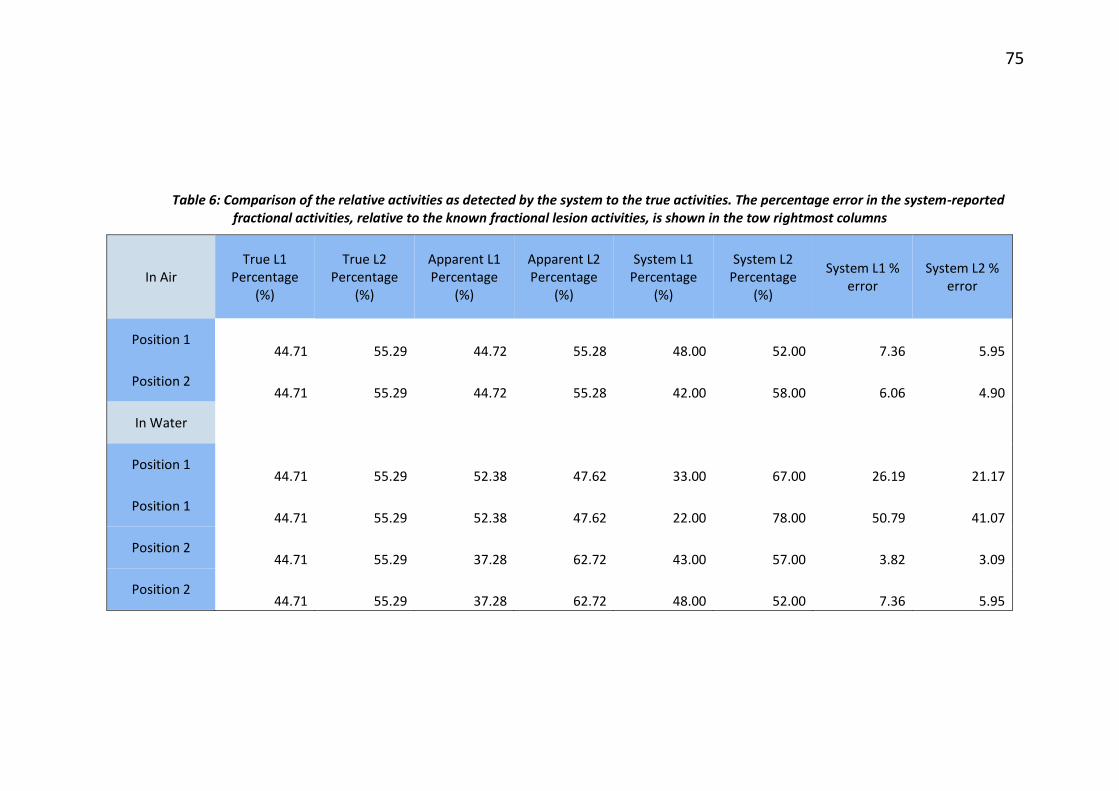
Table 6 shows that even though the lesions might deceptively look less
radioactive than they actually were owing to the effect of attenuation caused by
the water medium, the system compensated for this effect and correctly
identified the higher (or lower) active sources. True L1 Percentage column
shows the fraction of total activity actually contained in lesion 1, and that can
be compared to System L1 Percentage to see how well the imaging system was
able to perform attenuation correction. Similar comparisons can be made for L2.
The percentage error in the system-reported fractional activities, relative to the
known fractional lesion activities, is shown in the two rightmost columns.
Table 5: Data collected from the experiment. The true relative activities of the lesions, expressed as percentages of their total activity were given by ‘True L1 Percentage and ‘True L2 Percentage. ‘Apparent L1 Percentage and ‘Apparent L2 Percentage were similar relative quantities but calculated using the Apparent L1/L2 activities. ‘System L1 Percentage and ‘System L2 Percentage were the percentages of the total activity calculated by the system for each lesion.
Table 6: Comparison of the relative activities as detected by the system to the true activities. The percentage error in the system-reported fractional activities, relative to the known fractional lesion activities, is shown in the tow rightmost columns
In Air True L1
Percentage (%)
True L2 Percentage
(%)
Apparent L1 Percentage
(%)
Apparent L2 Percentage
(%)
System L1 Percentage
(%)
System L2 Percentage
(%)
System L1 % error
System L2 % error
Position 1 44.71 55.29 44.72 55.28 48.00 52.00 7.36 5.95
Position 2 44.71 55.29 44.72 55.28 42.00 58.00 6.06 4.90
In Water
Position 1 44.71 55.29 52.38 47.62 33.00 67.00 26.19 21.17
Position 1 44.71 55.29 52.38 47.62 22.00 78.00 50.79 41.07
Position 2 44.71 55.29 37.28 62.72 43.00 57.00 3.82 3.09
Position 2 44.71 55.29 37.28 62.72 48.00 52.00 7.36 5.95
J. Effect of Injection Site
J.i) Background
During the sentinel lymph node biopsy, the radioactive colloid is injected
using peri-tumoral, sub-dermal or sub-areolar injection techniques[64]–[67].
The drainage of the radioactive tracer from the point of injection then tracks the
path of putative cancer cells through the lymphatic system. Since the injection
is done in tissue and drainage is through the lymphatic system, drainage from
the injection site to the sentinel nodes will take about 24 hours. The amount of
injected activity that ends up in a sentinel node is only 3.5 ± 3.1% of the injected
activity [9] so the injection site is considerably more radioactive than the nodes
at the time of surgery. This significantly high radioactive source emits numerous
gamma rays some of which can scatter into the parallel holes of the gamma
camera collimator, producing background noise in the projection images.
J.ii) Materials and Method
To assess the degree of severity of this scatter radiation, the effect was
simulated with an experimental set up shown in Figure 3-17. Case 1 consisted of
two spherical radioactive node-simulating sources of approximately 4 µCi each,
similar in activity to sentinel nodes. These sources were immersed in a water
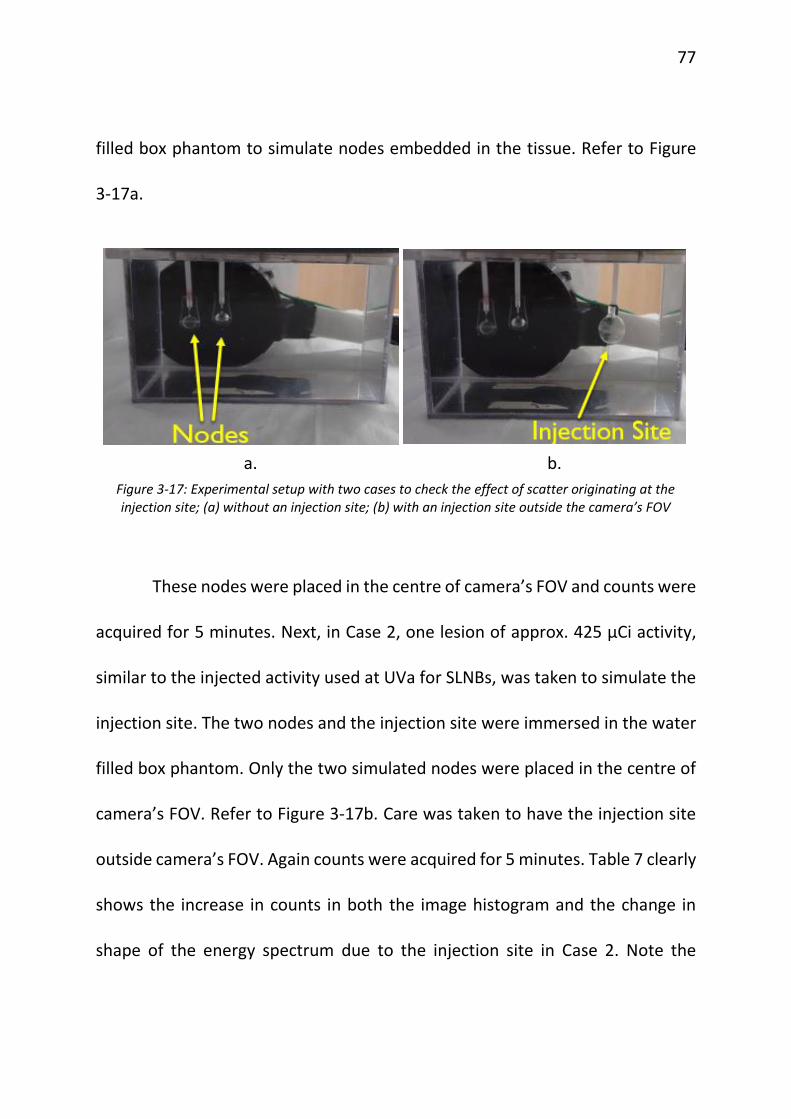
77
filled box phantom to simulate nodes embedded in the tissue. Refer to Figure
3-17a.
These nodes were placed in the centre of camera’s FOV and counts were
acquired for 5 minutes. Next, in Case 2, one lesion of approx. 425 µCi activity,
similar to the injected activity used at UVa for SLNBs, was taken to simulate the
injection site. The two nodes and the injection site were immersed in the water
filled box phantom. Only the two simulated nodes were placed in the centre of
camera’s FOV. Refer to Figure 3-17b. Care was taken to have the injection site
outside camera’s FOV. Again counts were acquired for 5 minutes. Table 7 clearly
shows the increase in counts in both the image histogram and the change in
shape of the energy spectrum due to the injection site in Case 2. Note the
a. b.
Figure 3-17: Experimental setup with two cases to check the effect of scatter originating at the injection site; (a) without an injection site; (b) with an injection site outside the camera’s FOV
78
additional lower energy counts in the second spectrum, which are from scatter
originating at the injection site.
J.iii) Result
a
b
C d
Figure 3-18: Effects of scatter due to injection site a. Energy histogram with no injection site present; b. energy histogram with injection site present; c. node images with no injection site; d.
node images with injection site present.
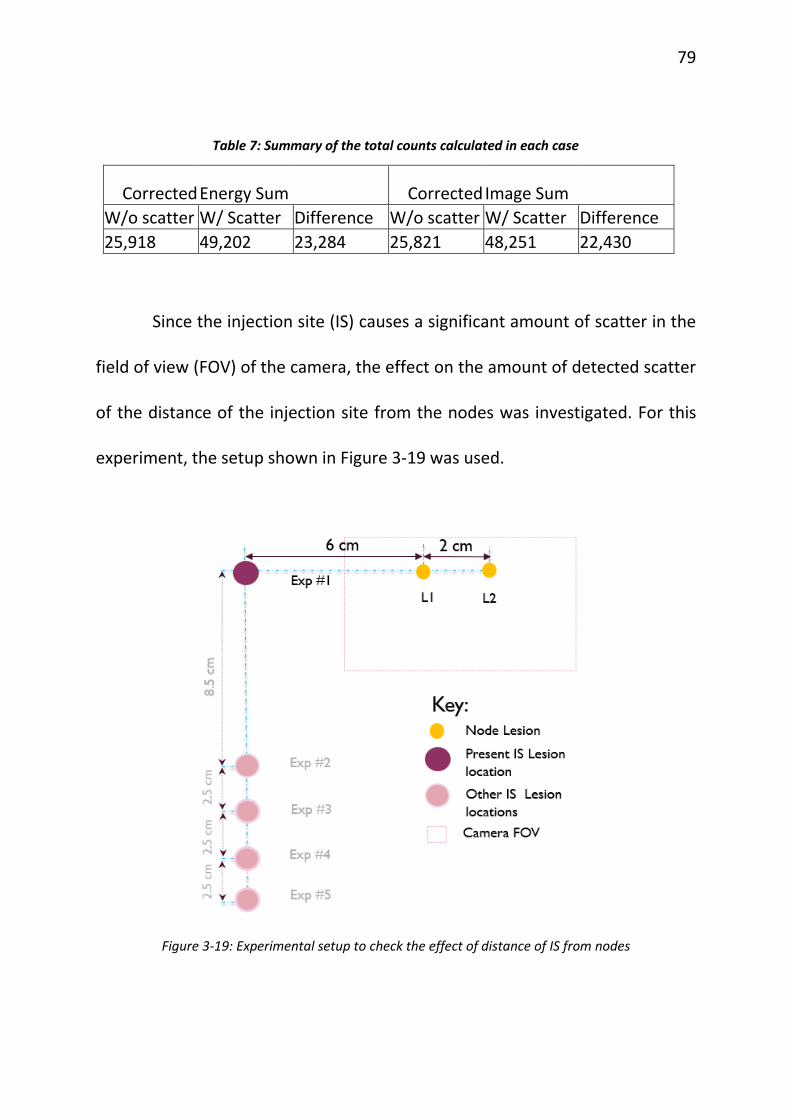
79
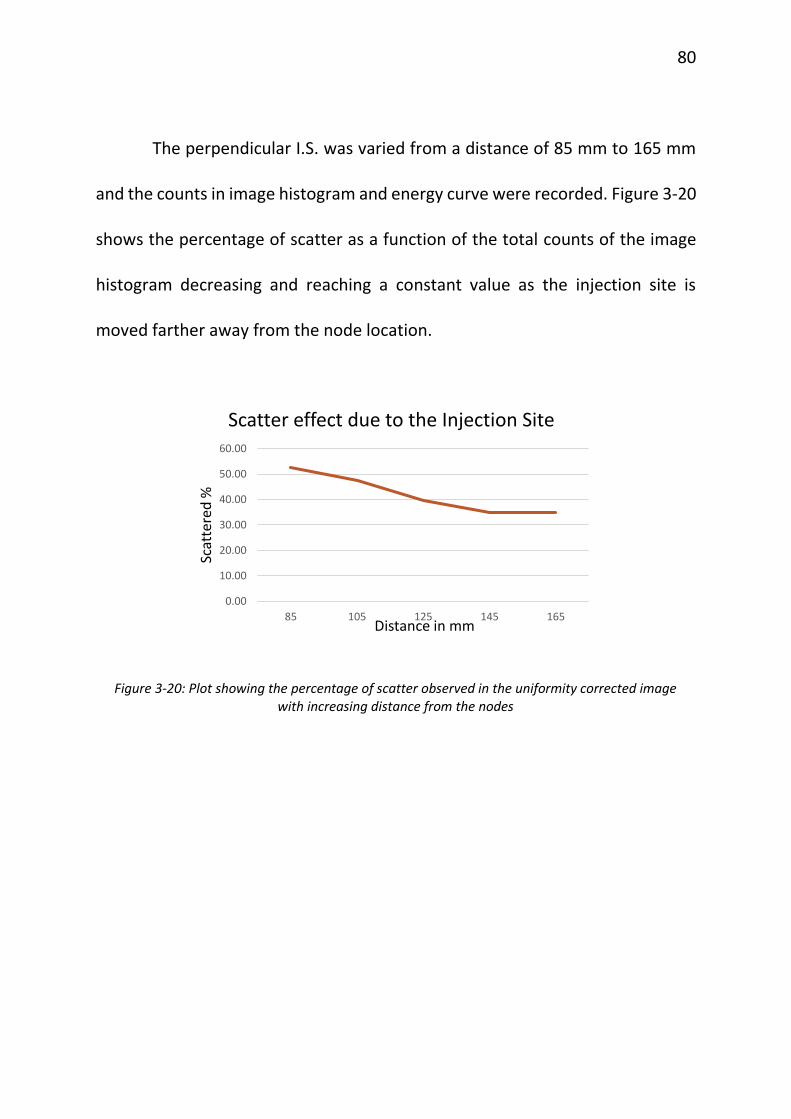
Table 7: Summary of the total counts calculated in each case