34
Evaluation of Benzene Fenceline Monitoring Program in USEPA’s Proposed Refinery Sector Rule BY: Ted Bowie, Carla Kinslow, Steven Ramsey, Shagun Bhat
| Date post: | 15-Dec-2015 |
| Category: |
Documents |
| Upload: | elian-holness |
| View: | 224 times |
| Download: | 0 times |

Evaluation of Benzene Fenceline Monitoring Program in USEPA’s Proposed Refinery Sector RuleBY:Ted Bowie, Carla Kinslow, Steven Ramsey, Shagun Bhat

• 142 large (major sources) and 7 small (area source) petroleum refineries in the United States
• USEPA: Refineries emit ~20,000 tons per year hazardous air pollutants (HAPs)
• Proposed rulemaking includes amendments to Maximum Achievable Control Technology (MACT) standards and New Source Performance Standards (NSPS)– MACT 1 (1995) covers non-combustion or evaporative sources
(e.g., equipment leaks, tanks, wastewater, miscellaneous process vents, cooling towers)
– MACT 2 (2002) covers combustion sources (e.g., catalytic cracking units, catalytic reforming units, and sulfur recovery units)
– NSPS J/Ja (2012) covers fuel gas combustion devices, FCCU, sulfur plants, delayed cokers, flares, and process heaters
Overview of Refinery Source Category
Data source: USEPA
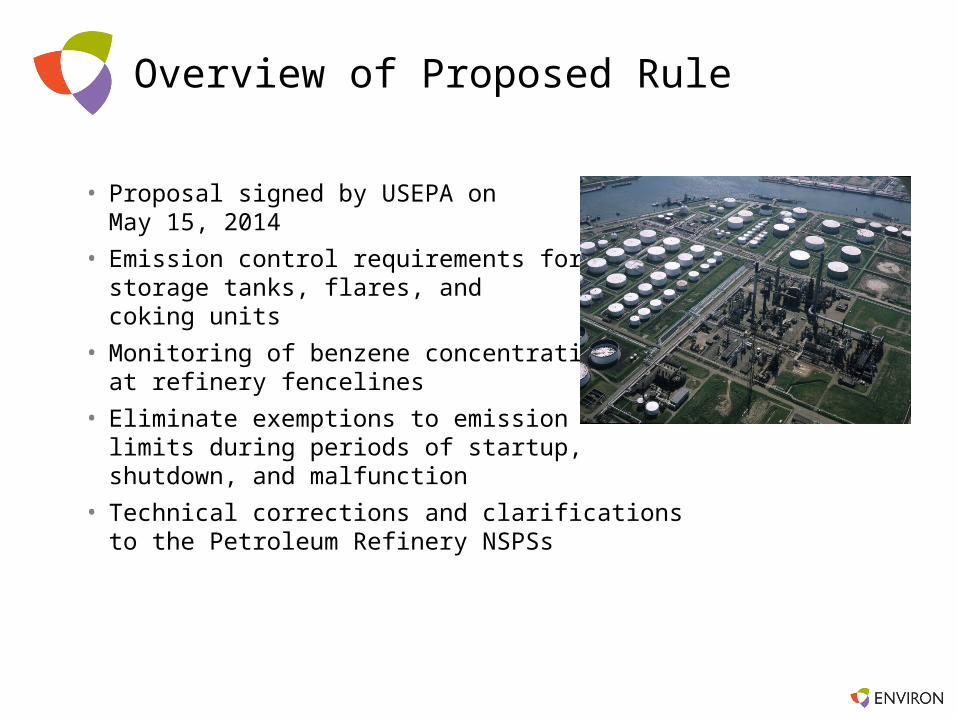
Overview of Proposed Rule
• Proposal signed by USEPA onMay 15, 2014
• Emission control requirements for storage tanks, flares, and coking units
• Monitoring of benzene concentrations at refinery fencelines
• Eliminate exemptions to emission limits during periods of startup, shutdown, and malfunction
• Technical corrections and clarifications to the Petroleum Refinery NSPSs
What Does USEPA’s Residual Risk Analysis Show?
• Risk deemed to be “acceptable” under 112(f)
• Highest maximum individual risk (MIR) estimated at 60 in a million (actuals) and 100 in a million (allowables)– Highest MIR driven by naphthalene and benzene from equipment leaks
• Sector-wide population at risk greater than 1 in a million is predicted at 5,000,000– Cancer incidence of 0.3 cases/year driven by delayed cokers (DCU)
and PAHs
• Maximum chronic non-cancer HI of 0.9 due to emissions hydrogen cyanide from FCCU
• Maximum acute non-cancer HQ of 5 due to emissions of nickel from FCCU
• Proposed amendments estimated to lower population at risk to 4,000,000, and reduce incidence about 18%

Rationale for Benzene Fenceline Monitoring Program
• Purpose: “Backstop” to detect under-counted emissions (particularly fugitives)
• Certain emissions sources (e.g., fugitive leaks) difficult to quantify with methods currently available
• Uncertainties in emissions estimates related to mischaracterization of emission sources:– Exclusion of nonroutine emissions
– Omission of sources that are unexpected, not measured, or not considered part of the affected source
– Improper characterization of sources for emission models and emission factors
Data source: USEPA

Fenceline Monitoring Requirements
Small (<750 acres)
12 monitors
30° interval
100
80
60
40
200
340
320
300
280
260
240
220
200180
160
140
120
90
120
150180210
240
270
300
3300 30
60
0 1530
4560
75
90
105
120
135150
165180195210
225
240
255
27
0285
300
315
330345
Medium (750-1,500
acres)
18 monitors
20° interval
Large(>1,500 acres)
24 monitors
15° interval

• Passive diffusive tube monitors• Annual average of 2-week samples,
calculated as:
• Compare to action level of 9 µg/m3
• Calculate rolling annual average within 30 days of completion of each sampling episode– If exceedance, initiate root cause analysis – Develop corrective action plan and take
corrective action
• Recordkeeping and Reporting – Report fenceline data within 45 days of
the end of semiannual periods– Site specific ambient monitoring plan
Fenceline Monitoring Requirements (cont)
HFC = Maximum (MFCi –OSCi)
Data source: USEPA

Potential Issues with Benzene Fenceline Monitoring Requirements
• Possible community misunderstanding
• Monitoring results largely dependent on configuration of benzene sources
• Alternative chemicals may be better surrogates of fugitives from some refineries
• Identification of background or offsite contributors difficult with passive sampling approach
• Monitoring provides little (if any) information regarding which sources to control
• Significant cost
• No offramp for refineries with low benzene concentrations
Public Relations
• Fenceline concentrations are not representative of chronic risks, but some members of the public may misunderstand the data
• Stated purpose of benzene monitoring is to detect un-reported emissions, but…– Some might attempt to equate benzene
concentrations to risks
– Data will be publically available

Is Benzene the Best Surrogate for Fugitives?
Total VOCs might be a better surrogate• Not all facilities have large benzene emissions
• Larger emissions of VOCs easier to measure/detect
• Affordable, real-time instrumentation for measurement of total VOCs (e.g., PID) allows correlation with wind direction
Benzene Total VOCs
Average Fugitive Emissions (% of total) 64% 64%
Total Emissions (1,000 TPY) 1.2 99
Facility Counts 142 142

Identification of Background Difficult with Passive Sampling
Facility 1
Facility 2
Facility 3
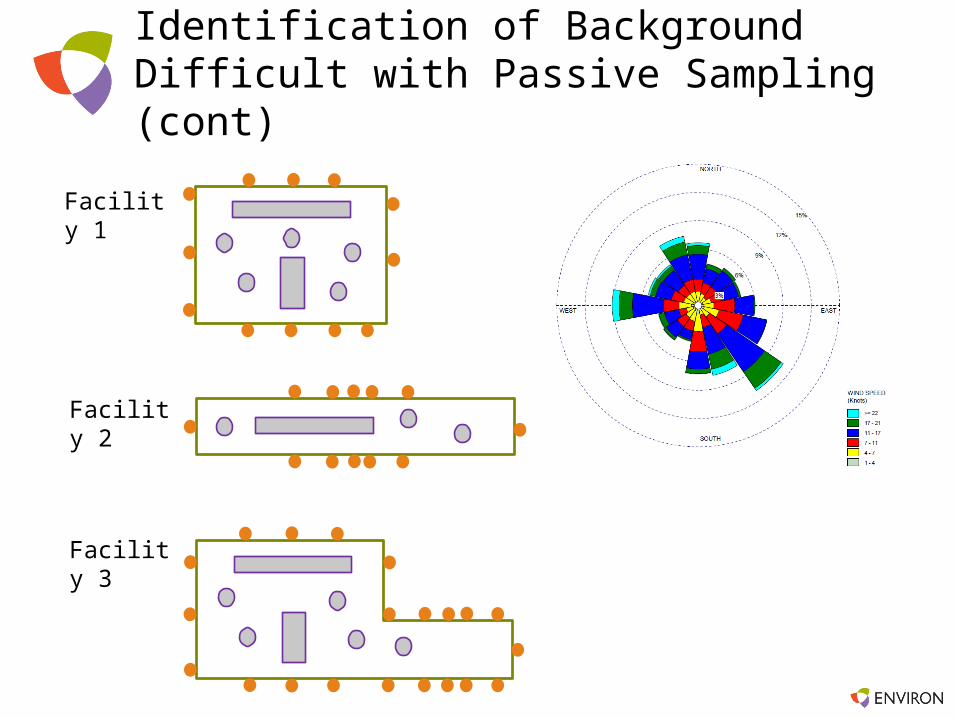
Identification of Background Difficult with Passive Sampling (cont)
Facility 1
Facility 2
Facility 3

Identification of Offsite Contributors Difficult with Passive Sampling
Facility 1
Facility 2
Facility 3

Identification of Offsite Contributors Difficult with Passive Sampling (cont)
Facility 1
Facility 2
Facility 3

Configuration Determines Whether Monitoring Provides Information on Which Sources to Control

Significant Cost
Does not include costs for:• Site specific monitoring plan
• Root cause analysis
• Corrective action plan and implementation
Costs for Fenceline Monitoring
Model Plant
Capital Costs (US$) Annualized Cost (US$)
In-House AnalysisOutsourced
AnalysisIn-House Analysis
Outsourced Analysis
Small 85,440 21,370 36,300 64,200
Medium 86,650 22,580 41,000 86,900
Large 88,270 23,960 45,900 109,700

Strategies to Overcome Program Limitations
• Conduct dispersion modeling– Identify which sources are driving
benzene concentrations
– Identify benzene “hot spots”
• Perform meteorological data analysis– Determine if winds are consistent,
or if diurnal or seasonal variations are present
– Identify which monitors are upwind and downwind (if possible)

Strategies to Overcome Program Limitations (cont)
• Consider additional monitors– Offsite monitors can help tease out
background and offsite sources
– Onsite monitors can help identify larger fugitive sources (e.g., LDAR)
• Consider focused real-time monitoring – Determine if concentrations due to
onsite or offsite sources
– Identify and correct problems quicker than with passive approach
– Options range from simplistic (e.g., PID) to more sophisticated (e.g., UV-DOAS)
Strategies to Overcome Program Limitations (cont)
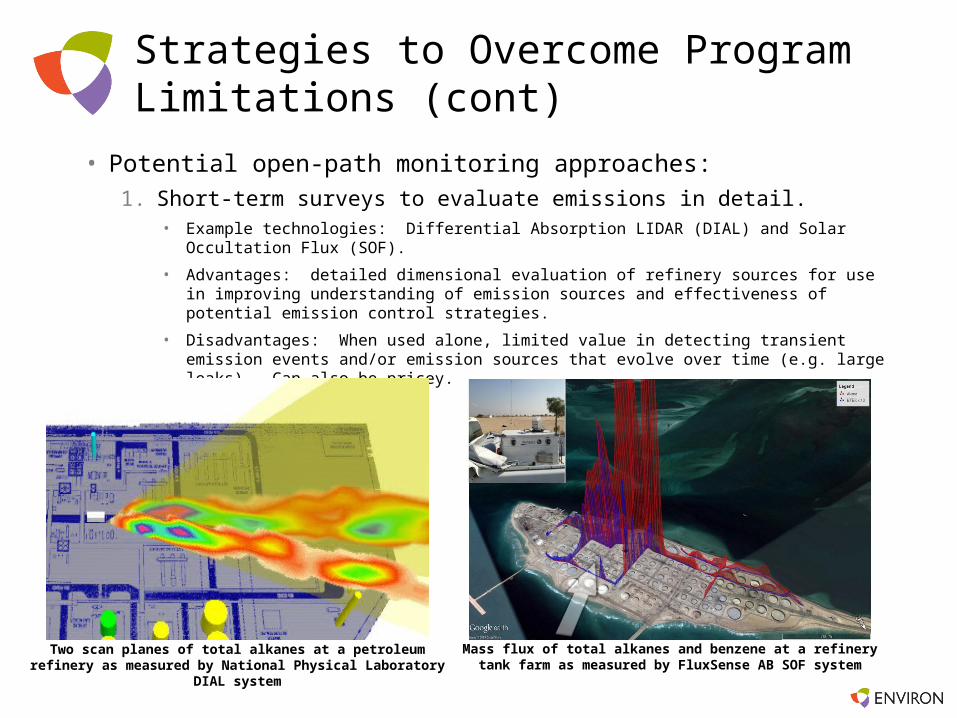
• Potential open-path monitoring approaches:1. Short-term surveys to evaluate emissions in detail.
• Example technologies: Differential Absorption LIDAR (DIAL) and Solar Occultation Flux (SOF).
• Advantages: detailed dimensional evaluation of refinery sources for use in improving understanding of emission sources and effectiveness of potential emission control strategies.
• Disadvantages: When used alone, limited value in detecting transient emission events and/or emission sources that evolve over time (e.g. large leaks). Can also be pricey.
Mass flux of total alkanes and benzene at a refinery tank farm as measured by FluxSense AB SOF system
Two scan planes of total alkanes at a petroleum refinery as measured by National Physical Laboratory DIAL system
Strategies to Overcome Program Limitations (cont)
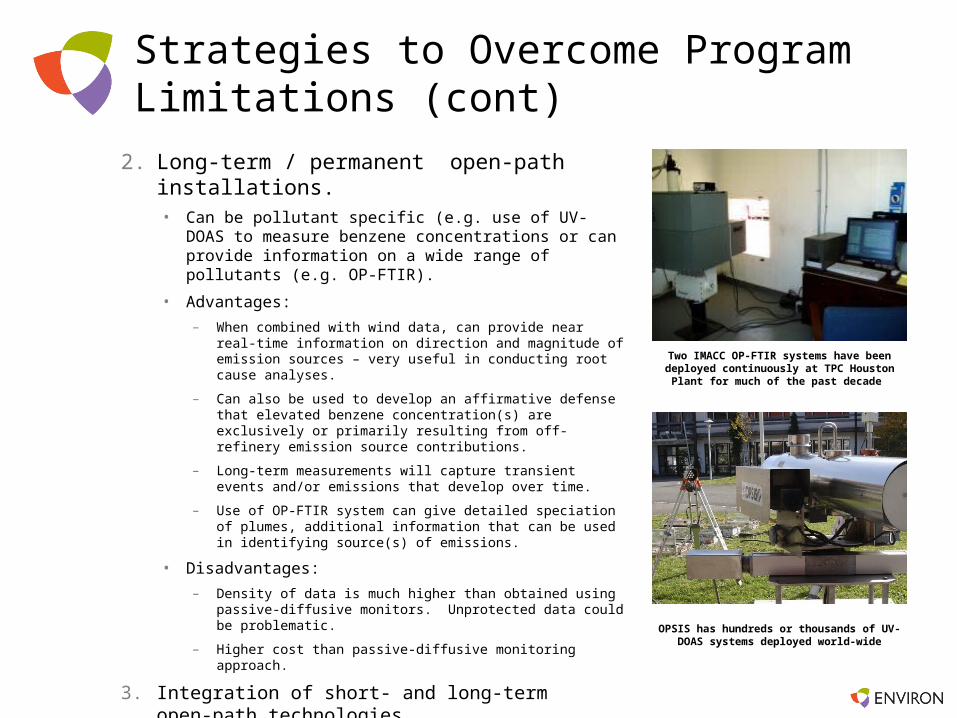
2. Long-term / permanent open-path installations. • Can be pollutant specific (e.g. use of UV-DOAS to
measure benzene concentrations or can provide information on a wide range of pollutants (e.g. OP-FTIR).
• Advantages:
– When combined with wind data, can provide near real-time information on direction and magnitude of emission sources – very useful in conducting root cause analyses.
– Can also be used to develop an affirmative defense that elevated benzene concentration(s) are exclusively or primarily resulting from off-refinery emission source contributions.
– Long-term measurements will capture transient events and/or emissions that develop over time.
– Use of OP-FTIR system can give detailed speciation of plumes, additional information that can be used in identifying source(s) of emissions.
• Disadvantages:
– Density of data is much higher than obtained using passive-diffusive monitors. Unprotected data could be problematic.
– Higher cost than passive-diffusive monitoring approach.
3. Integration of short- and long-term open-path technologies.
Two IMACC OP-FTIR systems have been deployed continuously at TPC Houston Plant for much of
the past decade
OPSIS has hundreds or thousands of UV-DOAS systems deployed world-wide

Carla Kinslow, Ph.D.ENVIRON International CorporationHouston, TX
Risk Communication at the Fenceline

USEPA Requirement (draft):Data available to the public
“Fenceline data at each monitor location be reported electronically for each semiannual period’s worth of sampling periods (i.e., 13 to 14 2-week sampling periods per semiannual period).
These data would be reported within 45 days of the end of each semiannual period,
and will be made available to the public through the USEPA’s electronic reporting and data retrieval portal, in keeping with the USEPA’s efforts to streamline and reduce reporting burden and to move away from hard copy submittals of data where feasible.”
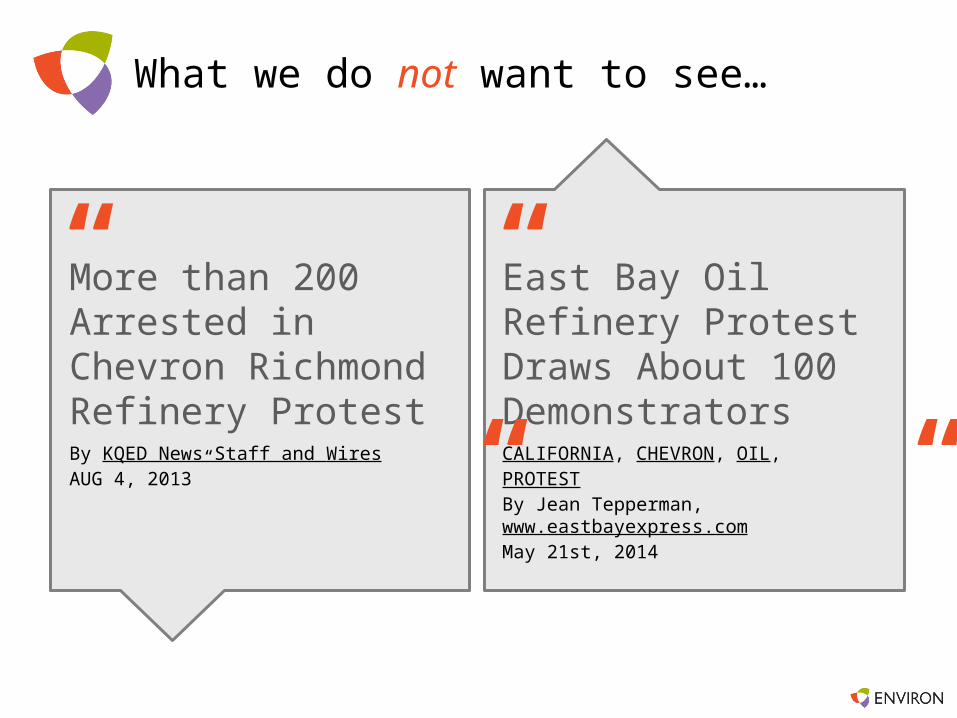
More than 200 Arrested in Chevron Richmond Refinery Protest
East Bay Oil Refinery Protest Draws About 100 Demonstrators
What we do not want to see…
By KQED News Staff and WiresAUG 4, 2013”
CALIFORNIA, CHEVRON, OIL, PROTEST By Jean Tepperman, www.eastbayexpress.comMay 21st, 2014
“
”
“
”

https://www.google.com/maps/d/viewer?mid=zjpyd3HCGpZc.kGZ_8kcWmueI&hl=en&ie=UTF8&msa=0&ll=56.018775,-3.707972&spn=8.320716,19.248047&z=6
Website for finding your nearest Oil Refinery Protest:
Risk Communication Strategies
• Early elements– Early education
– Transparency
– What you expect
– Intentional
• Later Elements – Data interpretation– What it means
– Open communication
– Data summaries
– Dialogue to resolve exceedances

What will communities expect?
2013 pilot study on Community Advisory Panel (CAP) Topics in the Houston Ship Channel

View from the front porch

Safe
ty
Bette
r com
mun
icat
ions
Air Qua
lity
Tra
nspo
ratio
n
Futu
re p
lans
Plan
t Tou
rs
Jobs
in th
e in
dust
ry
Was
te
Educ
atio
n0
5
10
15
20
25
30
35
% o
f to
tal m
eeti
ngs
Tran
spor
tatio
n
Community No. 1Fence Line Community Interest Study Main topics of meetings (1997-2013)

Safety – highest concern
Communities 1, 2 and 3Fence Line Community Interest StudyMain topics of meetings (2012-2013)
% o
f all
even
ts (
n=
40
)
Jobs in the
industry
Chemistry
30
25
20
15
10
5
0
Safety Air Quality
Transportation Better communicatio
n
Plant Tours
Future plans
Water useWaste

These findings reflect a relational theory of risk communication
• Recognizing the perceived object at risk– Environmental
– From the city’s perspective
– Safety
– Freedom?
• Communicating the correct risk object– Toxins in the air
– Explosion
• Communicating the correct association between the two– Education, Data
• Risk communication is a social process– Social trust
Communicating inconclusive data
• These data are changing– Experts are ok with this – it’s normal
• Overcoming the knowledge gap – Taking-on the role of educator
– Recognizing and communicating what are the next steps• Example – “the preliminary data says…more data is coming…we will be
much more certain when we have…amount/type of data…”
– Communicating the strength of evidence• Evidence map
– Speaking as a scientist • Non-bias
• Weight of evidence
A Team
• Skills– Technical – Geology/Engineering
– Health Impacts – Toxicology
– Regulatory – various skills
– Communications – Seasoned Communicator
– Business – Economics
• Cross trained in the other disciplines
• Culturally educated
• Invest in time with the community – visibility
Summary
• Trust and Relationship is gained through– Consistency
– Honesty
– Transparency
• Proactive
• Learning from established FLC
• These communities change with time
• View the Community as a part of the industry

Questions?
Ted Bowie, MS, PE, [email protected]
Carla Kinslow, [email protected]
Steven Ramsey, PE, [email protected]
Shagun Bhat, [email protected]


