UNIVERSIDADE DE LISBOA FACULDADE DE CIÊNCIAS DEPARTAMENTO DE ENGENHARIA GEOGRÁFICA, GEOFÍSICA E ENERGIA Evaluation of dehumidification system energy usage in ice rinks Diogo Bermejo Pereira Rodrigues da Silva Dissertação Mestrado Integrado em Engenharia da Energia e do Ambiente Ano 2013
Transcript
UNIVERSIDADE DE LISBOA
FACULDADE DE CIÊNCIAS
DEPARTAMENTO DE ENGENHARIA GEOGRÁFICA, GEOFÍSICA E ENERGIA
Evaluation of dehumidification system energy usage in
ice rinks
Diogo Bermejo Pereira Rodrigues da Silva
Dissertação
Mestrado Integrado em Engenharia da Energia e do Ambiente
Ano 2013
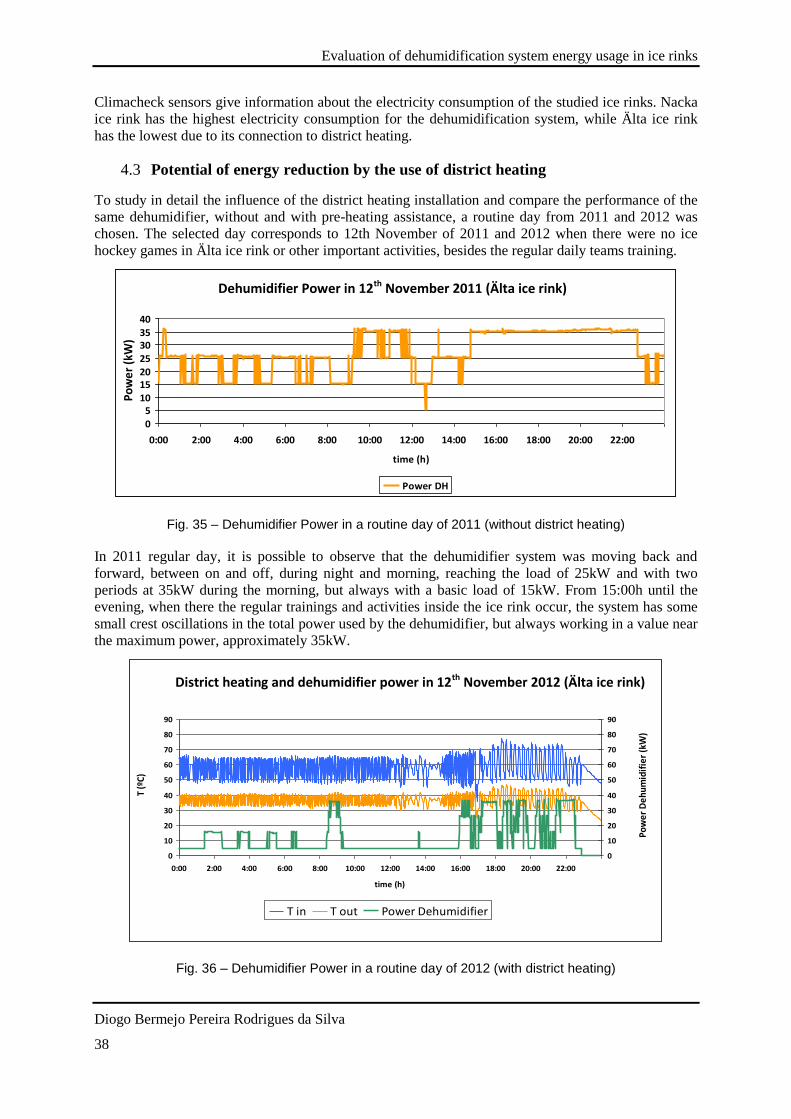
Evaluation of dehumidification system energy usage in ice rinks
Diogo Bermejo Pereira Rodrigues da Silva 2
UNIVERSIDADE DE LISBOA
FACULDADE DE CIÊNCIAS
DEPARTAMENTO DE ENGENHARIA GEOGRÁFICA, GEOFÍSICA E ENERGIA
Evaluation of dehumidification system energy usage in
ice rinks
Diogo Bermejo Pereira Rodrigues da Silva
Dissertação de Mestrado Integrado em Engenharia da Energia e do Ambiente
Trabalho realizado sob a supervisão de:
Jörgen Rogstam (Energi & Kylanalys)
Marta João Nunes Oliveira Panão (FCUL)
Ano 2013
Evaluation of dehumidification system energy usage in ice rinks
Diogo Bermejo Pereira Rodrigues da Silva 3
Abstract
Ice skating rinks are one of the largest energy consumers in terms of public buildings due to its
simultaneous needs of cooling, heating, ventilation and lighting for different parts of the structure,
which means that these facilities have also a lot of potential for saving energy.
Saving energy from dehumidification systems in ice rinks is a subject that still needs to be developed
and investigated with an increased focus in matters of energy efficiency in these types of structure.
The performance of the dehumidification system of diverse ice rinks located near the city of
Stockholm, Sweden, is here analysed in order to evaluate the use of energy related to indoor and
outdoor climate. The connection of a district heating system to a dehumidifier in Älta ice rink is also
investigated, with the final conclusion that the amount of electricity that the system is able to save is
nearly 50%.
There are two different types of dehumidifiers and their energy consumption is studied and further
compared with the obtained values of energy usage by the refrigeration system to dehumidify the air
using the ice slab. The results show that the ice slab uses much less energy comparing with the
dehumidifier system (0,336 and 2,076kWh/kg water, respectively, in Älta ice rink case).
The bibliography points out that the energy use related to dehumidification of an ice rink is 4 to 6% of
the total ice rink energy consumption but, in this project, that real value is accurately quantified using
proper equipment for Swedish ice rinks and observe that percentage is, actually, underestimated in the
current “state of art”.
At the moment, the number of ice rinks in Sweden is about 350 and the average of the annual energy
consumption is about 1000 MWh/year. With current knowledge that the number of installations is
growing in a rate of 5-10 per year in the country, energy saving measures are evaluated and studied in
these facilities in order to upgrade the old structures and improve the new ones.
Key words: energy efficiency, ice rink, dehumidification system
Evaluation of dehumidification system energy usage in ice rinks
Diogo Bermejo Pereira Rodrigues da Silva 4
Acknowledgment
I would like to express my special gratitude to those who had given me their contribution, in some
way, to complete this master project report. Particularly, I want to express my appreciation to Jörgen
Rogstam, for the opportunity of working close to industrial reality in a foreign country, for his support
and motivation when things were not going so well. I would like to thank my master thesis supervisor,
Marta Panão, for her valuable help structuring the work and for her precious advises.
My friends, from my University and from my hometown, made me feel that they were always there
(even if they were not) and I also wish to dedicate some words to them, for their support by distance in
my adventure abroad. For the friends I made in Sweden, I also have some words of gratitude for their
support and friendship as well.
Special thanks to my friend Daniel Santos, who shared with me the adventure in Sweden and also
worked in a similar theme. It was always meaningful to have someone near to discuss some related
topic and to keep each other motivated with the work.
My last words, and the most important for me, go to my family, with special consideration to my
parents, Carlos Silva and Maria Eduarda Silva, and to my sister, Alice Bermejo Silva, for their
continuous support and trust.
Thanks to all above. Even in difficult times, we made it happen. We can build an ice rink everywhere.
Evaluation of dehumidification system energy usage in ice rinks
Evaluation of dehumidification system energy usage in ice rinks
Diogo Bermejo Pereira Rodrigues da Silva
29
Saltsjöbaden case study
Fig. 23 – Sensors comparison in Saltsjöbaden ice rink for the month of July 2012
In July of 2012, the water content in the air should be very similar for Saltsjöbaden ice rink but the
average difference measured by the two sensors was 1,39 grams of water per kilogram of air. The
possible explanation for this fact is that, below the ice slab in Saltsjöbaden ice rink, there is a sand
floor instead of a concrete floor. Due to the fact that there was no ice, the water retained in the sand
tended to evaporate, causing the great difference in the water content of the air that it is possible to
observe in Figure 23 above.
Fig. 24 – Sensors Comparison in Saltsjöbaden ice rink for the month of November 2012
Sensors Comparison
0,005
0,006
0,007
0,008
0,009
0,01
0,011
0,012
0,013
0,014
0,015
1 3 5 7 9 11 13 15 17 19 21 23 25 27 29 31
July
wat
er c
on
te (
kg w
ater
/kg
air)
W rink
W ishall
Sensors Comparison
0,002
0,0022
0,0024
0,0026
0,0028
0,003
0,0032
0,0034
0,0036
1 3 5 7 9 11 13 15 17 19 21 23 25 27 29
November
wat
er c
on
ten
t (k
g w
ater
/ kg
air
)
W rink
W ishall
Evaluation of dehumidification system energy usage in ice rinks
Diogo Bermejo Pereira Rodrigues da Silva
30
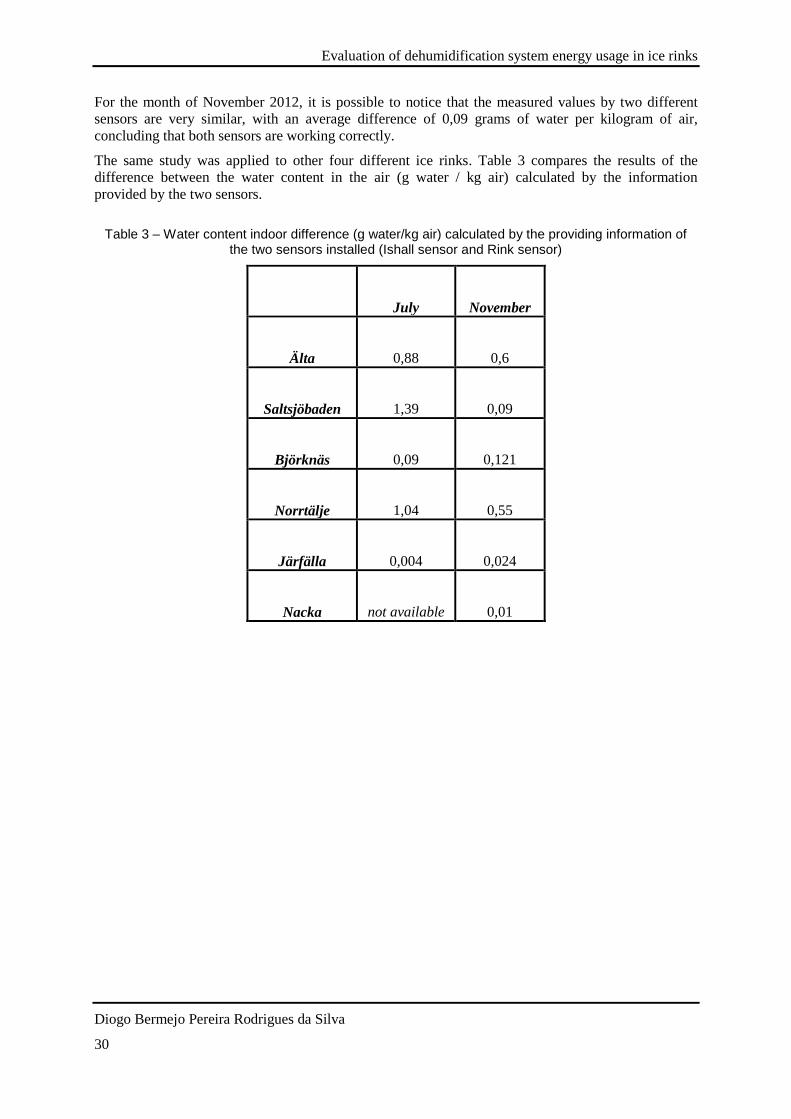
For the month of November 2012, it is possible to notice that the measured values by two different
sensors are very similar, with an average difference of 0,09 grams of water per kilogram of air,
concluding that both sensors are working correctly.
The same study was applied to other four different ice rinks. Table 3 compares the results of the
difference between the water content in the air (g water / kg air) calculated by the information
provided by the two sensors.
Table 3 – Water content indoor difference (g water/kg air) calculated by the providing information of the two sensors installed (Ishall sensor and Rink sensor)
July November
Älta 0,88 0,6
Saltsjöbaden 1,39 0,09
Björknäs 0,09 0,121
Norrtälje 1,04 0,55
Järfälla 0,004 0,024
Nacka not available 0,01
Evaluation of dehumidification system energy usage in ice rinks
Diogo Bermejo Pereira Rodrigues da Silva
31
3.5 Indoor climate analysis through differences in ice temperature
It is important to analyse the impact of the ice temperature in the indoor climate of the ice rink
building.
Järfälla Hockey Club team plays in Swedish second division of ice hockey and, therefore, it was
chosen a day where the team played in Järfälla ice rink. This fact facilitates an overall analysis, with a
large number of spectators and more ice resurfacings during the day. The game started at 16:00h.
Fig. 25 – Ice temperature during the day 18/11/2012 in Järfälla ice rink
Figure 25 shows that the refrigeration system of Järfälla ice rink was shut down during the night and
turned on in the morning. There were two ice resurfacings in the morning to adjust the quality of the
ice.
The game started at 16:00h and, one hour before the game, two ice resurfacings were performed in
order to prepare the rink to the game with the best ice quality. The game end at 18h but there were
some extra-time in the match. There is a small ice resurfacing at that time, the reasons for that are
twofold: i) the use of a lower quantity of water in all the ice pitch or ii) only half of the ice rink was
resurfaced in order to decide the match winner by penalties.
After that time there are two extra ice resurfacings, probably due to additional activities during the
evening in Järfälla ice rink.
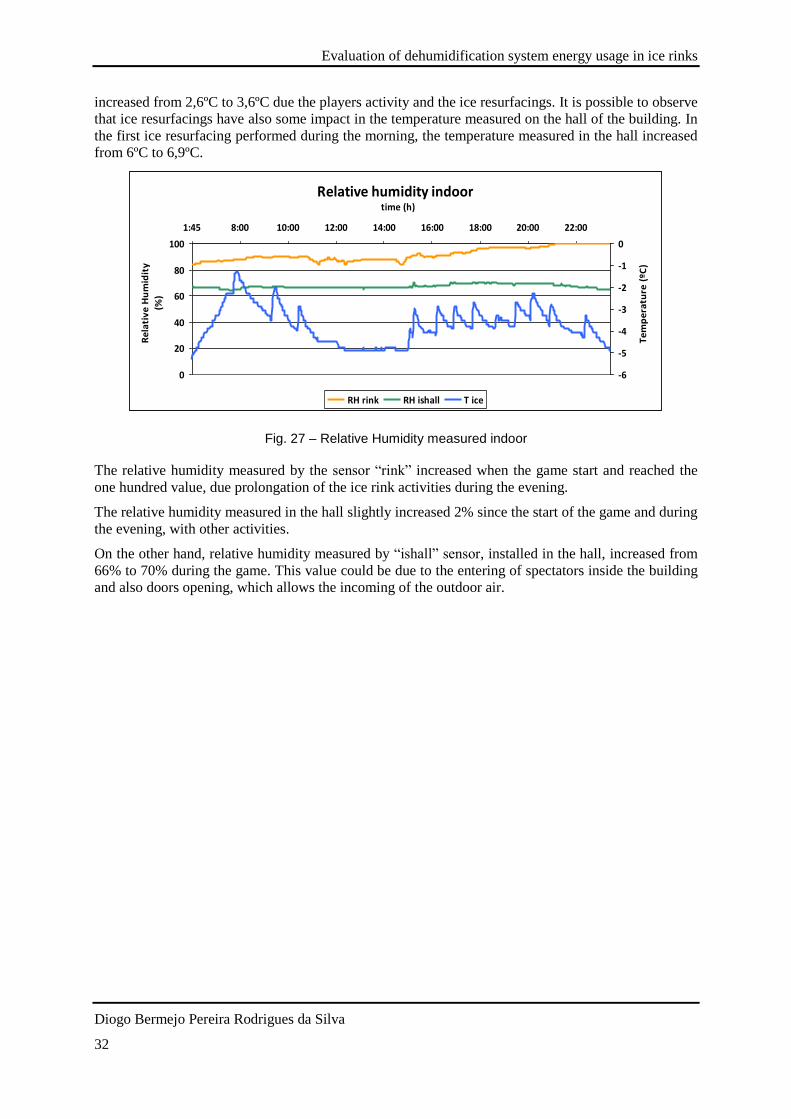
Fig. 26 – Indoor temperatures
During the game period, from 16:00h to 19:00h, approximately, the temperature measured by the
sensor “rink”, which is the sensor installed with a distance of twenty centimetres above the slab,
Linear (Alta 2011) Linear (Saltsjobaden) Linear (Vikingahallen) Linear (Nacka)
Elec
tric
ity
con
sum
pti
on
(kW
h/h
)
Dehumidification electricity consumption vs. (Wout-Win)
Evaluation of dehumidification system energy usage in ice rinks
Diogo Bermejo Pereira Rodrigues da Silva
37
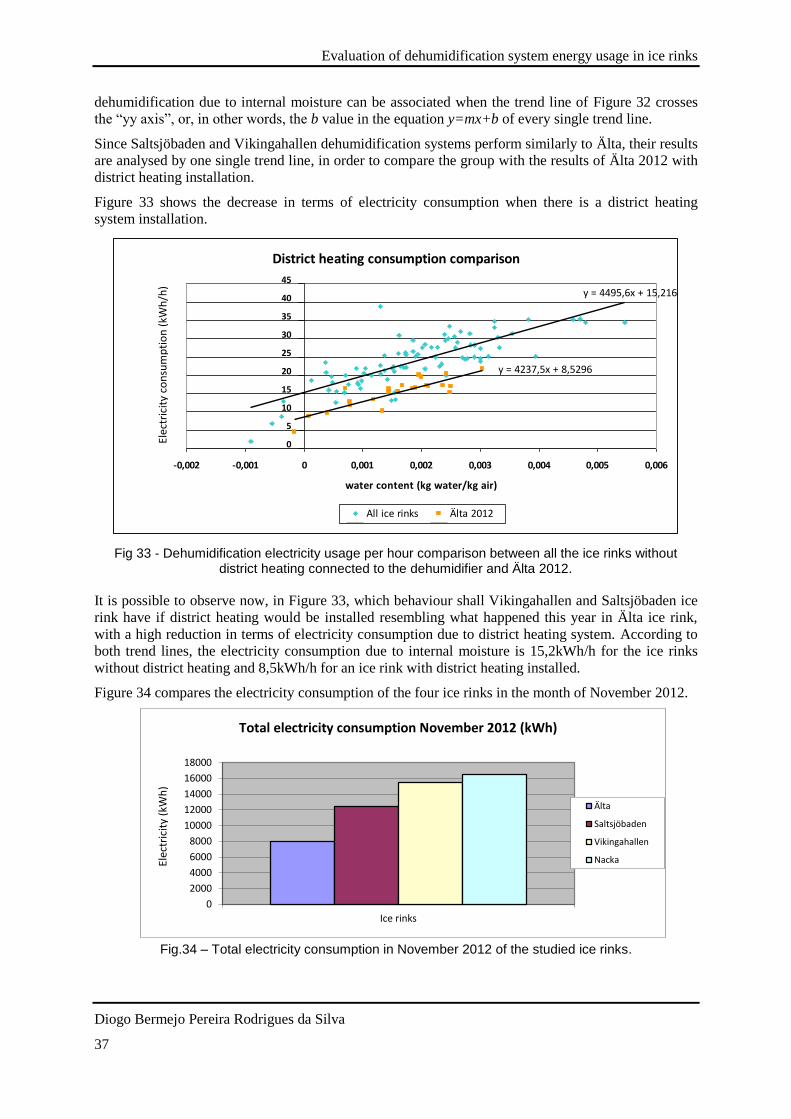
dehumidification due to internal moisture can be associated when the trend line of Figure 32 crosses
the “yy axis”, or, in other words, the b value in the equation y=mx+b of every single trend line.
Since Saltsjöbaden and Vikingahallen dehumidification systems perform similarly to Älta, their results
are analysed by one single trend line, in order to compare the group with the results of Älta 2012 with
district heating installation.
Figure 33 shows the decrease in terms of electricity consumption when there is a district heating
system installation.
Fig 33 - Dehumidification electricity usage per hour comparison between all the ice rinks without district heating connected to the dehumidifier and Älta 2012.
It is possible to observe now, in Figure 33, which behaviour shall Vikingahallen and Saltsjöbaden ice
rink have if district heating would be installed resembling what happened this year in Älta ice rink,
with a high reduction in terms of electricity consumption due to district heating system. According to
both trend lines, the electricity consumption due to internal moisture is 15,2kWh/h for the ice rinks
without district heating and 8,5kWh/h for an ice rink with district heating installed.
Figure 34 compares the electricity consumption of the four ice rinks in the month of November 2012.
Fig.34 – Total electricity consumption in November 2012 of the studied ice rinks.
Figure 38 shows the dehumidifier system in Nacka ice rink (box number one). Besides this
construction, Nacka has another structure with another ice rink outside, only suitable for practising or
not so important games – a secondary ice rink tent. The large door (box number two) makes possible
the ice resurfacing machine to go and return between the two ice rinks, so that the outside air enters
and disturbs the normal indoor climate. Since the outside ground is usually covered with snow or dirt,
it is necessary to wash and clean the wheels of the ice resurfacing machine. This additional water
influences the indoor climate close to the washing place (box number 3). The sensor that controls the
dehumidifier is installed in the local shown in the figure by the box number 4, which is close to the
door and to the place where the ice resurfacing machine is washed. That sensor is connected to the
dehumidifier and automatically controls the temperature and the relative humidity of the air. The
difference between Nacka and other ice rinks is that the others have a separate garage to wash the ice
resurfacing mobile machine, so the dehumidifier will not be forced to work because of that water used
to clean the wheels from the machine. These two reasons explain why the dehumidifier in Nacka ice
rink uses so much energy, working much more than the dehumidification systems in others ice rinks.
2 4
1
3
Evaluation of dehumidification system energy usage in ice rinks
Diogo Bermejo Pereira Rodrigues da Silva
41
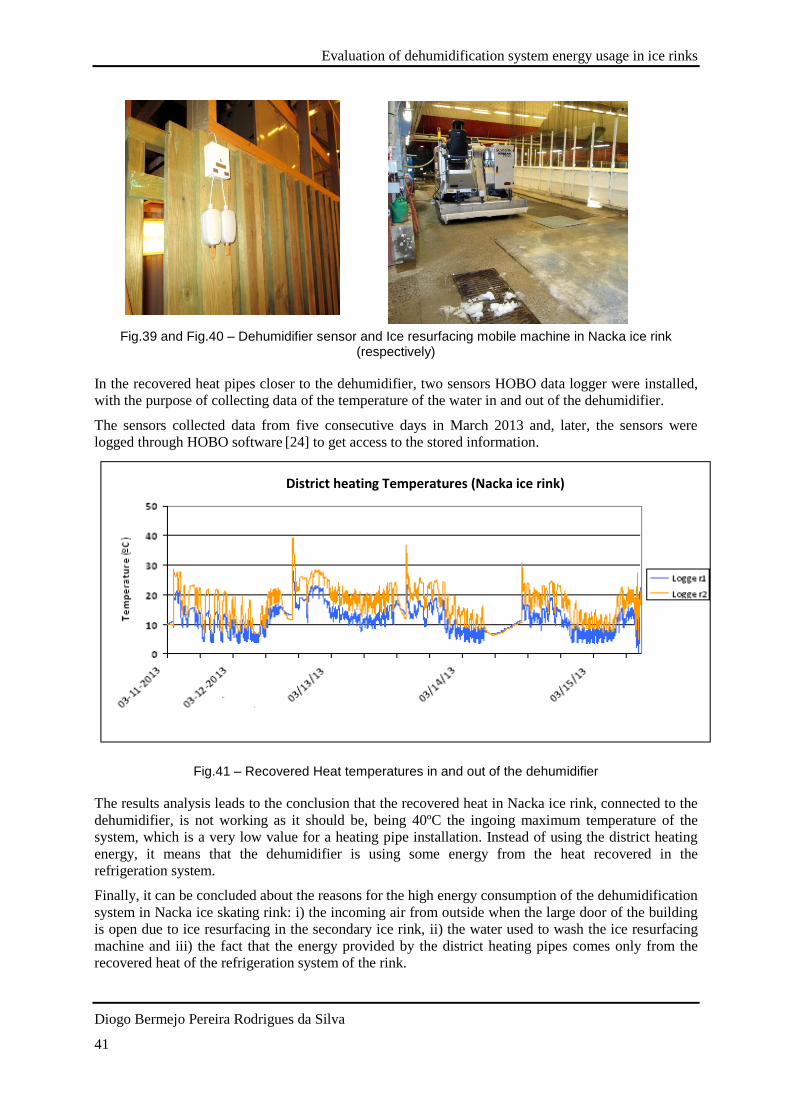
Fig.39 and Fig.40 – Dehumidifier sensor and Ice resurfacing mobile machine in Nacka ice rink (respectively)
In the recovered heat pipes closer to the dehumidifier, two sensors HOBO data logger were installed,
with the purpose of collecting data of the temperature of the water in and out of the dehumidifier.
The sensors collected data from five consecutive days in March 2013 and, later, the sensors were
logged through HOBO software [24] to get access to the stored information.
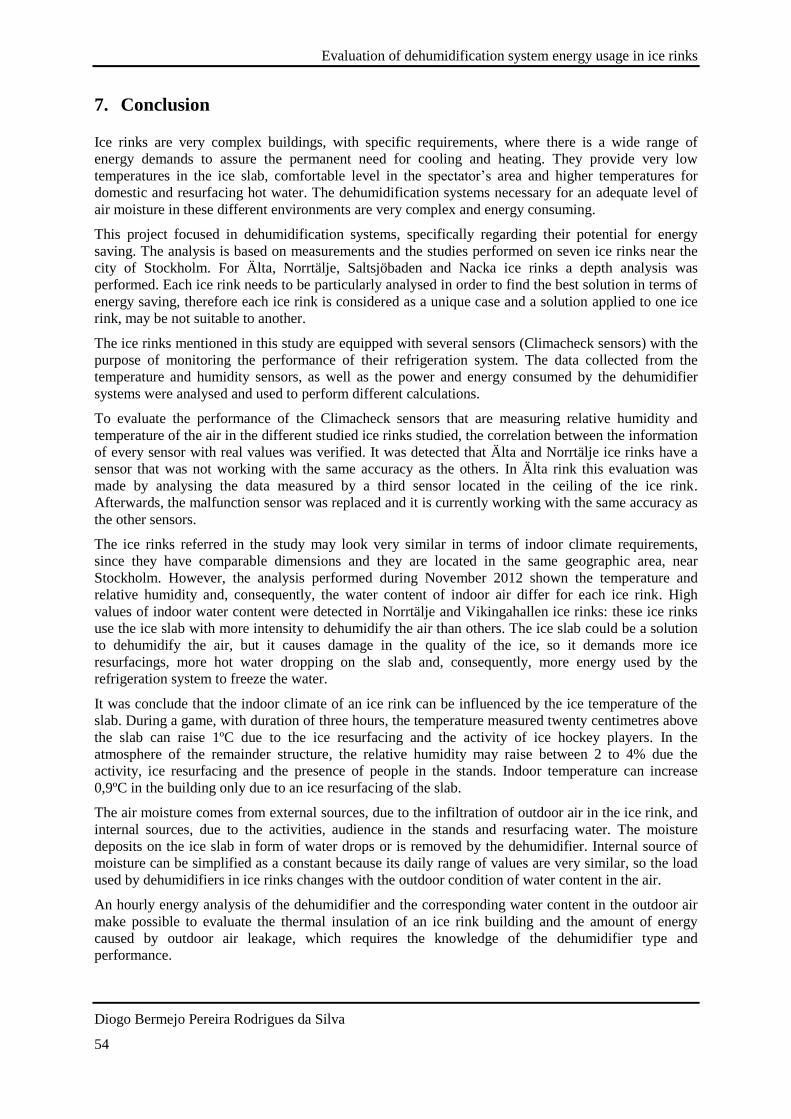
Fig.41 – Recovered Heat temperatures in and out of the dehumidifier
The results analysis leads to the conclusion that the recovered heat in Nacka ice rink, connected to the
dehumidifier, is not working as it should be, being 40ºC the ingoing maximum temperature of the
system, which is a very low value for a heating pipe installation. Instead of using the district heating
energy, it means that the dehumidifier is using some energy from the heat recovered in the
refrigeration system.
Finally, it can be concluded about the reasons for the high energy consumption of the dehumidification
system in Nacka ice skating rink: i) the incoming air from outside when the large door of the building
is open due to ice resurfacing in the secondary ice rink, ii) the water used to wash the ice resurfacing
machine and iii) the fact that the energy provided by the district heating pipes comes only from the
recovered heat of the refrigeration system of the rink.
District heating Temperatures (Nacka ice rink)
Evaluation of dehumidification system energy usage in ice rinks
Diogo Bermejo Pereira Rodrigues da Silva
42
4.5 Dehumidification indoor activity vs. no activity – Saltsjöbaden case study
Due to maintenance operations on building roof, Saltsjöbaden ice rink was off of activities since the
beginning of the year of 2013. This was very useful for this study due to the fact that the refrigeration
system was on during the period of 12th January until 12
th February. Therefore, the dehumidification
performance could be analysed, computing the same procedures for the case of no activities inside the
building.
Figure 45 shows the comparison between the dehumidifier consumption related to the presence of
water content in the air in the months of November and December 2012, with normal activity indoor,
and the same information to January and February 2013 with no any indoor activities.
The average water content indoor was calculated for both situations: 3,120 grams of water per
kilogram of indoor air in the months with activity and 2,598 grams of water per kilogram of indoor air
in the months without activity.
The dehumidifier energy consumption was correlated with the outdoor water content, as computed
before in Chapter 4.
Fig. 42 - Dehumidification energy consumption related to outdoor air water content
The slope of both trend lines is very similar and, therefore, it can be argued that the energy
consumption is well correlated with the air leakage of the building and the performance of the
dehumidifier. Indoor air climate has a minor influence on the trend line slope. The difference between
trend lines is related to indoor moisture and quantifies as 11kWh/h the energy required which is
related to activity.
Indoor activity vs. no activity
y = 3247,2x + 7,1679
y = 3327x - 3,8739
0
5
10
15
20
25
30
35
40
45
0 0,001 0,002 0,003 0,004 0,005 0,006 0,007 0,008
water content (kg water /kg outdoor air)
Ener
gy C
on
sum
pti
on
(kW
h)
Activity indoor No activity indoorLinear (No activity indoor)
E
ner
gy c
on
sum
pti
on
(kW
h/h
)
Indoor Activity vs. No activity study (Saltsjöbaden ice rink)
Evaluation of dehumidification system energy usage in ice rinks
Diogo Bermejo Pereira Rodrigues da Silva
43
4.6 Shares for dehumidification energy consumption in ice rinks
Several references point out that dehumidification in ice rinks consumes only a share of 4-6% of the
total electricity consumption [1, 2, 12].
Fig. 43 and Fig. 44 - Technical Guidelines of an Ice Rink, international ice hockey federation guide book 2011 [1] and Energihandledning ishallar, Jörgen Rogstam 2010 [2].
Climacheck sensors installed in the studied ice rinks included keep a record of the electricity used only
for dehumidification and the total electricity used by the ice rink, allowing the quantification of the
real percentage values for dehumidification share of the total energy consumption in the ice rink. A
monthly electricity consumption analysis was performed for five ice rinks (see annexe D), but there is
not a common constant percentage, since most of them use energy provided by heat from district
heating, besides electricity. Different from the others, Vikingahallen ice skating rink does not have any
district heating system, so all the energy used is from electrical source.
Table 5 – Fraction of total energy consumption related to dehumidification in Vikingahallen ice rink
Dehumidification
Energy(kWh) Total Electricity (kWh) %
2012
April 8.850,0 75.812,6 11,7
May 14.668,0 28.498,0 51,5
June 19.149,6 29.542,3 64,8
July 20.181,1 59.604,5 33,9
August 20.229,8 118.685,2 17
September 17.799,2 115.785,7 15,4
October 14.691,9 120.183,6 12,2
November 15.468,9 119.720,5 12,9
December 7.705,4 117.890,4 6,5
2013
January 10.022,8 114.853,6 8,7
February 9.312,0 102.037,3 9,1
March 4.366,1 92.422,1 4,7
Total 108.446,1 977.391,0 11,1
Evaluation of dehumidification system energy usage in ice rinks
Diogo Bermejo Pereira Rodrigues da Silva
44
During the period of May, June and July from 2012, there were no activities in Vikingahallen ice rink,
but it is verified that a great amount of energy is wasted by the dehumidifier system since its operation
is automatic and anyone had turned it off. Due to this fact, these months with extremely high
percentage values were not considered to the annual average energy associated with dehumidification.
Taking into account all these factors, the annual average of energy used by dehumidification is 11% of
the total electricity consumption by Vikingahallen ice rink.
Älta ice rink has a district heating system installed but it was possible to evaluate the data
corresponding to the energy offered by this system in the last season, to account to the total electricity
used by the ice rink provided by Climacheck and, finally, observe the total energy consumed by the
ice rink.
Table 6 – Fraction of total energy consumption related to dehumidification in Älta ice rink
Dehumidification
Energy(kWh) Total Electricity (kWh) Total District heating
(kWh) %
2011
August 25.919,7 166.776,0 178,0 15,5
September 24.567,4 129.157,6 6.230,0 18,1
October 20.384,8 87.535,1 12.818,0 20,3
November 20.114,5 84.071,4 20.650,0 19,2
December 17.325,0 77.744,3 27.415,0 16,5
2012
January 14.814,3 77.544,3 24.532,0 14,5
February 6.993,4 64.851,5 24.519,0 7,8
March 2001,0 64.699 19.960,0 2,4*
April 5.230 60.678 20.260,0 6,5
Total 135.349,1 748.358,2 136.602,0 15,3
In Älta ice rink the situation is not substantially different comparing to Vikingahallen but, since it was
possible to access the district heating energy data, for the months analysed, it is possible to confirm the
total monthly energy used by the ice rink and also the fraction of total energy used by the ice rink
related to dehumidification.
There are some months of the period that the dehumidification share is almost 20% of the total energy
consumption. In March of 2012, the dehumidifier was turned off for some reason during a great part of
the month. For the same reason as before, the value of March was excluded from the average.
Evaluation of dehumidification system energy usage in ice rinks
Diogo Bermejo Pereira Rodrigues da Silva
45
5. Dehumidifier types analysis
In this chapter, the dehumidification types are approached and an analysis of their actual consumption
in ice rinks is performed. Älta and Saltsjöbaden ice rinks work with absorption type dehumidifier
while Norrtälje ice rink has a refrigeration type dehumidifier connected to the brine from the
refrigeration system.
5.1 Dehumidifier performance in Älta and Saltsjöbaden – absorption type
In Älta ice rink, the absorption type dehumidifier used is DA 6000, manufactured by Fuktkontroll AB.
According to the technical parameters (see annexe B), the dehumidifier has 54,4kW of power capacity
and 18kg/h (4ºC/50% of relative humidity) of capacity of condensing water [23].
Fig. 45 – Profile of the dehumidifier in Alta (Fuktcontroll AB, 2012)
In Saltsjöbaden ice rink, the absorption type dehumidifier used is MCD40, manufactured by Munters.
According to the technical specifications (see annexe C), the dehumidifier has 46,8kW of power
capacity and 14kg/h (4ºC/60% of relative humidity) of capacity of condensing water [25].
Fig. 46 – Profile of the dehumidifier in Saltsjöbaden
Evaluation of dehumidification system energy usage in ice rinks
Diogo Bermejo Pereira Rodrigues da Silva
46
With Climacheck software sensors, it is possible to see the power and the energy consumption of both
dehumidifiers during a day period. The study was realized for the month of November 2011 in Älta
and November 2012 for Saltsjöbaden ice rinks. The values correspond to an average of each day of the
studied month.
Table 7 –Power and energy consumption average for the dehumidifier in Älta ice rink (November2011) and Saltsjöbaden (November 2012) ice rinks.
Ice rink
Power Average
(kW/day)
Monthly average
consumption (kWh/day)
Älta 15,148 348,735
Saltsjöbaden 18,742 406,376
Assuming that the dehumidifier works with constant capacity of removing water, it is possible to
calculate how much energy each dehumidifier consumes to remove a kilogram of water.
Table 8 – Mass of water removed by the dehumidifier and energy consumption per each kilogram of water.
Ice rink )/( hourkgm
)/( daykgm
Energy (kWh/kg water)
Älta 7,214 167,352 2,076
Saltsjöbaden 6,431 147,058 2,769
5.2 Dehumidifier performance in Norrtälje – refrigeration type
Dissimilar of Älta and Saltsjöbaden, Norrtälje ice rink uses the refrigeration type in its
dehumidification system. Since it is a different type of dehumidifier, there are no sensors available to
verify the energy consumption in the dehumidification system of this ice rink.
Norrtälje ice rink dehumidification system is refrigeration type, where the brine is connected to the
dehumidifier and its energy usage is part of the total refrigeration system of the ice rink. It is possible
to calculate its energy consumption knowing the mass flow, the type of brine used in the ice rink and
the temperatures in and out of the brine from the dehumidifier. To that end, sensors were installed in
particular locations and the results were analysed, including sensors to measure the quantity of water
condensed by the dehumidifier.
Fig.47 – Dehumidification refrigeration type in Norrtälje.
In order to calculate the cooling capacity:
Evaluation of dehumidification system energy usage in ice rinks
Diogo Bermejo Pereira Rodrigues da Silva
47
TsmQ erdehumidifi
(6)
Where,
erdehumidifiQ Cooling capacity (W)
m Brine mass flow (m³/s)
s = volumetric heat capacity
Km
J3
T = temperature difference measured between the incoming and out coming brine (K)
And,
pcs (7)
Where,
pc = specific heat capacity
Kkg
J
= density
3m
kg
The daily energy consumption is given by the following equation:
COP
hQE
erdehumidifi
erdehumidifi
24 (8)
The type of brine operating in Norrtälje is Calcium Chloride – 25% and the mass flow is constant and
about 6,3 m³/h [11]. The study was performed for the period of days between 15 and 21 of October
2012. In this period, the average COP of the refrigeration system value per day is 3,64.
Table 9 – Mass of water removed by the dehumidifier and energy consumption per each kilogram of water
Energy Consumption (kWh/day) )/( daykgm
Energy (kWh/kg water)
116,02 48,73 2,49
Comparing the obtained values of energy used to remove a kilogram of water from the moisture in the
air it is difficult to conclude about the type of dehumidifier used, since they all have a very similar
energy use. Nevertheless, these values can be used to compare with the energy used by the ice slab to
dehumidify the air, which will be analysed in the next section.
Evaluation of dehumidification system energy usage in ice rinks
Diogo Bermejo Pereira Rodrigues da Silva
48
5.3 Diffusion Load Calculation in ice rinks
Moisture condense on cold surfaces that have a lower temperature than the dew point of the air
temperature, leading to sweating, dripping and fogging and, in ice rinks, the moisture tend to deposit
in the ice slab and condense. The diffusion load required to remove the water from the moist air that
deposit on the ice slab is given by the equation [10]:
)/18)(/2852)(( molkgkgkJXXKAQ iadiffusion (9)
Where,
diffusionQ Diffusion load (W)
A Total area of the ice slab (2m )
K Mass heat transfer coefficient )/(23,0 2msg ,
aX Mole fraction of water vapour in air, (kg mol/kg mol) ,
iX Mole fraction of water in saturated ice, (kg mol/kg mol)
And,
ice
diffusion
L
Qm
(10)
Where,
m Total mass of water that deposits on the ice slab (kg)
diffusionQ Diffusion load (J)
iceL Latent heat of deposition of water into ice (J/g)
And,
gJTTTL iceiceiceice /)004,029,01,2834()(2
(11)
Evaluation of dehumidification system energy usage in ice rinks
Diogo Bermejo Pereira Rodrigues da Silva
49
Älta and Norrtälje ice rinks results for the month of November 2012 were studied. The results below
correspond to a monthly average.
Table 10 – Mass of water removed by the ice slab
Ice rink )/( daykgm
)/( hourkgm
))/(( 2mhourkgm
Älta 603,1 25,127 0,0146
Norrtälje 1.021,940 42,581 0,0247
The water content deposited in the ice slab could apparently be exceptionally high, but they
correspond only to a deposit of 15 grams per hour in a square meter, which seems reasonable.
To evaluate the energy required by the refrigeration system for each kilogram of water it was
necessary to use information from another Climacheck sensor: the COP information of the
refrigeration system.
COP
hQE
diffusion
diffusion
24 (12)
The COP of each ice rink was analysed and the average values for November 2012 are shown in the
Table 11.
Table 11 – Average of COP values for each ice rink in November 2012
Ice rink COP (November 2012)
Älta 2,41
Norrtälje 3,64
The values in Table 12 correspond to a monthly average for November 2012.
Table 12 – Energy to dehumidify the air with the ice slab
Ice rink Ediff (kWh/day) kWh/kg water
Älta 199,043 0,335
Norrtälje 221,103 0,216
The values of energy used by the refrigeration system of the ice rinks to dehumidify the air are very
low, when compared with the values of energy used to remove a kilogram of water of the
dehumidifier.
Nevertheless, the action of dehumidify the air with the ice slab requires more ice resurfacings and,
consequently, more energy used by the refrigeration system to freeze the hot water discharged in the
slab. In terms of the analysis accomplished in this chapter, the most important factor is the COP of the
refrigeration system of the ice rink: the higher the values of COP, the lower the energy used to remove
a kilogram of water.
Evaluation of dehumidification system energy usage in ice rinks
Diogo Bermejo Pereira Rodrigues da Silva
50
6. Radiation Model analysis
A specific task of this project was the measurement and evaluation of the radiation heat load, in order
to verify the model proposed in a previous work, Evaluation of Energy Saving Measures in Ice Rinks
by Zhang Z., master thesis at KTH School of Industrial Engineering and Management of Stockholm,
in 2010 [11], specifically what concerns the performance of the low emissivity ceiling installed in Älta
ice rink.
In the calculation model already developed aiming at calculating the radiation load of the low
emissivity ceiling, the assumption that the temperature of the ice rinks walls takes the measured value
by the Climacheck sensors installed indoor. Therefore, this assumption should be checked and, to that
purpose, two sensors HOBO data logger were installed in Älta ice rink in two different walls, with a
height of approximately three meters of distance from the floor, in order to collect data from the
surface temperature.
Fig. 48 –Sensors installed in Älta ice rink, nominated north wall and west wall, respectively.
Evaluation of dehumidification system energy usage in ice rinks
Diogo Bermejo Pereira Rodrigues da Silva
51
The sensors collected data from four consecutive days during February 2013 and, later, the sensors
were logged through the HOBO software to get access to the stored information and compare with the
indoor temperature using the Climacheck software, for a synchronized period of time.
Fig. 49 – Comparison between indoor temperature and walls temperature
Figure 49 shows that the assumption made in the previous work is overestimating the wall
temperature, since it is possible to observe a clear deviation between the temperature values. The
temperature inside the building is always higher than the walls temperature, due to the outside climate
influence. The difference between the indoor temperature and surface temperature is approximately
1,5ºC.
Fig. 50 – Temperature measured in the wall values compared with indoor temperature measured for the same time
Indoor Temperature and Wall Temperature
0
1
2
3
4
5
6
7
8
02
-11
-13
02
-11
-13
02
-11
-13
02
-12
-13
02
-12
-13
02
-12
-13
02
-12
-13
02
-12
-13
02
-12
-13
02
-12
-13
02
/13
/13
02
/13
/13
02
/13
/13
02
/13
/13
02
/13
/13
02
/13
/13
02
/14
/13
02
/14
/13
02
/14
/13
02
/14
/13
02
/14
/13
time (days)
Tem
per
atu
re (
ºC)
Indoor Temperature North Wall West Wall
Indoor temperature Vs. Wall Temperature
3
3,5
4
4,5
5
5,5
3 3,5 4 4,5 5 5,5 6 6,5 7 7,5
Indoor Temperature (ºC)
No
rth
wal
l tem
per
atu
re (
ºC)
Evaluation of dehumidification system energy usage in ice rinks
Diogo Bermejo Pereira Rodrigues da Silva
52
This analysis was performed for a cold period, during four days of February 2013, where the outside
temperature is, most of the time, lower than indoor temperature. For a warm period, in the summer for
example, the situation will probably not be the same, since the temperature measured outside will be
higher than the measured for indoor temperature, which is approximately constant all over the activity
year.
To study the wall temperature in the warm period, an outside temperature of 17ºC is assumed, keeping
the same values previously considered for the indoor temperature. Due to the fact that both measured
wall temperatures are quite similar, it is assumed that they are composed of the same materials.
Therefore, the following analysis focuses on a single wall.
The wall assumed for Älta case, based on typical ice rinks walls envelope [2], is composed of the
following layers: medium concrete (l=0,1m; λ=0,51W/m.K), wood (fibreboard) (l=0,05m;
λ=0,06W/m.K), light concrete (l=0,05m; λ=0,19W/m.K), mineral wool (l=0,1m; λ=0,035W/m.K) and
light concrete again with the same properties as before. The convective properties of the wall were
assumed as αindoor = 5 W/K.m2 and αoutdoor = 10 W/K.m
2.
Fig.51 – Wall temperature profile from side to side.
To calculate the temperature of the wall in a warm period the following equations were used:
outin TTAUQ
(13)
Where,
Q heat flow transferred through the wall (W)
U heat transfer coefficient
Km
W2
indoorT wallT
outdoorT
Evaluation of dehumidification system energy usage in ice rinks
Diogo Bermejo Pereira Rodrigues da Silva
53
A total area of the wall (2m )
and,
A
QRTT si
inwall
(14)
Where,
siR =resistance from internal surface of the wall
W
Km2
The results for a warm period, with an outside temperature of 17ºC and the same indoor temperature
are shown in the figure below:
Fig. 52 – Indoor Temperature and Wall Temperature calculated for a warm period.
The wall temperature is now closer to the values of indoor temperature comparing with the results
from the cold period. The difference between them is now approximately 0,5ºC.
In a cold period, where the temperatures outside have lower values than the temperatures indoor, the
radiation model performed in Evaluation of Energy Saving Measures in Ice Rinks by Zhang Z. 2010,
overestimates the wall temperature by considering them the same as the temperature measured inside.
Nevertheless, in a warm period, where the temperature outside is higher than inside, the wall
temperature approaches the indoor measured temperature.
Indoor Temperature and Wall Temperature (Warm period)
0
1
2
3
4
5
6
7
8
day
1
day
1
day
1
day
1
day
2
day
2
day
2
day
2
day
2
day
2
day
2
day
3
day
3
day
3
day
3
day
3
day
3
day
3
day
4
day
4
day
4
day
4
day
4
day
4
time (days)
Tem
per
atu
re (
ºC)
Indoor Temperature Wall temperature (calculated)
Evaluation of dehumidification system energy usage in ice rinks
Diogo Bermejo Pereira Rodrigues da Silva
54
7. Conclusion
Ice rinks are very complex buildings, with specific requirements, where there is a wide range of
energy demands to assure the permanent need for cooling and heating. They provide very low
temperatures in the ice slab, comfortable level in the spectator’s area and higher temperatures for
domestic and resurfacing hot water. The dehumidification systems necessary for an adequate level of
air moisture in these different environments are very complex and energy consuming.
This project focused in dehumidification systems, specifically regarding their potential for energy
saving. The analysis is based on measurements and the studies performed on seven ice rinks near the
city of Stockholm. For Älta, Norrtälje, Saltsjöbaden and Nacka ice rinks a depth analysis was
performed. Each ice rink needs to be particularly analysed in order to find the best solution in terms of
energy saving, therefore each ice rink is considered as a unique case and a solution applied to one ice
rink, may be not suitable to another.
The ice rinks mentioned in this study are equipped with several sensors (Climacheck sensors) with the
purpose of monitoring the performance of their refrigeration system. The data collected from the
temperature and humidity sensors, as well as the power and energy consumed by the dehumidifier
systems were analysed and used to perform different calculations.
To evaluate the performance of the Climacheck sensors that are measuring relative humidity and
temperature of the air in the different studied ice rinks studied, the correlation between the information
of every sensor with real values was verified. It was detected that Älta and Norrtälje ice rinks have a
sensor that was not working with the same accuracy as the others. In Älta rink this evaluation was
made by analysing the data measured by a third sensor located in the ceiling of the ice rink.
Afterwards, the malfunction sensor was replaced and it is currently working with the same accuracy as
the other sensors.
The ice rinks referred in the study may look very similar in terms of indoor climate requirements,
since they have comparable dimensions and they are located in the same geographic area, near
Stockholm. However, the analysis performed during November 2012 shown the temperature and
relative humidity and, consequently, the water content of indoor air differ for each ice rink. High
values of indoor water content were detected in Norrtälje and Vikingahallen ice rinks: these ice rinks
use the ice slab with more intensity to dehumidify the air than others. The ice slab could be a solution
to dehumidify the air, but it causes damage in the quality of the ice, so it demands more ice
resurfacings, more hot water dropping on the slab and, consequently, more energy used by the
refrigeration system to freeze the water.
It was conclude that the indoor climate of an ice rink can be influenced by the ice temperature of the
slab. During a game, with duration of three hours, the temperature measured twenty centimetres above
the slab can raise 1ºC due to the ice resurfacing and the activity of ice hockey players. In the
atmosphere of the remainder structure, the relative humidity may raise between 2 to 4% due the
activity, ice resurfacing and the presence of people in the stands. Indoor temperature can increase
0,9ºC in the building only due to an ice resurfacing of the slab.
The air moisture comes from external sources, due to the infiltration of outdoor air in the ice rink, and
internal sources, due to the activities, audience in the stands and resurfacing water. The moisture
deposits on the ice slab in form of water drops or is removed by the dehumidifier. Internal source of
moisture can be simplified as a constant because its daily range of values are very similar, so the load
used by dehumidifiers in ice rinks changes with the outdoor condition of water content in the air.
An hourly energy analysis of the dehumidifier and the corresponding water content in the outdoor air
make possible to evaluate the thermal insulation of an ice rink building and the amount of energy
caused by outdoor air leakage, which requires the knowledge of the dehumidifier type and
performance.
Evaluation of dehumidification system energy usage in ice rinks
Diogo Bermejo Pereira Rodrigues da Silva
55
Nacka ice rink is spending much more energy due to dehumidification comparing with others ice
rinks. This fact is not caused by its bigger structure, but by the fact that it does not have a separate
garage to wash the ice resurfacing mobile machine, which happens in the other ice rinks, forcing the
dehumidifier to work more time than it should and spend more energy than it needs to.
Since the beginning of summer 2012, Älta ice rink has a district heating installation connected to its
dehumidification system. Comparing data after this installation with those from the year before, it was
verified that the indoor water content is very similar and the district heating is able to save nearly 50%
of the total electricity consumption.
The collected data by two sensors measuring the water temperature in the ingoing and outgoing pipes
of the dehumidifier in Nacka ice rink show that the dehumidifier only uses recovered heat from the
refrigeration system, so it is not able to take so much energy from the heat of the water, dissimilar
what happens in Älta district heating system.
The obtained values for the energy used to remove one kilogram of water from the humid air by an
absorption type dehumidification system are 2,1kWh for Älta ice rink and 2,8kWh for Saltsjöbaden ice
rink. On the other hand, dehumidification refrigeration type uses 2,5kWh (Norrtälje ice rink) to
dehumidify the air. It is difficult to conclude which type of dehumidification system is the most
efficient, because the energy is for all systems of the same order of magnitude. Nevertheless, it is
possible to conclude that both types of dehumidifiers have very similar values of energy consumption.
It is possible to determine the energy used by the refrigeration system to remove a kilogram of water
on the ice slab and compare those values with the energy use for the same purpose by the
dehumidifier. In fact, dehumidifying the air with the ice slab use significantly less energy than a
dehumidifier does, but the act of dehumidifying the air with the slab damage and indirectly uses more
energy for the hot water to resurface the ice and the refrigeration system to freeze the hot water. The
main factors related to the quantification of water placed on the ice slab are: i) the higher presence of
water content in the air indoor and ii) the efficiency of removing that water from the slab, which is
determined by the coefficient of performance of the refrigeration system of the ice rink.
Saltsjöbaden ice rink was closed for activities for one month, but its refrigeration system was still
working during that period. Thereby, it was possible to analyse its dehumidifier performance for a
month and compare it with a regular month of activity, with similar climate conditions, and conclude
that the dehumidifier consumes approximately 11kWh/h related to activity inside the ice rink.
Since there were no activities in the ice rink during that month, the dehumidifier only worked and used
energy to remove moisture of the indoor air, which was not subject to evaporated water from activities
or ice resurfacings but only from other internal sources and infiltrations of outside air inside the
structure.
The current “state of art” about energy consumption in ice rinks indicates a share of 4 to 6% as regards
to dehumidification: in this project it is possible to conclude that this percentage is underestimated and
the value also depends on the season of the year, being outdoor climate the most influencing factor.
Knowing that Vikingahallen ice rink does not have any district heating connection and quantifying the
total electricity consumption and the consumption related to the dehumidification system, an yearly
average of 11% is obtained.
On the other hand, Älta ice rink has a district heating installation but it was possible to observe data
related to its energy provided in the year of 2011. Quantifying electricity use provided by Climacheck
sensors, the percentage value of 15% related to dehumidification system consumption was obtained.
Regarding the radiation model proposed in the previous work Evaluation of Energy Saving Measures
in Ice Rinks by Zhang Z., master thesis at KTH School of Industrial Engineering and Management of
Stockholm, in 2010 [11], which studies the performance of the low emissivity ceiling installed in Älta
ice rink with the assumption for the walls temperature of the ice rink as the temperature measured by
the Climacheck sensors installed indoor, it was verified that the radiation model is overestimating the
walls temperature. This occurs for a cold period, where the outside temperatures are lower than inside.
Evaluation of dehumidification system energy usage in ice rinks
Diogo Bermejo Pereira Rodrigues da Silva
56
Nevertheless, in a warm period, where the temperature outside are higher than inside, the walls
temperature are similar to indoor temperature.
Suggestions for future work
Complementary to this conclusion, I suggest some possible future work:
Considering the results of this study, where it is shown that dehumidification system has more
impact than what it was expected in the percentage of the total energy consumption in ice
rinks, it is important to improve the studies concerning energy efficiency of dehumidification
systems of ice rinks. For example, studies focusing on the performance of dehumidifiers, the
contribution of district heating for the dehumidification system and other solutions for the
improvement of the performance of dehumidification system process.
Detailed analysis of the impact of the spectators in the stands of the ice rink: Compare
temperature and relative humidity in similar game days, choosing a day with a lot of audience
and a day without spectators, with the aim of studying the impact of people presence in the
stands to the dehumidification system;
Calculate the amount of energy required by the refrigeration system in every ice resurfacing
and analyse the total energy used to dehumidify the air with the ice slab;
Suggestions of alternative places to wash the ice resurfacing machine in Nacka ice rink in
order to save energy from its dehumidifier.
Evaluation of dehumidification system energy usage in ice rinks
Diogo Bermejo Pereira Rodrigues da Silva
57
8. References
[1] IIHF, 2010. Technical Guidelines of an Ice Rink, international ice hockey federation guide book
[2] Rogstam, Jörgen. 2010, Energihandledning ishallar. En guide till effektivare energianvändning i svenska
ishallar. Sveriges Energi & Kylcentrum. Katrineholm
[3] Karampour M. 2011, Measurement and Modelling of Ice Rinks Heat Loads, Master Thesis, KTH School of