Page 1
Evaluation of High Efficiency
Oil Filters in the State Fleet
(Amended 2013)
California Department of Resources Recycling and Recovery September 10, 2013
Contractor's Report Produced Under Contract By:
California Department of Toxic Substances Control
Page 2
S T A T E O F C A L I F O R N I A
Edmund G. Brown Jr.
Governor
Matt Rodriquez
Secretary, California Environmental Protection Agency
DEPARTMENT OF RESOURCES RECYCLING AND RECOVERY
Caroll Mortensen
Director
Department of Resources Recycling and Recovery Public Affairs Office
1001 I Street (MS 22-B) P.O. Box 4025
Sacramento, CA 95812-4025 www.calrecycle.ca.gov/Publications/
1-800-RECYCLE (California only) or (916) 341-6300
Publication # DRRR-2014-1493
To conserve resources and reduce waste, CalRecycle reports are produced in electronic format only. If printing copies of this document, please consider use of recycled paper containing 100 percent postconsumer
fiber and, where possible, please print images on both sides of the paper.
Copyright © 2013 by the California Department of Resources Recycling and Recovery (CalRecycle). All rights reserved. This publication, or parts thereof, may not be reproduced in any form without permission.
Prepared as part of contract number DRR 12087 for $85,000.
The California Department of Resources Recycling and Recovery (CalRecycle) does not discriminate on the basis of disability in access to its programs. CalRecycle publications are available in accessible formats upon request by calling the Public Affairs Office at (916) 341-6300. Persons with hearing
impairments can reach CalRecycle through the California Relay Service, 1-800-735-2929.
Disclaimer: This report was produced under contract by the California Department of Toxic
Substances Control. The statements and conclusions contained in this report are those of the
contractor and not necessarily those of the Department of Resources Recycling and Recovery
(CalRecycle), its employees, or the State of California and should not be cited or quoted as official
Department policy or direction.
The state makes no warranty, expressed or implied, and assumes no liability for the information
contained in the succeeding text. Any mention of commercial products or processes shall not be
construed as an endorsement of such products or processes.
Page 3
Contractor’s Report to CalRecycle i
Table of Contents Acknowledgments ......................................................................................................................................... 3
Executive Summary ...................................................................................................................................... 4
Introduction ................................................................................................................................................... 9
Background ................................................................................................................................................. 10
Literature Review ........................................................................................................................................ 13
Fleet Managers’ Survey .............................................................................................................................. 17
Barrier Survey Results ........................................................................................................................... 18
Lab Selection ......................................................................................................................................... 27
Search for HE Oil Filters ....................................................................................................................... 27
Passenger Car Filters ............................................................................................................................. 28
Matching Filters to Fleets ...................................................................................................................... 29
Filter Testing ............................................................................................................................................... 31
Sample Quality Assurance and Quality Control .................................................................................... 33
Southwest Research Institute Filter Testing .......................................................................................... 35
Fleet Demonstrations .................................................................................................................................. 37
State and Local Fleets ............................................................................................................................ 37
Fleet Manager’s Post-Demonstration Survey ........................................................................................ 45
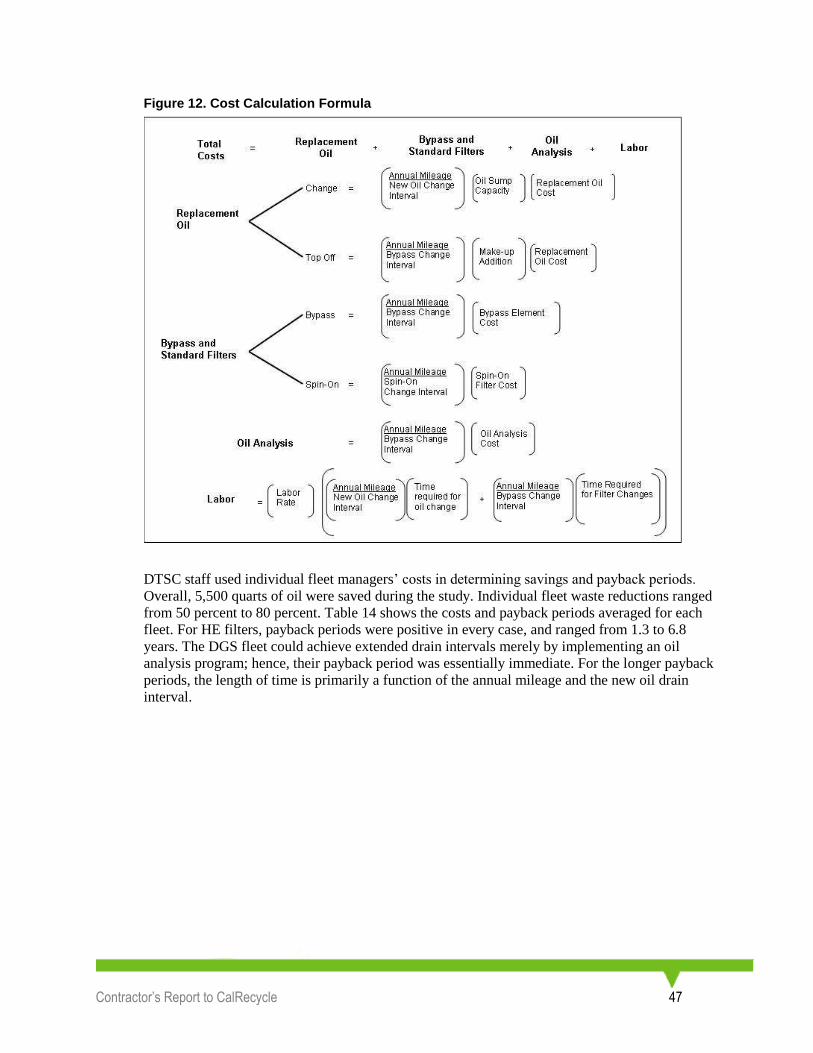
Cost/Benefit Analysis of HE Oil Filters ................................................................................................ 46
HE Oil Filter Project Conclusions .............................................................................................................. 49
Abbreviations and Acronyms ..................................................................................................................... 52
Appendices List .......................................................................................................................................... 53
Bibliography ............................................................................................................................................... 54
Endnotes ...................................................................................................................................................... 58
Page 4
Contractor’s Report to CalRecycle ii
List of Figures Figure 1. Typical Bypass Filter Installation ................................................................................................ 12
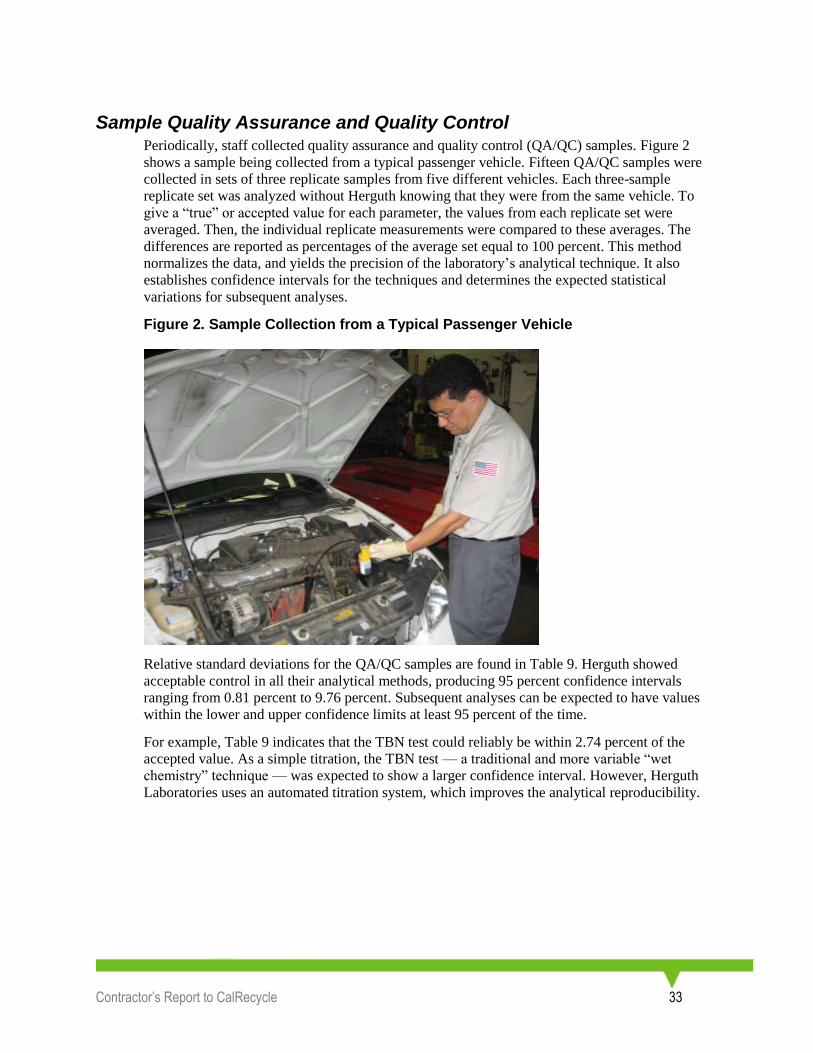
Figure 2. Sample Collection from a Typical Passenger Vehicle ................................................................ 33
Figure 3. Results for the Oil Additive Package Depletion Evaluations ...................................................... 37
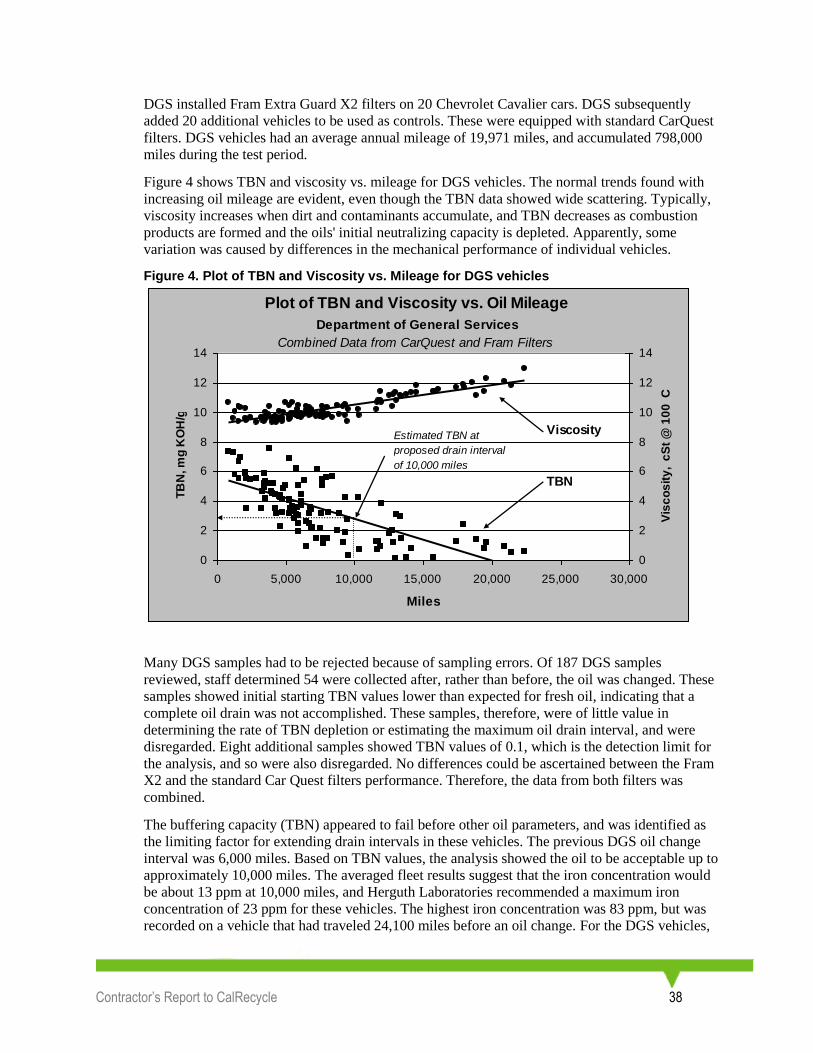
Figure 4. Plot of TBN and Viscosity vs. Mileage for DGS vehicles .......................................................... 38
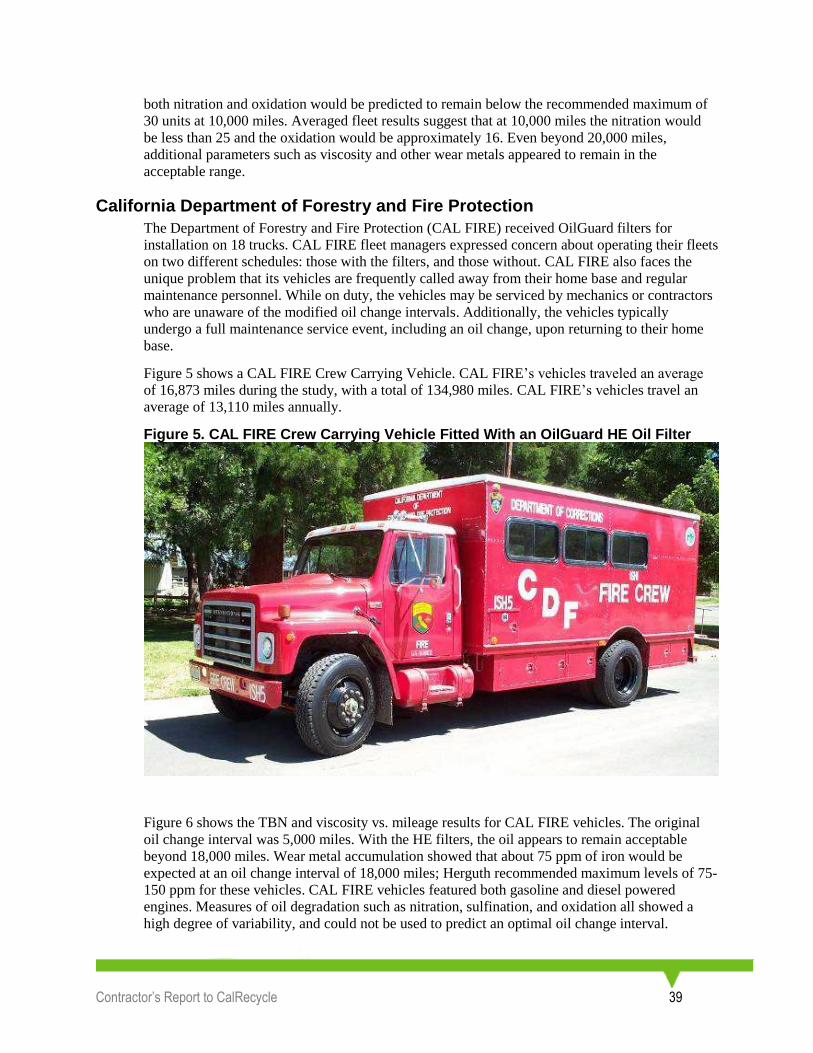
Figure 5. CAL FIRE Crew Carrying Vehicle Fitted With an OilGuard HE Oil Filter ............................... 39
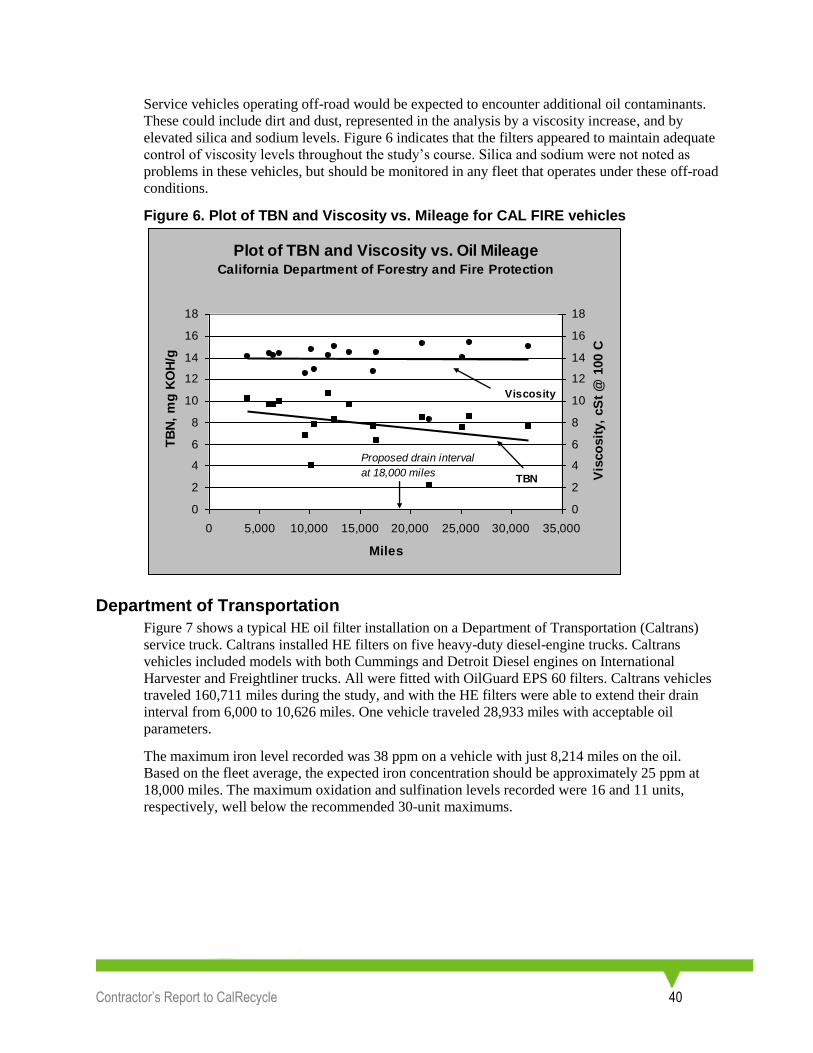
Figure 6. Plot of TBN and Viscosity vs. Mileage for CAL FIRE vehicles ................................................. 40
Figure 7. Caltrans Truck with HE Oil Filter ............................................................................................... 41
Figure 8. Plot of TBN and Viscosity vs. Mileage for FAX vehicles .......................................................... 42
Figure 9. Plot of TBN and Viscosity vs. Mileage for FUSD vehicles ........................................................ 43
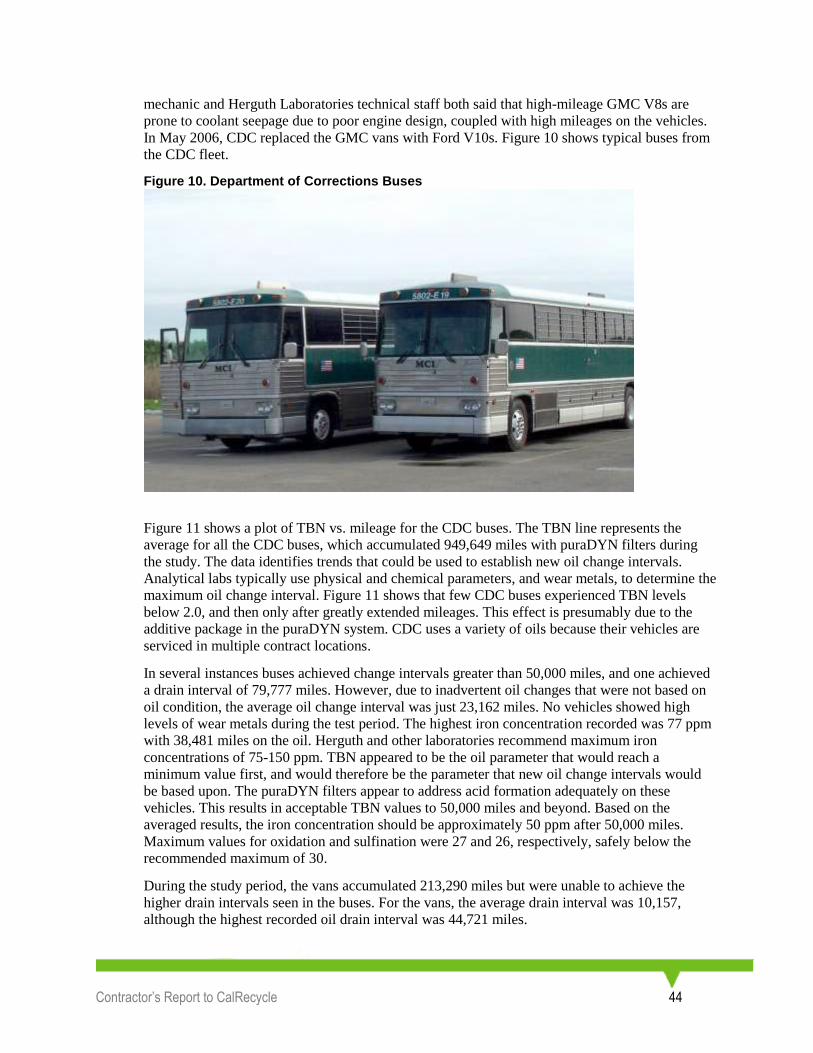
Figure 10. Department of Corrections Buses .............................................................................................. 44
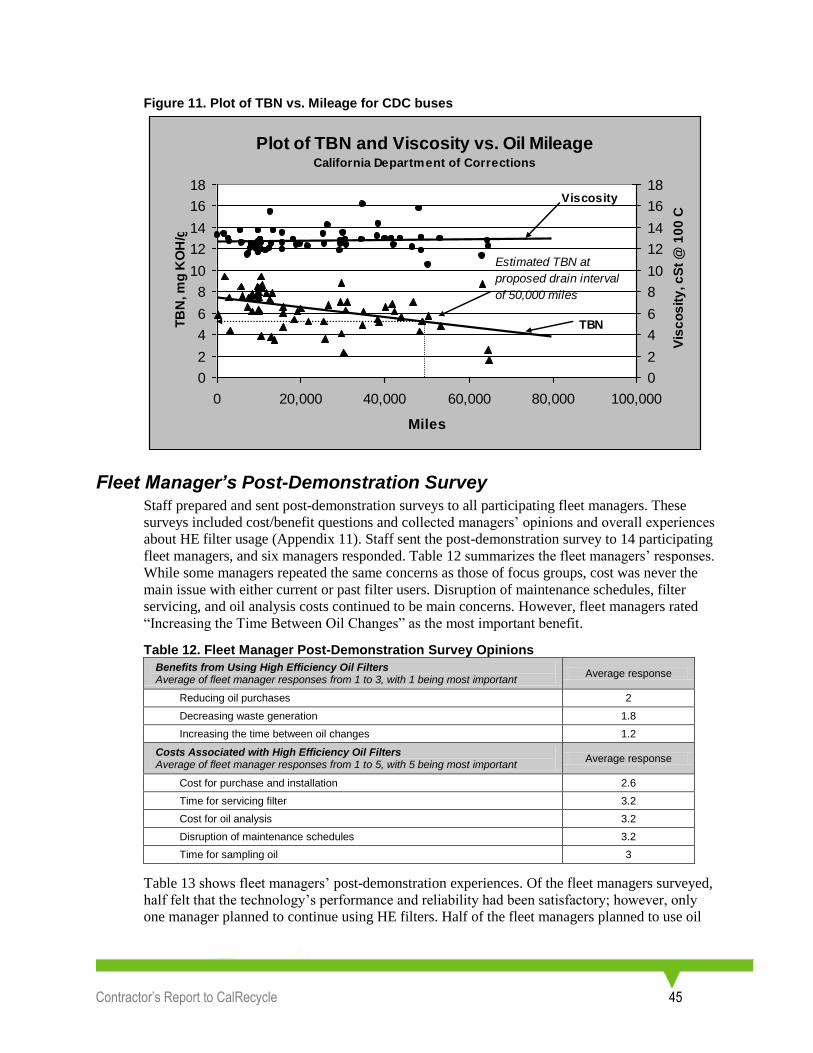
Figure 11. Plot of TBN vs. Mileage for CDC buses ................................................................................... 45
Figure 12. Cost Calculation Formula .......................................................................................................... 47
List of Tables Table 1. Fleet Vehicle Results Summary ...................................................................................................... 6
Table 2. Typical Metals Found in Engine Oil and Their Sources ............................................................... 14
Table 3. Comparison of Oil Condition Limits from Various Sources ........................................................ 15
Table 4. Fleet Manager Survey Questions and Responses ......................................................................... 19
Table 5. Descriptive Statistics of Fleet Manager Survey Responses .......................................................... 20
Table 6. Statistical Comparison of Fleet Responses ................................................................................... 23
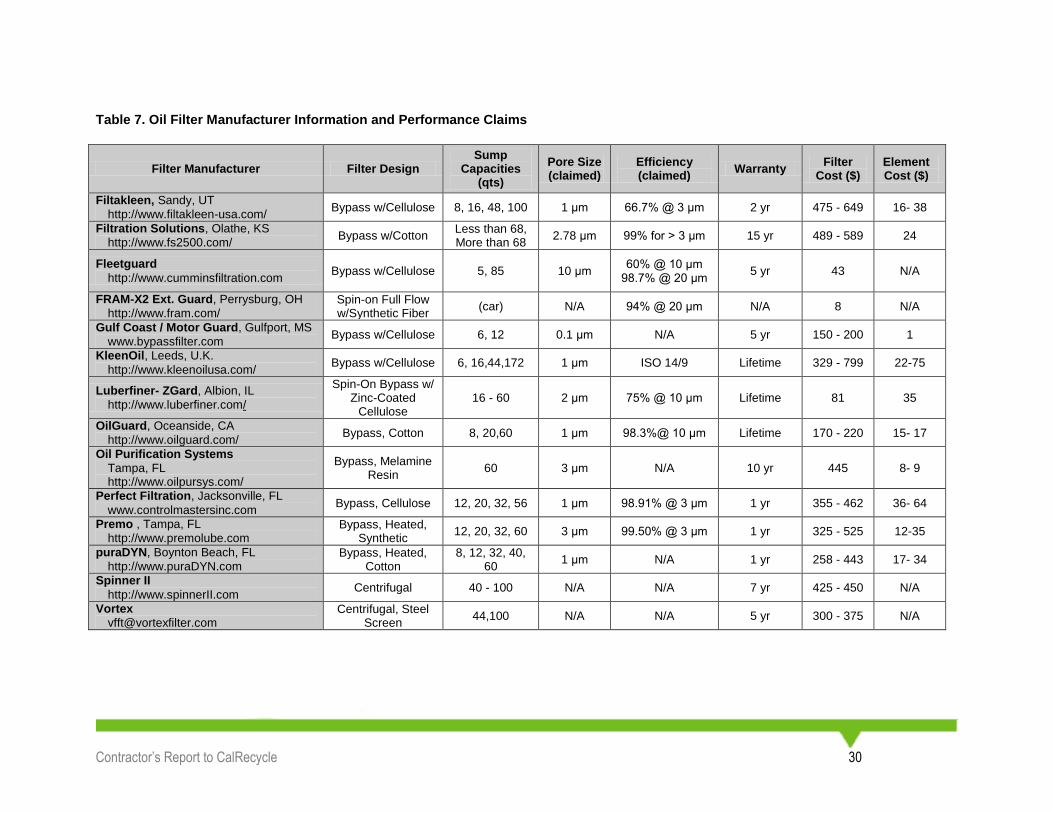
Table 7. Oil Filter Manufacturer Information and Performance Claims..................................................... 30
Table 8. Oil Filter Installations ................................................................................................................... 32
Table 9. Relative Standard Deviation for QA/QC Samples ........................................................................ 34
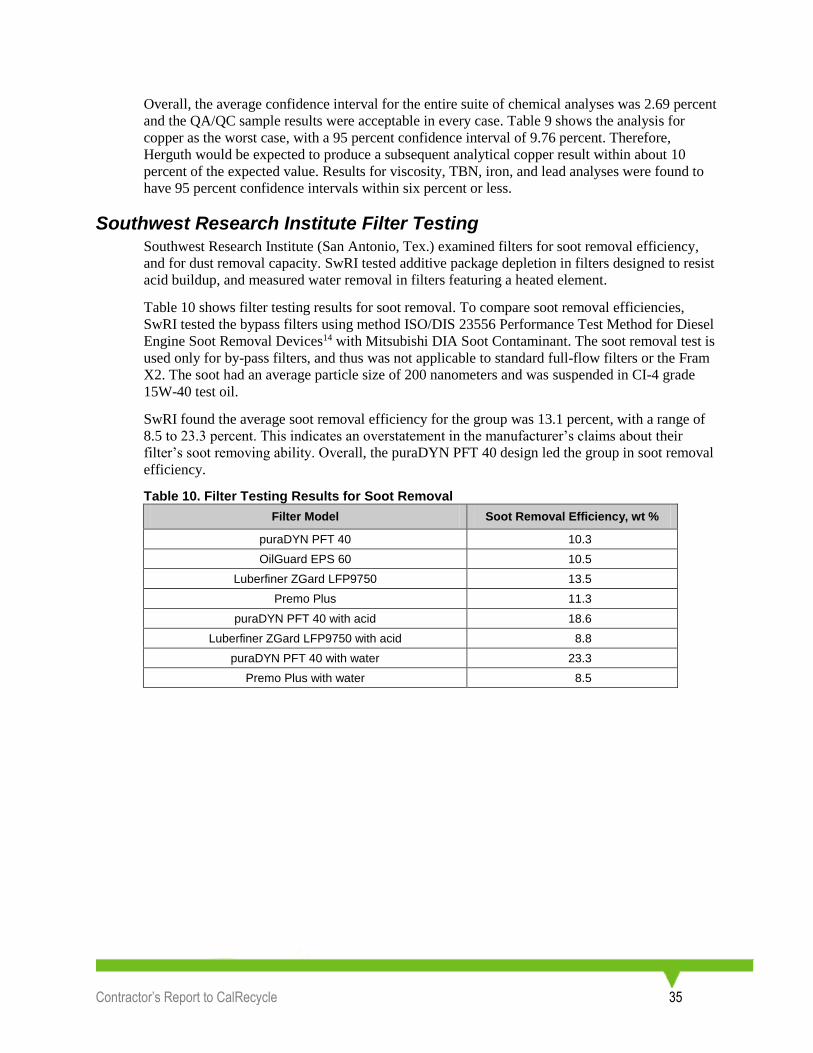
Table 10. Filter Testing Results for Soot Removal ..................................................................................... 35
Table 11. Filter Testing Results for Dust Removal Capacity ..................................................................... 36
Table 12. Fleet Manager Post-Demonstration Survey Opinions ................................................................ 45
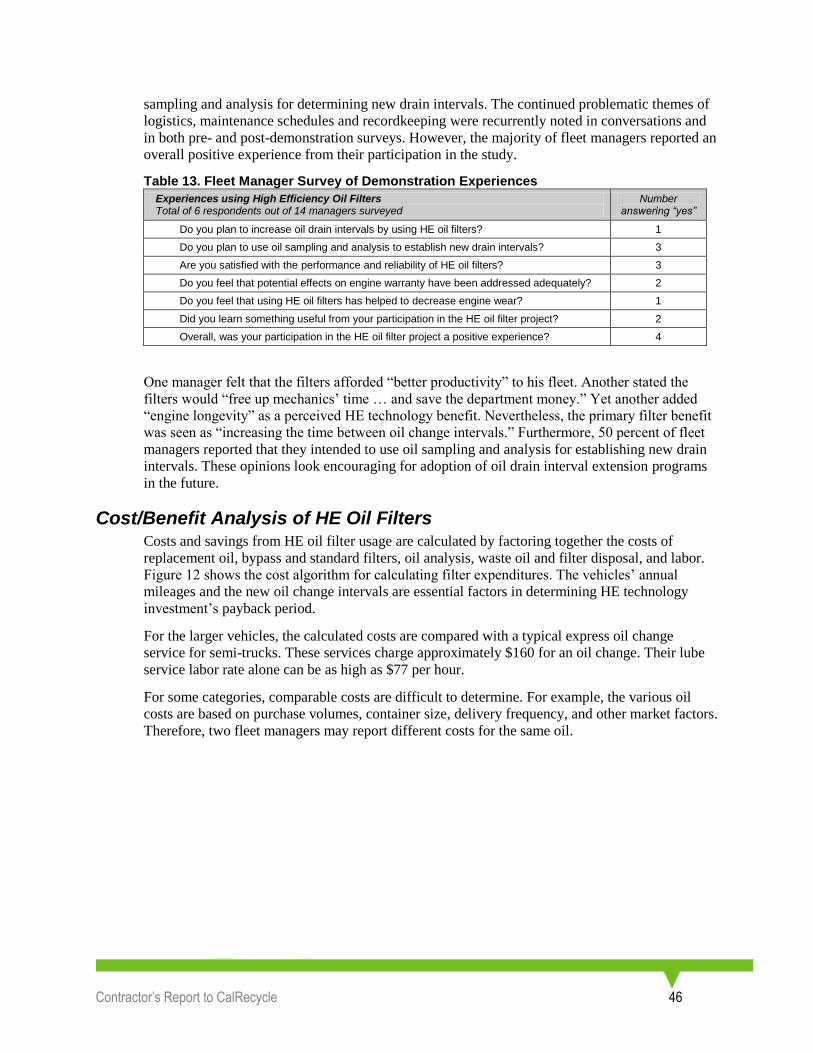
Table 13. Fleet Manager Survey of Demonstration Experiences ............................................................... 46
Table 14. Averaged Fleet Costs and Payback Periods ................................................................................ 48
Page 5
Contractor’s Report to CalRecycle 3
Acknowledgments
The California Department of Resources Recycling and Recovery (CalRecycle) provided funding
for this Amended (2013) Evaluation of High Efficiency Oil Filters (HEOF) Final Report. The
CalRecycle Project Manager was:
Robert Carlson
The California Integrated Waste Management Board (CIWMB) provided funding to conduct this
project. Staff included:
CIWMB Acting Branch Manager Kristin Yee
CIWMB Staff Project Managers Emily Wang, Bert Wenzel, Glenn Gallagher, and James
Herota
The Department of Toxic Substances Control (DTSC) staff included:
Supervising Engineer Tony Luan
Contract Manager Bob Boughton
Project Managers Edward Benelli and Dick Jones
Staff Services Analyst Judy Kong
Agency fleet and garage managers provided vehicles, installed filters, took samples, and
answered project staff questions. By agency, they included:
California Departments of Corrections (CDC): Tim Frye, Officers Andy Maloney, Donna
Sanchez, and Ed Snowden
Forestry and Fire Protection (CAL FIRE): Doug Brown, Larry Hilgreth, and Richard
Armstrong
General Services (DGS): Kelly Klemp, Sheila Furr, and Richard Battersby
Transportation (Caltrans): Dave Barnes
Fresno Area Express (FAX): James Samuel
Fresno Unified School District (FUSD): Ron Phillips
Long Beach Unified School District (LBUSD): David G. Lawson and Dale L. Grey
David F. Frycki of Herguth Laboratories, Inc. provided the oil analysis and consulted with project
staff to help interpret the analytical results.
Contacts:
DTSC: Edward Benelli (916) 445-2959 or Dick Jones (916) 322-3292
CalRecycle Contract # DRR12087
CIWMB Contract # IWM-C2076X
Page 6
Contractor’s Report to CalRecycle 4
Executive Summary
This is the Amended (2013) Evaluation of High Efficiency Oil Filters Final Report. It was
prepared for the California Department of Resources Recycling and Recovery (CalRecycle) by
the California Department of Toxic Substances Control (DTSC). The text from the original 2008
report has been supplemented by the 2013 work on oil condition sensors and additional filtration
technologies.
The mission of the DTSC Office of Pollution Prevention is to reduce hazardous waste generation.
Many state agencies, including the Department of General Services (DGS), operate vehicle fleets
and are focused on reducing operating costs as well as protecting the environment.
In the transportation sector, extending oil drain intervals is one way to save money and reduce the
generation of used oil, a hazardous waste in California. High efficiency (HE) oil filters, which
clean motor oil better than standard filters, extend the useful life of engine oil. However, despite
demonstrable savings from reduced motor oil purchases and waste oil generation, HE filter
technology has not been widely adopted.
California state agencies operate a combined fleet of more than 70,000 vehicles which provided
an excellent opportunity for demonstrating the cost savings and environmental benefits of this
technology. With the goal of source reduction in mind, the California Integrated Waste
Management Board (CIWMB) contracted with DTSC to study the benefits and barriers to using
HE oil filters.
Study Approach
The original 2008 project had four goals: (1) discover why state agencies have not yet adopted
this technology, (2) identify barriers to its adoption, (3) determine how the barriers could be
overcome, and (4) demonstrate the technology’s performance in actual fleet operations.
To accomplish these goals, DTSC employed a six-step methodology:
1. DTSC conducted a literature search on HE filters and extended oil drain intervals.
2. Staff then prepared and administered a fleet managers’ survey to learn why state agencies
have not adopted this technology and what adoption barriers existed.
3. DTSC then held focus group meetings with fleet managers to identify ways to overcome
the barriers.
4. Fleets representing a variety of engine types and sizes were then recruited for the
demonstration phase. Operators recorded mileages and oil change events for each
vehicle. They also collected oil samples and sent them to a private laboratory for analysis
of the oil’s physical and chemical parameters. This included viscosity, total base number
(TBN), oxidation, and nitration along with oil contaminants such as water, soot, and wear
metals. Original drain intervals were used to establish a baseline for comparison. Oil
analysis results were used to predict oil degradation rates and propose new oil drain
intervals.
5. Next, a cost-benefit analysis of proposed extended drain intervals was prepared from the
projected costs and savings for each vehicle type.
Page 7
Contractor’s Report to CalRecycle 5
6. DTSC staff completed the project with a survey of the operators of vehicles in the
demonstration and with the development of an outreach mailer suitable for fleet
operators.
Results
Literature Search on High Efficiency Oil Filters
In the 2008 report, staff reviewed over 200 articles concerning HE oil filter technology and
extended oil drain intervals. Most articles had descriptions of reduction in engine wear, operating
costs, and waste generation with HE filter usage. Because most wear results from particles in the
5-20 micrometer (m) size range (the oil film’s thickness between moving parts), numerous
studies documented a correlation between filtration efficiency and engine wear.
The HE filters used in this study claimed filtration of particles to 1-2 m, much better than
standard filters of 30-50 m. Using standard filters is one reason that motor oil needs to be
changed; it gets dirty with small particles which results in engine wear. In this regard, standard
filters have not improved over the years compared to significant improvements in motor oil
quality. The oil change interval set in warranties is a result of standard filters being the limiting
factor, not the motor oil quality. Hence, higher quality filters will help to extend motor oil life to
its full potential.
The Amended (2013) Literature Review focused on six topics specified in the CalRecycle-DTSC
contract: (1) updated high efficiency oil filters, (2) oil sensors, (3) reusable oil filters, (4) oil
testing, (5) relating driving habits to oil life, and (6) air emissions related to oil. Staff found
technology has not changed significantly over the past four years. Excerpts are included in the
corresponding sections of this report, and details are found in Appendix 2.
Fleet Manager Survey and Focus Groups
To investigate barriers to HE filter technology use, staff mailed surveys to 1,987 fleet managers.
Two hundred and sixty-two surveys were returned (a 13 percent response rate) including
responses from several state agencies, and other public and private fleet operators representing a
broad spectrum of vehicle types and sizes. Concerns consistently reported across fleet size,
vehicle type, and operator type included: purchase and installation costs; maintenance
expenditures; HE filter performance; and engine warranty limitations.
Fleet operators in five focus groups met to validate the survey results and to identify ways to
overcome the barriers. Focus group participants expressed skepticism about the technology’s
performance claims and identified additional institutional barriers such as service schedules and
record-keeping requirements. Focus group recommendations included suggestions to eliminate
many adoption barriers, such as encouraging manufacturers to include HE technology as standard
equipment on new vehicles. The groups also helped to define the demonstration study goals and
to identify what information should be collected.
Demonstration of Extended Oil Service Intervals
Four state agencies, two local school districts, and one local transit agency partnered with DTSC
for the study’s demonstration phase. Throughout the two-year study, a total of 119 vehicles
completed the demonstration and accumulated nearly 3 million miles with no reported engine
failures. (Note that for the 2008 study, DTSC purposely chose large vehicles. One might expect
that cars could achieve similar oil extensions. DGS cars were tested in the later sensor study.)
Page 8
Contractor’s Report to CalRecycle 6
Table 1 shows the participating agencies, the number and types of vehicles involved, and
summary of information gathered during the study. Projected drain intervals were derived for
each vehicle type based on oil sample results, motor oil performance, and contamination limits,
and then compared to baseline original drain intervals. In general these projected intervals are
conservative and some vehicles of each type studied achieved distances beyond these values.
Drain interval extensions were achieved for DGS vehicles using standard filters and motor oil.
CAL FIRE and Caltrans trucks and FAX compressed natural gas (CNG) fueled buses (all using
OilGuard HE filters) achieved a three-fold extension to 18,000 miles. Both FUSD and LBUSD
bus fleets used the Luberfiner ZGard HE filter and achieved equivalent results with extension to
36,000 miles. CDC buses used puraDYN filters and achieved drain intervals of 50,000 miles.
Table 1. Fleet Vehicle Results Summary
Participating Fleets
Number and Type
of Vehicles
Filter Make and
Model
Miles Accumulated During Study
Oil Samples Collected
Original Drain
Intervals
Proposed Drain
Intervals
Projected Payback Period (yrs)
Department of 40
passenger cars
Fram X2 798,000 212 6,000 10,000 0.2 General Services
(DGS)
California Department of 13 two- Forestry and and three-
axle OilGuard EPS 60
134,980 42 5,000 18,000 3.1 Fire
Protection trucks (CAL FIRE)
California 5 two- and three-axle
trucks
OilGuard EPS 60
160,711 39 6,000 18,000 1.3 Department of Transportation
(Caltrans)
Fresno Area 10 city transit buses
OilGuard EPS 60
179,099 56 6,000 18,000 3.7 Express (FAX)
Fresno Unified 14 school
buses
Luberfiner ZGard
LPF9750 116,618 34 9,000 36,000 2.5
School District (FUSD)
Long Beach 26 school
buses
Luberfiner ZGard
LPF9750 505,115 57 10,000 36,000 6.8
Unified School District
(LBUSD)
California Department of 11 coach
buses puraDYN
TF 40 949,649 100 10,000 50,000 3.6
Corrections (CDC)
Fleet Manager Post-Survey
Participating fleet managers were surveyed at the original demonstration’s conclusion. Some
managers reiterated concerns voiced in the initial survey and focus group meetings. Cost and
warranty limitations were not the main issues, however. Now, operational problems such as
Page 9
Contractor’s Report to CalRecycle 7
logistics, maintenance schedules, and record-keeping became predominant. They expressed
satisfaction with the HE filter technology’s performance and reliability; however, only one fleet
manager planned to continue using HE filters. There is resistance to changing the prescribed
maintenance schedules that operators have followed over time. Clearly, significant barriers to
adoption of HE filter technology remain.
One issue mentioned during the demonstration is the difficulty maintaining a separate
maintenance schedule for relatively few vehicles. If all vehicles in a fleet were equipped with HE
filters or oil life sensors this should become a non-issue.
Operators also voiced concern about putting vehicles back into service while waiting for oil
analysis results, and then needing to call the vehicle back in for an oil change if the analysis
results deemed it necessary. This results in extra costs and disruption. With experience, operators
should become comfortable with a given extended mileage and be able to settle into consistent
operation. Oil life sensors that measure oil condition in real time are a potential solution to this
problem. Some fleets use hand-held sensors to screen their vehicles before oil analysis or oil
changes. This approach could become more widespread as sensors become more commonplace
and fleet managers become more comfortable with the technology.
Cost-Benefit Assessment
Costs for filters and elements, oil analysis, and labor were balanced against those of lower motor
oil purchases, reduced used oil generation and other savings. Proposed extended drain intervals
were established from demonstration vehicle results based on oil quality criteria and fleet
operator comfort with engine safety. Estimated economic payback periods were determined based
on the cost-benefit analysis for each fleet studied.
Table 1 shows payback periods for HE filter-fitted fleets ranging from 1.3 years to 6.8 years.
Periods were highly dependent on engine sizes and drain extensions achieved. Oil drain
extensions on passenger vehicles had much shorter payback periods primarily because savings
from reduced motor oil purchases were offset by only oil analysis test costs. Over time, the
overall economics and payback periods for both large and small vehicles should improve. As fleet
managers became comfortable with drain extensions, they typically reduce the number of oil
analyses they collect. While not included in this cost-benefit analysis, there will also be an added
benefit of increased fleet operating time in the field for many vehicles. Hence, the calculated
periods in Table 1 are conservative.
Principal Study Findings and Recommendations
The three key findings and three recommendations from the study are:
Finding 1: For any type of vehicle, oil drain intervals can be simply and safely extended
beyond their current level to the maximum mileage recommended by the vehicle/engine
manufacturer, or further.
The study confirmed that today’s average oil change interval is considerably shorter than the
maximum suggested by oil analysis results. The fleet managers’ survey showed an average
passenger vehicle oil change interval of 4,460 miles, which is well below some manufacturers’
recommendations of 7,500 miles or even 10,000 miles. The oil analysis results showed that oil
drain intervals can be safely extended for all vehicle types studied. Oil sampling results indicate
that in many cases, oil drain intervals can be extended beyond warranty limits.
Page 10
Contractor’s Report to CalRecycle 8
Finding 2: Fleet operators can further extend oil change intervals by using higher quality
oil and by using oil analysis for determining optimum drain intervals.
The oil quality parameter that triggered an oil change was unique to each fleet, the motor oils
used, and operating conditions. However, in most cases, the limiting factor was the oil’s Total
Base Number (TBN), which is a measure of the oil’s ability to neutralize acids. Oils with higher
initial TBN levels and longer-lasting additive packages are important factors in extending the
useful life of engine oil. For engine safety, routine oil analysis is an important tool for ensuring
oil functionality.
Finding 3: In larger engines, HE oil filters are an effective and economical technology for
extending oil drain intervals.
Typically, diesel engine fleets achieved the greatest extensions when using motor oil with higher
initial TBN levels or HE filters that addressed TBN consumption. The puraDYN filter design
features a time-released additive package that replenishes the oil’s buffering capacity. The
Luberfiner ZGard filter has a zinc liner that mitigates acid buildup in the oil. Both address the
TBN consumption and provide high filtration, thereby extending oil drain intervals the furthest.
Other HE filters with only high particulate filtration also produced lengthened drain intervals.
Recommendation 1: Develop outreach that convinces fleet operators to follow
manufacturers’ recommendations for oil change intervals and institute routine oil analysis
programs for extended oil change intervals.
Targeted outreach is necessary to convince fleet managers of the advantages to extended drain
intervals. Outreach should include training on oil sampling and interpretation of oil analysis
results. Promotional information featuring this project’s results could influence fleet managers
and their behavior.
Recommendation 2: To overcome adoption barriers, promote oil sensor, HE oil filter usage
by establishing education, training, and outreach programs for fleet managers and new car
owners.
Vehicles with larger engines (higher oil sump capacities) and those that accumulate significant
annual mileages appear to be the most appropriate HE filter candidates. Large-engine vehicle
fleet managers need outreach programs to help overcome HE technology adoption barriers. Focus
group participants recommended promoting testimonials from satisfied HE filter users.
Informational fact sheets, training programs, and consultations could lessen vehicle maintenance
tracking and operational concerns. A technical resource center for ongoing consultation services
and oil condition recommendations would support fleet managers who implement extended drain
interval programs. For new vehicles replacing aging fleet models, fleet managers could specify
HE filters as original equipment and avoid manufacturers’ engine warranty concerns.
Recommendation 3: Vehicle producers, engine manufacturers and oil formulators can
endorse extended oil drain intervals.
Vehicle producers and engine manufacturers can include HE oil filters as original equipment,
require the use of higher quality motor oils such as synthetics, and install monitoring systems for
safely extending oil change intervals. Honda, General Motors, Mercedes-Benz, and BMW use oil
change indicator systems on their vehicles. This needs to be expanded to all new vehicles sold by
all auto makers. Oil formulators can market oil blends with additive packages and buffering
agents designed specifically for extended drain intervals. Procurement specifications can include
Page 11
Contractor’s Report to CalRecycle 9
purchases of vehicles and oils that support extended drain intervals. CalRecycle and DTSC
should work together to contact vehicle manufacturers with these recommendations.
Introduction As noted, this is the amended (2013) version of DTSC’s 2008 High Efficiency Oil Filter Final
Report prepared for CalRecycle. The amended material includes the literature review update, the
sensors study, and additional information on the applicability to automobiles and heavy duty
vehicles.
DTSC’s Office of Pollution Prevention and Technology Development (OPPTD) demonstrated the
performance of high efficiency (HE) oil filters in the state fleet.1 This report presents the results
of the study, and provides recommendations that foster and encourage adoption of HE filter
technology in both state and private fleets. This study was designed to:
1. Discover why state agencies have not yet adopted this technology.
2. Identify barriers to its adoption.
3. Determine how the barriers could be overcome.
4. Demonstrate the technology’s performance in actual fleet operations.
Each year, Californians purchase approximately 270 million gallons of new oil and generate more
than 116 million gallons of waste oil. Better oil filter designs would lead to longer drain intervals
by cleaning engine oil better than standard filters. Oil life sensors would also give users
confidence to extend drain intervals. Both would conserve resources and reduce waste generation.
The trucking industry has used HE oil filters for several decades claiming they provide better
filtration and extend drain intervals. Articles in industry publications describe how “Oil doesn’t
break down; it just gets dirty,” and present case studies of “Million mile trucks – using bypass
filters.” If the oil change interval on all vehicles in California is doubled, motorists would save
hundreds of millions of dollars, and conserve more than 1 million barrels of crude oil each year.
However, HE filter technology has not been widely adopted, despite manufacturers’ claims that
the filters reduce operating costs and waste generation. Very few state agencies use HE filters on
their vehicles. In 2007, the state purchased approximately 311,000 gallons of motor oil for its
fleet of more than 50,000 vehicles. Doubling the oil change interval with HE filters would
decrease motor oil purchases by half and save more than $1 million in purchase costs each year.
This study explored why state agencies have not implemented this technology and suggests ways
to overcome these barriers.
Research on oil sensors found that oil change intervals are already being extended by intelligent
oil life monitors in new cars. Combined with messages like CalRecycle’s “Check Your Number”
ad campaign, oil change intervals should continue to increase. Oil sensor technology is
summarized below, sensor testing is summarized in the report, and in Appendix 13.
Page 12
Contractor’s Report to CalRecycle 10
HE Oil Filter Project Overview
For the HE Oil Filter project, DTSC staff:
5. Identified HE oil filter manufacturers and compiled technical information for remote-
mounted bypass, centrifugal/bypass, and combination-type spin-on/bypass filters.
6. Surveyed state, local government, and private fleet managers to identify barriers to HE
oil filter use.
7. Held focus group meetings where fleet managers reviewed survey results. These
managers inspected the filters and discussed ways to overcome barriers identified in the
survey.
8. Designed a demonstration project that addressed the barriers, and measured the filters’
environmental benefits and costs savings.
DTSC purchased 119 filters and replacement elements for participating state agencies and local
government fleets. The participating fleets installed the filters, collected periodic oil samples, and
recorded vehicle mileages and service events. DTSC used oil analysis results to ensure the oil’s
continued usability and to predict optimum change intervals. Additionally, a cost-benefit analysis
of HE oil filter technology was performed.
Background Used oil includes spent lubricating oils, such as motor and transmission oils, and waste industrial
oils. Three primary management methods exist for used oil:2
1. Burning waste oil for energy recovery is the most common method.
2. Waste oil can also be recycled by distilling it into marine diesel fuel.
3. Waste oil can be re-refined to meet virgin product standards, and then re-supplied for its
original use. Less used oil is re-refined into new lube oil than is managed by any other
method.
However, the most desirable management method is decreasing waste oil generation directly
through source reduction. Source reduction is preferred because of energy and material
conservation. Using HE filters or oil life sensors to extend oil change intervals achieves source
reduction.
HE filter technology has additional benefits. HE oil filters have been shown to reduce abrasive
engine wear. A study by General Motors (GM) (Staley, D.R. 1988) correlated engine wear with
filter efficiency.3 Researchers added dust to the engine oil, and used two different-sized filters.
They weighed engine parts before and after testing. GM concluded that dust particles in the exact
size of the oil-film thickness, 2 to 22 μm, abrade engine parts at the greatest rate. It also found
that the filter’s ability to remove the most abrasive particles had been accurately predicted by the
single pass efficiency test. Engine wear was reduced by 50 percent with 30 μm filtration versus
40 μm, and by 70 percent with 15 μm filtration.
Oil life sensors
Oil life sensors are another technology that can extend oil change intervals. Oil sensors, monitors,
and indicators that measure oil condition in real-time are becoming increasingly common on new
Page 13
Contractor’s Report to CalRecycle 11
cars. Even the simplest mileage-based devices, which use an algorithm to predict the continued
usability of the oil, still give vehicle operators the assurance they need to adopt condition-based
oil changes. DTSC studied both handheld sensors and onboard oil life monitors.
Physical and Chemical Oil Parameters
Viscosity, the fluid’s resistance to flow, is the most important physical parameter used to
determine oil condition. It increases when oil oxidizes, or is contaminated by water, soot, or dirt.
Viscosity decreases when the oil molecules break down or when oil is diluted with fuel.
The total base number (TBN) measures the oil’s acid-neutralizing capacity, and is the most
important chemical parameter used to determine oil condition. Acids are formed in the engine
during combustion processes. The three main acids are: sulfuric acid from sulfur in the fuel, nitric
acid from nitrogen in the air, and organic acids from the oil’s thermal breakdown. Initial TBN
decreases as the oil’s acid-neutralizing components are consumed.
Oil Additive Packages
Zinc dialkyldithiophosphate (ZDDP) is commonly used in engine oils to counter the formation of
acids and maintain TBN levels. Diesel and gasoline engine oils with higher initial TBN levels can
achieve longer oil drain intervals. Traditional gasoline engine oils have lower initial TBN levels,
which are then depleted before the vehicles achieve the higher mileages typical of diesel engines.
Motor oils with high levels of zinc and phosphorous damage catalytic converters, which limits
their use in automobiles. Depending on different applications, various oil grades and brands have
different TBNs. However, synthetic oils generally have higher initial TBNs, and are longer-
lasting.
Synthetic Motor Oils
Synthetic motor oils are now common in automobile applications. Originally, they were
synthesized from basic petroleum building blocks such as esters and polyalphaolephins.
However, since oil makers won the right to use the “synthetic” label on less expensive Class 3
base stocks, most companies converted to using them. Most synthetics have higher initial TBN
levels that provide longer drain intervals. Synthetics also contain less multi-weight viscosity
improvers that break down over time. Synthetics show promise for extended change intervals, but
they were not part of this study.
HE Oil Filter Designs
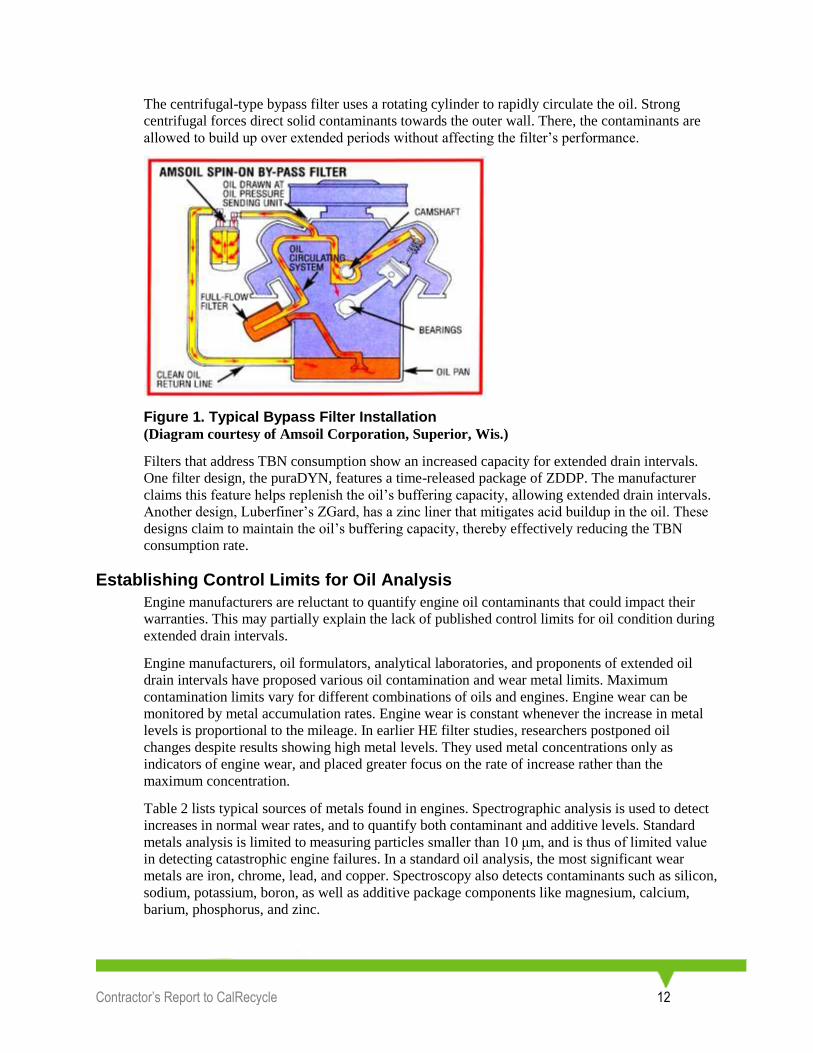
Several different HE oil filter designs exist. Generally, these filters are add-on equipment that
supplements the standard full-flow filter by filtering a side-stream of the oil. Figure 1 shows the
typical oil circulation from the oil pump to the full-flow filter, and then through the engine block.
After lubricating engine components, the oil is directed to the bypass filter. Here, it is cleaned to
the maximum extent possible, and then returned to the oil sump.
Bypass designs feature a large volume of dense media. Typical claimed pore sizes range from 1-2
μm, compared with a full flow filter’s pore size of 25-35 μm. Because of flow restriction, bypass
designs filter only about 10 percent of the total oil flow. The combination spin-on/bypass filter
design includes both bypass and full-flow filters in a single spin-on unit. Space constraints
necessarily mean these filters feature smaller volumes for each type of filter. Additionally, these
filters are not available for all vehicle applications.
Page 14
Contractor’s Report to CalRecycle 12
The centrifugal-type bypass filter uses a rotating cylinder to rapidly circulate the oil. Strong
centrifugal forces direct solid contaminants towards the outer wall. There, the contaminants are
allowed to build up over extended periods without affecting the filter’s performance.
Figure 1. Typical Bypass Filter Installation (Diagram courtesy of Amsoil Corporation, Superior, Wis.)
Filters that address TBN consumption show an increased capacity for extended drain intervals.
One filter design, the puraDYN, features a time-released package of ZDDP. The manufacturer
claims this feature helps replenish the oil’s buffering capacity, allowing extended drain intervals.
Another design, Luberfiner’s ZGard, has a zinc liner that mitigates acid buildup in the oil. These
designs claim to maintain the oil’s buffering capacity, thereby effectively reducing the TBN
consumption rate.
Establishing Control Limits for Oil Analysis
Engine manufacturers are reluctant to quantify engine oil contaminants that could impact their
warranties. This may partially explain the lack of published control limits for oil condition during
extended drain intervals.
Engine manufacturers, oil formulators, analytical laboratories, and proponents of extended oil
drain intervals have proposed various oil contamination and wear metal limits. Maximum
contamination limits vary for different combinations of oils and engines. Engine wear can be
monitored by metal accumulation rates. Engine wear is constant whenever the increase in metal
levels is proportional to the mileage. In earlier HE filter studies, researchers postponed oil
changes despite results showing high metal levels. They used metal concentrations only as
indicators of engine wear, and placed greater focus on the rate of increase rather than the
maximum concentration.
Table 2 lists typical sources of metals found in engines. Spectrographic analysis is used to detect
increases in normal wear rates, and to quantify both contaminant and additive levels. Standard
metals analysis is limited to measuring particles smaller than 10 μm, and is thus of limited value
in detecting catastrophic engine failures. In a standard oil analysis, the most significant wear
metals are iron, chrome, lead, and copper. Spectroscopy also detects contaminants such as silicon,
sodium, potassium, boron, as well as additive package components like magnesium, calcium,
barium, phosphorus, and zinc.
Page 15
Contractor’s Report to CalRecycle 13
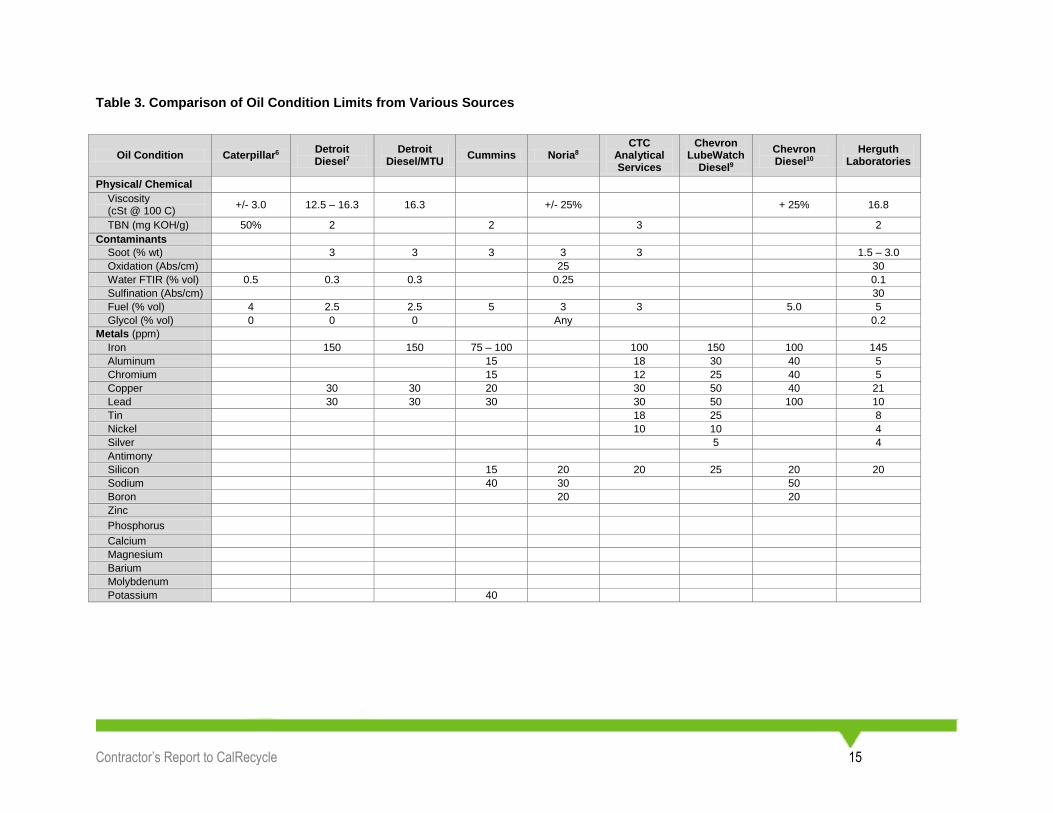
Table 3 shows a comparison of oil condition limits from several sources including engine
manufacturers and analytical laboratories. CTC Analytical Services (Phoenix, Ariz.) has
established general limits for generic, first-time engine samples that do not have any previous
analytical history. Herguth Laboratories (Vallejo, Calif.) used conservative values for vehicles
without a previous sampling history. For vehicles that were sampled once or twice, Herguth used
average values from its database containing more than 10,000 results for similar engine and oil
combinations. Some labs use only physical and chemical oil parameters to signal an abnormal
condition requiring an oil change, and exclude wear metals entirely. Such distinctions are
important because fleet managers are more likely to follow the laboratory’s oil change
recommendations than to attempt establishing their own unique limits.
Contamination is also used to determine the need for an oil change. Soot and combustion solids
are of primary concern in diesel engines. Soot is abrasive, and increases the oil viscosity.
Elevated soot levels are associated with worn pistons, rings, and cylinders, which allow blow-by
of exhaust gases. Excessive idling, restricted air intake, and leaking injector nozzles also increase
soot production in diesel engines.
The preceding discussion shows some of the difficulties encountered when attempting to establish
limits on oil condition for extended oil drain intervals. Engine manufacturers generally provide
limits on only the most basic oil parameters such as viscosity, soot, and iron. Analytical
laboratories have published additional recommendations for TBN, oxidation, water, and fuel.
Laboratories have also established limits for nitration in gasoline and compressed natural gas
(CNG) engine oils, and for sulfination in diesel oils. Meanwhile, wear metals limits are frequently
unavailable, and their published values often vary.
Thus, extended drain interval proponents may need to develop unique limits for their vehicles.
This also illustrates why installation of the technology on newer vehicles still under the
manufacturer’s warranty is not an attractive option for fleet operators. Since maximum limits are
not provided by engine manufacturers, it is not always possible to prove whether a vehicle has
exceeded a safe contaminant level.
Literature Review
Staff began the original HE project with a literature review of journal articles and Internet
publications. The review included filter manufacturers’ product information and independent
testing reports to verify manufacturer claims and recommendations. The articles came from
engineering and testing reports; trade publications; commercial websites; and federal, state, and
private organizations. Article subjects included: extended change intervals, oil analysis, pollution
prevention, new and existing filter types, testing, and warranties. Staff assembled a bibliography
of 219 papers (Appendix 2). They reviewed all available information on the applicability and
warranties for commercially available HE oil filters. The review showed that while motor oil had
improved significantly over the years, oil filter capabilities had remained constant.4
Page 16
Contractor’s Report to CalRecycle 14
Table 2. Typical Metals Found in Engine Oil and Their Sources5
Metals Wear Sources Environmental and Contamination Sources Oil Additives
Aluminum (Al) Piston; shell bearing; bushing; thrust; block; head; blower, additive (grease); cooler cores
Crankcase paint; aluminum manufacturing, recycling; coal contaminant (trace levels)
aluminum
Antimony (Sb) Bearing alloy; babbitt alloy Tracer element
Barium (Ba) Lube additive Additive used in well service carried through breather
applications, contaminant
Boron (B) Lube additive Coolant additive; mining
Calcium (Ca) Lube additive Water, mining product
Chrome (Cr) Various plating, liner, ring, shaft; steel), e.g., some shafts, gears
alloy (stainless Chromate coolant additive (mostly out of use now)
Copper (Cu) Bushing; bearing; thrust; piston insert; gear; hydraulic piston assembly; cooler cores; rod packing (mostly out of use now)
axial Copper mines
Occasionally used as an automotive applications
additive in
Lead (Pb) Bearing plating;
overlay; bearing piston insert; wet
alloy; shaft; clutch
thrust Mining; paint (mostly out of use now) Gasoline additive (mostly out of use now)
Iron (Fe) Piston, ring, cylinder, gear; block; shaft; roller bearing; shell bearing
head; back;
cam; seal
Rust, machining, mining
Magnesium (Mg) Lube additive; some turbine metallurgy Seawater Oil additive, off-the-shelf supplement
Molybdenum (Mo) Ring plating, alloy
Nickel (Ni) Steel alloy; ‘heavy’ fuel contaminant (usually with vanadium and sodium); satellite (cobalt-nickel) valve seat
Phosphorus (P) Lube additive; synthetic phosphate ester lube Brass/bronze alloy Phosphoric acid
Potassium (K) Coolant additive
Silicon (Si) Wet clutch; brake materials Abrasive (dirt); silicate glass manufacturing
coolant additive; silicone seal; Defoamant additive; synthetic lube
Silver (Ag) EMD wrist pin bushing/turbo bearing; plating or alloy (needle bearings)
bearing Silver solder
Sodium (Na) Lube additive latent additive preparation
(harmless) from lube Coolant additive; salt water
Tin (Sn) Bearing/bushing/piston plating or alloy Manufacturing processes, recycling processes
Titanium (Ti) Gas turbine bearings/hubs/blades Paint (White lead)
Zinc (Zn) Lube additive Galvanized metals/plumbing; brass/bronze alloy
Page 17
Contractor’s Report to CalRecycle 15
Table 3. Comparison of Oil Condition Limits from Various Sources
Oil Condition 6Caterpillar Detroit Diesel7
Detroit Diesel/MTU
Cummins 8Noria CTC
Analytical Services
Chevron LubeWatch
Diesel9
Chevron Diesel10
Herguth Laboratories
Physical/ Chemical
Viscosity (cSt @ 100 C)
+/- 3.0 12.5 – 16.3 16.3 +/- 25% + 25% 16.8
TBN (mg KOH/g) 50% 2 2 3 2
Contaminants
Soot (% wt) 3 3 3 3 3 1.5 – 3.0
Oxidation (Abs/cm) 25 30
Water FTIR (% vol) 0.5 0.3 0.3 0.25 0.1
Sulfination (Abs/cm) 30
Fuel (% vol) 4 2.5 2.5 5 3 3 5.0 5
Glycol (% vol) 0 0 0 Any 0.2
Metals (ppm)
Iron 150 150 75 – 100 100 150 100 145
Aluminum 15 18 30 40 5
Chromium 15 12 25 40 5
Copper 30 30 20 30 50 40 21
Lead 30 30 30 30 50 100 10
Tin 18 25 8
Nickel 10 10 4
Silver 5 4
Antimony
Silicon 15 20 20 25 20 20
Sodium 40 30 50
Boron 20 20
Zinc
Phosphorus Calcium
Magnesium
Barium
Molybdenum
Potassium 40
Page 18
Contractor’s Report to CalRecycle 16
2013 Amended Literature Review
In 2013 staff used the Internet to search additional “bypass” and “high efficiency” (HE) oil
filters” which were not identified in the 2008 report. No new HE or bypass filters were identified.
Staff also researched “cart-type” filters, which are essentially bypass filters which are not
mounted on the vehicle. Because the cart-type filters are mobile they can be used to service
several vehicles in a fleet. Several of the 14 high efficiency or bypass oil filter makers identified
in 2008 also offer cart-type filters. These include Amsoil, Donaldson, Kleenoil, Triad, OilMiser,
Parker, Triple R, Precision Filtration, and Engineered Filtration.
Additional searches were done on: reusable oil filters, oil testing, relating driving habits to oil life
and air emissions, and para aromatic hydrocarbons. These are described in more detail in the
2013 Literature Review in Appendix 2.
Other Studies on HE Oil Filters
Additionally, staff identified several reports on other HE oil filter studies. The Idaho National
Laboratory (INL) had conducted a three-year study on diesel buses and gasoline Chevrolet
Tahoes. Seventeen vehicles were fitted with puraDYN filters. During the testing, more than
980,000 miles were run on the buses and more than 300,000 miles on the Tahoes. Oil condition
was monitored by collecting 240 samples from the vehicles. The filters extended the oil drain
intervals, reducing oil purchases and waste oil generation by nearly 90 percent. The buses
accumulated almost 30,000 miles per year. Installation of HE filters on the buses had a positive
payback at 72,000 miles, or slightly less than 2 1/2 years. For the Tahoes, which traveled more
than 33,000 miles per year, the average payback was at approximately 68,000 miles, or just over
two years.
INL established its own physical and chemical contamination criteria for acceptable oil condition.
Oil was changed only when its values exceeded or fell below these limitations. The criteria
included physical parameters such as viscosity; chemical parameters such as TBN, oil oxidation
and nitration; and contaminants such as fuel, water, soot, and glycol. The INL study did not
consider wear metal accumulation rates or establish maximum limits.
Another study was conducted in 1997-99 by the North Carolina Department of Natural Resources
(NCDNR). North Carolina installed TF Purifiner, Amsoil, and Enviro bypass filters in 60 school
buses. Oil analyses were performed every 5,000 miles. Standard full-flow filter changes were
reduced to one per year. With these alterations in routine oil sampling and annual oil changes, the
return-on-investment was nearly 38 percent, with a 32-month payback period. NCDNR
recommended installing these filters on all school buses, and in 2005 added the filters to the
state's procurement list.
In 2006, the U.S. Department of Energy issued a report on the use of bypass filters. The report
recognized source reduction as a strategic element for minimizing the environmental impacts of
used oil, and in conserving finite petroleum resources. Extending the drain interval is essential to
reducing waste oil generation. While oil filter technology has remained essentially the same, the
report noted continual improvement in motor oil quality over the past 30 years. Today’s lowest
grade motor oil now has sufficient additives for 8,000 to 10,000 miles; however, standard filters
clog in about 5,000 miles, making an oil change necessary. The report stated that, in some cases,
major automobile manufacturers have enough experience with onboard diagnostic systems to use
10,000 to 12,000 mile oil changes. This more than doubles the current U.S. average oil change
interval, which is approximately 4,500 miles. Adopting this new oil change interval would reduce
waste oil generation from the automobile sector by half. The report showed that oil change
Page 19
Contractor’s Report to CalRecycle 17
intervals of nearly 20,000 miles can be achieved using fully synthetic oils. Heavy-duty vehicles
were shown to achieve oil change intervals of 60,000 miles and more with HE filters.
Oil Life Sensors study
DTSC staff researched several oil life sensor designs, including algorithm calculators, in-line and
handheld models, prototypes, viscosity and water detectors, and complete minilabs. A summary
of the oil sensor research is found in Appendix 13.
DTSC staff also evaluated the handheld SKF oil sensor on 19 DGS automobiles. Staff attempted
to correlate sensor readings with increasing oil time, and found that the sensor was qualitatively
accurate. Decreasing total base number (TBN) is strongly correlated with oil time, and so the
handheld meters should be a valuable tool in identifying decreased with oil life. Future studies
should expand on DTSC’s work by testing newer multi-parameter sensors on a variety of vehicle
engine and fuel types.
Benefits resulting from the use of HE oil filters and oil life sensors
Cost savings is one major potential benefit resulting from using HE oil filters and oil life sensors.
Such savings are straightforward and easy to compute; however, other benefits may be intangible
and realized only by individual fleet managers based on their unique circumstances.
Environmental benefits are in this latter category. HE filters and oil life sensors extend the time
between oil changes and reduce waste oil generation, which is a significant environmental
benefit. However, bulk oil is inexpensive and the payback period can be lengthy. Therefore,
minimal savings and high initial investment costs may outweigh environmental benefits. HE oil
filter and sensor makers also assert that their technologies decrease engine wear, thereby reducing
maintenance and extending the time between engine overhauls. Those savings were not
quantified in this study.
Furthermore, HE oil filters and sensors can also be used in stationary or remotely-operating
engines which may be difficult to access for servicing. The filters are used to enable extended
operation over prolonged periods. Examples are crop harvesters and other farming equipment that
cannot be brought in from the field during the planting, harvest, or other critical seasons.
Fleet Managers’ Survey Staff developed a survey to investigate fleet managers’ perceptions, previous experiences, and
current HE oil filter knowledge. It identified the fleet managers’ barriers to technology adoption,
and gathered information on their fleet vehicles and operations.
The survey asked fleet managers about the importance of purchase costs and the maximum
allowed payback period. Next, they rated concerns over reducing oil purchases, decreasing engine
wear, and engine warranties. Managers were asked about increasing their reliance on oil analysis
results, and the value they would receive from increased service intervals. Additional questions
about filter performance, reliability, and warranties followed. Each issue was rated on a scale of 1
(“Not Important”) to 5 (“Very Important.”)
The survey also included questions about vehicle types, ownership, and leasing. Information was
collected about average annual mileages, oil change intervals, and the operator’s familiarity with
HE oil filters. Ample space for additional comments and a call-back number were also provided.
The fleet managers’ survey is included in Appendix 3.
Page 20
Contractor’s Report to CalRecycle 18
The survey targeted state, local government, and private fleet managers with high annual mileage
vehicles. Fleet managers were identified by utilizing all available fleet lists, such as the state’s
“Green Driving” group; DTSC’s vehicle service repair project; university, state, and community
colleges; and local school districts. Additional fleets included transit districts, private trucking
companies, and taxi cab operators.
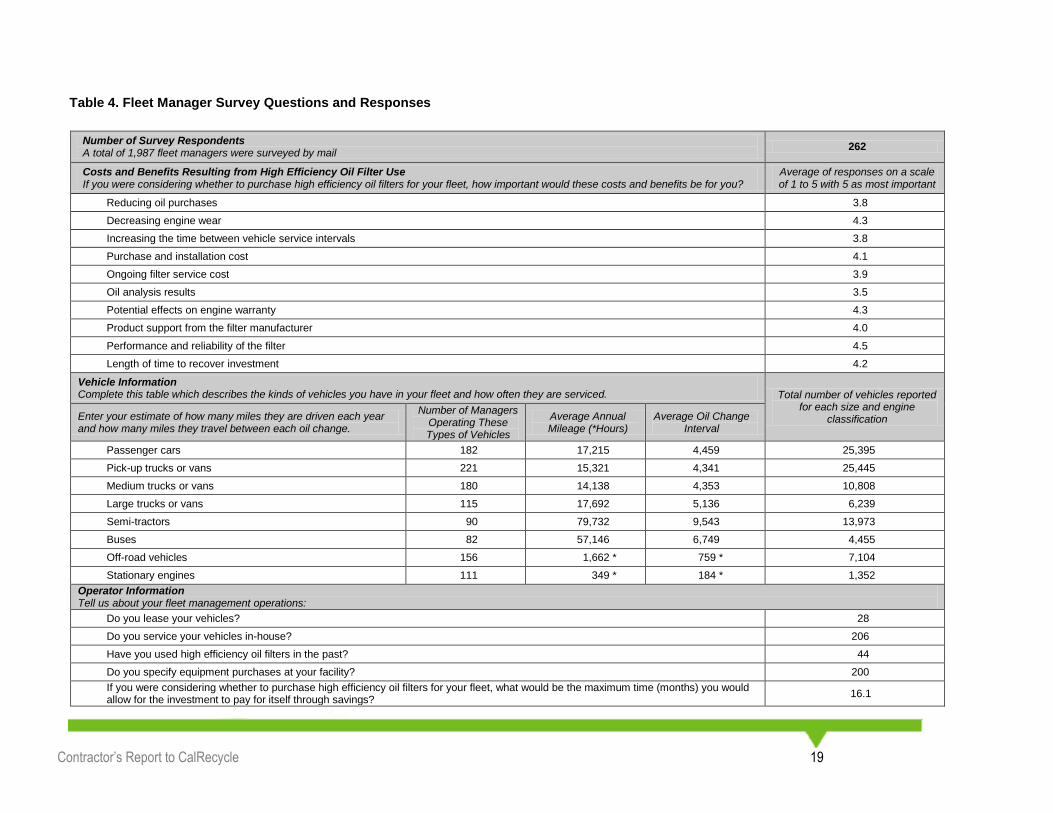
In fall 2003, DTSC mailed the survey to 1,987 public and private fleet managers. Table 4
summarizes fleet manager responses to the survey questions.
There were 262 surveys returned, which represented a 13 percent response rate comprised of 102
private, 124 local, 30 state, and 6 federal fleet managers. More than 76 percent of the surveys
(200) were completed by fleet managers responsible for specifying equipment purchases. The
survey represented approximately 95,000 vehicles that traveled a combined 2.5 billion miles
annually. Nearly 400,000 oil changes were performed, which generated a conservative estimate
of 2 million gallons of waste oil annually.
Table 4 shows the average annual mileages and oil change intervals for various vehicle types.
Survey results match the 4,500 mile national average oil change interval for passenger cars.
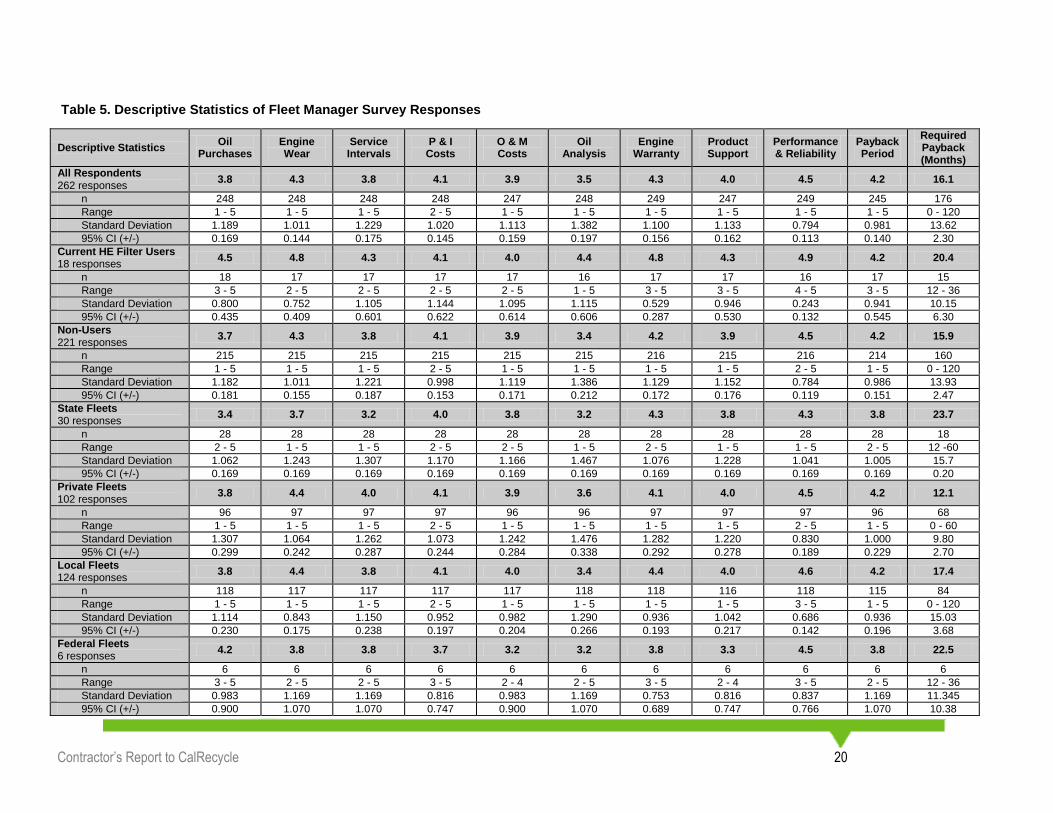
Barrier Survey Results Table 5 presents descriptive statistics for cost/benefit survey questions. It provides results for fleet
manager sub-groups (current filter users and non-users), and for state, federal, local government,
and private fleets.
Cost & Benefit Question Statistics
Table 5 shows the number of responses received, the range of responses (from 1 for “Not
Important” to 5 for “Very Important”), and the statistical variability of each response. In
identifying the importance of “reducing oil purchases,” the average response by 248 fleet
managers (from 262 total) was 3.8.
Of all the cost/benefit questions, the highest average response was 4.5 for performance and
reliability of the filter, while the lowest was 3.5 for oil analysis. The overall average response for
all survey questions was slightly greater than 4.0, which is as great as the value (4) assigned to the
“More Important” response category. Thus, the statistics show that fleet managers considered
every question on costs and benefits to be important to them.
Survey responses then were divided into fleet manager subgroups. For current HE filter users,
performance and reliability had the highest average of 4.9, while operation & maintenance costs
was lowest at 4.0. Perhaps this indicates satisfaction with the technology by these fleet managers.
Not surprisingly, non-users ranked oil analysis as least important — perhaps highlighting
unfamiliarity with oil analysis and its benefits. Overall, non-users gave lower approval rankings
to HE filters than did current users. Presumably, current users were satisfied with the
technology’s performance and economics, while non-users indicated a stronger interest in
payback periods and other costs.
Of all the questions, the lowest average response was from federal fleets at 3.2 for both operation
& maintenance costs and oil analysis. The required payback period was longest for state fleets at
23.7 months and lowest for private fleets at 12.1 months.
Page 21
Contractor’s Report to CalRecycle 19
Table 4. Fleet Manager Survey Questions and Responses
Number of Survey Respondents 262
A total of 1,987 fleet managers were surveyed by mail
Costs and Benefits Resulting from High Efficiency Oil Filter Use Average of responses on a scale If you were considering whether to purchase high efficiency oil filters for your fleet, how important would these costs and benefits be for you? of 1 to 5 with 5 as most important
Reducing oil purchases 3.8
Decreasing engine wear 4.3
Increasing the time between vehicle service intervals 3.8
Purchase and installation cost 4.1
Ongoing filter service cost 3.9
Oil analysis results 3.5
Potential effects on engine warranty 4.3
Product support from the filter manufacturer 4.0
Performance and reliability of the filter 4.5
Length of time to recover investment 4.2
Vehicle Information Complete this table which describes the kinds of vehicles you have in your fleet and how often they are serviced. Total number of vehicles reported
for each size and engine Number of Managers Enter your estimate of how many miles they are driven each year Average Annual Average Oil Change classification Operating These and how many miles they travel between each oil change. Mileage (*Hours) Interval
Types of Vehicles
Passenger cars 182 17,215 4,459 25,395
Pick-up trucks or vans 221 15,321 4,341 25,445
Medium trucks or vans 180 14,138 4,353 10,808
Large trucks or vans 115 17,692 5,136 6,239
Semi-tractors 90 79,732 9,543 13,973
Buses 82 57,146 6,749 4,455
Off-road vehicles 156 1,662 * 759 * 7,104
Stationary engines 111 349 * 184 * 1,352
Operator Information Tell us about your fleet management operations:
Do you lease your vehicles? 28
Do you service your vehicles in-house? 206
Have you used high efficiency oil filters in the past? 44
Do you specify equipment purchases at your facility? 200
If you were considering whether to purchase high efficiency oil filters for your fleet, what would be the maximum time (months) you would 16.1
allow for the investment to pay for itself through savings?
Page 22
Contractor’s Report to CalRecycle 20
Table 5. Descriptive Statistics of Fleet Manager Survey Responses
Descriptive Statistics Oil
Purchases Engine Wear
Service Intervals
P & I Costs
O & M Costs
Oil Analysis
Engine Warranty
Product Support
Performance & Reliability
Payback Period
Required Payback
All Respondents 262 responses
3.8 4.3 3.8 4.1 3.9 3.5 4.3 4.0 4.5 4.2
(Months)
16.1
n 248 248 248 248 247 248 249 247 249 245 176
Range 1 - 5 1 - 5 1 - 5 2 - 5 1 - 5 1 - 5 1 - 5 1 - 5 1 - 5 1 - 5 0 - 120
Standard Deviation 1.189 1.011 1.229 1.020 1.113 1.382 1.100 1.133 0.794 0.981 13.62
95% CI (+/-) 0.169 0.144 0.175 0.145 0.159 0.197 0.156 0.162 0.113 0.140 2.30
Current HE Filter Users 18 responses
4.5 4.8 4.3 4.1 4.0 4.4 4.8 4.3 4.9 4.2 20.4
n 18 17 17 17 17 16 17 17 16 17 15
Range 3 - 5 2 - 5 2 - 5 2 - 5 2 - 5 1 - 5 3 - 5 3 - 5 4 - 5 3 - 5 12 - 36
Standard Deviation 0.800 0.752 1.105 1.144 1.095 1.115 0.529 0.946 0.243 0.941 10.15
95% CI (+/-) 0.435 0.409 0.601 0.622 0.614 0.606 0.287 0.530 0.132 0.545 6.30
Non-Users 221 responses
3.7 4.3 3.8 4.1 3.9 3.4 4.2 3.9 4.5 4.2 15.9
n 215 215 215 215 215 215 216 215 216 214 160
Range 1 - 5 1 - 5 1 - 5 2 - 5 1 - 5 1 - 5 1 - 5 1 - 5 2 - 5 1 - 5 0 - 120
Standard Deviation 1.182 1.011 1.221 0.998 1.119 1.386 1.129 1.152 0.784 0.986 13.93
95% CI (+/-) 0.181 0.155 0.187 0.153 0.171 0.212 0.172 0.176 0.119 0.151 2.47
State Fleets 30 responses
3.4 3.7 3.2 4.0 3.8 3.2 4.3 3.8 4.3 3.8 23.7
n 28 28 28 28 28 28 28 28 28 28 18
Range 2 - 5 1 - 5 1 - 5 2 - 5 2 - 5 1 - 5 2 - 5 1 - 5 1 - 5 2 - 5 12 -60
Standard Deviation 1.062 1.243 1.307 1.170 1.166 1.467 1.076 1.228 1.041 1.005 15.7
95% CI (+/-) 0.169 0.169 0.169 0.169 0.169 0.169 0.169 0.169 0.169 0.169 0.20
Private Fleets 102 responses
3.8 4.4 4.0 4.1 3.9 3.6 4.1 4.0 4.5 4.2 12.1
n 96 97 97 97 96 96 97 97 97 96 68
Range 1 - 5 1 - 5 1 - 5 2 - 5 1 - 5 1 - 5 1 - 5 1 - 5 2 - 5 1 - 5 0 - 60
Standard Deviation 1.307 1.064 1.262 1.073 1.242 1.476 1.282 1.220 0.830 1.000 9.80
95% CI (+/-) 0.299 0.242 0.287 0.244 0.284 0.338 0.292 0.278 0.189 0.229 2.70
Local Fleets 124 responses
3.8 4.4 3.8 4.1 4.0 3.4 4.4 4.0 4.6 4.2 17.4
n 118 117 117 117 117 118 118 116 118 115 84
Range 1 - 5 1 - 5 1 - 5 2 - 5 1 - 5 1 - 5 1 - 5 1 - 5 3 - 5 1 - 5 0 - 120
Standard Deviation 1.114 0.843 1.150 0.952 0.982 1.290 0.936 1.042 0.686 0.936 15.03
95% CI (+/-) 0.230 0.175 0.238 0.197 0.204 0.266 0.193 0.217 0.142 0.196 3.68
Federal Fleets 6 responses
4.2 3.8 3.8 3.7 3.2 3.2 3.8 3.3 4.5 3.8 22.5
n 6 6 6 6 6 6 6 6 6 6 6
Range 3 - 5 2 - 5 2 - 5 3 - 5 2 - 4 2 - 5 3 - 5 2 - 4 3 - 5 2 - 5 12 - 36
Standard Deviation 0.983 1.169 1.169 0.816 0.983 1.169 0.753 0.816 0.837 1.169 11.345
95% CI (+/-) 0.900 1.070 1.070 0.747 0.900 1.070 0.689 0.747 0.766 1.070 10.38
Page 23
Contractor’s Report to CalRecycle 21
Comparison of Fleet Responses
Table 6 provides a statistical comparison of fleet responses using standard tests to discern
differences between means. Generally, fleet managers considered each of the cost and benefits
presented to them to be important. When measured at the 95 percent confidence level, the average
responses for most survey questions were not significantly different. This complicates the ranking
of survey responses to identify any particular cost/benefit factor as the most or least important.
However, statistical significance was observed for some questions. Current HE filter users were
compared to non-users; differences were observed for oil purchases, oil analysis, engine
warranty, and performance & reliability responses. Apparently, current HE filter users recognize
the cost savings gained by reducing oil purchases, as shown by their 4.5 ranking versus 3.7 for
non-users. By a difference of 4.4 to 3.4, current users recognize the importance of regular oil
analysis. Current users ranked engine warranty higher than non-users, by 4.8 to 4.2. Over time,
current users may have overcome their warranty concerns by using the technology. Current users
also valued HE filter performance more by a difference of 4.9 to 4.5. Thus, non-users are
unconvinced that the technology produces tangible benefits.
State fleets differed from private fleets in the areas of engine wear and service intervals. Private
fleets considered engine wear to be more important by 4.4 to 3.7, and service intervals to be more
important by 4.0 to 3.2. The profit incentive may drive these differences. Private fleets want to
maintain their investment in their vehicles, whereas state fleet managers may feel less ownership
of their vehicles. Private fleets may see oil service events as a significant cost, so that increasing
service intervals may be more beneficial to them than for state fleet managers.
Differences were also observed between state and other fleets. State fleet managers were less
concerned about engine wear than were other managers, as shown by a relative importance rating
of 4.4 for all other fleets compared to 3.7 for state fleets. In 25 of 30 responses, state fleet
managers reported leasing their vehicles, which may indicate less concern about the vehicles’
resale value. Of all reporting fleets, only 28 out of 262 respondents reported leasing their
vehicles. Therefore, in this survey, vehicle leasing was largely a phenomenon of only state fleets.
Other fleets were more concerned with service intervals than were state fleets, by 3.9 to 3.2.
Statistical testing also confirmed the significance of payback periods. Understandably, other
fleets were more concerned about payback periods than were state fleets, with an average ranking
of 4.2 compared with 3.8 for state fleets. This is confirmed with required payback period
differences of 23.7 months for state fleets versus 15.3 months for all other fleets.
Identified Barriers
In addition to oil purchases and oil analysis, identified barriers include the payback period. This
indicates fleet manager unfamiliarity with the practice and/or value of regular oil analysis.
Predictably, costs and the payback period are important issues. Non-users gave oil analysis results
their lowest ranking. Again, this indicates unfamiliarity with oil sample collection, but more
importantly, inexperience with the interpretation of and reliance on analytical results.
Non-users are unaware of the requirements, procedures, and benefits of routine oil sampling, a
significant obstacle to adopting oil drain interval extension programs and HE filter technology.
Statistically, concerns about performance and reliability, engine warranty, and engine wear were
indistinguishable.
Page 24
Contractor’s Report to CalRecycle 22
Statistical Comparison Oil
Purchases Engine Wear
Service Intervals
P & I Costs
O & M Costs
Oil Analysis
Engine Warranty
Product Support
Performance & Reliability
Payback Period
Required Payback (Months)
Current HE Filter Users 18 responses
4.5 4.8 4.3 4.1 4.0 4.4 4.8 4.3 4.9 4.2 20.4
n 18 17 17 17 17 16 17 17 16 17 15
s, Stan Dev 0.800 0.752 1.105 1.144 1.095 1.115 0.529 0.946 0.243 0.941 10.15
Non-Users 221 responses
3.7 4.3 3.8 4.1 3.9 3.4 4.2 3.9 4.5 4.2 15.9
n 215 215 215 215 215 215 216 215 216 214 160
s, Stan Dev 1.182 1.011 1.221 0.998 1.119 1.386 1.129 1.152 0.784 0.986 13.93
sp, pooled Stan Dev 1.158 0.995 1.213 1.009 1.118 1.370 1.098 1.139 0.760 0.983 13.663
t, table 1.960 1.960 1.960 1.960 1.960 1.960 1.960 1.960 1.960 1.960 1.960
t, alculated (+/-) 2.763 1.955 1.739 -0.208 0.330 2.724 2.207 1.332 2.264 0.147 1.222 c
Do Non-User’s Responses Differ Significantly from Yes No No No No Yes Yes No Yes No No Current HE
Filter
Users?
Private Fleets 102 responses
3.8 4.4 4.0 4.1 3.9 3.6 4.1 4.0 4.5 4.2 12.1
n 96 97 97 97 96 96 97 97 97 96 68
Stan Dev 1.307 1.064 1.262 1.073 1.242 1.476 1.282 1.220 0.830 1.000 9.8
State Fleets 30 responses
3.4 3.7 3.2 4.0 3.8 3.2 4.3 3.8 4.3 3.8 23.7
n 28 28 28 28 28 28 28 28 28 28 18
s, Stan Dev 1.062 1.243 1.307 1.170 1.166 1.467 1.076 1.228 1.041 1.005 15.7
sp, pooled Stan Dev 1.257 1.106 1.272 1.095 1.225 1.474 1.240 1.222 0.881 1.001 11.229
t, table 1.960 1.960 1.960 1.960 1.960 1.960 1.960 1.960 1.960 1.960 1.960
t, c alculated (+/-) 1.571 2.769 2.897 0.155 0.339 1.344 -0.514 0.700 1.514 2.229 -3.880
Page 25
Contractor’s Report to CalRecycle 23
Do State Fleet’s Responses Differ
No Yes Yes No No No No No No Yes Yes
Significantly from Private Fleets?
All Other Fleets 232 responses
3.8 4.4 3.9 4.1 3.9 3.5 4.3 4.0 4.6 4.2 15.3
n 220 220 220 220 219 220 221 219 221 217 158
Stan Dev 1.196 0.955 1.200 1.003 1.107 1.370 1.105 1.121 0.753 0.968 13.148
State Fleets 30 responses
3.4 3.7 3.2 4.0 3.8 3.2 4.3 3.8 4.3 3.8 23.7
n 28 28 28 28 28 28 28 28 28 28 18
s, Stan Dev 1.062 1.243 1.307 1.170 1.166 1.467 1.076 1.228 1.041 1.005 15.7
sp, pooled Stan Dev 1.182 0.991 1.212 1.022 1.114 1.381 1.102 1.133 0.790 0.972 13.423
t, tab le 1.960 1.960 1.960 1.960 1.960 1.960 1.960 1.960 1.960 1.960 1.960
t, ca lculated (+/-) 1.912 3.378 2.773 0.248 0.551 1.122 0.056 0.883 1.878 2.295 -2.485
Do State Fleet’s Responses D
No Yes Yes No No No No No No Yes Yes
Significantlyiffer from All
Other Fleets?
Table 6. Statistical Comparison of Fleet Responses
Page 26
Contractor’s Report to CalRecycle 24
Focus Groups Following the mail-out and return of the fleet managers’ surveys, staff held focus group meetings
with state, local government, and private fleet managers. DTSC hired a consultant to conduct
meetings where survey results and barriers to HE filter adoption were discussed. Two focus
groups met in Sacramento on May 25, 2004; one in Daly City on June 21, 2004; one in Berkeley,
on June 23, 2004; and one in San Diego on June 28, 2004. The consultant then prepared a
summary report (Appendix 4).
DTSC presented the survey results to focus group participants and asked them about their
individual priorities. Similar to the fleet managers surveyed, most focus group participants were
unfamiliar with HE filters. These groups expressed more interest in initial costs and payback
periods than was found in the survey. Each group questioned the claimed cost savings; however,
that posture changed when the filters were displayed. Participants examined 13 HE filters and
evaluated a checklist of features. Handling the filters seemed to increase their interest. Filters and
manufacturers’ information packets became important tools in recruiting fleet manager
participation in the demonstration project.
Fleet Manager Survey Validation
To validate fleet manager survey results, focus group participants were shown the relative ranking
of various costs and benefits from all survey respondents. While survey respondents ranked
performance factors higher than cost factors, focus group participants felt that survey respondents
who were administrators considered cost more important while maintenance/service personnel
ranked performance factors higher.
Focus group participants felt that the most important performance factor was engine warranty
effects. Since engine lubrication failure is very rare, most participants did not put high importance
on decreasing engine wear. A city transit fleet manager who wanted to extend his vehicles’
engine life was the single exception to this. State fleet focus group members expressed
acceptance of a three-to-five year payback period on the initial investment — which was reported
to be half the vehicles’ life expectancy. Typically, local governments found one to three years as
the maximum acceptable payoff period. Interestingly, focus group members gave higher
importance to oil analysis, a measure of filter performance, than the survey results indicated.
Approximately half of focus group participants were experienced with oil analysis. Of these, a
majority used analysis for engine diagnostics rather than as a tool to extend drain intervals.
Measuring oil condition as part of an extended drain interval program was largely unknown to
focus groups. They stated a preference for using published or established minimum/maximum
limits to determine oil viability. The most important oil failure indicators were TBN and
viscosity, while the most relevant filter performance measure was metal detection. Focus group
participants expressed concern that HE filters decrease the oil analyses’ diagnostic value by
removing larger metal particles.
Filter Selection Exercise
Thirty participants completed a filter selection exercise where each filter model was scored on the
following criteria: (1) performance, (2) design and construction materials, (3) initial purchase and
ongoing service costs, (4) ease of oil sample collection and filter change services, and (5) filter
warranty.
Page 27
Contractor’s Report to CalRecycle 25
Of the 11 participants who preferred a particular filter, three chose puraDYN, four chose
OilGuard, and three chose Fleetguard. Filter warranty and engine warranty were among the top
concerns. Participants praised the puraDYN model for its original equipment manufacturer
(OEM) warranty letters stating that filter use would not in itself invalidate the engine warranty;
however, some participants thought the puraDYN’s 12-month filter warranty was too short. Initial
purchase and maintenance costs, including replacement filter element cost, were considered
among the most important selection criteria. The filter pore size was of secondary importance.
Based on puraDYN’s claims of broad material filtration capabilities, participants rated that filter
very favorably. Another notable selection criterion was the ease of filter element replacement and
the minimal potential for oil spillage during replacement.
Installation concerns included whether:
1. Enough engine compartment space is available for the HE filters.
2. HE filter installation locations can be removed from hot engine components.
3. Feed and drain line routing problems are present.
4. Installation equipment is included in the filter price.
Generally, participants preferred the simpler spin-on filters.
Barrier Identification
Major institutional and servicing barriers that the focus groups identified were: difficulties
tracking analyses for large fleets, overcoming skepticism among technicians, and installation and
maintenance issues. Several participants claimed HE filters required tracking analyses for
countless vehicles while others were troubled by substantial changes to fleet service schedules.
Some fleet managers reported mandates that their vehicles be regularly serviced. For example,
California law requires that school buses be inspected and serviced every 45 days or 3,000 miles.
Typically, a fleet operator schedules service events such as oil changes at multiples of 3,000
miles — perhaps changing oil every 6,000 or 9,000 miles regardless of oil condition.
Meanwhile, other organizations conduct oil changes as part of an overall regularly scheduled
service program. Focus group participants felt it difficult to change existing maintenance routines.
They predicted general skepticism among technicians who did not follow their regular oil change
intervals and left dirty-looking oil in the vehicles. Participants urged technician training to
overcome this barrier.
Cost barriers included: large investments in initial equipment purchase and installation, lack of
performance and cost-benefit data for making informed purchasing decisions, and oil analysis
labor costs. Participants saw a considerable challenge in persuading decision-makers to make HE
filter technology investments. They wanted credible, detailed cost/benefit data that could estimate
investment payback period. For those managers under budget constraints, purchase and
installation costs were significant barriers.
Overcoming the initial cost barrier is crucial. Focus groups suggested that vehicle manufacturers
include HE filters as OEM equipment, government agencies negotiate HE filter cost breaks, and
that fleets re-use surplus filters on subsequent vehicle purchases. Some participants believed that
oil analysis and its tracking would be more expensive and labor intensive than regularly
scheduled oil and filter changes. A successful HE filter demonstration accompanied by cost
recuperation could overcome this barrier.
Page 28
Contractor’s Report to CalRecycle 26
Warranty invalidation is one of the most significant barriers identified. While vehicles are under
warranty, many participants felt that exceeding recommended oil change intervals was too risky.
Suggested solutions included: installation of HE filters after vehicle warranties expire, HE filters
as OEM equipment, or engine manufacturers’ specifications for acceptable HE filter brands
and/or models while under engine warranty along with HE filter oil change interval
specifications. Alternatively, engine manufacturers would specify a range of standard oil tests and
limits. Within these established limits, extended oil drain intervals could then be used without
voiding the warranty.
Perceptual Barriers
The following perceptual barriers proved persuasive: (1) motor oil life extension would be risky,
(2) oil analysis labor costs would exceed money saved on fewer oil changes, and (3) HE filter
technology would not produce actual cost savings. Many participants also believed that source
reduction would be unnecessary if oil is recycled and re-refined. In terms of pollution prevention,
most participants were unclear about the difference between recycling and source reduction. They
believed that using re-refined oil that met new oil specifications was equivalent to source
reduction.
Several participants stated that since oil breaks down because of engine heat, it is too risky to
extend oil change intervals, even if the oil is clean. However, several agreed that acceptable oil
condition could be confirmed if the analysis showed the proper viscosity. Several participants felt
that oil analysis may require the vehicle to come out of service twice, once for sampling and then
possibly again if an oil change is recommended by the analysis. Potential savings were not
recognized because of perceived labor costs required for tracking oil analyses and filter element
disposal.
The focus groups identified the most significant barriers to widespread HE filter use as:
1. Initial cost.
2. Ongoing service and analysis costs.
3. Potential effect on the engine warranty.
Fleet managers wanted detailed cost-benefit information that demonstrates cost savings and
estimates the cost recuperation periods and potential performance. This would lessen concerns
about engine warranties and encourage HE filter use.
Focus Group Recommendations
Most fleet managers have not used oil analysis to determine oil condition. Training on proper
engine oil sampling and oil tracking would be necessary in convincing fleet managers of HE filter
safety.
The focus groups suggested that DTSC should use its influence with vehicle manufacturers and
gain OEM equipment status for HE filter technology. Such a designation would eliminate the
most prominent barriers to widespread HE technology adoption such as engine warranty issues,
initial cost justification, and installation costs. They also recommended a DTSC-prepared fact
sheet containing basic performance data that challenges misconceptions about oil analysis costs
and engine warranties.
DTSC could use testimonials from demonstration participants when promoting HE filter
technology. They would exemplify the oil change intervals achieved along with specific vehicle
Page 29
Contractor’s Report to CalRecycle 27
performance and cost-savings data. Endorsing well-known filter brand names may help develop
trust and familiarity in HE filter technology.
Advocating acceptable HE filter payback periods and source reduction superiority might compel
government fleet managers into seriously considering environmental benefits of the technology.
Demonstrating favorable cost recovery from HE filters could motivate private fleet managers. HE
filter technology might also be favored by managers seeking a “Green Fleet” certification or other
similar incentive/recognition.
Selection of Lab, Filters, and Fleets
Lab Selection In 2005, DTSC used the competitive bid process for contracting an independent oil analysis
laboratory. Appendix 5 shows the Statement of Work (SOW) for the lab. It defined test methods
to characterize oil and contaminants for an anticipated 1,200 samples to be collected over a 12-
month study period.
Oil samples would be collected from gas, diesel, and CNG vehicles. The bid was developed using
a weighting factor of the expected ratios among gas, diesel, and CNG vehicles. An expected 80
percent of the sampling was to be from diesel engines with the remaining 20 percent from gas and
CNG engines. Fleet operators collected and shipped samples in lab-provided packaging following
laboratory specifications that were consistent with standard practices and chain-of-custody
requirements. Each sample package was to be a standard 4-ounce, 38-mm thread-size sample
bottle, with a pre-printed bottle label, and pre-addressed, postage-paid shipping box.
During the competitive bid process, DTSC retained Herguth Laboratories (Vallejo, Calif.) as an
interim oil analysis laboratory. In April 2005, the lab contract was awarded to Penniman and
Brown (Baltimore, Md.). Subsequently, Penniman failed to meet the 48-hour turnaround
requirement specified in the SOW that protected vehicles from using “off-spec” oil. Consequently
after 20 Penniman-analyzed samples, DTSC directed all subsequent samples to Herguth
Laboratories.
Search for HE Oil Filters From August to November 2003, DTSC staff compiled a list of HE filter manufacturers. Staff
also assembled a collection of filters for possible selection and installation into State vehicles.
Internet searches, phone contacts to manufacturers, and fleet operators’ referrals supplemented
the manufacturer’s list. Ultimately, staff selected 24 HE filter manufacturers.
In December 2003, staff prepared and sent a 21-point questionnaire11 to the manufacturers about
their filters’ features. By April 2004, staff compiled 13 completed questionnaires that represented
three HE oil filter types: (1) remote mounted bypass, (2) centrifugal/bypass, and (3) combination
spin-on/bypass.
Bypass Filters
Table 7 lists the oil filter manufacturers’ information and performance claims. Manufacturers
returned questionnaires about all three types of filters, but the majority were for remote-mounted
bypass filters. The following manufacturers sent completed questionnaires: FiltaKleen, Filtration
Solutions, OilGuard, Oil Purification Systems, Perfect Filtration, Premo, and puraDYN. Amsoil
Page 30
Contractor’s Report to CalRecycle 28
and MotorGuard sent partially completed questionnaires. Centrifugal filters include Spinner II
and Vortex.
Fleetguard submitted information on both its centrifugal and a combination spin-on/bypass filter.
Luberfiner/Champion also offered a combination spin-on/bypass filter. Some producers provided
display or cutaway models for inspection. Several major manufacturers did not reply to the
inquiry, including Wix, Baldwin, and Donaldson. Filter specification sheets are located in
Appendix 6.
Cart-Type Filters
Staff also searched available “cart-type” filter designs. Some of the intended uses included:
hydraulic fluids, insulating oils, lubricating oils, and coolants. Several of the original 14 high
efficiency or bypass oil filter makers identified in 2008 also sell cart-type filters. Those include
Amsoil, Donaldson, Kleenoil, Triad, OilMiser, Parker, Triple R, Precision Filtration, and
Engineered Filtration. These are described in more detail in 2013 Literature Review in Appendix
2.
Passenger Car Filters Passenger cars and light trucks are a large portion of the vehicle market. They comprise the
majority of private vehicles in the state. An estimated 61 percent of all California vehicles are
passenger cars. Meanwhile, light-duty trucks account for 32 percent, with the remaining 7 percent
comprised of all medium and heavy-duty trucks. Potential oil savings could be substantial if a
suitable filter was found for passenger cars. However, in 2008, few HE oil filter designs claiming
to extend oil drain intervals existed for passenger car-sized vehicles. Since then, there appears to
be an increase in both the number of articles on extended oil drain intervals and the mileages that
can be achieved, even in passenger car applications. High efficiency and premium automotive
filters have potential for increasing oil drain intervals and should be recommended for testing in
passenger car fleets in future studies.
Before 2008, each filter manufacturer underwent substantial research by DTSC staff. This
included phone calls and website reviews of major auto supply stores. Staff found several high-
end, spin-on filters that contain synthetic media and reinforced structure. However, the Fram X2
Extended Guard, a traditional, spin-on, full-flow filter design, was the only filter located by
DTSC that claimed to extend oil change intervals. Its manufacturer claimed an extended 7,000
miles oil-and-filter change interval because of the reinforced, synthetic nylon fiber construction.
Its single pass efficiency is approximately 96 percent at 10-20 μm, slightly lower than the 98
percent attributed to other high-end, spin-on filters.
The major manufacturers (Champion, Fram, Purolator, and Wix) also produce most of the full-
flow filters that carry other brand names. Many of these “off-brands” are premium filters
designed for extra engine protection or heavy duty use. However, during filter selection, staff
learned these filters did not claim to extend oil drain intervals beyond the auto manufacturers’
recommendations.
Subsequently, some filter marketers (e.g., Mobil) now offer new products for extended change
intervals. Mobil’s filter claims a 15,000-mile extended oil change interval provided Mobil 1
Extended Performance synthetic oil is used. Although synthetic oils have shown growing promise
in extending oil changes, they were not part of this study.
Staff considered bypass filter testing on cars. These smaller-size bypass filters ranged in price
from $75 to $122, with filter elements costing from $10 to $15. Even the less expensive of these
Page 31
Contractor’s Report to CalRecycle 29
filters remained too costly to justify an automotive application. The Fram X2 Extended Guard
was the only auto-tested filter. Its particle removal efficiency is less than that achieved from
bypass filtration. However, marginal oil drain extensions could make a large impact since autos
generate a large amount of waste oil. By the end of the project, Mercedes-Benz, BMW, Honda,
and GM were using oil life sensors, and Ford extended its recommended oil change intervals by
50 percent, from 5,000 miles to 7,500 miles. 12 As noted, DTSC will recommend future
CalRecycle studies test oil sensors and both bypass and premium filters for extended change
intervals. The sensors are listed in Appendix 13 and will be included in the proposal, as will the
filters.
Reusable Filters
In 2008, staff considered one filter from Vortex that featured a cleanable and reusable screen.
This filter was not included in the study because it was not designed for extended oil drain
intervals.
The 2013 amended literature search found five additional reusable oil filters. The literature
review includes reusable filters, and is found in Appendix 2. Most reusable filters have aluminum
or stainless steel bodies and filter screen material. The additional filters include Pure Power,
System 1, K&N, K&P Engineering, and 37 Degree. Makers of reusable oil filters list their
environmental benefits, which includes reducing filter disposal costs. However, reusable filters
generate a large volume of cleaning wastes, and are probably most applicable to fleet
environments that have solvent and cleaning solution waste management programs already in
place. The cleaning solutions can often be recycled with the facility’s other liquid oily wastes.
One filter design holds a patent for cleaning with compressed air.
Matching Filters to Fleets Table 8 shows oil filter installations on vehicles belonging to state agencies and local
governments. Fleet managers attending the focus group sessions were good prospective partners
in the study, and helped determine the best match between specific filter designs and individual
vehicles. Staff purchased filters for 119 state and local government vehicles. Partnering agencies
installed the filters, collected periodic oil samples, and recorded all vehicle mileages and service
events.
Staff made extensive efforts to identify and locate state fleets interested in testing the HE filters.
They displayed various HE oil filters to interested agencies and then helped them match the filters
to their specific vehicles. Staff helped narrow the choices among various bypass filters available
and then the agencies made the final choice.
Filter Installation Chronology
Vehicle filter selection and installations began in 2005. Initially, some state fleet managers
resisted accepting the HE filters, stating that the filters required extra effort and disrupted routine
vehicle servicing schedules. However, after DTSC made presentations directly to their executive
staff and, with the assistance of a DTSC marketing specialist, demonstrated how HE oil filters
would specifically help their agencies, fleet managers were more receptive towards the filters.
The study’s first partner was the California Department of Corrections (CDC). From its fleet of
30 buses, CDC supplied 10 for HE filter installation. In the previous year, CDC had successfully
used a puraDYN filter in a single test bus. In February 2005, DTSC project staff finalized three
additional state agency agreements for HE filter installation.
Page 32
Contractor’s Report to CalRecycle 30
Table 7. Oil Filter Manufacturer Information and Performance Claims
Filter Manufacturer Filter Design Sump
Capacities (qts)
Pore Size (claimed)
Efficiency (claimed)
Warranty Filter
Cost ($) Element Cost ($)
Filtakleen, Sandy, UT Bypass w/Cellulose 8, 16, 48, 100 1 μm 66.7% @ 3 μm 2 yr 475 - 649 16- 38
http://www.filtakleen-usa.com/
Filtration Solutions, Olathe, KS Bypass w/Cotton
Less than 68, More than 68
2.78 μm 99% for > 3 μm 15 yr 489 - 589 24 http://www.fs2500.com/
Fleetguard Bypass w/Cellulose 5, 85 10 μm
60% @ 10 μm 98.7% @ 20 μm
5 yr 43 N/A http://www.cumminsfiltration.com
FRAM-X2 Ext. Guard, Perrysburg, OH Spin-on Full Flow w/Synthetic Fiber
(car) N/A 94% @ 20 μm N/A 8 N/A http://www.fram.com/
Gulf Coast / Motor Guard, Gulfport, MS Bypass w/Cellulose 6, 12 0.1 μm N/A 5 yr 150 - 200 1
www.bypassfilter.com
KleenOil, Leeds, U.K. Bypass w/Cellulose 6, 16,44,172 1 μm ISO 14/9 Lifetime 329 - 799 22-75
http://www.kleenoilusa.com/
Luberfiner- ZGard, Albion, IL
http://www.luberfiner.com/
Spin-On Bypass w/ Zinc-Coated
Cellulose 16 - 60 2 μm 75% @ 10 μm Lifetime 81 35
OilGuard, Oceanside, CA Bypass, Cotton 8, 20,60 1 μm 98.3%@ 10 μm Lifetime 170 - 220 15- 17
http://www.oilguard.com/
Oil Purification Systems Bypass, Melamine
Resin 60 3 μm N/A 10 yr 445 8- 9 Tampa, FL
http://www.oilpursys.com/
Perfect Filtration, Jacksonville, FL Bypass, Cellulose 12, 20, 32, 56 1 μm 98.91% @ 3 μm 1 yr 355 - 462 36- 64
www.controlmastersinc.com
Premo , Tampa, FL Bypass, Heated, Synthetic
12, 20, 32, 60 3 μm 99.50% @ 3 μm 1 yr 325 - 525 12-35 http://www.premolube.com
puraDYN, Boynton Beach, FL Bypass, Heated, Cotton
8, 12, 32, 40, 60
1 μm N/A 1 yr 258 - 443 17- 34 http://www.puraDYN.com
Spinner II Centrifugal 40 - 100 N/A N/A 7 yr 425 - 450 N/A
http://www.spinnerII.com
Vortex Centrifugal, Steel Screen
44,100 N/A N/A 5 yr 300 - 375 N/A [email protected]
Page 33
Contractor’s Report to CalRecycle 31
Staff showed the fleet managers and mechanics a variety of appropriate HE oil filters for their
specific vehicles. Fleet managers from participating state and local agencies, along with survey
respondents, then made the final filter selections. Most fleet managers performed the filter
installations in-house, in order to become familiar with the technology. Some fleets used
contractors because they did not have their own mechanics. Technical representatives from the
filter manufacturers assisted with installations and provided onsite support.
Despite having the appropriately sized large vehicles, several state agencies declined to
participate in the study. Therefore, DSTC staff expanded the candidate search to include local
government fleets. From this, Long Beach Unified School District (LBUSD) and Fresno Unified
School Districts (FUSD) agreed to test Luberfiner ZGard filters on 20 and 14 buses, respectively.
Then, CDC agreed to equip 15 additional vans with OilGuard filters. This brand was also chosen
for 14 CAL FIRE trucks. By summer 2005, staff had identified nearly 100 vehicles for filter
installation. Later that year, LBUSD added four more buses, bringing the total vehicle count to
103. DTSC delivered the filters in November 2005.
By the end of 2005, two UC Davis (UCD) trucks, five Caltrans trucks, and one DGS transport
truck had been added to the study. In addition, 20 DGS and three UCD13 cars installed extended-
use, full-flow filters.
Part-ordering problems delayed filter installations on CDC vehicles and school buses. CDC buses
required additional structural bracing to accommodate larger HE filters, while CDC vans needed
an improved drain plug design. LBUSD and FUSD mechanics worked with DSTC staff and
identified a detailed school bus parts inventory that was bought and delivered between January
and April 2006.
In late 2006, three LBUSD buses, and 10 Fresno Area Express (FAX) transit buses joined the
study. Initially, UCD planned installation of HE filters on five vehicles, but failed to do so
because DGS assumed their servicing. Furthermore, CAL FIRE did not install filters on all of the
vehicles they had originally planned. Nonetheless, the final vehicles participating totaled 119,
excluding 30 control vehicles from DGS and FAX.
Filter Testing
The filters were tested both under controlled laboratory conditions and in actual operating fleets.
DTSC chose Southwest Research Institute (SwRI) to independently verify filter manufacturers
efficiency and capacity claims. SwRI also tested additive package depletion and water removal in
several filters. Appendix 7 contains the SwRI Report. Fleet managers ran the demonstrations and
were responsible for all sample collection, mileage recording, and filter servicing. Periodic oil
analysis assured the continued oil usability and helped determine new oil drain intervals.
Page 34
Contractor’s Report to CalRecycle 32
Table 8. Oil Filter Installations
Number and Vehicle and Engine Sump
Fleet Engine Type Oil Type and Grade Filter Brand and Model Type Capacity
Mobil Drive Clean SAE 10W-30 California Valvoline All Fleet Plus and Premium Blue SAE 15W-40
11 MCI Coach 102 Buses Detroit Diesel 671 39 puraDYN TF 40 Department of Chevron Lubricating Oil SAE 10W-30
Corrections Texaco Havoline Formula SAE 10W-30 (CDC)
15 GM and Ford Vans Gasoline GM V8, Ford V10 15 Chevron Supreme Motor Oil SAE 5W-30 OilGuard EPS 20
Conoco Phillips 76 Firebird LD SAE 10W-30 (re-refined Department of 20 Chevy Cavaliers Gasoline 4-cylinder 4 Fram X2 Extended Guard
oil) General Services
(DGS) 20 Chevy Cavaliers Gasoline 4-cylinder 4 “ ” Standard
5 1985-1997 17-Passenger Crew International Harvester Conoco Phillips 76 Guardol QLT SAE 15W-40 44 OilGuard EPS 60
Carrying Vehicles 1954, 4700, 4900 Chevron Delo 400 Multigrade SAE 15W-40
2 1999 Dodge BE 1500 ½ ton PU Gasoline V8 6 “ ” OilGuard EPS 20
1992 GMC C7H042 16’ Stakeside Diesel 12 “ ” OilGuard EPS 60
1995 GMC K3500 BDSU 1Ton UB Diesel 6 “ ” OilGuard EPS 20
California 1991 GMC K2500 ¾ Ton 4WD PU Gasoline 6 “ ” OilGuard EPS 20
Department of 1988 Ford LT9000 Transport Diesel 44 “ ” OilGuard EPS 60 Forestry and Fire 1995 International F2574 Transport Detroit Diesel 350 “ ” OilGuard EPS 60 Protection (CAL
1993 GMC K3599 Dozer Tender Diesel “ ” OilGuard EPS 60 FIRE) 2002 GMC Sierra 1500 ½ Ton PU Gasoline V8 6 “ ” OilGuard EPS 20
1999 Dodge BE 1500 ½ Ton 4WD PU Gasoline V8 6 “ ” OilGuard EPS 20
Dodge Ram 2500 ¾ Ton 2WD PU Gasoline V8 6 “ ” OilGuard EPS 20
2002 Dodge Ram 1500 ½Ton PU Gasoline V8 6 “ ” OilGuard EPS 20
2005 Ford F350 ¾ Ton PU Gasoline V10 8 “ ” OilGuard EPS 20
2000 Freightliner FC70 Conoco Phillips 76 Guardol QLT SAE 15W-40 Cummins IBS 20 OilGuard EPS 60
Herbicide Spray Truck Chevron Multigrade SAE 15W-40 California 1999 Navistar 4900
Caterpillar 3126 22-26 “ ” OilGuard EPS 60 Department of Safety Rail Repair Transportation 2003 International Harvester 9400 Cummins N14 44 “ ” OilGuard EPS 60
(Caltrans) 2001 Freightliner FL70 Caterpillar 3126 18-20 “ ” OilGuard EPS 60
1996 International Harvester 4900 Detroit Diesel 466 22-26 “ ” OilGuard EPS 60
Fresno Unified Detroit Diesel 671, 6V92,
School District 14 Crown Coach Buses 39 Chevron Heavy Duty Motor Oil SAE 15W-40 Luberfiner ZGard LFP9750 Cummins 855
(FUSD)
Long Beach Unified School 26 Crown Coach Buses Detroit Diesel 671 32 Rosemead Soar SAE 15W-40 (re-refined oil) Luberfiner ZGard LFP9750
District (LBUSD)
Fresno Area 10 Orion CNG Buses Detroit Diesel 50 CNG 32 CITGARD CNG SAE 15W-40 OilGuard EPS 60
Express (FAX)
Page 35
Contractor’s Report to CalRecycle 33
Sample Quality Assurance and Quality Control Periodically, staff collected quality assurance and quality control (QA/QC) samples. Figure 2
shows a sample being collected from a typical passenger vehicle. Fifteen QA/QC samples were
collected in sets of three replicate samples from five different vehicles. Each three-sample
replicate set was analyzed without Herguth knowing that they were from the same vehicle. To
give a “true” or accepted value for each parameter, the values from each replicate set were
averaged. Then, the individual replicate measurements were compared to these averages. The
differences are reported as percentages of the average set equal to 100 percent. This method
normalizes the data, and yields the precision of the laboratory’s analytical technique. It also
establishes confidence intervals for the techniques and determines the expected statistical
variations for subsequent analyses.
Figure 2. Sample Collection from a Typical Passenger Vehicle
Relative standard deviations for the QA/QC samples are found in Table 9. Herguth showed
acceptable control in all their analytical methods, producing 95 percent confidence intervals
ranging from 0.81 percent to 9.76 percent. Subsequent analyses can be expected to have values
within the lower and upper confidence limits at least 95 percent of the time.
For example, Table 9 indicates that the TBN test could reliably be within 2.74 percent of the
accepted value. As a simple titration, the TBN test — a traditional and more variable “wet
chemistry” technique — was expected to show a larger confidence interval. However, Herguth
Laboratories uses an automated titration system, which improves the analytical reproducibility.
Page 36
Contractor’s Report to CalRecycle 34
Table 9. Relative Standard Deviation for QA/QC Samples
Parameter Minimum
(%)
95.14
Maximum (%)
Relative Standard
Deviation (%)
95% Confidence Interval (+/-)
Lower Limit (%)
Upper Limit (%)
Viscosity 102.43 1.598 0.808 99.19 100.81
TBN
88.39 111.19 5.42 2.74 97.26 102.74
FTIR
Oxidation 94.29 102.86 1.870 0.947 99.05 100.95
Water 100.00 100.00 0.000 --- 100.00 100.00
Sulfination 96.00 108.00 3.239 1.639 98.36 101.64
Fuel 100.00 100.00 0.000 --- 100.00 100.00
Glycol 100.00 100.00 0.000 --- 100.00 100.00
Metals
Iron 93.75 106.45 2.940 1.488 98.51 101.49
Aluminum 100.00 100.00 0.000 --- 100.00 100.00
Chromium 100.00 100.00 0.000 --- 100.00 100.00
Copper 75.00 150.00 19.289 9.761 90.24 109.76
Lead 81.82 128.57 11.543 5.841 94.16 105.84
Tin 100.00 100.00 0.000 --- 100.00 100.00
Nickel 100.00 100.00 0.000 --- 100.00 100.00
Silver 92.31 115.38 5.036 2.548 97.45 102.55
Antimony 100.00 100.00 0.000 --- 100.00 100.00
Silicon 97.67 104.65 1.834 0.928 99.07 100.93
Sodium 96.94 104.80 1.827 0.925 99.08 100.92
Boron 93.70 110.03 3.763 1.904 98.10 101.90
Zinc 92.10 115.14 6.677 3.379 96.62 103.38
Phosphorus 92.19 115.37 6.729 3.405 96.59 103.41
Calcium 93.83 111.81 5.205 2.634 97.37 102.63
Magnesium 93.75 112.50 4.749 2.403 97.60 102.40
Barium 100.00 100.00 0.000 --- 100.00 100.00
Molybdenum 95.69 108.19 3.401 1.721 98.28 101.72
Potassium 88.89 111.11 5.261 2.662 97.34 102.66
Minimum 75.00 --- 0.00 0.81 90.24 ---
Maximum --- 150.00 19.29 9.76 --- 109.76
Overall Analytical 94.67 108.40 3.48 2.69 98.24 101.76 Average
Page 37
Contractor’s Report to CalRecycle 35
Overall, the average confidence interval for the entire suite of chemical analyses was 2.69 percent
and the QA/QC sample results were acceptable in every case. Table 9 shows the analysis for
copper as the worst case, with a 95 percent confidence interval of 9.76 percent. Therefore,
Herguth would be expected to produce a subsequent analytical copper result within about 10
percent of the expected value. Results for viscosity, TBN, iron, and lead analyses were found to
have 95 percent confidence intervals within six percent or less.
Southwest Research Institute Filter Testing Southwest Research Institute (San Antonio, Tex.) examined filters for soot removal efficiency,
and for dust removal capacity. SwRI tested additive package depletion in filters designed to resist
acid buildup, and measured water removal in filters featuring a heated element.
Table 10 shows filter testing results for soot removal. To compare soot removal efficiencies,
SwRI tested the bypass filters using method ISO/DIS 23556 Performance Test Method for Diesel
Engine Soot Removal Devices14 with Mitsubishi DIA Soot Contaminant. The soot removal test is
used only for by-pass filters, and thus was not applicable to standard full-flow filters or the Fram
X2. The soot had an average particle size of 200 nanometers and was suspended in CI-4 grade
15W-40 test oil.
SwRI found the average soot removal efficiency for the group was 13.1 percent, with a range of
8.5 to 23.3 percent. This indicates an overstatement in the manufacturer’s claims about their
filter’s soot removing ability. Overall, the puraDYN PFT 40 design led the group in soot removal
efficiency.
Table 10. Filter Testing Results for Soot Removal
Filter Model Soot Removal Efficiency, wt %
puraDYN PFT 40 10.3
OilGuard EPS 60 10.5
Luberfiner ZGard LFP9750 13.5
Premo Plus 11.3
puraDYN PFT 40 with acid 18.6
Luberfiner ZGard LFP9750 with acid 8.8
puraDYN PFT 40 with water 23.3
Premo Plus with water 8.5
Page 38
Contractor’s Report to CalRecycle 36
Table 11 shows the SWRI test results for dust removal capacity. SwRI used method ISO 4548-12
Full-Flow Oil Filter Test15 to determine the filter’s ability to retain contaminants like dust. This
method challenged each filter with ISO 12103-1 A3 medium test dust. Particle count data for the
test began at 4 m. For larger sized particles, both the OilGuard EPS 60 and Luberfiner ZGard
LFP 9750 models showed superior retention of the test dust.
Table 11. Filter Testing Results for Dust Removal Capacity
Filter Model Retained Capacity (Dust), grams
puraDYN PFT 40 4.27
OilGuard EPS 60 33.6016
Luberfiner ZGard LFP 9750 37.3117
Premo Plus 2.23
Fram X2 Extended 5.86
Water Removal Using Heated Elements
Both puraDYN and Premo Plus systems have a heated element for water removal. An operating
engine’s oil temperature is greater than boiling water; therefore, any water should evaporate
without a heated element. However to verify the manufacturers’ claims, water was added to the
oil test sump. Evaluations proved inconclusive because the oil temperature was already 105°C
and the water may have evaporated before exposure to the heated element.
Reducing the Rate of Additive Package Depletion
Two filter manufacturers claimed that their product reduced oil additive package depletion. The
puraDYN filter uses an encapsulated, time-released additive to maintain the TBN. The Luberfiner
ZGard filter has a zinc liner that reacts with acids and water and forms solids that can then be
filtered out.
In the Luberfiner ZGard system, zinc undergoes the following reactions:
Acids are formed during the combustion process:
SO2 + H2O → H2SO3
2 H2SO3 + O2 → 2 H2SO4 (sulfuric acid)
Zinc is available in the ZGard filter and undergoes the following reactions:
H2SO4 + Zn → ZnSO4 + H2
ZnSO4 + xH2O → ZnSO4·xH2O
Figure 3 shows the test results of oil additive package depletion. SwRI evaluated the puraDYN
and Luberfiner ZGard filters using a modified ISO/DIS 23556 method that introduced an acid
cocktail simulating oil acid buildup. The acid cocktail represented combustion byproducts
comprised of sulfuric acid, nitric acid, and acetic acid. Portions of the acid cocktail were added
every four hours throughout the 48-hour test. Both filtration systems aided in neutralizing acid
and extending the TBN.
Page 39
Contractor’s Report to CalRecycle 37
Figure 3. Results for the Oil Additive Package Depletion Evaluations
0 10 20 40 50 60
30
puraDYN
ZGard
5
10
11
Time, Hours
ISO/DIS 23556 with Acid Concentration
8
9
7
6
TB
N, m
g K
OH
/g
Fleet Demonstrations Staff provided equipment and technical support for filter installations and operations. They
ordered the filters, sampling valves, and sampling equipment for the fleets. During fleet
demonstrations and oil samplings, staff collected results, logged them into a database, and
consulted with fleet managers about the analyses. For fleet managers’ convenience, staff labeled
and packaged sampling bottles into return mailers. Staff received lab reports electronically and
promptly faxed results to managers enabling quick responses to lab recommendations. Staff then
entered results into database and project files.
State and Local Fleets By May 2006, 150 sample results were received. By August 2006, more than 250 samples were
recorded. By April 2007, the database had surpassed 500 analyses. Using database queries, staff
was able to evaluate vehicle mileages, costs, and reductions in waste oil generation. Appendix 8
shows fleet mileage and analytical result tables. Appendix 9 is the sample results database.
Appendix 10 presents original laboratory reports.
Department of General Services
Since most manufacturers do not offer bypass designs in a size and at a price that would be
appropriate for use in smaller vehicles, locating a suitable passenger car filter was difficult.
During the selection process the Fram X2 was the only filter identified that claimed to provide
extended oil change intervals. The Fram X2 design includes a glass fiber element and a sturdy
body. It claimed adequate filtering protection to 7,000 miles.
Page 40
Contractor’s Report to CalRecycle 38
DGS installed Fram Extra Guard X2 filters on 20 Chevrolet Cavalier cars. DGS subsequently
added 20 additional vehicles to be used as controls. These were equipped with standard CarQuest
filters. DGS vehicles had an average annual mileage of 19,971 miles, and accumulated 798,000
miles during the test period.
Figure 4 shows TBN and viscosity vs. mileage for DGS vehicles. The normal trends found with
increasing oil mileage are evident, even though the TBN data showed wide scattering. Typically,
viscosity increases when dirt and contaminants accumulate, and TBN decreases as combustion
products are formed and the oils' initial neutralizing capacity is depleted. Apparently, some
variation was caused by differences in the mechanical performance of individual vehicles.
Figure 4. Plot of TBN and Viscosity vs. Mileage for DGS vehicles
Plot of TBN and Viscosity vs. Oil Mileage
Department of General Services
Combined Data from CarQuest and Fram Filters
0
2
4
6
8
10
12
14
0 5,000 10,000 15,000 20,000 25,000 30,000
Miles
TB
N, m
g K
OH
/g
0
2
4
6
8
10
12
14
Vis
co
sit
y, c
St
@ 1
00
C
Viscosity
TBN
Estimated TBN at
proposed drain interval
of 10,000 miles
Many DGS samples had to be rejected because of sampling errors. Of 187 DGS samples
reviewed, staff determined 54 were collected after, rather than before, the oil was changed. These
samples showed initial starting TBN values lower than expected for fresh oil, indicating that a
complete oil drain was not accomplished. These samples, therefore, were of little value in
determining the rate of TBN depletion or estimating the maximum oil drain interval, and were
disregarded. Eight additional samples showed TBN values of 0.1, which is the detection limit for
the analysis, and so were also disregarded. No differences could be ascertained between the Fram
X2 and the standard Car Quest filters performance. Therefore, the data from both filters was
combined.
The buffering capacity (TBN) appeared to fail before other oil parameters, and was identified as
the limiting factor for extending drain intervals in these vehicles. The previous DGS oil change
interval was 6,000 miles. Based on TBN values, the analysis showed the oil to be acceptable up to
approximately 10,000 miles. The averaged fleet results suggest that the iron concentration would
be about 13 ppm at 10,000 miles, and Herguth Laboratories recommended a maximum iron
concentration of 23 ppm for these vehicles. The highest iron concentration was 83 ppm, but was
recorded on a vehicle that had traveled 24,100 miles before an oil change. For the DGS vehicles,
Page 41
Contractor’s Report to CalRecycle 39
both nitration and oxidation would be predicted to remain below the recommended maximum of
30 units at 10,000 miles. Averaged fleet results suggest that at 10,000 miles the nitration would
be less than 25 and the oxidation would be approximately 16. Even beyond 20,000 miles,
additional parameters such as viscosity and other wear metals appeared to remain in the
acceptable range.
California Department of Forestry and Fire Protection
The Department of Forestry and Fire Protection (CAL FIRE) received OilGuard filters for
installation on 18 trucks. CAL FIRE fleet managers expressed concern about operating their fleets
on two different schedules: those with the filters, and those without. CAL FIRE also faces the
unique problem that its vehicles are frequently called away from their home base and regular
maintenance personnel. While on duty, the vehicles may be serviced by mechanics or contractors
who are unaware of the modified oil change intervals. Additionally, the vehicles typically
undergo a full maintenance service event, including an oil change, upon returning to their home
base.
Figure 5 shows a CAL FIRE Crew Carrying Vehicle. CAL FIRE’s vehicles traveled an average
of 16,873 miles during the study, with a total of 134,980 miles. CAL FIRE’s vehicles travel an
average of 13,110 miles annually.
Figure 5. CAL FIRE Crew Carrying Vehicle Fitted With an OilGuard HE Oil Filter
Figure 6 shows the TBN and viscosity vs. mileage results for CAL FIRE vehicles. The original
oil change interval was 5,000 miles. With the HE filters, the oil appears to remain acceptable
beyond 18,000 miles. Wear metal accumulation showed that about 75 ppm of iron would be
expected at an oil change interval of 18,000 miles; Herguth recommended maximum levels of 75-
150 ppm for these vehicles. CAL FIRE vehicles featured both gasoline and diesel powered
engines. Measures of oil degradation such as nitration, sulfination, and oxidation all showed a
high degree of variability, and could not be used to predict an optimal oil change interval.
Page 42
Contractor’s Report to CalRecycle 40
Service vehicles operating off-road would be expected to encounter additional oil contaminants.
These could include dirt and dust, represented in the analysis by a viscosity increase, and by
elevated silica and sodium levels. Figure 6 indicates that the filters appeared to maintain adequate
control of viscosity levels throughout the study’s course. Silica and sodium were not noted as
problems in these vehicles, but should be monitored in any fleet that operates under these off-road
conditions.
Figure 6. Plot of TBN and Viscosity vs. Mileage for CAL FIRE vehicles
Plot of TBN and Viscosity vs. Oil MileageCalifornia Department of Forestry and Fire Protection
Viscosity
TBN
0
2
4
6
8
10
12
14
16
18
0 5,000 10,000 15,000 20,000 25,000 30,000 35,000
Miles
TB
N,
mg
KO
H/g
0
2
4
6
8
10
12
14
16
18
Vis
co
sit
y,
cS
t @
100 C
Proposed drain interval
at 18,000 miles
Department of Transportation
Figure 7 shows a typical HE oil filter installation on a Department of Transportation (Caltrans)
service truck. Caltrans installed HE filters on five heavy-duty diesel-engine trucks. Caltrans
vehicles included models with both Cummings and Detroit Diesel engines on International
Harvester and Freightliner trucks. All were fitted with OilGuard EPS 60 filters. Caltrans vehicles
traveled 160,711 miles during the study, and with the HE filters were able to extend their drain
interval from 6,000 to 10,626 miles. One vehicle traveled 28,933 miles with acceptable oil
parameters.
The maximum iron level recorded was 38 ppm on a vehicle with just 8,214 miles on the oil.
Based on the fleet average, the expected iron concentration should be approximately 25 ppm at
18,000 miles. The maximum oxidation and sulfination levels recorded were 16 and 11 units,
respectively, well below the recommended 30-unit maximums.
Page 43
Contractor’s Report to CalRecycle 41
Figure 7. Caltrans Truck with HE Oil Filter
Fresno Area Express
Fresno Area Express (FAX) installed HE filters on 10 of its compressed natural gas (CNG) buses.
The FAX buses were added in late 2006, in the project’s later phases. FAX sampled the buses
frequently, so by April 2007 six or more samples had been collected from each. FAX also began
sampling 11 “control” buses with standard filters in early 2007. FAX buses average 46,461 miles
annually, and accumulated 179,099 miles during the course of the study.
Using HEPO (formerly OilGuard) HE oil filters, the FAX buses achieved a substantial increase
from 6,000 miles to an average of 17,900 miles. In the best case, the oil analysis showed the oil
condition to still be acceptable at nearly 20,000 miles. They will probably use twice their original
oil change interval, or 12,000 miles, upon full adoption of the technology in the fleet. The FAX
fleet manager considers TBN to be the main indicator of oil condition.
TBN, viscosity, oxidation, nitration, and wear metals were considered to establish maximum oil
drain intervals for the FAX fleet. Because of the oil used in CNG engines, the initial TBN is
lower than that found in other fleets. Fresh CNG oil has an initial value of 5.3. Still, the resulting
TBN values appeared to be satisfactory during the course of the sampling. TBN values appeared
to be stable, and generally remained above 2.0. Viscosity was also steady, but at a level that was
somewhat lower than recommended. The average viscosity was 11.0, whereas the recommended
minimum value is 12.0. Figure 8 shows a plot of TBN and viscosity vs. mileage for the FAX
fleet.
Page 44
Contractor’s Report to CalRecycle 42
Figure 8. Plot of TBN and Viscosity vs. Mileage for FAX vehicles
Plot of TBN and Viscosity vs. Oil MileageFresno Area Express
0
2
4
6
8
10
12
14
16
18
0 5,000 10,000 15,000 20,000 25,000
Miles
TB
N,
mg
KO
H/g
0
2
4
6
8
10
12
14
16
18
Vis
co
sit
y,
cS
T @
100 C
TBN
Viscosity
Proposed drain interval
at 18,000 miles
The Fresno Unified School District (FUSD) installed Luberfiner LPF9750 ZGard filters on 13
school buses. The buses traveled 116,618 miles with the HE oil filters during the study period,
with an average annual mileage of 17,840 miles. The vehicles achieved an average of nearly
13,000 miles between oil changes compared to a previous change interval of 9,000 miles. In the
best case, a bus went almost 30,000 miles. Viscosity and TBN changed little over time in these
study vehicles.
Staff evaluated TBN, viscosity, and oil degradation (as measured by oxidation and sulfination), to
determine the oil change interval for the FUSD fleet. Because of the zinc featured in the ZGard
design, the TBN was maintained at an acceptable level during the test. No FUSD samples failed
due to low TBN values. All samples had TBN values above 6.0, close to the initial value of the
fresh oil, and well above the minimum level. Because this filter design appears to maintain the
TBN satisfactorily, another oil parameter should be used to determine the maximum oil change
interval.
In such cases staff considered oxidation and sulfination to identify degraded oil. However, as with
TBN, staff found no unacceptable oxidation or sulfination results during the test, so these
parameters also could not be used to predict the maximum oil change interval.
In addition, viscosity was maintained at acceptable levels during the test period, and also could
not be used to predict a maximum interval. Thus none of the normal indicators, TBN, viscosity,
oxidation and sulfination, were limiting factors for this filter or this fleet, when operating under
these conditions. The fleet manager reports that he is satisfied with the performance of the filters,
and feels that he can safely double his current change interval with these filters. Figure 9 shows a
plot of TBN and viscosity vs. mileage for the FUSD vehicles.
Fresno Unified School District
Page 45
Contractor’s Report to CalRecycle 43
Figure 9. Plot of TBN and Viscosity vs. Mileage for FUSD vehicles
Plot of TBN and Viscosity vs. Oil MileageFresno Unified School District
0
2
4
6
8
10
12
14
16
18
0 5,000 10,000 15,000 20,000 25,000 30,000 35,000
Miles
TB
N,
mg
KO
H/g
0
2
4
6
8
10
12
14
16
18
Vis
co
sit
y,
cS
t @
100 C
Viscosity
TBN
Proposed drain interval
at 36,000 miles
The Long Beach Unified School District (LBUSD) installed Luberfiner ZGard filters on 26 of its
diesel-engine school buses. The first five filters were installed in 2005, an additional 16 in 2006,
and the remainder in 2007. The LBUSD fleet averages 13,530 miles annually, and accumulated
505,115 miles during the test period. The previous oil change interval was 9,000 miles. During
the study, the average drain interval achieved with the HE filters was 16,033 miles. In most cases,
oil analysis showed the oil was still usable at 18,000 miles. Iron concentrations appear to be
higher in these vehicles, although 95 percent of the readings were less than 150 ppm at 18,000
miles.
Like the FUSD school buses, LBUSD had similar results with their ZGard filters. The extended
mileages achieved could be partially due to zinc in the filter. As with the FUSD fleet, TBN did
not diminish quickly enough in the LBUSD fleet to be useful in establishing a maximum change
interval. Also, neither oxidation nor sulfination reached maximum levels during the test period.
Wear metals for this fleet appeared to be higher initially than with other similar fleets. This could
be due to the year or make of the vehicles, or the past maintenance history of the vehicles, but is
probably not due to the relative age of the vehicles. FUSD buses had lower iron levels, and an
average fleet age of 336,352 miles, while LBUSD buses had higher iron levels, with an average
fleet age of 316,404 miles.
California Department of Corrections
The California Department of Corrections (CDC) installed puraDYN filters on 10 of its diesel-
engine buses, and provided additional oil samples and mileage information from another existing
puraDYN installation. CDC also added OilGuard HE filters to 15 of its GMC gasoline-powered
vans. However, six vans had chronically excessive levels of potassium and sodium. Coolant leaks
were identified by lab reports and articles on oil analysis as the likely source. The CDC contract
Long Beach School District
Page 46
Contractor’s Report to CalRecycle 44
mechanic and Herguth Laboratories technical staff both said that high-mileage GMC V8s are
prone to coolant seepage due to poor engine design, coupled with high mileages on the vehicles.
In May 2006, CDC replaced the GMC vans with Ford V10s. Figure 10 shows typical buses from
the CDC fleet.
Figure 10. Department of Corrections Buses
Figure 11 shows a plot of TBN vs. mileage for the CDC buses. The TBN line represents the
average for all the CDC buses, which accumulated 949,649 miles with puraDYN filters during
the study. The data identifies trends that could be used to establish new oil change intervals.
Analytical labs typically use physical and chemical parameters, and wear metals, to determine the
maximum oil change interval. Figure 11 shows that few CDC buses experienced TBN levels
below 2.0, and then only after greatly extended mileages. This effect is presumably due to the
additive package in the puraDYN system. CDC uses a variety of oils because their vehicles are
serviced in multiple contract locations.
In several instances buses achieved change intervals greater than 50,000 miles, and one achieved
a drain interval of 79,777 miles. However, due to inadvertent oil changes that were not based on
oil condition, the average oil change interval was just 23,162 miles. No vehicles showed high
levels of wear metals during the test period. The highest iron concentration recorded was 77 ppm
with 38,481 miles on the oil. Herguth and other laboratories recommend maximum iron
concentrations of 75-150 ppm. TBN appeared to be the oil parameter that would reach a
minimum value first, and would therefore be the parameter that new oil change intervals would
be based upon. The puraDYN filters appear to address acid formation adequately on these
vehicles. This results in acceptable TBN values to 50,000 miles and beyond. Based on the
averaged results, the iron concentration should be approximately 50 ppm after 50,000 miles.
Maximum values for oxidation and sulfination were 27 and 26, respectively, safely below the
recommended maximum of 30.
During the study period, the vans accumulated 213,290 miles but were unable to achieve the
higher drain intervals seen in the buses. For the vans, the average drain interval was 10,157,
although the highest recorded oil drain interval was 44,721 miles.
Page 47
Contractor’s Report to CalRecycle 45
Figure 11. Plot of TBN vs. Mileage for CDC buses
Plot of TBN and Viscosity vs. Oil MileageCalifornia Department of Corrections
TBN
Viscosity
0
2
4
6
8
10
12
14
16
18
0 20,000 40,000 60,000 80,000 100,000
Miles
TB
N, m
g K
OH
/g
0
2
4
6
8
10
12
14
16
18
Vis
co
sit
y, c
St
@ 1
00
C
Estimated TBN at
proposed drain interval
of 50,000 miles
Staff prepared and sent post-demonstration surveys to all participating fleet managers. These
surveys included cost/benefit questions and collected managers’ opinions and overall experiences
about HE filter usage (Appendix 11). Staff sent the post-demonstration survey to 14 participating
fleet managers, and six managers responded. Table 12 summarizes the fleet managers’ responses.
While some managers repeated the same concerns as those of focus groups, cost was never the
main issue with either current or past filter users. Disruption of maintenance schedules, filter
servicing, and oil analysis costs continued to be main concerns. However, fleet managers rated
“Increasing the Time Between Oil Changes” as the most important benefit.
Table 12. Fleet Manager Post-Demonstration Survey Opinions
Fleet Manager’s Post-Demonstration Survey
Benefits from Using High Efficiency Oil Filters Average response
Average of fleet manager responses from 1 to 3, with 1 being most important
Reducing oil purchases 2
Decreasing waste generation 1.8
Increasing the time between oil changes 1.2
Costs Associated with High Efficiency Oil Filters Average response
Average of fleet manager responses from 1 to 5, with 5 being most important
Cost for purchase and installation 2.6
Time for servicing filter 3.2
Cost for oil analysis 3.2
Disruption of maintenance schedules 3.2
Time for sampling oil 3
Table 13 shows fleet managers’ post-demonstration experiences. Of the fleet managers surveyed,
half felt that the technology’s performance and reliability had been satisfactory; however, only
one manager planned to continue using HE filters. Half of the fleet managers planned to use oil
Page 48
Contractor’s Report to CalRecycle 46
sampling and analysis for determining new drain intervals. The continued problematic themes of
logistics, maintenance schedules and recordkeeping were recurrently noted in conversations and
in both pre- and post-demonstration surveys. However, the majority of fleet managers reported an
overall positive experience from their participation in the study.
Table 13. Fleet Manager Survey of Demonstration Experiences
Experiences using High Efficiency Oil Filters Number Total of 6 respondents out of 14 managers surveyed answering “yes”
Do you plan to increase oil drain intervals by using HE oil filters? 1
Do you plan to use oil sampling and analysis to establish new drain intervals? 3
Are you satisfied with the performance and reliability of HE oil filters? 3
Do you feel that potential effects on engine warranty have been addressed adequately? 2
Do you feel that using HE oil filters has helped to decrease engine wear? 1
Did you learn something useful from your participation in the HE oil filter project? 2
Overall, was your participation in the HE oil filter project a positive experience? 4
One manager felt that the filters afforded “better productivity” to his fleet. Another stated the
filters would “free up mechanics’ time … and save the department money.” Yet another added
“engine longevity” as a perceived HE technology benefit. Nevertheless, the primary filter benefit
was seen as “increasing the time between oil change intervals.” Furthermore, 50 percent of fleet
managers reported that they intended to use oil sampling and analysis for establishing new drain
intervals. These opinions look encouraging for adoption of oil drain interval extension programs
in the future.
Cost/Benefit Analysis of HE Oil Filters Costs and savings from HE oil filter usage are calculated by factoring together the costs of
replacement oil, bypass and standard filters, oil analysis, waste oil and filter disposal, and labor.
Figure 12 shows the cost algorithm for calculating filter expenditures. The vehicles’ annual
mileages and the new oil change intervals are essential factors in determining HE technology
investment’s payback period.
For the larger vehicles, the calculated costs are compared with a typical express oil change
service for semi-trucks. These services charge approximately $160 for an oil change. Their lube
service labor rate alone can be as high as $77 per hour.
For some categories, comparable costs are difficult to determine. For example, the various oil
costs are based on purchase volumes, container size, delivery frequency, and other market factors.
Therefore, two fleet managers may report different costs for the same oil.
Page 49
Contractor’s Report to CalRecycle 47
Figure 12. Cost Calculation Formula
DTSC staff used individual fleet managers’ costs in determining savings and payback periods.
Overall, 5,500 quarts of oil were saved during the study. Individual fleet waste reductions ranged
from 50 percent to 80 percent. Table 14 shows the costs and payback periods averaged for each
fleet. For HE filters, payback periods were positive in every case, and ranged from 1.3 to 6.8
years. The DGS fleet could achieve extended drain intervals merely by implementing an oil
analysis program; hence, their payback period was essentially immediate. For the longer payback
periods, the length of time is primarily a function of the annual mileage and the new oil drain
interval.
Page 50
Contractor’s Report to CalRecycle 48
Table 14. Averaged Fleet Costs and Payback Periods
Current Costs DGS CAL FIRE* Caltrans FAX FUSD LBUSD CDC - Buses
Annual Mileage (mi/yr) 20,317 13,110 25,000 46,461 17,840 13,530 52,847
Change Interval (mi) 6,000 5,000 6,000 6,000 12,000 12,000 10,000
Sump Capacity (qts) 4 26 44 32 36 32 43
Oil ($/qt) 1.57 1.75 1.38 1.76 1.75 1.42 1.73
Spin-On Filter ($) 2.18 15.00 19.91 7.80 7.80 11.90 20.47
Oil Disposal ($/gal) 0.10 0.00 0.16 0.00 0.00 0.06 0.00
Oil Analysis Frequency (mi) 6,000 5,000 6,000 6,000 12,000 12,000 10,000
Oil Analysis ($/sample) 15.00 15.00 15.00 15.00 15.00 12.75 15.00
Labor ($/hr) 57.00 40.00 39.00 34.85 29.00 29.00 70.00
Oil Change (hr) 0.4 1.0 1.0 1.5 0.5 1.0 1.0
Filter Change (hr) 0.00 5.00 0.50 0.33 0.25 0.25 0.50
Filter Disposal ($/drum) 0.02 50.00 52.50 0.00 65.00 0.00 0.00
Proposed Schedule
Luberfiner Luberfiner Filter Make and Model Fram X2 OilGuard EPS 60 OilGuard EPS 60 OilGuard EPS 60 ZGard LPF9750 ZGard LPF9750 puraDYN TF 40
Bypass Filter Cost ($) 9.24 158.00 158 158.00 79.76 79.76 391.30
Bypass Element Cost ($) 0.00 22.00 22 22.00 55.06 55.06 35.85
Installation Time (hr) 0.0 2.0 2 2.0 2.0 6.0 2.0
New Spin-On Filter Change Interval (mi) 10,000 18,000 18,000 18,000 12,000 12,000 50,000
Bypass Element Change Interval (mi) 0 6,000 6,000 6,000 36,000 36,000 10,000
Make-Up Oil (qts) 0 2 2 3 4 4 7
New Oil Analysis Interval (mi) 10,000 18,000 18,000 18,000 36,000 36,000 50,000
New Oil Change Interval (mi) 10,000 18,000 18,000 18,000 36,000 36,000 50,000
Current Cost ($/yr) 162.06 305.46 682.65 1017.47 151.04 119.88 950.03
Projected Cost ($/yr) 111.59 228.70 494.68 955.19 96.66 82.63 813.31
Projected Savings ($/yr) 50.47 76.77 187.98 62.27 54.38 37.25 136.72
Purchase and Installation($) 9.24 238.00 236 227.70 137.76 253.76 531.30
Payback Period (yrs) 0.2 3.1 1.3 3.7 2.5 6.8 3.6
* Some costs are estimated.
Page 51
Contractor’s Report to CalRecycle 49
HE Oil Filter Project Conclusions The California Integrated Waste Management Board (now CalRecycle) contracted with the
Department of Toxic Substances Control (DTSC) to study high efficiency (HE) oil filters on state
vehicles. The project was designed to:
1. Discover why state agencies had not yet adopted this technology.
2. Identify barriers to its adoption.
3. Determine how the barriers could be overcome.
4. Demonstrate the technology’s performance in actual fleet operations.
HE filters were demonstrated on 119 vehicles including large diesel trucks and buses, medium-
size gasoline trucks, passenger cars, and compressed natural gas buses. The vehicles accumulated
2,844,172 miles, and 540 oil samples were collected and analyzed. No engine failures were
reported during the study. DTSC found that it is possible to achieve longer oil change intervals
without observable impacts on engine life.
Follow manufacturers’ recommendations for oil change intervals and institute routine oil analysis programs to extend oil change intervals
Staff used existing oil change intervals to establish a baseline for comparison. Staff then used oil
analysis results to propose new oil drain intervals. DTSC found that for most fleets, oil drain
intervals can be extended beyond their current level to the maximum level recommended by the
vehicle manufacturer — and beyond.
The fleet manager survey confirmed that today’s average oil change interval is considerably
shorter than the maximum suggested by oil condition-based analysis results. The fleet managers’
survey showed an average passenger vehicle oil change interval of 4,460 miles, well below some
manufacturers’ recommended 7,500 or even 10,000 miles. Since the 2008 report, both the
manufacturers recommended oil change intervals, and the actual average intervals achieved, have
increased. Now, for vehicles with sensors or calculators, manufacturers recommend following
condition-based oil change schedules. The original oil analyses showed that oil drain intervals can
be extended for all vehicle types studied. Oil sampling results indicate that, in many cases, oil
drain intervals can be extended beyond the maximum level recommended by the vehicle
manufacturer.
For fleets that have already extended their oil drain intervals to the maximum recommended by
the manufacturer, many can further extend oil change intervals by using better oil and by
establishing oil analysis programs to determine the optimum drain interval.
Routine oil analysis is an important tool that ensures good oil condition and provides safety for
the engine. In some cases, oil sampling alone can be used to extend drain intervals. A basic oil
analysis program including physical and chemical parameters, like viscosity, TBN, oxidation,
nitration, and common oil contaminants — like water, dirt, and wear metals — would be
sufficient to ensure oil condition and satisfy fleet managers.
Establish education, training, and outreach programs to promote adoption of HE filter technology
Significant challenges remain before extended oil drain intervals and HE filter technology will be
adopted on a large scale. The fleet managers’ post-test survey showed continued skepticism even
Page 52
Contractor’s Report to CalRecycle 50
among participants in the study. The survey showed that fleet managers are reluctant to change
the way they currently manage their fleets.
Therefore, outreach programs targeting fleet managers are necessary to help them establish oil
drain extension programs using HE filter technology. The results of this demonstration study will
be instrumental in persuading fleet managers to adopt HE filter technology. Fleet managers
recommended promoting HE filters using testimonials from project participants.
In the closing survey of fleet managers following the demonstration, some managers repeated
concerns initially raised by the focus groups. As shown in Table 5 for current users, and again in
Table 12 following the demonstration, cost was not the main issue with either group of fleet
managers. Logistics, maintenance schedules, and recordkeeping were common problems repeated
in both sets of surveys, and were noted in conversations throughout the study. Half of the fleet
managers surveyed planned to use oil sampling and analysis to establish new drain intervals. Half
of the participating fleet managers surveyed felt that the performance and reliability of the
technology had been satisfactory. However, only one manager planned to continue using HE
filters. Other fleets said the main benefit of the filters was “increasing the time between oil
change intervals.” This is encouraging for future efforts to extend oil drain intervals.
DTSC completed the study by preparing a cost-benefit analysis for the technology based on the
proposed drain intervals. Using the proposed intervals, DTSC found that HE oil filters would
reduce new oil purchases, decrease waste oil generation, and have a positive payback period.
Therefore, DTSC found that in appropriate fleets, high-efficiency oil filters are an effective and
economical technology for (1) achieving longer oil drain intervals, (2) reducing new oil
purchases, and (3) decreasing waste oil generation. However, significant barriers to adoption of
HE filter technology continue to exist.
Vehicle makers, engine manufacturers, and oil formulators can endorse extended oil drain intervals
Fleet managers suggested that DTSC should encourage vehicle manufacturers to include HE
technology as OEM equipment. Availability of HE filters as stock equipment would eliminate
many of the barriers to widespread adoption of technology, including engine warranty issues and
justification of high purchase and installation costs.
Fleet operators, engine manufacturers, and oil formulators should be enlisted in efforts to extend
oil drain intervals, reduce oil purchases, and decrease waste oil generation. Oil formulators should
develop brands that are designed to last longer by using higher levels of additive packages and
buffering agents. Engine manufacturers should install sensors to measure oil condition in real
time, delaying oil changes until necessary. Engine manufacturers should include high-efficiency
oil filtration systems as standard equipment, thus avoiding concerns over engine warranty issues.
Recommendations for future studies and outreach efforts
Staff identified several areas that present potential avenues for further investigation. The cost and
benefit data could be presented to the fleet managers to show them how savings can be achieved
in their fleets. Staff could develop projections on optimal oil drain intervals based on the data
collected during the study.
Recycled oil should be another subject of future investigation. The public may assume that all
used oil collected for recycling ultimately returns as fresh, replacement oil. This assumption
shows that the consumer is comfortable with the concept of reusing motor oils; however, there is
Page 53
Contractor’s Report to CalRecycle 51
in fact, very little demand for re-refined oil. In California, many state agencies, school districts,
and public transit agencies purchase re-refined oil, but sales to the general public are slow.
Although most used motor oil is collected for recycling, the majority is burned, rather than re-
refined (Boughton, et al).
Many fleet managers inquired about the use of synthetic oils. Synthetic oil makers claim their
technology extends oil change intervals. Some fleet managers requested assistance evaluating
synthetic oils in their HE filter-equipped vehicles. Although the oil quality parameter that
triggered an oil change was unique to each fleet, to the motor oil used, and to the vehicle’s
operating conditions, in most cases, the limiting factor was the oil’s TBN. Higher initial TBN
levels and longer-lasting additive packages were shown to be important factors in extending the
useful life of engine oil. Currently, many synthetic oils provide guaranteed oil drain intervals of
15,000 miles.
Staff has conducted considerable outreach efforts to date, and plans additional events in the
future. They used a September 2006 press release, the project website, and a pollution prevention
HE oil filter fact sheet to promote the results of the study. The press release was printed on Oct. 3,
2006, in the Central Valley Business Times; the project website home page was featured in San
Francisco City’s Clean and Green Scene.
Staff also gave several presentations on the HE oil filter project. Groups receiving presentations
included the Western Regional Pollution Prevention Network’s Pollution Prevention Conference
in San Diego on Oct. 10, 2006, and the Northern California Jiffy Lube Franchise Owners
Association in Sacramento on Nov. 16, 2006. Several presentations have been given to boards,
departments, and offices from the California Environmental Protection Agency.
Staff is currently developing outreach materials that will be available to fleet managers and other
decision makers, policymakers, and people who can influence industry. A pollution prevention
fact sheet will include a summary of the project, testimonials from those successfully using HE
oil filters, and the benefits of using HE oil filters. Outreach materials currently available are
included in Appendix 12. Staff anticipates providing public presentations of the study’s results.
Details of the study’s results can be found at: http://www.dtsc.ca.gov/TechnologyDevelopment.
DTSC expects to continue assisting fleet managers and others interested in the technology.
Publication of this report will encourage California’s consumers, business leaders, and
policymakers to adopt policies, procedures, and technologies that provide maximum benefits for
their fleets and to the public.
Amended 2013 Literature Review/Conclusions
In this 2013 amendment, DTSC reviewed the literature on the original bypass filters and new
topics such as oil sensors. Staff found technology has not changed significantly over the past four
years. Vehicle makers remain the key players in establishing extended oil drain intervals by
including bypass oil filter and real-time oil condition monitoring technologies as standard
equipment. Government agencies and others engaged in to promoting adoption of extended drain
intervals have a continued role to play through education, training, and outreach programs.
The conclusions drawn in the 2008 HEOF report can be amended to include testing and support
for demonstrations of oil life sensors and newer, higher-quality oils. Recommendations for future
studies are detailed in Appendix 14.
Page 54
Contractor’s Report to CalRecycle 52
Abbreviations and Acronyms CAL FIRE – California Department of Forestry and Fire Protection
CALTRANS – California Department of Transportation
CARB – California Air Resources Board
CDC – California Department of Corrections
CIWMB – California Integrated Waste Management Board
CNG – compressed natural gas
DGS – Department of General Services
DTSC – Department of Toxic Substances Control
FAX – Fresno Area Express
FUSD – Fresno Unified School District
HE oil filter – High-efficiency oil filter
ISO/DIS – International Standards Organization/Draft ISO Standard
LBUSD – Long Beach Unified School District
OEHHA – Office of Environmental Health Hazard Assessment
P2 – Pollution Prevention
SwRI – Southwest Research Institute
TBN – total base number
ZDDP – zinc dialkyldithiophosphate
Metals abbreviated in this report include:
Fe Iron Ag Silver Mg Magnesium
Al Aluminum Sb Antimony Ba Barium
Cr Chromium Si Silicon Mo Molybdenum
Cu Copper Na Sodium K Potassium
Pb Lead B Boron Ca Calcium
Sn Tin Zn Zinc
Ni Nickel P Phosphorus
Page 55
Contractor’s Report to CalRecycle 53
Appendices List Most appendices are stored electronically on a compact disk. Hard copies of original contract,
complete literature review articles and CalRecycle invoices are available upon request.
1. Scope of Work, Contract, and Quarterly Reports
2. Complete Literature Review List
3. Fleet Manager Survey
4. Focus Group Report
5. Laboratory Statement of Work
6. Filter Specification Sheets
7. Southwest Research Institute Report
8. Table of Vehicle Mileages and Oil Changes
9. Sample Results Database
10. Original Laboratory Reports
11. Fleet Managers’ Post Survey
12. Outreach Materials
13. Sensor Study
Page 56
Contractor’s Report to CalRecycle 54
Bibliography18 1999 Fuels Report; California Energy Commission. Docket Proceeding No. 99-FR-1.
http://www.energy.ca.gov/FR99/index.html (accessed March 13, 2003).
Albright, Bill, North Carolina Lube Oil Bypass Filter Project, North Carolina Division of
Pollution Prevention and Environmental Assistance, June 1997-1999
Boughton, Bob and Horvath, Arpad, Environmental Assessment of Used Oil Management
Methods, Environmental Science & Technology, 38 (2), 353 -358, 2004.
California Department of Toxic Substances Control, “Final Decision to Certify Hazardous Waste
Environmental Technology, puraDYN Onboard Oil Management System,” June 12, 1998
CalRecycle Used Oil LCA, ICF DIM Final Report July, 2013
“Extended Oil Drain Intervals,” Filter Manufacturers Council, Technical Service Bulletin 98-1,
via www.champlabs.com, (5/10/07)
Filter Manufacturers Council – Technical Service Bulletins, 1983-2002, (14 Bulletins, 83-1R thru
02-2, e.g., “89-1 Coolant Leaks into Engine Oil” and “89-5R The Micron Rating for Fluid
Filters”)
Fitch, Jim, “As I See It” articles list, Noria Practicing Oil Analysis Magazine: (21 articles19)
Fleetguard Test Report – “Differentiating Filter Performance by Oil Analysis Results,” 2003
“Full Flow Lubricating Oil Filters – Multipass Method for Evaluating Filtration Performance,
Surface Vehicle Standard,” Society of Automotive Engineers, Incorporated, SAE J1858, 1988
GaBi Software System for Life Cycle Engineering; IKPsUniversity
of Stuttgart and PE Europe, 2001, CD-ROM.
Gill, George “Ford Extends Oil Change Intervals,” Lube Report, April 11, 2007, LNG Publishing
Co.
GM Oil Life System (OLS) and Simplified Maintenance Schedule,”
http://www.gmgoodwrench.com/_res/pdf/OLS1.pdf , (April 11, 2007)
Goyal, A.K. and Willyoung, R.W., “Engine Oil Filter Performance with Synthetic and Mineral
Oils,” Society of Automotive Engineers, Incorporated, Technical Paper Series 850549 1985
Guerrero, Joe, “200 and 100 Car Matrix Update,” California Air Resources Board Engineering
Memo, July 11, 2006
“High Efficiency Oil Filters: Good for Business and Good for the Environment” Clean and Green
Scene, City and County of San Francisco, Environmental Health Management, 8/07
Page 57
Contractor’s Report to CalRecycle 55
Hoagland, N. Theresa T., “Project Summary, Pollution Prevention Alternatives,” Naval Station
Mayport, Fla., U.S. EPA National Risk Management Research Laboratory, Cincinnati, 1995
ISO/TC 23556 Performance Test Method for Diesel Engine Soot-Removal Devices in
Lubricating Oils – Initial Filtration Efficiency
ISO 4548-12 Methods of test for full-flow lubricating oil filters for internal combustion engines--
-Part 12. Filtration efficiency using particle counting, and contaminant retention capacity.
Iwakata, Keisaku, Yasuyuki, Onodera, Mihara, Kenji, and Ohkawa, Satoshi, “Nitro-Oxidation of
Lubricating Oil in Heavy-Duty Diesel Engine, Tribological Insights and Performance
Characteristics of Modern Engine Lubricants,” Society of Automotive Engineers, Incorporated,
Technical Paper Series #932839, 1993
Jetter, S.M., Kelly, K.J., and Ragomo, M.A., Nycz, D.S., Karl, G.M., Gullet, D.G., et al
Caterpillar, Incorporated, “Engine Oil Filter Performance with Synthetic and Mineral Oils,”
Society of Automotive Engineers, Incorporated, Technical Paper Series 982718, 1998
Kaleli, Hakan, Khorramian, Behrooz, “Used Oil Analysis and Study of Oil Drain Period in
Gasoline Engine,” Society of Automotive Engineers Technical Paper Series #981448, May 1998
Kaufman, Michael, “Exposing the 3,000 Mile Change Myth,” The Motor Oil Bible, (2001)
Kirk-Othmer Encyclopedia of Chemical Technology; 4th ed., John
Wiley: New York, 1996, Vol. 21.
Knize, Russ W., “Engine Oil Filter Study,” Internet: [email protected] , (2000)
Lefebvre, Byron, “Impact of Electric Mobile Oil Refiners on Engine and Hydraulic Equipment
Wear and Eliminating Environmentally Dangerous Waste Oil, (RheoTribology of Automotive
Lubricants and Fluids),” Society of Automotive Engineers, Incorporated, Technical Paper Series
#942032, 1994
“Luberfiner Filters: What You Should Know About Extended Drain Intervals,” Champion
Laboratories website.
Lubricants World Base Oil Capacity Chart; Lubricants World Magazine, 2002.
McFall, David, “Drain Intervals: How Long Must Staff Wait?” Lubes n Greases, Vol. 9, Issue 3
(Automotive), March 2003
Methods of test for full-flow lubricating oil filters for internal combustion engines – Part 12.
Filtration efficiency using particle counting, and contaminant retention capacity. ISO 4548-12
“Miami-Dade System Keeps Oil Running Longer,” American City & County Magazine,
PRIMEDIA November 1, 2000
Najman, MN, et al, Tribology Letters, Vol. 17, No. 4, November 2004
Noria Corporation’s Practicing Oil Analysis website, http://www.practicingoilanalysis.com and
Page 58
Contractor’s Report to CalRecycle 56
www.noria.com/learning_center/default.asp?sectionlink=Technology (~65 articles)20
North Carolina Division of Pollution Prevention and Environmental Assistance, “Engine Oil
Bypass Filters,” North Carolina Department of Environment and Natural Resources, August 1996
“Oil Analysis 101,” “Too Slick,” February 5, 2000, TDIClub Fuels and Lubricants Forum,
www.tdiclub.com
Pyziak, T.; Brinkman, D. W. J. Soc. Tribol. Lubr. Eng. 1993, 5,339.
Schleider, Michael, “ByPass Filter for Vehicle Motor Oil,” Joint Service Pollution Prevention
Opportunity Handbook, November 2003
Schreurs, Brian, “Mobil 1 Test Results,” Paradise Garage, http://oil study.spacebears.com, 2005
Society of Automotive Engineers (SAE) Engine Committee, “Standard Oil Filter-Test Oil SAE
J1260” Apr89, SAE Handbook, 1989.
Society of Automotive Engineers (SAE) Oil Filtration papers list, SAE Incorporated website,
1985-2000
Stanley, David R., “Correlating Lube Oil Filtration Efficiencies with Engine Wear,” SAE
Technical Paper Series #881825, General Motors Corp., Truck and Bus Meeting and Exposition,
Indianapolis, Indiana, November 7-10, 1988
“State: High-efficiency oil filters might cut oil waste,” Central Valley Business Times 10/3/06
“Study of Bypass Oil Filtration Technology,” U.S. Department of Energy, Office of Fossil
Energy, 2005
Thom, Rudolf, Kollmann, Karl, Warnecke, Wolfgang, Frend, Mike, “Extended Oil Drain
Intervals – Conservation of Resources or Reduction of Engine Life,” Society of Automotive
Engineers, Incorporated, Technical Paper Series #951035, 1995 and Part II, Technical Paper
Series 981443, 1998.
Used Motor Oil Collection and Recycling; American Petroleum Institute.
http://www.recycleoil.org/Usedoilflow.htm (accessed March 1, 2003).
Used Oil Recycling Program, “Re-refined Oil State Contract: June 1, 1999 to November 30,
2001,” California Integrated Waste Management Board, 1999
Used Oil Recycling Rate Report; California Integrated Waste Management Board.
http://www.ciwmb.ca.gov/UsedOil/RateInfo/
Annual.htm (accessed March 3, 2003).
“Used Oil Study and Recommendations to Address Energy Policy Act of 2005 Section 1838,”
U.S. Department of Energy, December 2005
Page 59
Contractor’s Report to CalRecycle 57
Zirker, Larry and Francfort, James, “Oil Bypass Filter Technology Performance Evaluation,”
U.S. Department of Energy Idaho National Engineering and Environmental Laboratory,
FreedomCAR & Vehicle Technologies, January 2002
Page 60
Contractor’s Report to CalRecycle 58
Endnotes 1 The Scope of Work, Contract, and all Quarterly Reports for the agreement between the California Integrated Waste
Management Board and the Department of Toxic Substances Control are included in Appendix 1.
2 Boughton, Bob and Horvath, Arpad, Environmental Assessment of Used Oil Management Methods, Environmental
Science & Technology, 38 (2), 353 -358, 2004. 3 Stanley, David R., General Motors Corp., “Correlating Lube Oil Filtration Efficiencies with Engine Wear” Truck
and Bus Meeting and Exposition, Indianapolis, Indiana, November 7–10, 1988.
4 Cavette, Chris, From Spin-ons to Microns, Firecheif.com/news, Feb 2001. Accessed August 12, 2008.
5 CTC Analytical Services (Phoenix, AZ).
6 Caterpillar Machine Fluids Recommendations, October, 2004.
7 Detroit Diesel Lubricating Oil, Fuel and Filters, 2004.
8 http://www.practicingoilanalysis.com/results.asp?search=metals
9 Personal communication 8.30.06, Glenn Asauskas, Chevron.
10 Ibid.
11 Company contact & address; how filters extend oil life, remove water, coolant or fuel; how they replenish
additives; pore size, make-up oil, oil flow rate, years available, filter units sold, patent status, warranty, California
sales support, miles between changes, engine type applicability, filter sizes and costs; OEM warranty letters and
current customers.
12 By 2007, Honda and GM had oil life sensors on most of their vehicles. Ford also announced moving its
recommended change interval from 5,000 to 7,500 miles. (Bibliography: “GM Oil Life System…” and Gill, G.,
“Ford Extends Oil Change Intervals.”)
13 However, UC Davis never installed the filters.
14 ISO/DIS 23556, Performance Test Method for Diesel Engine Soot Removal Devices in Lubricating Oils – Initial
Filtration Efficiency, International Organization for Standardization (ISO) 1, ch. de la Voie-Creuse, Case postale 56,
CH-1211 Geneva 20, Switzerland, 2005.
15 ISO 4548-12, Methods Of Test For Full Flow Lubricating Oil Filters For Internal Combustion Engines- Part 12:
Filtration Efficiency Using Particle Counting , And Contaminant Retention Capacity, International Organization for
Standardization (ISO) 1, ch. de la Voie-Creuse, Case postale 56, CH-1211 Geneva 20, Switzerland, 1999.
16 Test terminated after 40 hours.
17 Test terminated after 6 hours – possible manufacturing defect.
18 Selected articles from Appendix 2. Complete literature review list.
Page 61
Contractor’s Report to CalRecycle 59
19 See list of Fitch articles in Appendix 2. Complete literature review list.
20 See Appendix 2. Complete literature review list.