Evaluation of IPCC Soil Moisture Simulations for the latter half of the 20 th Century Haibin Li 1 , Alan Robock 1 , Martin Wild 2 1 Department of Environmental Sciences, Rutgers University, New Brunswick, NJ, USA 2 Institute for Atmospheric and Climate Science ETH, Swiss Federal Institute of Technology, Zurich, Switzerland
Transcript
Evaluation of IPCC Soil Moisture Simulations for the latter half of the 20th Century
Haibin Li1, Alan Robock1, Martin Wild 2
1Department of Environmental Sciences, Rutgers University,
New Brunswick, NJ, USA
2Institute for Atmospheric and Climate Science ETH, Swiss Federal Institute of Technology,
Zurich, Switzerland
Outline
• Why??Model intended for projections should provide reliable reproduction
Model outputs:Model Name Organization Land Surface Reference
MIROC3.2 (medres)
Center for Climate System Research (The University of Tokyo), National Institute for Environmental Studies, and Frontier Research Center for Global Change (JAMSTEC), JAPAN
MATSIRO (no tiling), ~2.8º
Takata, et a.l 2003
GISS - EHNASA / Goddard Institute for
Space Studies, USALand Surface Model,4 by 5
Rosenzweig and Abramopoulos, 1997;
Friend and Kiang, 2005GISS - ER
MRI-CGCM2.3.2Meteorological Research
Institute, JapanSiB L3 (no vegetation
scheme), ~2.8ºSellers et al. 1986; Sato et
al. 1989
FGLOALS-g1.0LASG / Institute of Atmospheric
Physics, ChinaCLM2.0, ~2.8º Dai et al. 2003
CGCM3.1 (T47)Canadian Centre for Climate
Modeling & Analysis, Canada
CLASS ~3.75 º Verseghy et al. 1991
CCSM3, USANational Center for Atmospheric
Research, USACLM3.0, ~1.4 º Oleson et al. 2004
UKMO-HADCM3 Hadley Centre for Climate Prediction and Research / Met Office, Met Office, UK
MOSES-I (2.5 by 3.75) Cox et al. 1999
UKMO-HADGEM1 MOSES-II (1.25 by 1.875) Essey et al. 2001
Seasonal cycleT
op 1
0 cm
(un
it: c
m)
Tot
al s
oil c
olum
n (S
WI)
Better agreement over FSU regions.
Less discrepancy in warm seasons.
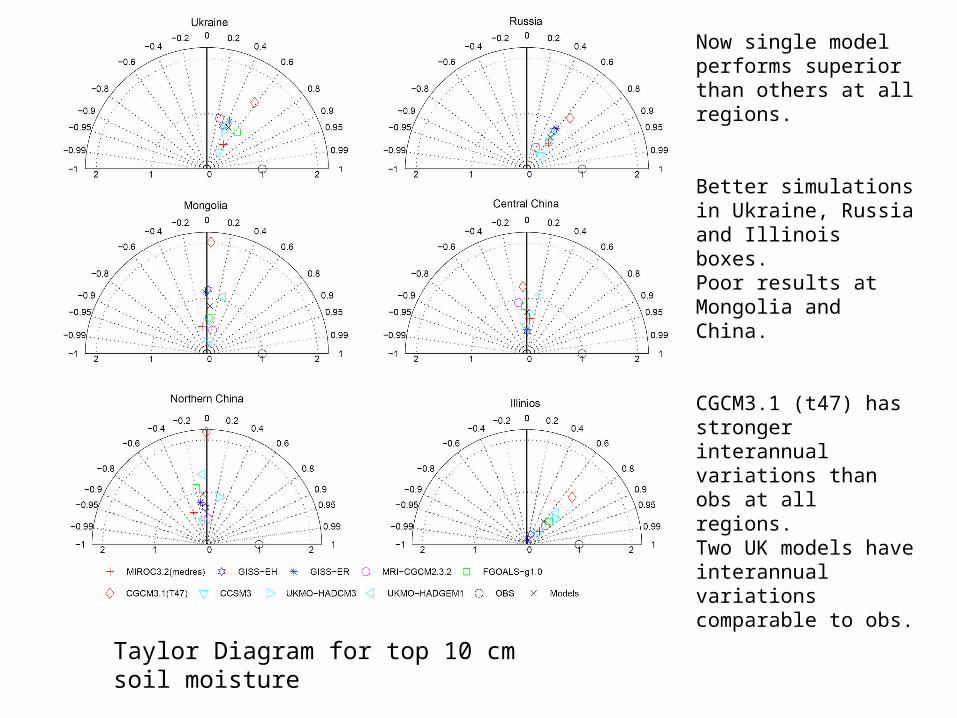
Now single model performs superior than others at all regions.
Better simulations in Ukraine, Russia and Illinois boxes. Poor results at Mongolia and China.
CGCM3.1 (t47) has stronger interannual variations than obs at all regions.Two UK models have interannual variations comparable to obs.
Taylor Diagram for top 10 cm soil moisture
Taylor Diagram for precipitation
Better simulation of precipitation not necessarilymeans more realistic soil moisture. Other factors also contribute.
Interannual variability (Coefficient of variance)
Generally, the drier the region is, the stronger interannual variation.
Large inter-model differences and model-to-obs difference.
Seasonal trends
a. Soil moisture b. precipitation
c. temperature d. Radiation (SW)
Soil moisture evolution in summer (JJA), 1958-1999.
Upward trend for both regions. Model ensembles show little change. The observed trend is far above that of model’s range.
Evidence from pan evaporation (Peterson et al. 1995 ) and solar radiation at the earth surface (Wild et al. 2005).
Pre
cipi
tatio
nT
empe
ratu
re
Observed trend for temperature is well constrained in models.
Precipitation & temperature all increase slightly but are not statistically significant.
What likely contributes to the observed trend in soil moisture?
Radiation: from dimming to brightening.Soil moisture: from upward trend to level-off.
Sensitivity experiments from ECHAM5 model (linear trend: units in mm/decade)
Coincidence?
Linear trend for top 10 cm (1981-1999, mm/decade)
Conclusions1. Less discrepancy in warm season simulations.
2. Better simulations over Ukraine and Russia and Illinois boxes but not necessarily a result of good precipitation.
3. Large differences between obs and models in terms of interannual variability. Some model systematically exhibits stronger interannual variations.
4. Significant trends in warm season (JJAS) for soil moisture. Prep & temp don’t show much change. Model simulated trend for temperature is generally reliable.
5. Sensitivity analysis from ECHAM5 model did show model with indirect aerosol scheme may have a better change to capture observed soil moisture pattern.