+ All Categories
Home > Documents > Evaluation of Long-Term Pavement Performance and … · Evaluation of Long-Term Pavement...

Evaluation of Long-Term Pavement Performance and … · Evaluation of Long-Term Pavement...

Date post: 08-Sep-2018
Category:
Upload: duonghanh
View: 214 times
Download: 0 times
Share this document with a friend
98
Experimental Feature Report __________________________________________________________ Post Construction & Performance Report Experimental Feature WA 05-06 Evaluation of Long-Term Pavement Performance and Noise Characteristics of Open-Graded Friction Courses Contract 7134 I-5 52 nd Avenue West to SR-526 – Southbound MP 180.10 to MP 189.30
Transcript

Experimental Feature Report

__________________________________________________________

Post Construction & Performance Report

Experimental Feature WA 05-06

Evaluation of Long-Term Pavement

Performance and Noise

Characteristics of Open-Graded

Friction Courses

Contract 7134

I-5 52nd Avenue West to SR-526 – Southbound

MP 180.10 to MP 189.30

Experimental Feature Report

__________________________________________________________

March 2008 ii

1. REPORT NO. 2. GOVERNMENT ACCESSION NO. 3. RECIPIENT'S CATALOG NO.

WA-RD 683.1

4. TITLE AND SUBTITLE 5. REPORT DATE

Evaluation of Long-Term Pavement Performance and Noise Characteristics of Open-Graded Friction Courses

March 2008

6. PERFORMING ORGANIZATION CODE

WA 05-06

7. AUTHOR(S) 8. PERFORMING ORGANIZATION REPORT NO.

Keith W. Anderson, Linda M. Pierce, Jeff S. Uhlmeyer, and Jim Weston

. PERFORMING ORGANIZATION NAME AND ADDRESS 10. WORK UNIT NO.

Washington State Department of Transportation

Materials Laboratory, MS-47365 11. CONTRACT OR GRANT NO.

Olympia, WA 98504-7365

12. SPONSORING AGENCY NAME AND ADDRESS 13. TYPE OF REPORT AND PERIOD COVERED

Washington State Department of Transportation Transportation Building, MS 47372

Post-Construction and Performance Report

Olympia, Washington 98504-7372 14. SPONSORING AGENCY CODE

Project Manager: Kim Willoughby, 360-705-7978 15. SUPPLEMENTARY NOTES

This study was conducted in cooperation with the U.S. Department of Transportation, Federal Highway Administration.

16. ABSTRACT

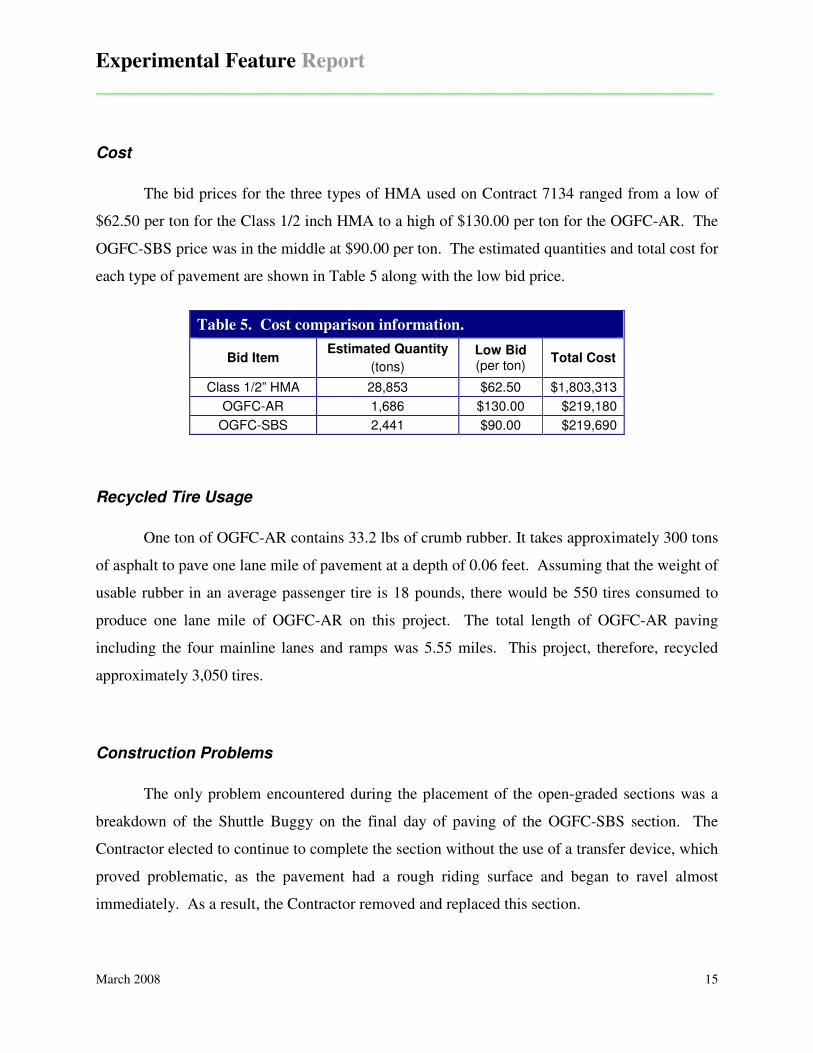
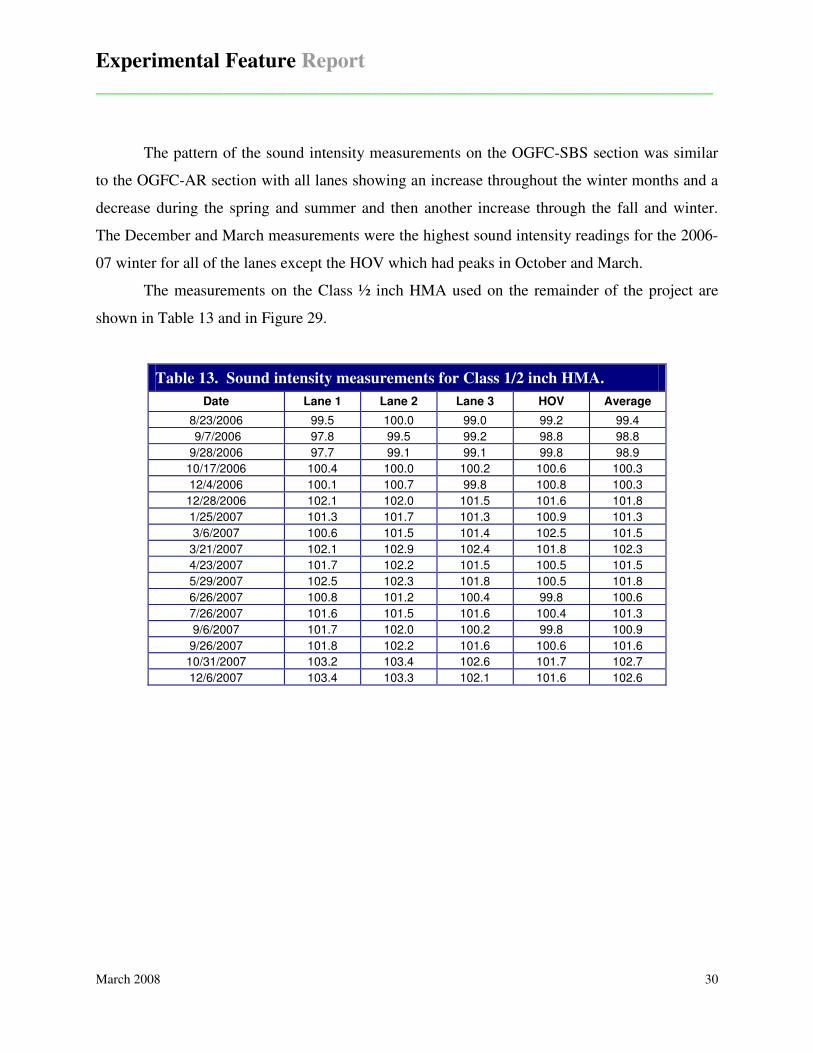
This experimental project is being conducted as a part of WSDOT’s effort to produce pavements that reduce the noise generated at the tire/pavement interface. Experimental sections of open-graded friction courses (OGFC) were built using asphalt rubber (AR) and styrene-butadiene-styrene (SBS) polymer modified asphalt binders. A section of conventional Class ½ inch hot mix asphalt (HMA) serves as the control section for the two experimental sections.

Sound intensity measurements were conducted using the On Board Sound Intensity (OBSI) method immediately after construction and monthly, weather permitting, for a year following construction.

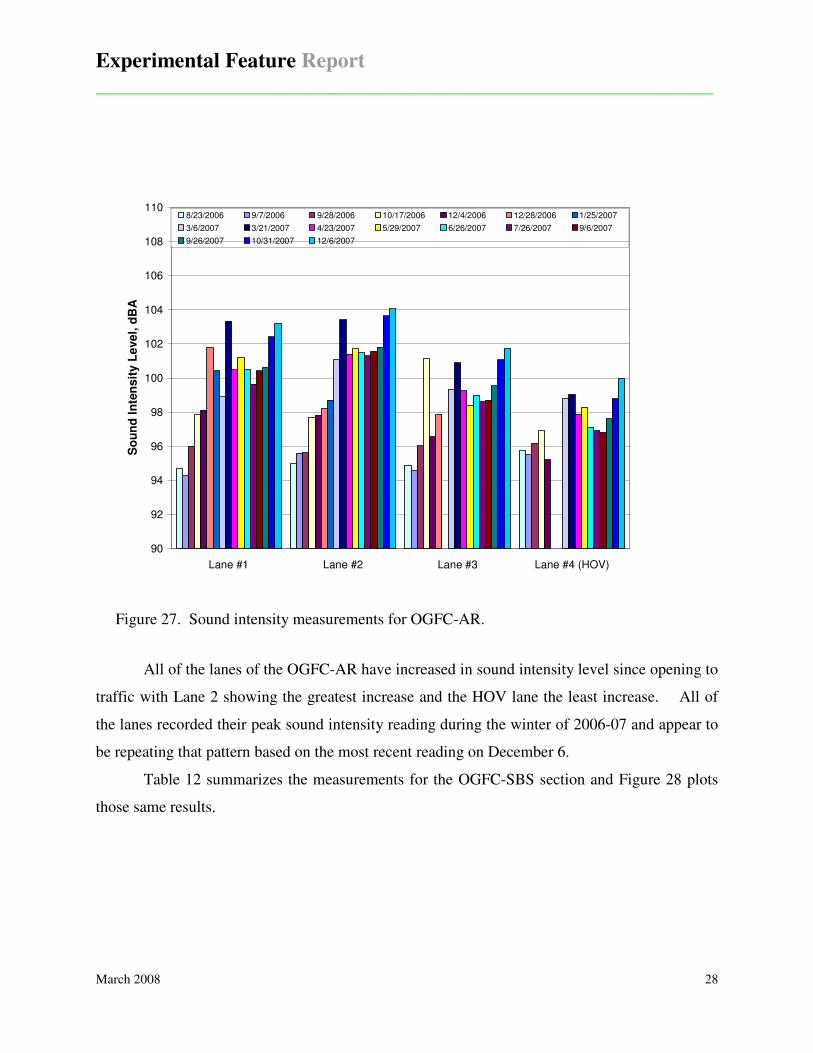
OBSI readings immediately after construction indicated that the OGFC-AR and OGFC-SBS sections were 2.8 to 3.8 decibels, respectively, quieter than the Class ½ inch HMA control section. Data from one year later showed that the AR and SBS modified sections were 1.5 to 3.3 decibels quieter, respectively, than the control section. Sound intensity readings taken between wheel paths are at levels similar to the initial readings after the sections were constructed indicating that studded tire wear is having a negative effect on the sound absorbing qualities of the open-graded mixes. 17. KEY WORDS 18. DISTRIBUTION STATEMENT

quieter pavements, rubber asphalt, open-graded friction courses, on board sound intensity measurements, polymer asphalt, styrene-butadiene-styrene

No restrictions. This document is available to the public through the National Technical Information Service, Springfield, VA 22616

19. SECURITY CLASSIF. (of this report) 20. SECURITY CLASSIF. (of this page) 21. NO. OF PAGES 22. PRICE

None None 98

Experimental Feature Report

__________________________________________________________

March 2008 iii

DISCLAIMER

The contents of this report reflect the views of the authors, who are responsible for the

facts and the accuracy of the data presented herein. The contents do not necessarily reflect the

official views or policies of the Washington State Department of Transportation or the Federal

Highway Administration. This report does not constitute a standard, specification, or regulation.

Experimental Feature Report

__________________________________________________________

March 2008 iv

TABLE OF CONTENTS

Introduction..................................................................................................................................... 1 Background ..................................................................................................................................... 2 Project Description.......................................................................................................................... 3 Mix Design Process ........................................................................................................................ 5

OGFC-AR................................................................................................................................... 5 OGFC-SBS ................................................................................................................................. 6

Construction.................................................................................................................................... 8 OGFC-AR Special Provisions .................................................................................................... 8 OGFC-SBS Special Provisions................................................................................................... 9 Asphalt Plant............................................................................................................................... 9 Paving Operations..................................................................................................................... 11 Cost ........................................................................................................................................... 15 Recycled Tire Usage ................................................................................................................. 15 Construction Problems.............................................................................................................. 15

Construction Testing..................................................................................................................... 16 Specification Compliance Testing ............................................................................................ 16 Temperature Monitoring........................................................................................................... 17

Post-Construction Testing............................................................................................................. 20 Friction...................................................................................................................................... 20 Ride ........................................................................................................................................... 21 Wear/Rutting............................................................................................................................. 22 Noise Measurement .................................................................................................................. 24

Source Measurement............................................................................................................. 24 Sound Absorption Measurement........................................................................................... 25 Wayside Measurement.......................................................................................................... 25 Noise Measurement Equipment............................................................................................ 26 Results................................................................................................................................... 27 Noise Measurement Analysis ............................................................................................... 32

Splash and Spray....................................................................................................................... 34 Long-Term Performance........................................................................................................... 35

Conclusions................................................................................................................................... 38 Future Research ............................................................................................................................ 39 References..................................................................................................................................... 40 Appendix A................................................................................................................................... 41 Appendix B ................................................................................................................................... 48 Appendix C ................................................................................................................................... 63 Appendix D................................................................................................................................... 75 Appendix E ................................................................................................................................... 83 Appendix F.................................................................................................................................... 86

Experimental Feature Report

__________________________________________________________

March 2008 v

LIST OF FIGURES

Figure 1. Location of Contract 7134 near Lynnwood, Washington. ........................................... 3 Figure 2. Plan map of section layout. .......................................................................................... 4 Figure 3. Lifting bags of crumb rubber...................................................................................... 10 Figure 4. Loading of crumb rubber into double bin supply hopper........................................... 10 Figure 5. Double bin crumb rubber weigh hopper..................................................................... 10 Figure 6. Shear mixer used to combine the crumb rubber with the asphalt binder. .................. 10 Figure 7. Fiber supply machine. ................................................................................................ 10 Figure 8. Fiber supply hose and hose fitting in dryer drum plant.............................................. 10 Figure 9. Tack coat application on test section.......................................................................... 12 Figure 10. Globs of excess tack on the roadway. ........................................................................ 12 Figure 11. Paving the OGFC-AR test section.............................................................................. 12 Figure 12. Another view of the OGFC-AR test section paving................................................... 12 Figure 13. Aggressive rolling of OGFC-AR test section............................................................. 13 Figure 14. The soap bubbles on the pavement are from the soap added to the water to

prevent sticking........................................................................................................... 13 Figure 15. OGFC-AR mix behind the material management kit prior to the screed................... 13 Figure 16. Close-up of OGFC-AR mix during the compaction process...................................... 13 Figure 17. OGFC-SBS prior to rolling. Blemishes are footprints. ............................................. 14 Figure 18. OGFC-SBS after compaction. .................................................................................... 14 Figure 19. Roadtec Shuttle Buggy materials transfer vehicle...................................................... 14 Figure 20. Paving train consisting of dump trucks, Shuttle Buggy, paver and rollers. ............... 14 Figure 21. Temperature differentials in a delivery truck. ............................................................ 18 Figure 22. Infrared photo of the mat behind the paver showing uniform temperatures. ............. 19 Figure 23. IRI measurements....................................................................................................... 22 Figure 24. Wear/rutting measurements for all three pavement types. ......................................... 23 Figure 25. Twin microphones mounted near the rear tire of a vehicle. Note Uniroyal

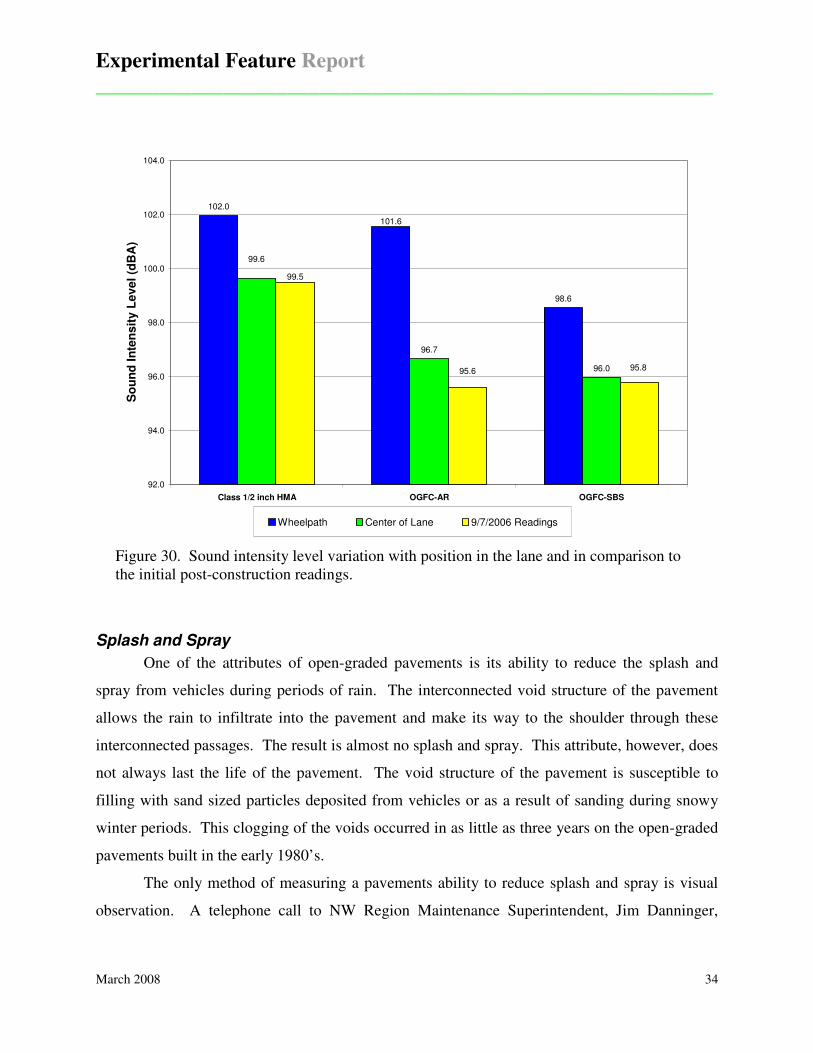
Tiger Paw tire.............................................................................................................. 26 Figure 26. Computer used for data collection.............................................................................. 26 Figure 27. Sound intensity measurements for OGFC-AR. .......................................................... 28 Figure 28. Sound intensity measurements for OGFC-SBS. ........................................................ 29 Figure 29. Sound intensity measurements for Class ½ inch HMA.............................................. 31 Figure 30. Sound intensity level variation with position in the lane and as compared to

initial readings............................................................................................................. 34 Figure 31. OGFC pavement life for various amounts of traffic. ................................................. 36 Figure 32. Image of typical tack application with some pickup visible in the wheelpaths. ........ 64 Figure 33. Thermal image of trailer showing cool crust on the HMA at 101° F and internal

temperature of 303° F. ................................................................................................ 65 Figure 34. Thermal image of the mix as it leaves the Shuttle Buggy and enters the paver

hopper at 302° F and exits the screed at 300° F.......................................................... 66 Figure 35. Image from back of screed looking towards the rollers (not shown). ........................ 66

Experimental Feature Report

__________________________________________________________

March 2008 vi

Figure 36. Thermal image looking at augers where spot 1 is typical temperature and spot 2 is where the mix would cool and slowly work to the front of the extended screed. .......................................................................................................... 67

Figure 37. Lower temperature mix behind the screed extension (spot 1) and the higher temperature mix at the middle of the paver (spot 2). .................................................. 67

Figure 38. Image of breakdown rollers working in tandem with each other. .............................. 68 Figure 39. Image of the mismatch at the longitudinal joint. ........................................................ 69 Figure 40. Thermal image of construction joint at startup........................................................... 69 Figure 41. Thermal image of a cool glob of CRS-2P in the newly place OGFC-SBS surface. .. 70 Figure 42. Thermal image of backhoe scooping dumped OGFC-AR from roadway.................. 71 Figure 43. Thermal image where paver paved over remaining material that was picked up. ..... 71 Figure 44. Thermal image of dumped material being shoveled. ................................................. 72 Figure 45. Thermal image of paver paving over remaining material on roadway. ..................... 72 Figure 46. Image of cool spot where paver paved over remaining mix on roadway................... 73

Experimental Feature Report

__________________________________________________________

March 2008 vii

LIST OF TABLES

Table 1. Mix design for the OGFC-AR. ...................................................................................... 6 Table 2. Mix design for the OGFC-SBS...................................................................................... 7 Table 3. Gradation requirement for crumb rubber....................................................................... 8 Table 4. Paving history for OGFC-AR and OGFC-SBS. .......................................................... 11 Table 5. Cost comparison information....................................................................................... 15 Table 6. Gradation, percent asphalt and percent rubber results for OGFC-AR......................... 16 Table 7. Gradation and percent asphalt results for OGFC-SBS. ............................................... 17 Table 8. FN results. .................................................................................................................... 20 Table 9. IRI measurements. ....................................................................................................... 21 Table 10. Wear/rutting measurements. ........................................................................................ 23 Table 11. Sound intensity measurements for OGFC-AR. ........................................................... 27 Table 12. Sound intensity measurements for OGFC-SBS........................................................... 29 Table 13. Sound intensity measurements for Class 1/2 inch HMA............................................. 30 Table 14. Change in sound intensity level (dBA) from September 2006 to September 2007..... 32 Table 15. Open-graded pavement performance data. .................................................................. 84

Experimental Feature Report

__________________________________________________________

March 2008 1

Introduction

This experimental feature documents the construction of two quieter pavements: (1) an

open-graded friction course (OGFC) modified with an asphalt rubber binder, hereafter referred to

as OGFC-AR and (2) an OGFC with a styrene-butadiene-styrene (SBS) polymer asphalt binder,

hereafter referred to as OGFC-SBS. OGFC, with a higher volume of surface voids (a minimum

of 15 percent air voids), absorb some of the noise generated at the tire/pavement interface and

are thus “quieter” than densely-graded pavements with fewer voids (around 4-8 percent).

Open-graded pavements are not new to the state of Washington or the Washington State

Department of Transportation (WSDOT). OGFC’s were used extensively in the state in the early

to middle 1980’s. Their use was discontinued due to problems with excessive rutting caused by

studded tire wear. The renewed interest in open-graded pavements is prompted by successful

use of this type of pavement in other states, principally Arizona. The use of rubberized open-

graded pavements as one solution to making pavements quieter has been promoted in numerous

road industry publications. This aggressive proclamations regarding rubberized open-graded

pavement as the answer to making pavements quieter has reached even to the public sector who

are now asking for this type of pavement to be used on the highways that bisect their

neighborhoods.

Experimental Feature Report

__________________________________________________________

March 2008 2

Background

There are downsides with the use of open-graded pavements. Open-graded pavements

are very susceptible to excessive wear from studded tires. This excessive wear produces ruts in

the pavements that fill with water during rainy periods and pose the additional hazard of

hydroplaning. The other downside is pavement life. The life of open-graded pavements is cut

short by the studded tire wear mentioned previously. Pavement lives of less than 10 years, and

as short as three to four years were experienced with these types of pavement in the 1980’s in

Washington. States where the use of OGFC has been successful (Florida, Texas, Arizona and

California) do not experience extensive studded tire usage. Similarly, these states are southern,

warm weather states; a clear advantage when placing a product like OGFC with asphalt-rubber.

Arizona DOT, for example, requires the existing pavement to have an 85°F surface temperature

at the time of placement. Washington State urban pavements, placed at night to avoid traffic

impacts, rarely reach this temperature during the available nighttime hours for paving (10:00

p.m. to 5:00 a.m.), even in summer. Other pavements and bridge decks reach such temperatures

at night only on rare occasions, making successful placement of this type of pavement a

challenge.

Open-graded pavements also have benefits other than reducing the noise level. Drivers

have improved visibility during rain storms on open-graded pavements due to the open void

structure that drains away excess water. The quick drainage of water away from the surface of

the pavement also improves the wet weather friction resistance of the roadway and decreases the

potential for hydroplaning. At night the drainage capability of the pavement helps to improve

visibility by reducing the glare associated with standing water on the pavement. Painted traffic

markings are also more visible at night because of less water standing on the roadway.

Experimental Feature Report

__________________________________________________________

March 2008 3

Project Description

The site selected for the experimental use of the OGFC is located on I-5 near the town of

Lynnwood, Washington (Figure 1). The project, Contract 7134, 52nd Ave. West to SR 526 SB

Paving and Safety, consisted of paving the southbound lanes from Milepost (MP) 180.10 to (MP)

188.65. Wilder Construction Company from Everett, Washington was the low bidder on the

project. The project called for 0.06 feet of open-graded mix to be placed directly on top of the

existing pavement on all three general purpose lanes and the HOV lane with the exception of the

second lane. The second lane, which was extensively cracked and rutted, was to be milled to a

depth of 0.15 feet and inlaid with an equal depth of PG 64-22 Class ½ inch HMA prior to

placement of the 0.06 foot OGFC overlay. The average daily traffic (ADT) on this section of I-5

is 79,800 with 7.3% trucks.

Figure 1. Location of Contract 7134 near Lynnwood, Washington.

Experimental Feature Report

__________________________________________________________

March 2008 4

The OGFC-SBS was placed in all four lanes from MP 180.75 to 181.82, a distance of

1.07 miles (Figure 2). The OGFC-AR was placed in all four southbound lanes from MP 181.82

to 182.58, a distance of 0.76 miles. The remainder of the project received a 0.15 foot mill and

fill with Class ½ inch HMA. The section of Class ½ inch HMA from the beginning of the

project at MP 180.10 to the OGFC-SBS section at MP 180.75 was selected to be the control

section.

I-5 SB Lane 1 Lane 2 Class 1/2 inch HMA OGFC-SBS OGFC-AR

Lane 3 HOV

Milepost 180.10 180.75 181.82 182.58

Figure 2. Plan map of section layout.

Experimental Feature Report

__________________________________________________________

March 2008 5

Mix Design Process

Special mix design processes were required for both of the open-graded pavements. The

asphalt rubber mix design was the design developed and used by the Arizona Department of

Transportation (ADOT). The polymer mix design was developed in-house and based on

discussions from the National Center for Asphalt Technology and it used a slightly modified

version of the ADOT aggregate gradation for open-graded friction courses. The mix designs can

be found in Appendix A.

OGFC-AR

ADOT was called upon for help in the development of the mix design for the OGFC-AR.

Their expertise with the design and use of asphalt-rubber goes back many years. Granite

Construction, the parent company of the project’s Contractor, Wilder Construction, hired the

firm of MACTEC Engineering and Consulting, Inc., located in Phoenix, AZ to develop the

binder design which combined the binder with the crumb rubber. The binder design was

provided to ADOT, along with the aggregate gradation, who then verified the mix design. The

lab reports from both ADOT and MACTEC are found in Appendix A. The design called for a

fine mix with 55-70 percent in the #4 to 3/8 inch size and 22-37 percent in the #8 to #4 size. The

design binder content was 9.2 percent with 0.50 percent anti-strip additive and the amount of

crumb rubber added was set at 22 percent by weight of the asphalt binder. Three stockpiles were

used from pit site B-335, 3/8 inch chips, #4 to #8 sand, and #4 to 0 sand blended at the ratios of

72, 20 and 8 percent, respectively. Tesoro Corporation, Anacortes, Washington was the source

of the PG64-22 asphalt binder and Crumb Rubber Manufacturers, Rancho Domingo, California,

provided the crumb rubber for the project. Important features of the design are summarized in

Table 1.

Experimental Feature Report

__________________________________________________________

March 2008 6

Table 1. Mix design for the OGFC-AR.

Sieve Size Gradation Specifications Source/Supplier

3/8” 100 100 B-335

#4 34 30-45 B-335

#8 8 4-8 B-335

#200 1.5 0–2.5 B-335

Binder Grade Percent Asphalt Source/Supplier

PG64-22 9.2 Tesoro, Anacortes, WA

Anti-Strip Percent

ARR-MAZ 6500 0.50 Arr-Maz Custom

Chemicals, Mulberry, FL

Crumb Rubber Percent by Wt. of AC Source/Supplier

CRM 22 Crumb Rubber

Manufacturers, Rancho Domingo, CA

OGFC-SBS

The mix design for the OGFC-SBS was performed in the WSDOT Headquarters

Materials Laboratory. The starting point for the percent of asphalt was determined by an asphalt

retention process which suggested using 6.8 percent. Samples were mixed at 6.3, 6.8 and 7.3

percent asphalt and evaluated using the FHWA pie plate drain down test. The results of the pie

plate drain down test suggested using more asphalt than the initial target of 6.8 percent.

However, before additional tests could be conducted, a recommendation was needed for the mix

design that was to be used for the construction of the test section at the asphalt plant site in

Everett. Therefore, a preliminary design calling for 7.8 percent was issued for the test section

construction. Additional samples were then mixed using 7.3, 8.3, and 8.8 percent asphalt and

evaluated using the pie plate drain down test. All of the samples were in specification for

volumetric properties, but the pie plate drain down test suggested that 8.3 percent was optimum;

therefore, the asphalt content for the mainline paving was set at this level. The gyration level

used for the mix design was 50 based on a recommendation from the ADOT.

Aggregate for the OGFC-SBS came from the same pit site, B-335, and the same three

stockpiles were used, but the blend differed from the OGFC-AR having 66 percent from the 3/8

inch chips stockpile, 21 percent from the #4 to #8 stockpile, and 13 percent #4 to 0 stockpile.

Experimental Feature Report

__________________________________________________________

March 2008 7

Fiber produced from recycled paper was used as a stabilizing additive to thicken the asphalt

binder and prevent drain down. The SBS modified PG70-22 binder was provided by US Oil,

Tacoma, Washington and the fibers were obtained from Hi-Tech Asphalt Solutions,

Mechanicsville, Virginia. Details of the mix design are listed in Table 2.

Table 2. Mix design for the OGFC-SBS.

Sieve Size Gradation Specifications Source/Supplier

3/8” 100 100 B-335

#4 37 35-55 B-335

#8 10 9-14 B-335

#200 2.1 0–2.5 B-335

Binder Grade Percent Asphalt Source/Supplier

PG70-22 8.3 US Oil, Tacoma, WA

Anti-Strip Percent Source/Supplier

ARR-MAZ 6500 0.25 Arr-Maz Custom

Chemicals, Mulberry, FL

Stabilizing Additive

Percent Source/Supplier

Processed recycled paper

0.30 Hi-Tech Asphalt Solutions

Experimental Feature Report

__________________________________________________________

March 2008 8

Construction

The Special Provisions for the contract contains several items pertaining to the

construction of the two special OGFC pavements. A brief description of these items is included

in this section of the report as a guide to understanding the circumstances under which the

sections were constructed. The Special Provisions are included in Appendix B.

OGFC-AR Special Provisions

The Special Provisions required that the asphalt binder for the OGFC-AR would be a

PG58-22 or PG64-22. The crumb rubber must conform to the gradation requirements shown in

Table 3. The crumb rubber will have a specific gravity of 1.15 ± 0.05 and will be free of wire or

other contaminating materials, except that the rubber will not contain more than 0.5 percent

fabric. Calcium carbonate could be added to prevent the particles from sticking together. The

minimum amount of crumb rubber required in the mix was 20 percent by weight of the asphalt

binder.

Table 3. Gradation requirement for crumb rubber.

Sieve Size Percent Passing

No. 8 100

No. 10 100

No. 16 65 – 100

No. 30 20 – 100

No. 50 0 – 45

No. 200 0 – 5

The temperature of the asphalt binder at the time of the addition of the crumb rubber

should be between 350 and 400°F. A one-hour reaction period was required after the mixing of

the rubber with the binder. At the end of the reaction period the rubber particles must be

thoroughly “wetted” without any rubber floating on the surface or agglomerations of rubber

particles observable. The temperature of the asphalt-rubber immediately after mixing will be

between 325 and 375°F.

The mixed asphalt-rubber must be kept thoroughly agitated during the period of use to

prevent the settling of the rubber particles. In no case can the asphalt-rubber be held at a

Experimental Feature Report

__________________________________________________________

March 2008 9

temperature of 325°F or above for more than 10 hours. Asphalt-rubber held for more than 10

hours must be allowed to cool and gradually reheated to the prescribed temperature. A batch of

asphalt-rubber can only be cooled and reheated in this manner once.

OGFC-SBS Special Provisions

The asphalt binder for the OGFC-SBS will be a PG70-22 produced by adding SBS

modifier to a non air blown or oxidized PG58-22 or PG64-22. The fibers required in the mixture

can be cellulose fibers, cellulose pellets, or mineral fibers. If the mix was produced in a dryer-

drum plant, fibers were required to be added to the aggregate and uniformly dispersed prior to

the injection of the asphalt binder. Storage time for the OGFC-SBS was not to exceed four

hours.

Asphalt Plant

The asphalt plant was a dryer-drum type plant located at Wilder Construction’s Smith

Island facility. Granite Construction provided the additional equipment for the production of the

asphalt-rubber binder. The photos shown in Figures 2 through 5 depict the process used to load

the crumb rubber into a shear mixer prior to its storage in heated and agitated tanks. Once the

asphalt and rubber mixture was blended the process for producing the HMA was no different

than conventional dryer-drum plant production.

Modifications to the plant were also necessary for the production of the OGFC-SBS.

Figure 6 shows the fiber mixing and distribution machine which introduced a controlled amount

of fiber into the dryer drum. Figure 7 shows the supply line hose and hose fitting on the dryer

drum.

Experimental Feature Report

__________________________________________________________

March 2008 10

Figure 3. Lifting bags of crumb rubber. Figure 4. Loading of crumb rubber into

double bin supply hopper.

Figure 5. Double bin crumb rubber weigh hopper.

Figure 6. Shear mixer used to combine the crumb rubber with the asphalt binder.

Figure 7. Fiber supply machine. Figure 8. Fiber supply hose and hose

fitting in dryer drum plant.

Experimental Feature Report

__________________________________________________________

March 2008 11

Paving Operations

Paving began on August 17, 2006 with the construction of test sections of both OGFC-

AR and OGFC-SBS. The test sections were located on Ross Avenue near the site of the Wilder

Construction Company asphalt plant. Following successful completion of the test sections, the

mainline paving began on August 19. The paving of the OGFC test sections was completed in

two consecutive weekend closures, August 19 and 20 and August 25 and 26. A summary of the

paving operation from the Inspector’s Daily Reports is listed in Table 4. One additional paving

day was needed to replace a section of the OGFC-SBS that had a rough ride and was showing

excessive raveling immediately after construction. Additional information can be found on this

problem under the section on Construction Problems.

Table 4. Paving history for OGFC-AR and OGFC-SBS.

Date Lane Milepost Limits Pavement Type Comments

August 19 Collector 181.83 – 182.27 OGFC-AR Collector lane between I-405 and SR-524.

August 19 1 181.83 – 182.59 OGFC-AR Mix temperatures from 285 to 317°F.

August 19 2 181.83 – 182.59 OGFC-AR

August 20 3 & 4 181.83 – 182.59 OGFC-AR

August 20 2 181.73 – 181.83 OGFC-SBS

August 25 3 & 4 180.76 - 181.83 OGFC-SBS Mix temperatures from 268 to 310°F. Air temperatures from 67-73°F.

August 26 1 180.76 – 181.83 OGFC-SBS Mix temperatures from 260 to 305°F. Air temperatures from 68-74°F.

August 26 2 180.76 – 181.52 OGFC-SBS Shuttle Buggy not used from Sta. 9584+00 to 9544+00.

September 23 2 180.76 – 181.52 OGFC-SBS Sta. 9584+00 to 9544+00 replaced using Shuttle Buggy

The paving of the mainline was done at night; therefore, most of the photos of the paving

operation shown below are from the paving of the test sections. The first two, Figures 9 and 10,

show the streaky application of the CRS-2P tack coat at the beginning of each pass of the

distributor truck on both the test section and mainline paving.

Experimental Feature Report

__________________________________________________________

March 2008 12

Figure 9. Tack coat application on test section.

Figure 10. Globs of excess tack on the roadway.

The second set of two photos, Figures 11 and 12, show the Ingersoll Rand PF 5510 Blaw-

Knox paver paving the OGFC-AR test section.

Figure 11. Paving the OGFC-AR test section.

Figure 12. Another view of the OGFC-AR test section paving.

The third set of two photos, Figures 13 and 14, show the Ingersoll Rand DD-130 rollers

that were used in the required static mode to compact the open-graded mix. Three rollers were

used during the mainline paving with a fourth, an Ingersoll Rand DD-110, added on occasion.

Liquid soap was added to the water in the rollers (1 gallon of dish soap to 300 gallons of water)

to prevent the rollers from sticking to the hot-mix.

Experimental Feature Report

__________________________________________________________

March 2008 13

Figure 13. Aggressive rolling of OGFC-AR test section.

Figure 14. The soap bubbles on the pavement are from the soap added to the water to prevent sticking.

The fourth set of photos, Figures 15 and 16, show the OGFC-AR mix prior to the screed

and a close-up of the mix during the compaction process.

Figure 15. OGFC-AR mix behind the material management kit prior to the screed.

Figure 16. Close-up of OGFC-AR mix during the compaction process.

The fifth set of photos, Figures 17 and 18, show the OGFC-SBS mix prior to rolling and

after compaction.

Experimental Feature Report

__________________________________________________________

March 2008 14

Figure 17. OGFC-SBS prior to rolling. Blemishes are footprints.

Figure 18. OGFC-SBS after compaction.

The final two photos from the construction process, Figures 19 and 20, show the Roadtec

Shuttle Buggy material transfer vehicle use to remix the OGFC-AR and OGFC-SBS prior to

passing it through the paving machine, and a long-distance view of the paving train. Both photos

were taken from the actual mainline paving.

Figure 19. Roadtec Shuttle Buggy materials transfer vehicle.

Figure 20. Paving train consisting of dump trucks, Shuttle Buggy, paver and rollers.

Experimental Feature Report

__________________________________________________________

March 2008 15

Cost

The bid prices for the three types of HMA used on Contract 7134 ranged from a low of

$62.50 per ton for the Class 1/2 inch HMA to a high of $130.00 per ton for the OGFC-AR. The

OGFC-SBS price was in the middle at $90.00 per ton. The estimated quantities and total cost for

each type of pavement are shown in Table 5 along with the low bid price.

Table 5. Cost comparison information.

Bid Item Estimated Quantity

(tons)

Low Bid (per ton)

Total Cost

Class 1/2” HMA 28,853 $62.50 $1,803,313

OGFC-AR 1,686 $130.00 $219,180

OGFC-SBS 2,441 $90.00 $219,690

Recycled Tire Usage

One ton of OGFC-AR contains 33.2 lbs of crumb rubber. It takes approximately 300 tons

of asphalt to pave one lane mile of pavement at a depth of 0.06 feet. Assuming that the weight of

usable rubber in an average passenger tire is 18 pounds, there would be 550 tires consumed to

produce one lane mile of OGFC-AR on this project. The total length of OGFC-AR paving

including the four mainline lanes and ramps was 5.55 miles. This project, therefore, recycled

approximately 3,050 tires.

Construction Problems

The only problem encountered during the placement of the open-graded sections was a

breakdown of the Shuttle Buggy on the final day of paving of the OGFC-SBS section. The

Contractor elected to continue to complete the section without the use of a transfer device, which

proved problematic, as the pavement had a rough riding surface and began to ravel almost

immediately. As a result, the Contractor removed and replaced this section.

Experimental Feature Report

__________________________________________________________

March 2008 16

Construction Testing

The construction process was monitored for specification compliance by the Project

Engineers staff and for temperature differentials by personnel from the Headquarters’ Materials

Laboratory Pavements Section.

Specification Compliance Testing

The gradation, percent asphalt and percent rubber for the paving of the test section and

the two days of production paving are listed in Table 6. The Special Provisions called for

acceptance to be based on meeting the gradation requirements because conventional asphalt

content testing methods do not work with rubber-asphalt binders. The data for the percent of

asphalt and rubber was from worksheets supplied by Granite Construction that listed the tons of

binder, rubber and hot mix produced for each days paving. The production results show the

gradations to be within specification limits, the asphalt content low on one day, high on the next

day, on target for the third day, and the rubber percentage on target for all three days.

Table 6. Gradation, percent asphalt and percent rubber results for OGFC-AR.

Date Sieve Target

8/17 8/19 8/19 8/20 8/20 Specification

3/8 100 99 100 100 100 100 100

#4 34 36 33 33 32 36 30-38

#8 8 8 8 7 7 8 4-8

#200 1.5 1.6 1.6 1.6 1.5 1.8 0-2.5

%AC 9.2 9.01 9.64 9.20 9.2

%CRM 22.0 22.0 22.0 22.0 22.0

The information for the OGFC-SBS, Table 7, is similar in that data is only available for

the gradations which all met the specification limits. The contract did not require that a percent

of asphalt be measured for the production paving due to the addition of SBS which also, just as

in the case of the rubber, negates normal asphalt content testing, however, one value was

calculated based on the tons of mix and binder used on August 26 and it met the mix design

recommendation.

Experimental Feature Report

__________________________________________________________

March 2008 17

Table 7. Gradation and percent asphalt results for OGFC-SBS.

Date Sieve Target

8/17 8/25 8/26 9/22 Specification

3/8 100 99 100 100 100 100

#4 37 35 37 40 41 35-55

#8 10 8 11 11 12 9-14

#200 2.1 0.8 2.3 2.5 2.0 0-2.5

%AC 8.3 8.2 - 8.3 - 8.3

In summary, both the OGFC-AR and OGFC-SBS pavements were constructed in

compliance with the mix design recommendations for aggregate gradation, asphalt content, and,

in the case of the OGFC-AR, crumb rubber content.

Temperature Monitoring

An infrared camera was used throughout the paving operation to monitor the temperature

of the mix as delivered in the dump trucks and as it passed through the paver and was placed on

the roadway. Temperature differences of as much as 160°F were noted between the crust of hot

mix that forms on top of the delivery trucks (140°F) and the hot mix under the crust (300°F).

Based on past experience, temperature differences of this magnitude would normally lead to

significant portions of the mat having density problems because the significantly cooler material

from the crust cannot be compacted. However, the Special Provisions required the use of a

Roadtec Shuttle Buggy to mitigate this problem by remixing the material prior to placement.

Figure 21 shows the typical temperature differences noted in the delivery vehicles. Spot 2 is the

crust and Spot 1 is the material under the crust that is being exposed as the bed of the truck is

raised.

Experimental Feature Report

__________________________________________________________

March 2008 18

Figure 21. Temperature differentials in a delivery truck.

Figure 22 is an infrared photo of the mix as comes out of the paver after having been

remixed by the Shuttle Buggy. The even red color across the width and length of the mat

illustrates the positive effects that remixing has on the uniformity of the temperatures across the

mat. The aforementioned was the typical image captured throughout the project when the

Shuttle Buggy was in use. As noted previously, a portion of the project was completed without

the use of the Shuttle Buggy and although this portion of the paving was not documented with

infrared images, past experience with end dumping directly into the paver would indicate that

significant temperature differentials resulted that led to the early raveling problems.

Experimental Feature Report

__________________________________________________________

March 2008 19

Figure 22. Infrared photo of the mat behind the paver showing uniform temperatures.

Temperature monitoring is important on all hot mix projects, but especially critical on

overlays that are as thin as the OGFC used on this project. Documentation of the construction

operation is included as Appendix C.

Experimental Feature Report

__________________________________________________________

March 2008 20

Post-Construction Testing

Friction

Post-construction evaluation of the two test sections of open graded pavement and the

control section of Class ½ inch HMA included measurements of friction, smoothness,

rutting/wear and noise. Table 8 contains the friction number results for the three pavement

types. Tests were performed with a ribbed tire using a locked-wheel friction tester meeting

ASTM E-274 requirements. The results indicate very good friction numbers with the values for

the control section being slightly higher than the open-graded sections, which are almost

equivalent in friction resistance. The values are all well above the required levels for adequate

friction resistance.

Table 8. October 2007 FN results.

Pavement Type Lane FN

OGFC-AR 1 48.1

OGFC-AR 2 45.3

OGFC-AR 3 44.5

OGFC-AR HOV 45.5

OGFC-AR Average 45.9

OGFC-SBS 1 46.8

OGFC-SBS 2 45.2

OGFC-SBS 3 44.0

OGFC-SBS HOV 45.1

OGFC-SBS Average 45.3

Class ½ inch HMA 1 50.2

Class ½ inch HMA 2 48.2

Class ½ inch HMA 3 47.2

Class ½ inch HMA HOV 46.9

Class ½ inch HMA Average 48.1

Experimental Feature Report

__________________________________________________________

March 2008 21

Ride

Ride and transverse profile measurements were made shortly after construction on

September 29, 2006 and then again on April 5, 2007 and August 6, 2007 using the WSDOT

Pathway Pavement Condition Collection Van. Table 9 lists the ride measurements in

International Roughness Index (IRI) (inches/mile) for each lane. Figure 23 shows a graph

comparing the four values. All of the lanes of all of the sections are showing a slight increase in

roughness with time

Table 9. IRI measurements.

IRI (in/mile) Pavement Type Lane

Sept. 2006 Apr. 2007 Aug. 2007 Oct. 2007

OGFC-AR 1 48 51 53 58

OGFC-AR 2 36 40 40 44

OGFC-AR 3 39 42 42 47

OGFC-AR HOV 39 40 43 45

OGFC-SBS 1 43 45 52 55

OGFC-SBS 2 48 49 57 59

OGFC-SBS 3 43 44 48 51

OGFC-SBS HOV 48 50 57 62

½ Inch HMA 1 64 53 71

½ Inch HMA 2 64 46 66

½ Inch HMA 3 58 51 65

½ Inch HMA HOV 71 60 72

Experimental Feature Report

__________________________________________________________

March 2008 22

0

10

20

30

40

50

60

70

80

1 2 3 HOV 1 2 3 HOV 1 2 3 HOV

AR AR AR AR SBS SBS SBS SBS 1/2-HMA 1/2-HMA 1/2-HMA 1/2-HMA

Lane and Binder

IRI

(in

/mil

e)

September 2006 April 2007 August 2007 October 2007

Figure 23. IRI measurements.

Wear/Rutting

The transverse profile measurements, which indicate the wear or rutting in the wheel

paths, is listed in Table 10 and shown graphically in Figure 24. The wear/rutting measurement

show a gradual increase over time for the SBS and control section, but the AR section follows a

different pattern. After an increase in the April readings the measurements show a gradual

decrease in wear or rutting with time.

Experimental Feature Report

__________________________________________________________

March 2008 23

Table 10. Wear/rutting measurements.

Wear/Rutting (mm) Pavement Type Lane

Sept. 2006 Apr. 2007 Aug. 2007 Oct. 2007

OGFC-AR 1 1.7 2.6 2.4 2.6

OGFC-AR 2 1.9 2.5 2.2 2.3

OGFC-AR 3 1.5 2.1 1.7 2.0

OGFC-AR HOV 1.3 1.9 1.4 1.5

OGFC-SBS 1 1.9 2.2 2.2 2.4

OGFC-SBS 2 1.7 2.4 2.8 3.0

OGFC-SBS 3 2.0 2.4 2.0 2.3

OGFC-SBS HOV 1.8 2.0 1.9 2.0

½ Inch HMA 1 1.9 1.7 2.2

½ Inch HMA 2 2.4 2.1 2.8

½ Inch HMA 3 2.2 1.9 2.6

½ Inch HMA HOV 1.8 1.4 1.9

0.0

0.5

1.0

1.5

2.0

2.5

3.0

3.5

4.0

1 2 3 HOV 1 2 3 HOV 1 2 3 HOV

AR AR AR AR SBS SBS SBS SBS 1/2-HMA 1/2-HMA 1/2-HMA 1/2-HMA

Lane and Binder

We

ar/

Ru

ttin

g (

mm

)

September 2006 April 2007 August 2007 October 2007

Figure 24. Wear/rutting measurements for all three pavement types.

Experimental Feature Report

__________________________________________________________

March 2008 24

Noise Measurement

Noise measurement is a new concept to the paving community. Therefore, the following

information on the measurement of noise is included to briefly introduce the subject.

Information provided is from an FHWA presentation by Judith L. Rochat, U.S. DOT/Volpe

National Transportation Systems Center at the Quiet Asphalt 2005 A Tire/Pavement Noise

Symposium held on November 1-3, 2005 at Purdue University, Lafayette, Indiana.

There are three types of sound measurements currently used to characterize highway

noise as noted below:

1. Source measurement: measures the effect of pavement on tire/pavement interaction source level.

2. Sound absorption measurement: measures the effect of pavement on sound absorption. 3. Wayside measurement: measures the effect of pavement on communities.

There are various ways to measure each of the three types as will be described in the

following sections.

Source Measurement

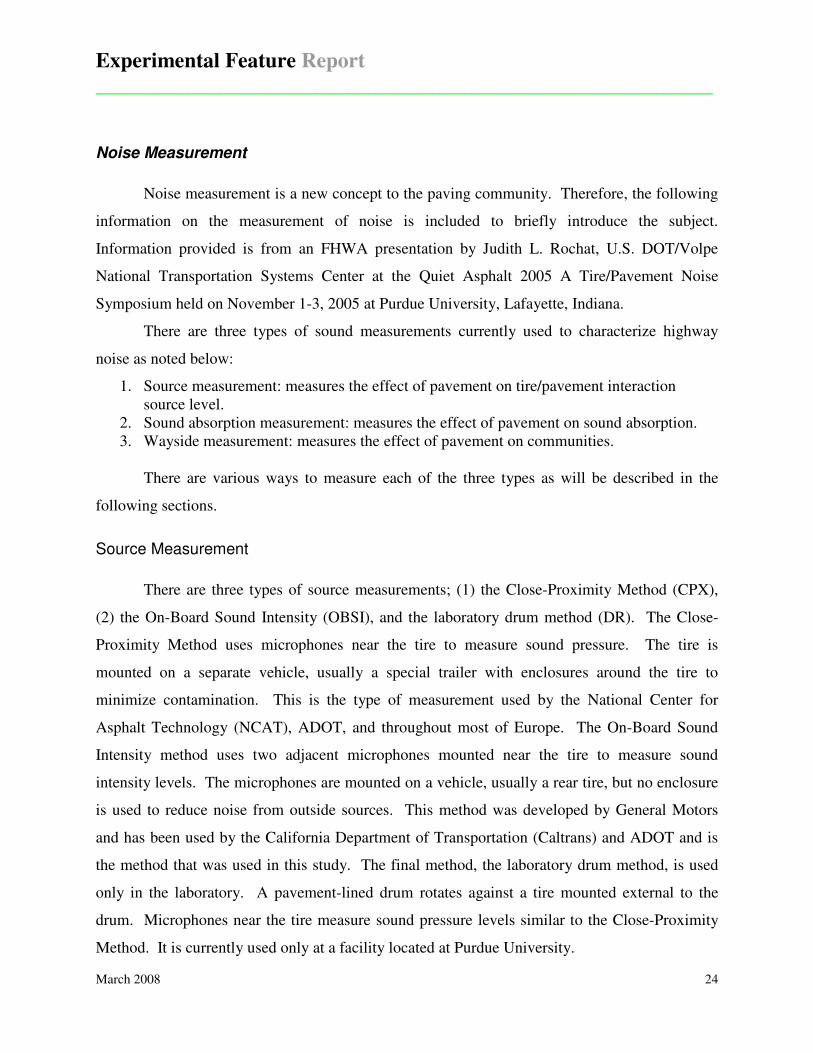
There are three types of source measurements; (1) the Close-Proximity Method (CPX),

(2) the On-Board Sound Intensity (OBSI), and the laboratory drum method (DR). The Close-

Proximity Method uses microphones near the tire to measure sound pressure. The tire is

mounted on a separate vehicle, usually a special trailer with enclosures around the tire to

minimize contamination. This is the type of measurement used by the National Center for

Asphalt Technology (NCAT), ADOT, and throughout most of Europe. The On-Board Sound

Intensity method uses two adjacent microphones mounted near the tire to measure sound

intensity levels. The microphones are mounted on a vehicle, usually a rear tire, but no enclosure

is used to reduce noise from outside sources. This method was developed by General Motors

and has been used by the California Department of Transportation (Caltrans) and ADOT and is

the method that was used in this study. The final method, the laboratory drum method, is used

only in the laboratory. A pavement-lined drum rotates against a tire mounted external to the

drum. Microphones near the tire measure sound pressure levels similar to the Close-Proximity

Method. It is currently used only at a facility located at Purdue University.

Experimental Feature Report

__________________________________________________________

March 2008 25

Sound Absorption Measurement

There are also three types of sound absorption measurements; (1) impedance tube, (2)

impulse response, and (3) ground impedance using effective flow resistivity. The impedance

tube methods takes measurement in the laboratory on core samples from the pavement. A sound

source (loudspeaker) is mounted at one end of an impedance tube and a sample of the pavement

is placed at the other end. The loudspeaker generates broadband, stationary random sound waves

that are reflected back from the sample. Sound pressure readings are taken at two points in the

tube and from these the sound absorption coefficient can be determined.

The impulse response method can be used in the laboratory or in-situ. A source of sound

is used to produce a response from the pavement surface which is then measured. It is similar to

the impedance tube method except the measurement is taken in an essentially free field, that is,

there is no confinement of the sound by a tube. There is only one microphone used and it

measures both the intensity of the source and the amount of absorption by the pavement.

The ground impedance method uses point source, two-microphone configuration set up

on a pavement surface in the field. Data is captured for multiple frequencies to characterize the

pavement.

The impedance tube method is used strictly in the laboratory. The impulse response and

ground impedance methods are used in the field but require a closure of a lane to make the

measurements.

Wayside Measurement

There are four types of wayside measurements; (1) Statistical Pass-By Method (SPB), (2)

Controlled Pass-By Method (CPB), (3) Coast-By Method (CB) and (4) Time-Averaging Method.

All four methods use a microphone set at a prescribed distance away from and height above the

roadway. The Statistical Pass-By Method measures the sparse highway traffic with a single

sound level representing a minimum of 180 single vehicle pass-bys. Traffic (counts,

categorizations, speeds) and meteorological data must be captured. SPB has been used by

Caltrans and Oregon Department of Transportation for noise studies.

Experimental Feature Report

__________________________________________________________

March 2008 26

The Controlled Pass-By Method is similar to the SPB except that a limited number of

controlled vehicles are used to generate the noise. It has been used in both Caltrans and ADOT

studies and in several European studies. The Coast-By Method is identical to the CPB except the

engine of the control vehicle is switched off during the pass-by.

The Time-Averaging Method measures the existing traffic over a prescribed time period.

Traffic (counts, categorization, and speeds) and meteorological data must be captured. The

method has been used by Caltrans, ADOT and ODOT for studies.

Noise Measurement Equipment

The On Board Sound Intensity method was the one chosen by WSDOT because the noise

produced by the tire/pavement is the only one that can be controlled by changes in the pavement

characteristics. Two adjacent microphones are mounted vertically near a tire to measure the

sound intensity levels, Figure 25. Data from the microphones is sent to the computer shown in

Figure 26. The computer collects the sound information as 11 separate data points

corresponding to frequencies from 500 to 5,000 Hz. The tire used on the vehicle is a Uniroyal

Tiger Paw AWP (P225/60R16) which is equivalent to the Goodyear Aquatred III (P205/70R15)

which is the Standard Reference Test Tire (SRTT).

Figure 25. Twin microphones mounted near the rear tire of a vehicle. Note Uniroyal Tiger Paw tire.

Figure 26. Computer used for data collection.

Experimental Feature Report

__________________________________________________________

March 2008 27

Results

Initial measurements were made on the existing HMA pavement prior to the overlay to

serve as a base line. This section ranged in age from eight to twenty years with an average of

approximately twelve years. The sound intensity readings ranged between 103.8 and 105.3 with

an average of 104.6 dBA. After completion of the open-graded overlays, sound intensity

measurements were conducted on a monthly basis, weather permitting (noise measurements

cannot be made when the pavement is wet) on all lanes of the three sections, OGFC-AR, OGFC-

SBS and Class ½ inch HMA.

Table 11 summarizes the sound intensity measurements for the OGFC-AR section. The

same information is plotted in Figure 27.

Table 11. Sound intensity measurements for OGFC-AR.

Date Lane 1 Lane 2 Lane 3 HOV Average

8/23/2006 94.7 95.0 94.9 95.7 95.1

9/7/2006 94.3 95.6 94.6 95.5 95.0

9/28/2006 96.0 95.6 96.0 96.2 96.0

10/17/ 2006 97.9 97.7 101.1 96.9 98.4

12/4/2006 98.1 97.8 96.6 95.2 96.9

12/28/2006 101.8 98.2 97.9 - 99.3

1/25/2007 100.4 98.7 - - 99.6

3/6/2007 98.9 101.1 99.3 98.8 99.5

3/21/2007 103.3 103.4 100.9 99.0 101.7

4/23/2007 100.5 101.4 99.2 97.9 99.7

5/29/2007 101.2 101.7 98.4 98.3 99.9

6/26/2007 100.5 101.5 99.0 97.1 99.5

7/26/2007 99.6 101.3 98.6 96.9 99.1

9/6/2007 100.4 101.6 98.7 96.8 99.4

9/26/2007 100.6 101.8 99.5 97.6 99.9

10/31/2007 102.4 103.6 101.1 98.8 101.5

12/6/2007 103.2 104.1 101.7 100.0 102.2

Experimental Feature Report

__________________________________________________________

March 2008 28

90

92

94

96

98

100

102

104

106

108

110

Lane #1 Lane #2 Lane #3 Lane #4 (HOV)

So

un

d I

nte

ns

ity

Le

ve

l, d

BA

8/23/2006 9/7/2006 9/28/2006 10/17/2006 12/4/2006 12/28/2006 1/25/2007

3/6/2007 3/21/2007 4/23/2007 5/29/2007 6/26/2007 7/26/2007 9/6/2007

9/26/2007 10/31/2007 12/6/2007

Figure 27. Sound intensity measurements for OGFC-AR.

All of the lanes of the OGFC-AR have increased in sound intensity level since opening to

traffic with Lane 2 showing the greatest increase and the HOV lane the least increase. All of

the lanes recorded their peak sound intensity reading during the winter of 2006-07 and appear to

be repeating that pattern based on the most recent reading on December 6.

Table 12 summarizes the measurements for the OGFC-SBS section and Figure 28 plots

those same results.

Experimental Feature Report

__________________________________________________________

March 2008 29

Table 12. Sound intensity measurements for OGFC-SBS

Date Lane 1 Lane 2 Lane 3 HOV Average

9/7/2006 96.3 95.8 96.1 95.7 96.0

9/28/2006 96.6 96.4 96.3 95.8 96.3

10/17/2006 100.1 96.9 97.0 98.1 98.0

12/4/2006 98.1 97.1 97.3 96.7 97.3

12/28/2006 101.8 101.3 98.9 96.9 99.7

1/25/2007 98.1 100.1 - - 99.1

3/6/2007 97.2 98.6 98.8 98.0 98.2

3/21/2007 102.0 101.7 99.5 98.9 100.5

4/23/2007 100.0 100.2 98.4 98.8 99.4

5/29/2007 100.2 100.1 98.2 98.3 99.2

6/26/2007 99.8 99.8 97.4 97.6 98.7

7/26/2007 99.2 98.8 96.7 97.1 96.0

9/6/2007 97.9 98.6 96.6 97.4 97.6

9/26/2007 100.3 99.0 97.0 97.5 98.5

10/31/2007 100.8 99.6 98.1 98.4 99.2

12/6/2007 101.6 100.7 97.9 99.0 99.8

90

92

94

96

98

100

102

104

106

108

110

Lane #1 Lane #2 Lane #3 Lane #4 (HOV)

So

un

d In

ten

sit

y L

evel, d

BA

8/23/2006 9/7/2006 9/28/2006 10/17/2006 12/4/2006 12/28/2006 1/25/2007

3/6/2007 3/21/2007 4/23/2007 5/29/2007 6/26/2007 7/26/2007 9/6/2007

9/26/2007 10/31/2007 12/6/2007

Figure 28. Sound intensity measurements for OGFC-SBS.

Experimental Feature Report

__________________________________________________________

March 2008 30

The pattern of the sound intensity measurements on the OGFC-SBS section was similar

to the OGFC-AR section with all lanes showing an increase throughout the winter months and a

decrease during the spring and summer and then another increase through the fall and winter.

The December and March measurements were the highest sound intensity readings for the 2006-

07 winter for all of the lanes except the HOV which had peaks in October and March.

The measurements on the Class ½ inch HMA used on the remainder of the project are

shown in Table 13 and in Figure 29.

Table 13. Sound intensity measurements for Class 1/2 inch HMA.

Date Lane 1 Lane 2 Lane 3 HOV Average

8/23/2006 99.5 100.0 99.0 99.2 99.4

9/7/2006 97.8 99.5 99.2 98.8 98.8

9/28/2006 97.7 99.1 99.1 99.8 98.9

10/17/2006 100.4 100.0 100.2 100.6 100.3

12/4/2006 100.1 100.7 99.8 100.8 100.3

12/28/2006 102.1 102.0 101.5 101.6 101.8

1/25/2007 101.3 101.7 101.3 100.9 101.3

3/6/2007 100.6 101.5 101.4 102.5 101.5

3/21/2007 102.1 102.9 102.4 101.8 102.3

4/23/2007 101.7 102.2 101.5 100.5 101.5

5/29/2007 102.5 102.3 101.8 100.5 101.8

6/26/2007 100.8 101.2 100.4 99.8 100.6

7/26/2007 101.6 101.5 101.6 100.4 101.3

9/6/2007 101.7 102.0 100.2 99.8 100.9

9/26/2007 101.8 102.2 101.6 100.6 101.6

10/31/2007 103.2 103.4 102.6 101.7 102.7

12/6/2007 103.4 103.3 102.1 101.6 102.6

Experimental Feature Report

__________________________________________________________

March 2008 31

90

92

94

96

98

100

102

104

106

108

110

Lane #1 Lane #2 Lane #3 Lane #4 (HOV)

So

un

d I

nte

ns

ity

Le

ve

l, d

BA

8/23/2006 9/7/2006 9/28/2006 10/17/2006 12/4/2006 12/28/2006 1/25/2007

3/6/2007 3/21/2007 4/23/2007 5/29/2007 6/26/2007 7/26/2007 9/6/2007

9/26/2007 10/31/2007 12/6/2007

Figure 29. Sound intensity measurements for Class ½ inch HMA.

The ½ inch HMA showed the same trend as the OGFC-AR and OGFC-SBS with an

increase over the winter months and a decrease during the spring and summer of 2007 and then

back up during the fall to the present reading on December 6, 2007. The level of increase during

the winter was of a lesser magnitude than either the OGFC-AR or OGFC-SBS sections and the

overall variation throughout the year did not fluctuate as widely as either of the open-graded

mixes.

The sound intensity levels for all three pavement types show erratic results through the

winter months and then show a dip through the spring and summer before increasing again in the

fall and winter. There could be several explanations for this phenomena; (1) temperature may

affect either the pavement or the measuring equipment, (2) the voids in the pavement surface are

being filled with fine material during the winter sanding season and then flushed out in the spring

Experimental Feature Report

__________________________________________________________

March 2008 32

and summer, and (3) the use of studded tires from October 1 through March 31 may be

producing additional small aggregate particles that are filling the voids along with the sand

mentioned previously. The Class ½ inch HMA section does not show as much of the up and

down pattern as the two open-graded mixes which may give strong support to the theory that the

void structure is being filled in the open-graded pavements and causing the rise in sound

intensity levels. The HMA also does not show the wide variations in readings that were noted in

the first winter for the AR and SBS sections, but does show the dip in levels through the warmer

spring and summer months. Therefore, there could be two causes operating simultaneously, void

filling and temperature. Additional data collection is necessary before a definite conclusion can

be drawn.

Noise Measurement Analysis

A comparison of the sound intensity readings for the new HMA, the OGFC-AR and the

OGFC-SBS is shown in Table 14. The September 2006 and September 2007 measurements

were chosen for the comparison in an attempt to minimize the affects of either temperature or

void filling on the readings. The average sound intensity level for all lanes of the asphalt rubber

section increased from 95.0 dBA to 99.9 dBA, an increase of 4.9 dBA. In contrast the average

for the OGFC-SBS and Class ½ inch HMA control section only increased 2.5 and 2.8 dBA,

respectively. The increase for individual lanes for the OGFC-AR ranged between 2.1 dBA and

6.3 dBA and between 0.9 and 4.0 dBA for the OGFC-SBS section. The range of increase for the

Class ½ inch HMA control section was 1.8 to 4.0 dBA.

Table 14. Change in sound intensity level (dBA) from September 2006 to

September 2007.

Section Lane 1 Lane 2 Lane 3 HOV All Lanes

Asphalt Rubber 6.3 6.2 4.9 2.1 4.9

SBS 4.0 3.2 0.9 1.8 2.5

Class½ inch HMA 4.0 2.7 2.4 1.8 2.8

Experimental Feature Report

__________________________________________________________

March 2008 33

The average sound intensity level for the OGFC-AR lanes was 99.9 dBA in September of

2007. Comparing this to the average sound intensity level of the control section of Class ½ inch

HMA lanes, which is a 101.6 dBA, there is a difference of only 1.7 dBA. The same comparison

between the OGFC-SBS lanes and the control section result in a difference of 3.1 dBA (101.6-

98.5). The literature indicates that a change of 1 to 3 dBA is “just perceptible” to the human ear

and it is only at a level of 5 dBA that a change is “noticeable” (Quiet Asphalt 2005).

Additional sound intensity measurements were made on September 6, 2007 to determine

if the pavement that has not experienced as much concentrated traffic (i.e. the center of the lane)

has the same or different sound intensity levels as the wheel path. Two runs were made for each

pavement type and each position in Lane 2 only. Figure 30 shows the results from the runs and

the initial readings taken after construction. The OGFC-SBS and Class ½ inch HMA are almost

the same as the initial readings right after construction. In contrast, the OGFC-AR reading in the

center of the lane is 1.1 dBA higher than the initial post-construction measurement. A

comparison of the readings between those made in the wheel paths and those made in the center

of the lane reveals that the noise levels in the wheel paths for the OGFC-SBS and Class ½ inch

HMA are about 2.6 and 2.4 dBA higher, respectively, than in the center of the lane. The OGFC-

AR is 4.9 dBA higher in the wheel path than in the center of the lane, indicating the likelihood

that more damage from studded tires is occurring.

Experimental Feature Report

__________________________________________________________

March 2008 34

102.0

98.6

96.7

96.0

101.6

99.6

99.5

95.895.6

92.0

94.0

96.0

98.0

100.0

102.0

104.0

Class 1/2 inch HMA OGFC-AR OGFC-SBS

So

un

d I

nte

ns

ity

Le

ve

l (d

BA

)

Wheelpath Center of Lane 9/7/2006 Readings

Figure 30. Sound intensity level variation with position in the lane and in comparison to the initial post-construction readings.

Splash and Spray

One of the attributes of open-graded pavements is its ability to reduce the splash and

spray from vehicles during periods of rain. The interconnected void structure of the pavement

allows the rain to infiltrate into the pavement and make its way to the shoulder through these

interconnected passages. The result is almost no splash and spray. This attribute, however, does

not always last the life of the pavement. The void structure of the pavement is susceptible to

filling with sand sized particles deposited from vehicles or as a result of sanding during snowy

winter periods. This clogging of the voids occurred in as little as three years on the open-graded

pavements built in the early 1980’s.

The only method of measuring a pavements ability to reduce splash and spray is visual

observation. A telephone call to NW Region Maintenance Superintendent, Jim Danninger,

Experimental Feature Report

__________________________________________________________

March 2008 35

confirmed that the two sections of open-graded pavement do have less splash and spray than the

surrounding dense-graded pavements as of the summer of 2007.

Long-Term Performance

The long-term performance of both the OGFC-AR and OGFC-SBS are of special interest

to WSDOT given its past history with open-graded pavements. Appendix D contains an in-

house report from September of 1995 on the performance of past-generation open-graded

pavements which are also called Class D mixes. WSDOT first started using these types of

pavements in the late 1970’s. The use of these pavements was short lived, however, due to

rutting and raveling problems that caused many to not reach their targeted eight year life.

Sections of open-graded mix built on heavily traveled urban interstates lasted as few as four

years with the most common life being seven to eight years. Open-graded pavements placed on

roadways with less traffic performed much better as can be seen in Figure 31 which plots the

time to a 1/2 inch rut against average daily traffic (ADT) per lane. The data plotted is from 56

sections of open-graded pavement built between early 1978 and 1997 (a complete listing of all

56 sections is found in Appendix E). The ½ inch rut depth was the trigger for scheduling

rehabilitation because of the safety issue with respect to the potential for hydroplaning and their

minimal thickness of 3/4 to 1 inch.

Experimental Feature Report

__________________________________________________________

March 2008 36

R2 = 0.2826

0

2

4

6

8

10

12

14

16

18

0 5,000 10,000 15,000 20,000 25,000

ADT Per Lane

Years

to

1/2

In

ch

Ru

t D

ep

th

Class DPavement Life

Linear (Class DPavement Life)

Figure 31. OGFC pavement life for various amounts of traffic.

The life of open-graded pavements was not only dependent on traffic, but also on the

number of vehicles using studded tires. The Eastern Region has one of the highest percentages

of vehicles with studded tires and as a result has a history of problems with pavement wear. A

few sections reached an age of eight years, but in general the life span was in the four to six year

range, which is not acceptable. As a result, all of the 147 lane miles of open-graded pavements

in the Region were resurfaced with dense graded mixes by 1995.

The Southwest Region’s experience was similar to that of the Eastern Region. Excessive

wear of most of their sections occurred between the seventh and eighth year, sometimes earlier.

Studded tires are not as big an issue in the Southwest Region; however, there are some

indications that wear from the use of tire chains may have also contributed to the excessive wear.

The other factor that contributed to the shortened life of the open-graded pavements was the

heavy concentration of traffic, since most of the sections were on I-5 in the Vancouver urban

area.

Experimental Feature Report

__________________________________________________________

March 2008 37

The South Central Region has one of the best performance histories for these types of

pavements, probably due to lower traffic volumes, less studded tire use and more favorable

climatic conditions. The favorable climatic conditions are warm, dry summers and winters

without much snow.

The short service life coupled with the higher cost of this type of pavement (Eastern

Region documented that the Class D mixes were 1.73 times more expensive than Class B dense

graded mix) resulted in WSDOT’s discontinued use of this mix type in September of 1995.

Experimental Feature Report

__________________________________________________________

March 2008 38

Conclusions

The special test sections of OGFC-AR and OGFC-SBS were constructed, from all

indications, according to the specifications. The use of an MTV insured that the mix going into

the paving machine was uniform in temperature and as a result no significant temperature

differentials were observed in the mat behind the paver. Post-construction testing also confirmed

that the pavement placed was up to standards and suitable for the long-term evaluation of the

benefits of open-graded pavements with respect to friction resistance, ride, rutting, splash and

spray and tire/pavement noise mitigation.

The conclusions that can be drawn from the data currently available are:

• The OGFC-SBS pavement is performing better than the asphalt rubber binder pavement

with respect to tire/pavement noise mitigation.

• The difference in sound intensity levels between the control section of Class ½ inch

HMA and the OGFC-SBS section is at the “just perceptible” level to the human ear.

• The differences between the sound intensity levels of the OGFC-AR section and the

control section or OGFC-SBS section are not perceptible to the human ear.

• Studded tire wear is having a significant negative impact on the sound intensity

measurements on all sections with the OGFC-AR section showing the greatest increase in

dBA level since construction.

Experimental Feature Report

__________________________________________________________

March 2008 39

Future Research

This project will be monitored for a period of at least five years with data collected on

friction, ride, wear, splash and spray and noise. Annual reports will be issued that summarize the

changes in each of the variables mentioned previously. A final report will be written at the

conclusion of the evaluation period. Details of the evaluation plan can be found in Appendix F.

Experimental Feature Report

__________________________________________________________

March 2008 40

References

Quiet Asphalt 2005: A Tire/Pavement Noise Symposium, November 1-3, 2005, Lafayette, Indiana. Asphalt Pavement Alliance, Institute for Safe, Quiet and Durable Highways, North Central Superpave Center, and Purdue University, 2005.

Experimental Feature Report

__________________________________________________________

March 2008 41

Appendix A

Mix Designs

Experimental Feature Report

__________________________________________________________

March 2008 42

ARIZONA DEPARTMENT OF TRANSPORTATION MATERIALS GROUP

414 AR ACFC Mix Design Lab # 2006-09050 Date: 07/17/2006

This design meets ADOT Specifications

Tracs # XM12201X Project # XM12201X Project Name: WSDOT C-7134 Resident Engineer: Contractor: WILDER CONSTRUCTION COMPANY

General Design Information

lab# 2006-16133 CRA Grade CRA-2 CRA Source CRA Specific Gravity 1.041 lab# 2006-16132 PG Grade PG64-22 PG source PG Specific Gravity 1.017 lab# 2006-00364 Rubber Type B Rubber Source CRM % by wt of asphalt cement 22.0 Admixture Type NONE Design% 0.0 Admix Source Admix Specific Gravity Total number of stockpiles: 3 Aggregate lab# Description Pit# Design % 1. 2006-00353 3/8” Chips B335 72 2. 2006-00352 #4-8 Sand B335 20 3. 2006-00351 #4-0 B335 8 4. 5. 6. 7. Total 100%

Composite Gradation

Sieve # Specification band Gradation w/o admix Gradation w/admix Field Target Band

% passing min max

% passing % passing % passing min max

1 ½”

1”

¾”

½”

3/8”

¼”

#4

#8

#10

#16

#30

#40

#50

#100

#200

100

30 45

4 8

0.0 2.5

100

100

100

100

100

64

34

8

7

5

4

3

2

1

1.5

Composite Aggregate Properties

Property Test Value min max

L.A. Abrasion % at 100 revolutions (AASHTO T96) 3 9 L.A. Abrasion % at 500 revolutions (AASHTO T96) 13 40 Sand Equivalent (AZ 242) 58 45 Two Fractured Faces, % (AZ 212) 95 85 Flakiness Index, % (AZ 238) 14 25 Carbonates, % (AZ 238) 0.9 30 Combined O.D. Specific Gravity (AZ 210) 2.679 2.35 2.85 Corrected Combined O.D. Specific gravity (with admix) 2.679 Combined Water Absorption, % (AZ 814) 1.31 2.50

Experimental Feature Report

__________________________________________________________

March 2008 43

Calculated Mix Properties Results

Description Design Values Specification Limits Design Binder Content 9.2 Bulk Density pcf 119.9 Asphalt Absorption 0.26 < 1.0

Stockpile Gradations

2006-00354 2006-00352 2006-00351 3/8” Chips #4-8 Sand #4-0 Sieve #

1 ½” 100 100 100 1” 100 100 100 ¾” 100 100 100 ½” 100 100 100 3/8” 100 100 100 ¼” 51 98 99 #4 15 77 95 #8 2 4 70 #10 2 2 64 #16 1 1 50 #30 1 0 36 #40 1 0 30 #50 0 0 25 #100 0 0 18 #200 0.4 0.1 13.7

Laboratory Aggregate Specific Gravity Test Results

Type O.D. Sp. Gr. SSD Sp. Gr. Water Absorption % Tested On

Fine (AZ 211) 2.503 2.585 3.26 -#8

Coarse (AZ 210) 2.695 2.726 1.11 -#8

Laboratory Rice Data (AZ 806)

% Asphalt Maximum Specific Gravity Maximum Density – pcg Effective Specific Gravity

4.0 2.536 158.0 2.697

This design has been prepared and submitted under the direction of: Lab Supervisor: Hu, Changming Bituminous Engineer: Simpson, Don Remarks: The design is acceptable on the condition that the 3/8” chips are scalped to remove material retained on the

3/8” sieve. Design approved by: ________________________________

Experimental Feature Report

__________________________________________________________

March 2008 44

Experimental Feature Report

__________________________________________________________

March 2008 45

Experimental Feature Report

__________________________________________________________

March 2008 46

Experimental Feature Report

__________________________________________________________

March 2008 47

Washington State Department of Transportation - Materials Laboratory

PO Box 47365 Olympia / 1655 S 2nd Ave. Tumwater / WA 98504 BITUMINOUS MATERIALS SECTION - TEST REPORT

TEST OF: OPEN GRADED FRICTION COARSE (OGFC) WORK ORDER NO: 007134 DATE SAMPLED: 6/28/2006 LAB ID NO: 0000230062 DATE RECVD HQS: 7/6/2006 TRANSMITTAL NO: 230062 SR NO: 5 MIX ID NO: G61681 SECTION: 52nd AVENUE WEST TO SR 526, SB PAVING AND SAFETY --------------------------------------------------------------CONTRACTOR’S PROPOSAL----------------------------------------------------- Mat’l: 3/8” CHIPS #4-0 #4 - #8 SAND COMBINED SPECIFICATIONS Source: B-335 B-335 B-335 Ratio: 66% 13% 21% 3/8” 99.8 100.0 100.0 100 100 No. 4 12.3 93.9 78.4 37 35 – 55 No. 8 1.2 63.2 4.3 10 9 – 14 No. 200 0.7 12.0 0.5 2.1 0 – 2.5 ------------------------------------------------------------------------LABORATORY ANALYSIS------------------------SPECIFICATIONS—

ASPH% BY TOTAL WT OF MIX: 7.8 8.3 8.8 % VOIDS @ Ndes: 50 18.8 18.3 19.4 15.0 Min. % VMA @ Ndes: 50 31.1 31.4 33.3 24.0 Min. % Gmm @ Ndes: 50 81.3 81.7 80.7 82.0 Max. Draindown @ 339°F 0.0 0.0 0.1 0.3 Max. Stabilizing Additive 0.3 0.3 0.3 0.2 – 0.5 Gmm – MAX S. G. FROM RICE 2.427 2.417 2.392 Gmb – BULK S. G. OF MIX 1.972 1.976 1.929 Gsb – OF AGGREGATE BLEND 2.638 2.638 2.638 Gsb – OF FINE AGGREGATE 2.551 2.551 2.551 Gb – SPECIFIC GRAVITY OF BINDER 1.025 1.025 1.025

---------------------------------------------------------LOTTMAN STRIPPING EVALUATION-------------------------------------------------- % ANTI-STRIP 0.0% 1/4 % 1/2 % 3/4 % 1.0% Visual Appearance: SLIGHT NONE NONE NONE NONE % Retained Strength: 84 107 115 113 139 ------------------------------------------------------------------RECOMMENDATIONS------------------------------------------------------------- SUPPLIER U.S. OIL GRADE PG70-22 % ASPHALT (BY TOTAL MIX) 8.3 % ANTI-STRIP (BY WT. ASPHALT) 0.25 TYPE OF ANTI-STRIP ARR-MAZ 6500 MIX ID NUMBER G61681 MIXING TEMPERATURE 346°F COMPACTION TEMPERATURE 316°F

Headquarters: T152 - 3 REMARKS: Revised report to reflect adjusted asphalt content

Construction Engineer----------------X T153 - and completed mix design test data, 8/24/06.

Materials File--------------------------X T166 - 3

General File----------------------------X T172 -

Bituminous Section------------------ X T175 -

Region: Northwest T178 - 1

Construction Office- 41 ----------X THOMAS E. BAKER, P.E. Materials Eng------- 41 ----------X Materials Engineer P.E.: M. LENSSEN --X(2) By: Dennis M. Duffy P.E. ____________________ (360)709-5420 Date: 8 / 24 / 2006

Experimental Feature Report

__________________________________________________________

March 2008 48

Appendix B

Special Provisions

Experimental Feature Report

__________________________________________________________

March 2008 49

Description The first paragraph of Section 5-04.1 is supplemented with the following:

(******) This work shall consist of providing and placing Quieter Pavement overlays consisting of Open Graded Friction Course (OGFC) and Open Graded Friction Course Asphalt-Rubber (OGFC-AR) on the existing roadway in accordance with these Specifications and lines, grades, thicknesses, and typical cross-sections shown in the Plans and shall meet the requirements for hot-mix asphalt as modified herein. OGFC shall consist of a mixture of asphalt, mineral aggregate, mineral filler, and other additives properly proportioned, mixed and applied on a paved surface. OGFC-AR shall consist of a mixture of rubberized asphalt, mineral aggregate, mineral filler and other additives properly proportioned, mixed and applied on a paved surface.

Materials The first paragraph of Section 5-04.2 is supplemented with the following:

(******) Portland Cement, Type II 9-02.1(1) Hydrated Lime ASTM C 1097

The third paragraph of Section 5-04.2 is supplemented with the following:

(******) The use of RAP shall not be used in the OGFC or OGFC-AR.

The fourth paragraph of Section 5-04.2 is supplemented with the following:

(******) Asphalt binder material for the OGFC shall be PG 70-22. SBS modifier shall be added to the neat asphalt to produce a binder that complies with the requirements for PG 70-22. Asphalt binder material for the OGFC-AR shall be asphalt-rubber conforming to the requirements of Asphalt Rubber (A). The crumb rubber gradation shall conform to the requirements of Asphalt-Rubber (B). In no case shall the asphalt-rubber be diluted with extender oil, kerosene, or other solvents. Any asphalt-rubber so contaminated shall be rejected. Asphalt-Rubber

(A) Asphalt Binder Asphalt binder shall be PG 58-22 or PG 64-22 conforming to the requirements of 9-02, Bituminous Materials.

Experimental Feature Report

__________________________________________________________

March 2008 50

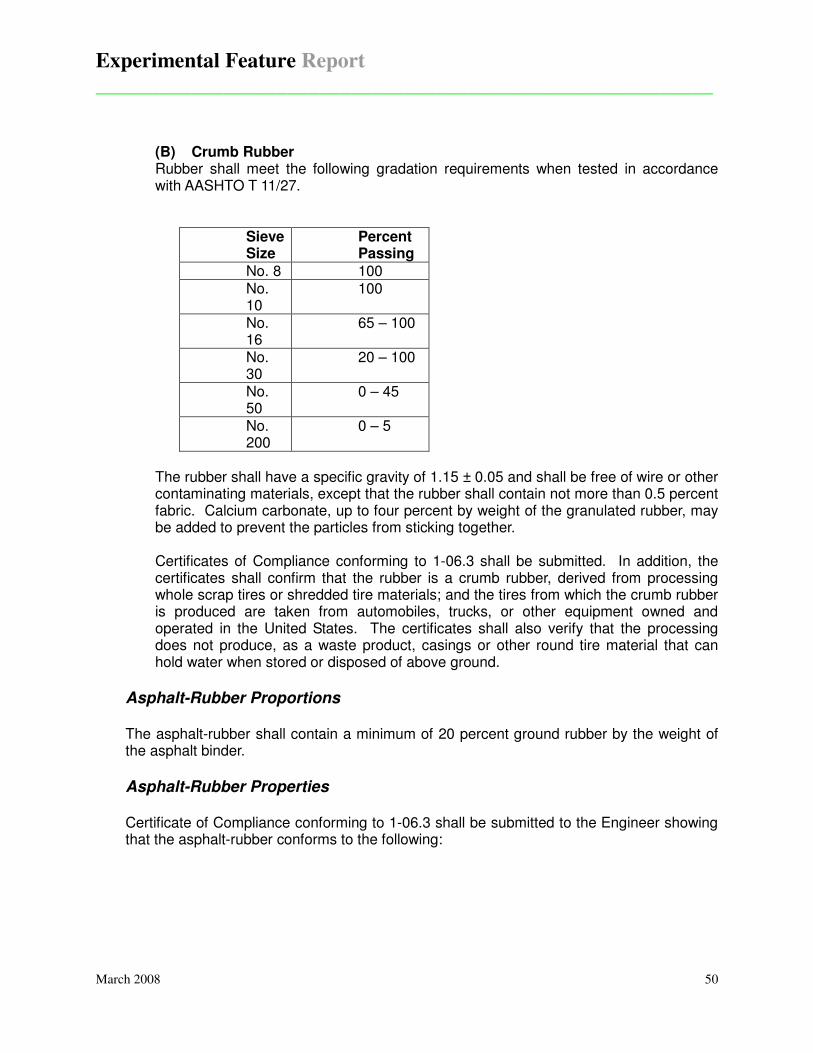
(B) Crumb Rubber Rubber shall meet the following gradation requirements when tested in accordance with AASHTO T 11/27.

Sieve Size

Percent Passing

No. 8 100 No. 10

100

No. 16

65 – 100

No. 30

20 – 100

No. 50

0 – 45

No. 200

0 – 5

The rubber shall have a specific gravity of 1.15 ± 0.05 and shall be free of wire or other contaminating materials, except that the rubber shall contain not more than 0.5 percent fabric. Calcium carbonate, up to four percent by weight of the granulated rubber, may be added to prevent the particles from sticking together. Certificates of Compliance conforming to 1-06.3 shall be submitted. In addition, the certificates shall confirm that the rubber is a crumb rubber, derived from processing whole scrap tires or shredded tire materials; and the tires from which the crumb rubber is produced are taken from automobiles, trucks, or other equipment owned and operated in the United States. The certificates shall also verify that the processing does not produce, as a waste product, casings or other round tire material that can hold water when stored or disposed of above ground.

Asphalt-Rubber Proportions

The asphalt-rubber shall contain a minimum of 20 percent ground rubber by the weight of the asphalt binder.

Asphalt-Rubber Properties

Certificate of Compliance conforming to 1-06.3 shall be submitted to the Engineer showing that the asphalt-rubber conforms to the following:

Experimental Feature Report

__________________________________________________________

March 2008 51

* The viscotester used must be correlated to a Rion (formerly Haake) Model VT-04 viscotester using the No. 1 Rotor. The Rion viscotester rotor, while in the off position, shall be completely immersed in the binder at a temperature from 350 to 355 F for a minimum heat equilibrium period of 60 seconds, and the average viscosity determined from three separate constant readings (± 0.5 pascal seconds) taken within a 30 second time frame with the viscotester level during testing and turned off between readings. Continuous rotation of the rotor may cause thinning of the material immediately in contact with the rotor, resulting in erroneous results. Asphalt-Rubber Binder Design

At least two weeks prior to the use of asphalt-rubber, the Contractor shall submit an asphalt-rubber binder design prepared by one of the following laboratories who have experience in asphalt-rubber binder design:

MACTEC Engineering and Consulting, Inc. Contact: Anne Stonex Address: 3630 East Wier Avenue Phoenix, Arizona 85040 Phone: (602) 437-0250 Western Technologies, Inc. Contact: John Hahle Address: 2400 East Huntington Drive Flagstaff, Arizona 86004 Phone: (928) 774-8700

Such design shall meet the requirements specified herein. The design shall show the values obtained from the required tests, along with the following information: percent, grade and source of the asphalt binder used; and percent, gradation and source(s) of rubber used.

Construction Requirements Section 5-04.3 shall be supplemented with the following:

(******)

Property Requirement

Rotational Viscosity*: 350 oF; pascal seconds

1.5 - 4.0

Penetration: 39.2 oF, 200 g, 60 sec. (ASTM D 5); minimum

15

Softening Point: (ASTM D 36); oF, minimum

130

Resilience: 77 oF (ASTM D 5329); %, minimum

25

Experimental Feature Report

__________________________________________________________

March 2008 52

During production of asphalt-rubber, the Contractor shall combine materials in conformance with the asphalt-rubber design unless otherwise approved by the Engineer. Direct transfer of the OGFC and OGFC-AR from the hauling equipment to the paving machine will not be allowed. A Shuttle Buggy will be required to deliver the OGFC and OGFC-AR from the hauling equipment to the paving machine. Mixing of Asphalt-Rubber The temperature of the asphalt binder shall be between 350 and 400°F at the time of addition of the ground rubber. No agglomerations of rubber particles in excess of two inches in the least dimension shall be allowed in the mixing chamber. The ground rubber and asphalt binder shall be accurately proportioned in accordance with the design and thoroughly mixed prior to the beginning of the one-hour reaction period. The Contractor shall document that the proportions are accurate and that the rubber has been uniformly incorporated into the mixture. Additionally, the Contractor shall demonstrate that the rubber particles have been thoroughly mixed such that they have been “wetted.” The occurrence of rubber floating on the surface or agglomerations of rubber particles shall be evidence of insufficient mixing. The temperature of the asphalt-rubber immediately after mixing shall be between 325 and 375°F. The asphalt-rubber shall be maintained at such temperature for one hour before being used. Prior to use, the viscosity of the asphalt-rubber shall be tested and conform to the asphalt-rubber properties, which is to be furnished by the Contractor or supplier.

Handling of Asphalt-Rubber Once the asphalt-rubber has been mixed, it shall be kept thoroughly agitated during periods of use to prevent settling of the rubber particles. During the production of asphaltic concrete the temperature of the asphalt-rubber shall be maintained between 325 and 375°F. However, in no case shall the asphalt-rubber be held at a temperature of 325°F or above for more than 10 hours. Asphalt-rubber held for more than 10 hours shall be allowed to cool and gradually reheated to a temperature between 325 and 375°F before use. The cooling and reheating shall not be allowed more than one time. Asphalt-rubber shall not be held at temperatures above 250°F for more than four days.

For each load or batch of asphalt-rubber, the contractor shall provide the Engineer with the following documentation:

1.The source, grade, amount and temperature of the asphalt binder prior to the addition of rubber.

2.The source and amount of rubber and the rubber content expressed as percent by the weight of the asphalt binder.

3.Times and dates of the rubber additions and resultant viscosity test. 4.A record of the temperature, with time and date reference for each load or batch.

The record shall begin at the time of the addition of rubber and continue until the load or batch is completely used. Readings and recordings shall be made

Experimental Feature Report

__________________________________________________________

March 2008 53

at every temperature change in excess of 20°F, and as needed to document other events which are significant to batch use and quality.

HMA Mixing Plant Section 5-04.3(1) shall be is supplemented with the following:

(******) Fiber Supply System When fiber stabilizing additives are required for OGFC, a separate feed system that meets the following will be required:

1) Accurately proportions by weight the required quantity into the mixture in such

a manner that uniform distribution will be obtained. 2) Provides interlock with the aggregate feed or weigh systems so as to maintain

the correct proportions for all rates of production and batch sizes. a) Controls dosage rate accurately to within plus or minus 10 percent of

the amount of fibers required. b) Automatically adjusts the feed rate to maintain the material within the 10

percent tolerance at all times. c) Provides flow indicators or sensing devices for the fiber system that are

interlocked with plant controls so that mixture production will be interrupted if introduction of the fiber fails or if the output rate is not within the tolerances given above.

3) Provides in-process monitoring, consisting of either a digital display of output or a printout of feed rate, in pounds per minute to verify the feed rate.

When a batch type plant is used, the fiber shall be added to the aggregate in the weigh hopper or as approved by the Engineer. The batch dry mixing time shall be increased by 8 to 12 seconds, or as directed by the Engineer, from the time the aggregate is completely emptied into the mixer. The fibers are to be uniformly distributed prior to the injection of the asphalt binder into the mixer. When a continuous or drier-drum type plant is used, the fiber shall be added to the aggregate and uniformly dispersed prior to the injection of asphalt binder. The fiber shall be added in such a manner that it will not become entrained in the exhaust system of the dryer or plant.

Surge and Storage Systems The storage time for OGFC mixtures not hauled immediately to the project shall be no more than 4 hours.

Hot Mix Asphalt Pavers Section 5-04.3(3) is supplemented with the following:

(******) For OGFC and OGFC-AR the direct transfer of these materials from the hauling equipment to the paving machine will not be allowed. A Shuttle Buggy shall be used to deliver the OGFC and OGFC-AR from the hauling equipment to the paving machine.

Experimental Feature Report

__________________________________________________________

March 2008 54

The Shuttle Buggy shall mix the OGFC and OGFC-AR after delivery by the hauling equipment but prior to laydown by the paving machine. Mixing of the OGFC and OGFC-AR shall be sufficient to obtain a uniform temperature throughout the mixture.

Rollers Section 5-04.3(4) is supplemented with the following:

(******) The wheels of the rollers used for Quieter Pavement shall be wetted with water, or if necessary soapy water, or a product approved by the Engineer to prevent the OGFC or OGFC-AR from sticking to the steel wheels during rolling. A minimum of three static steel wheel rollers, weighing no less than eight tons, shall be provided. The drums shall be of sufficient width that when staggered, two rollers can cover the entire lane width. Vibratory rollers must be used in the static mode only. A pass shall be defined as one movement of a roller in either direction. Coverage shall be the number of passes as are necessary to cover the entire width being paved. Two rollers shall be used for initial breakdown and be maintained no more than 300 feet behind the paving machine. The roller(s) for final compaction shall follow as closely behind the initial breakdown as possible. As many passes as is possible shall be made with the rollers before the temperature of the OGFC or OGFC-AR falls below 220 °F.

Preparation Of Existing Surfaces Section 5-04.3(5)A is supplemented with the following:

(******) For OGFC and OGFC-AR, a tack coat of CRS-2 or CRS-2P shall be applied to the existing surface at a rate of 0.12 to 0.20 (0.08 to 0.12 residual) gallons per square yard or as otherwise directed by the Engineer. (NWR February 9, 2004) The Contractor shall limit the amount of tack coat placed to that amount that will be fully covered by the asphalt overlay at the end of each work shift. In accordance with Section 1-07.15(1) Spill Prevention, Control and Countermeasures Plan (SPCC), as part of the SPCC the Contractor shall address the mitigating measures to be taken in the event that the paving operation is suspended or terminated prior to the asphalt for tack coat being fully covered.

Mix Design Section 5-04.3(7)A is supplemented with the following:

Experimental Feature Report

__________________________________________________________

March 2008 55

(******) 4. Mix Design (OGFC-AR) Approximately 500 pounds of produced mineral

aggregate, in proportion to the anticipated percent usage, shall be obtained that are representative of the mineral aggregate to be utilized in the OGFC-AR production.

The Contractor shall also furnish representative samples of the following materials: a five-pound sample of the crumb rubber proposed for use, one gallon of asphalt binder from the intended supplier, five gallons of the proposed mixture of binder and rubber, and a one-gallon can of the mineral admixture to be used in the OGFC-AR.

Along with the samples furnished for mix design testing, the contractor shall submit a letter explaining in detail its methods of producing mineral aggregate including wasting, washing, blending, proportioning, etc., and any special or limiting conditions it may propose. The Contractor’s letter shall also state the source(s) of mineral aggregate, the source of asphalt binder and crumb rubber, the asphalt-rubber supplier, and the source and type of mineral admixture. The above materials and letter shall be shipped to the Arizona DOT Central Laboratory at 1221 North 21st Avenue, Phoenix, AZ 85009 (Attention – Julie Nodes), with companion materials and letter sent to the WSDOT State Materials Laboratory in Tumwater. Within 10 working days of receipt of all samples and the Contractor’s letter in the Arizona DOT Central Laboratory, the Arizona DOT will provide the Contractor with the percentage of asphalt-rubber to be used in the mix, the percentage to be used from each of the stockpiles of mineral aggregate, the composite mineral aggregate gradation, the composite mineral aggregate and mineral admixture gradation, and any special or limiting conditions for the use of the mix.

Mix Design (OGFC) Mixtures shall be compacted with 50 gyrations of a Superpave Gyratory Compactor and the draindown at the mix production temperature (AASHTO T 305) shall be 0.3 max.

5. Mix Design Revisions. The Contractor shall not change its methods of

crushing, screening, washing, or stockpiling from those used during production of material used for mix design purposes without approval of the Engineer, or without requesting a new mix design.

During production of OGFC and OGFC-AR, the Contractor, on the basis of field test results, may request a change to the approved mix design. The Engineer will evaluate the proposed changes and notify the contractor of the Engineer’s decision within two working days of the receipt of the request. If, at any time, unapproved changes are made in the source of bituminous material, source(s) of mineral aggregate, production methods, or proportional changes in violation of approved mix design stipulations, production shall

Experimental Feature Report

__________________________________________________________

March 2008 56

cease until a new mix design is developed, or the Contractor complies with the approved mix design. At any time after the mix design has been approved, the Contractor may request a new mix design. The costs associated with the testing of materials in the developing of mix designs after a mix design acceptable to the Department has been developed shall be borne by the Contractor.

If, during production, the Engineer on the basis of testing determines that a change in the mix design is necessary, the Engineer will issue a revised mix design. Should these changes require revisions to the Contractor's operations which result in additional cost to the Contractor, it will be reimbursed for these costs.

6. Fiber Stabilizing Additives. If needed, fiber stabilizing additives shall consist

of either cellulose fibers, cellulose pellets or mineral fibers and meet the properties described below. Dosage rates given are typical ranges but the actual dosage rate used shall be approved by the Engineer.

A. Cellulose Fibers: Cellulose fibers shall be added at a dosage rate between 0.2% and 0.5% by weight of the total mix as approved by the Engineer. Fiber properties shall be as follows:

1. Fiber length: 0.25 inch (6 mm) max.

2. Sieve Analysis

a. Alpine Sieve Method

Passing No. 100 sieve:

60-80%

b. Ro-Tap Sieve Method Passing No. 20 sieve: Passing No. 40 sieve: Passing No. 100 sieve:

80-95% 45-85% 5-40%

3. Ash Content: 18% non-volatiles (±5%)

4. pH: 7.5 (±1.0)

5. Oil Absorption: (times fiber weight)

5.0 (±1.0)

6. Moisture Content: 5.0% max.

Experimental Feature Report

__________________________________________________________

March 2008 57

B. Cellulose Pellets: Cellulose pellets shall consist of cellulose fiber and may be blended with up to 20% asphalt cement. If no asphalt cement is used, the fiber pellet shall be added at a dosage rate between 0.2% and 0.5% by weight of the total mix. If asphalt cement is blended with the fiber, the pellets shall be added at a dosage rate between 0.4% and 0.8% by weight of the total mix.

1. Pellet size: 1/4 in³ (6 mm³) max.

2. Asphalt: 25 - 80 pen.

C. Mineral Fibers: Mineral fibers shall be made from virgin basalt, diabase, or slag and shall be treated with a cationic sizing agent to enhance disbursement of the fiber as well as increase adhesion of the fiber surface to the bitumen. The fiber shall be added at a dosage rate between 0.2% and 0.5% by weight of the total mix.

1. Size Analysis:

Average Fiber length: 0.25 in. (6 mm) max. Average Fiber thickness: 0.0002 in. (0.005mm) max.

2. Shot content (ASTM C1335)

Passing No. 60 sieve (250 µm): 90 - 100%

Passing No. 230 sieve (63 µm): 65 - 100%

Acceptance Sampling and Testing – HMA Mixture Section 5-04.3(8)A is revised as follows:

Item 3 is supplemented with the following:

(******) Sampling - OGFC and OGFC-AR OGFC and OGFC-AR will be evaluated for quality of gradation based on samples taken from the cold feed bin.

Item 5 is supplemented with the following:

(******) Test Results - OGFC and OGFC-AR Mineral Aggregate Gradation - OGFC For the OGFC, a sample shall be taken in accordance with WSDOT T-2 on a random basis just prior to the addition of mineral admixture and bituminous materials. At least one sample shall be taken during the production of the OGFC. Samples will be tested for conformance with the mix design gradation. The gradation of the mineral aggregate shall be considered to be acceptable, unless average of any three consecutive tests or the result of any single test varies from the mix design gradation percentages as follows:

Experimental Feature Report

__________________________________________________________

March 2008 58

Passing

Sieve

Mixture

Control

Tolerance

⅜ Inch ± 5.7

No. 4 ± 5.5

No. 8 ± 4.5

No. 200 ± 2.0

(******) Mineral Aggregate Gradation - OGFC-AR For each approximate 300 tons of OGFC-AR, at least one sample of mineral aggregate shall be taken. Samples shall be taken in accordance with WSDOT T-2 on a random basis just prior to the addition of mineral admixture and bituminous materials. Samples will be tested for conformance with the mix design gradation. The gradation of the mineral aggregate shall be considered acceptable, unless the average of any three consecutive tests or the result of any single test varies from the mix design gradation percentages as follows:

Number of Tests Passing

Sieve 3 Consecutive One

No. 4 ± 4 ± 4

No. 8 ± 3 ± 4

No. 200 ± 1.0 ± 1.5

(January 3, 2006) The first paragraph of item 5 is revised to read:

The Engineer will furnish the Contractor with a copy of the results of all acceptance testing performed in the field within either 24 hours of sampling or four hours after the beginning of the next paving shift, whichever is later. The Engineer will also provide the Composite Pay Factor (CPF) of the completed sublots after three sublots have been produced. The CPF will be provided by the midpoint of the next paving shift after sampling results are completed.

The first sentence in the second paragraph of item 5 is revised to read:

Sublot sample test results (gradation, asphalt binder content, VMA and Va) may be challenged by the Contractor.

The third paragraph of item 5 is revised to read:

The results of the challenge sample will be compared to the original results of the acceptance sample test and evaluated according to the following criteria:

Experimental Feature Report

__________________________________________________________

March 2008 59

Deviation

U.S. No. 4 sieve and larger Percent passing ±4.0 U.S. No. 8 sieve Percent passing ±2.0 U.S. No. 200 sieve Percent passing ±0.4 Asphalt binder % Percent binder content ±0.3 VMA % Percent VMA ±1.5 Va % Percent Va ±0.7

The last sentence of item 75 is revised to read:

The calculation of the CPF in a test section with a mix design that did not verify will include gradation, asphalt binder content, VMA and Va.

Item 7 is supplemented with the following:

(******) Test Section - OGFC A mixture test section shall be constructed off-site prior to production paving of the OGFC. The test section shall be used to determine if the mix meets the requirements of mineral aggregate gradation and recommended asphalt binder content. For the test section to be acceptable the mineral aggregate gradation shall be within the limits as shown in 5-04.3(8)A as supplemented and the asphalt content varies by no more than ±0.5 percent. Test Section - OGFC-AR A mixture test section shall be constructed off-site prior to production paving of the OGFC-AR. The test section shall be used to determine if the mix meets the requirements of mineral aggregate gradation and recommended asphalt-rubber binder content. For the test section to be acceptable the mineral aggregate gradation shall be within the limits as shown in 5-04.3(8)A as supplemented and the asphalt-rubber content varies by no more than ±0.5 percent.

Compaction (NWR March 1, 2004) Control The first sentence of item 1 in Section 5-04.3(10)B is revised to read:

HMA used in traffic lanes, including lanes for ramps, truck climbing, weaving, speed change, and shoulders, and having a specified compacted course thickness greater than 0.10 foot, shall be compacted to a specified level of relative density.

Experimental Feature Report

__________________________________________________________

March 2008 60

Joints Section 5-04.3(12) is supplemented with the following:

(NWR May 9, 2005) Transverse Joint Seal The Contractor shall construct contraction joints at the bridge ends/bents as shown in the Plans. The joints shall be sawed to the dimensions shown in the Plans and filled with joint sealant filler meeting the requirement of Section 9-04.2(1). Joints shall be thoroughly clean and dry at the time of sealing. Care shall be taken to avoid air pockets. The compound shall be applied in two or more layers, if necessary.

Planing Bituminous Pavement Section 5-04.3(14) is supplemented with the following:

(January 5, 2004) The Contractor shall perform the planing operations no more than *** five *** calendar days ahead of the time the planed area is to be paved with HMA, unless otherwise allowed by the Engineer in writing. (January 5, 2004) At the start of the planing operation the Contractor shall plane a 500 foot test section to be evaluated by the Engineer for compliance with the surface tolerance requirements. The test section shall have a minimum width of 10 feet. If the planing is in accordance with the surface tolerance requirements, the Contractor may begin production planing. If the planing is not in conformance with the surface tolerance requirements, the Contractor shall make adjustments to the planing operation and then plane another test section. If at any time during the planing operation the Engineer determines the required surface tolerance is not being achieved, the Contractor shall stop planing. Planing shall not resume until the Engineer is satisfied that specification planing can be produced or until successful completion of another test section. The forward speed during production planing shall not exceed the speed used for the test section. The completed surface after planing and prior to paving shall not vary more than 1/4 inch from the lower edge of a 10-foot straightedge placed on the surface parallel or transverse to the centerline. The planed surface shall have a matted texture and the difference between the high and low of the matted surface shall not exceed 1/8 inch. Pavement repair operations, when required, shall be accomplished prior to planing. (January 3, 2006) Transverse Joints The full depth end of each lane of planing shall be squared off to form a uniform transverse joint. The Contractor shall construct and maintain a temporary HMA wedge in accordance with Section 5-04.3(11) across the entire width of the transverse edge when traffic is allowed on the planed surface prior to paving. The wedge shall be

Experimental Feature Report

__________________________________________________________

March 2008 61

constructed before opening the lane to traffic. The Contractor shall remove the wedge immediately prior to paving. (NWR May 9, 2005) Transverse Joint Seal The Contractor shall construct contraction joints at the bridge ends/bents as shown in the Plans. The joints shall be sawed to the dimensions shown in the Plans and filled with joint sealant filler meeting the requirement of Section 9-04.2(1). Joints shall be thoroughly clean and dry at the time of sealing. Care shall be taken to avoid air pockets. The compound shall be applied in two or more layers, if necessary.

Weather Limitations Section 5-04.3(16) is supplemented with the following:

(******) The mixing and placing of OGFC and OGFC-AR shall not be performed when the existing pavement is wet or frozen. OGFC and OGFC-AR shall not be placed when the air temperature is less than 55°F.

Measurement Section 5-04.4 is supplemented with the following:

(******) Open-Graded Friction Course and Open-Graded Friction Course Asphalt Rubber will be measured by the ton in accordance with Section 1-09.2, with no deduction being made for the weight of asphalt binder, blending sand, mineral filler or any other component of the mixture. (NWR May 9, 2005) Transverse joint seal will be measured by the linear foot of joint sealed.

Payment Section 5-04.5 is supplemented with the following:

(******) “Open Graded Friction Course”, per ton. "Open Graded Friction Course" - Asphalt Rubber”, per ton. The unit contract price per ton for “Open-Graded Friction Course” and “Open-Graded Friction Course Asphalt Rubber” shall be full compensation for all costs incurred to carry out the requirements of Section 5-04 except for those costs included in other items which are included in this sub-section and which are included in the proposal. (NWR May 9, 2005) “Transverse Joint Seal”, per linear foot. The unit contract price for “Transverse Joint Seal” shall be full pay to complete the work as specified.

Experimental Feature Report

__________________________________________________________

March 2008 62

Price Adjustment for Quality of HMA The first paragraph of Section 5-04.5(1)A is revised to read:

Statistical analysis of quality of gradation, asphalt content and volumetric properties will be performed based on Section 1-06.2 using the following price adjustment factors:

Table of Price Adjustment Factors Constituent Factor “f” VMA (Voids in mineral aggregate) 30 Va (Air Voids) 30 All aggregate passing 1/2" 2 All aggregate passing 3/8" 2 All aggregate passing U.S. No. 4 2 All aggregate passing U.S. No. 8 15 All aggregate passing U.S. No. 200 15 Asphalt Binder Content 30

The first two sentences of the second paragraph are revised to read:

A pay factor will be calculated for sieves listed as a control point for the class of HMA, for the asphalt binder and volumetric properties (VMA and Va).

Experimental Feature Report

__________________________________________________________

March 2008 63

Appendix C

Comments on Construction of Open-Graded Pavements

Experimental Feature Report

__________________________________________________________

March 2008 64

Lynnwood Quite Pavements

I-5, 52nd

Avenue to SR-526

Construction Comments

The comments within this document are only those of Jim Weston, Pavement Implementation Engineer, and are not necessarily the views of the WSDOT.

TACK APPLICATION

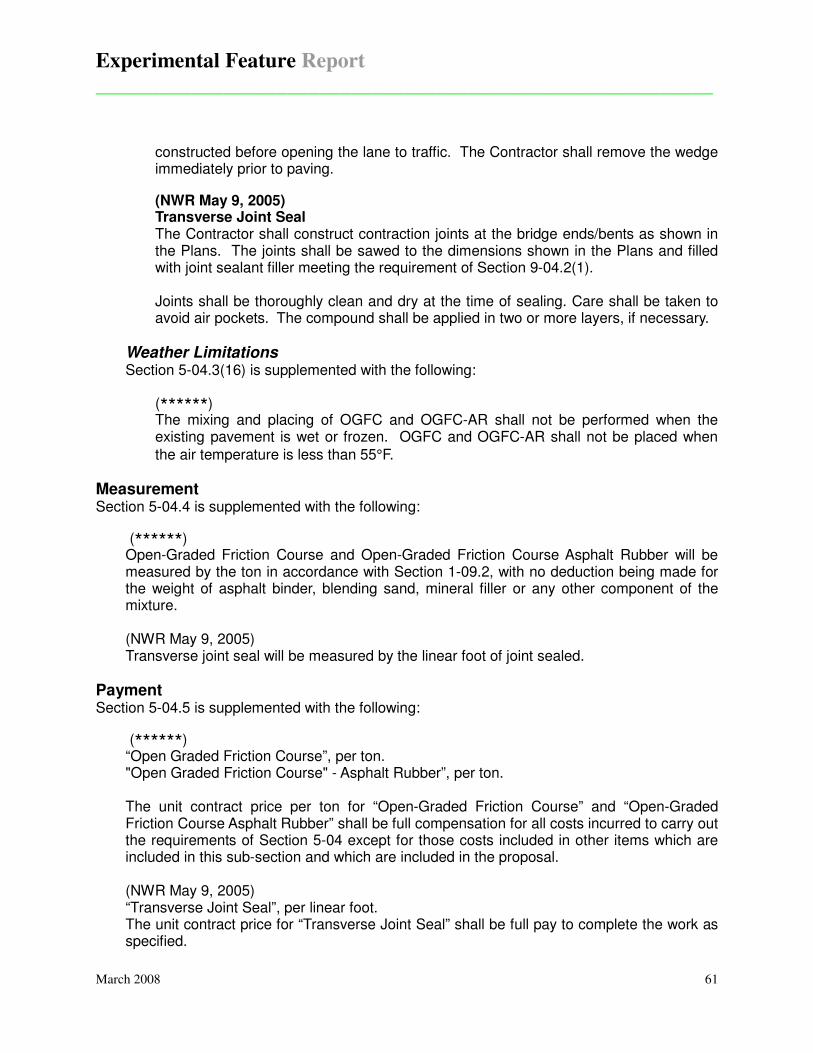
The tack coat for both the OGFC test sections was applied by an Etnyre tack truck. The application of the CRS-2P tack was sporadic at the start of each application but generally very uniform after 500 feet of application. However, there were areas where high application rate caused problems. In these locations, the excess tack coat was picked up by the Shuttle Buggy tires and then deposited on the existing pavement surface as a mound of material. These mounds of cool tack coat would show up in the OGFC-SBS overlay as a cold spot or globule. This did not happen with the OGFC-AR. Tracking of the tack coat by the Shuttle Buggy and delivery trucks was observed in the wheelpaths. The amount of tracking was minimal in areas of good coverage but was somewhat substantial in areas that received light coverage (startup locations).

Figure 32. Image of typical tack application with some pickup visible in the wheelpaths.

DELIVERY VEHICLES

The use of tarps on the HMA delivery trucks and trailers was very sporadic throughout the paving operations. Thermal camera readings of the hot mix in the trucks showed that a cool crust of material had developed that was at a temperature as low as 101ºF whereas the internal temperatures of the mix were at, or above, 300ºF. This project was fortunate to have warmer paving temperatures than are typically seen on night pavers in Western Washington.

Experimental Feature Report

__________________________________________________________

March 2008 65

Figure 33. Thermal image of trailer showing cool crust on the HMA at 101° F and internal temperature of 303° F.

MATERIAL TRANSFER VEHICLE

A ROADTEC Shuttle Buggy (SB) material transfer vehicle was used throughout this project. The remixing and storage capabilities of this vehicle made it a smart choice for this project because of the thinness (1/2 inch) of the overlay and the fact that all paving was to be done at night when temperatures are generally cooler. Temperatures from the SB into the paver hopper were typically around 300ºF. The insulating and remixing capability of this device allowed for the pavement to have consistent temperatures across the mat and behind the screed. On the last night of paving and last lane paved, the SB encountered mechanical problems. A decision was made to continue without the SB in order to complete the project that night. This proved to be a poor decision as this section of pavement began to ravel shortly after placement due to the inconsistencies in the density of the mat caused by thermal differentials. The raveling problems resulted in the Contractor having to remove and replace the defective pavement.

Experimental Feature Report

__________________________________________________________

March 2008 66

Figure 34. Thermal image of the mix as it leaves the Shuttle Buggy and enters the paver hopper at 302° F and exits the screed at 300° F.

Figure 35. Image from back of screed looking towards the rollers (not shown).

PAVER

A Blaw-Knox PF-5510 paver equipped with what looked like was a 12-ton paver hopper box and a UltiMat screed. This paver was also outfitted with a retrofit kit that kept the screed from being starved at the gearbox. The only paver related problems had to do with the screed. When the screed was extended a cool area of mix would form on the outside edge of the extension. This cool mix would work its way to the front of the screed and then show up in the mat behind the screed.

Experimental Feature Report

__________________________________________________________

March 2008 67

Figure 36. Thermal image looking at augers where spot 1 is typical temperature and spot 2 is where the mix would cool and slowly work to the front of the extended screed.

Figure 37. Lower temperature mix behind the screed extension (spot 1) and the higher temperature mix at the middle of the paver (spot 2).

A remedy for the problem of cool mix from the extended screed is probably an auger extension which was not practical for this project that only used the extension for shoulder paving.

The other item, also discussed in Rollers was that of the longitudinal joint. It is important to know that the screed should only allow for the material to be approximately ½ inch above the existing joint. Of course this may change slightly depending on the mix design but an OGFC will generally compact in the same manner.

Experimental Feature Report

__________________________________________________________

March 2008 68

ROLLERS

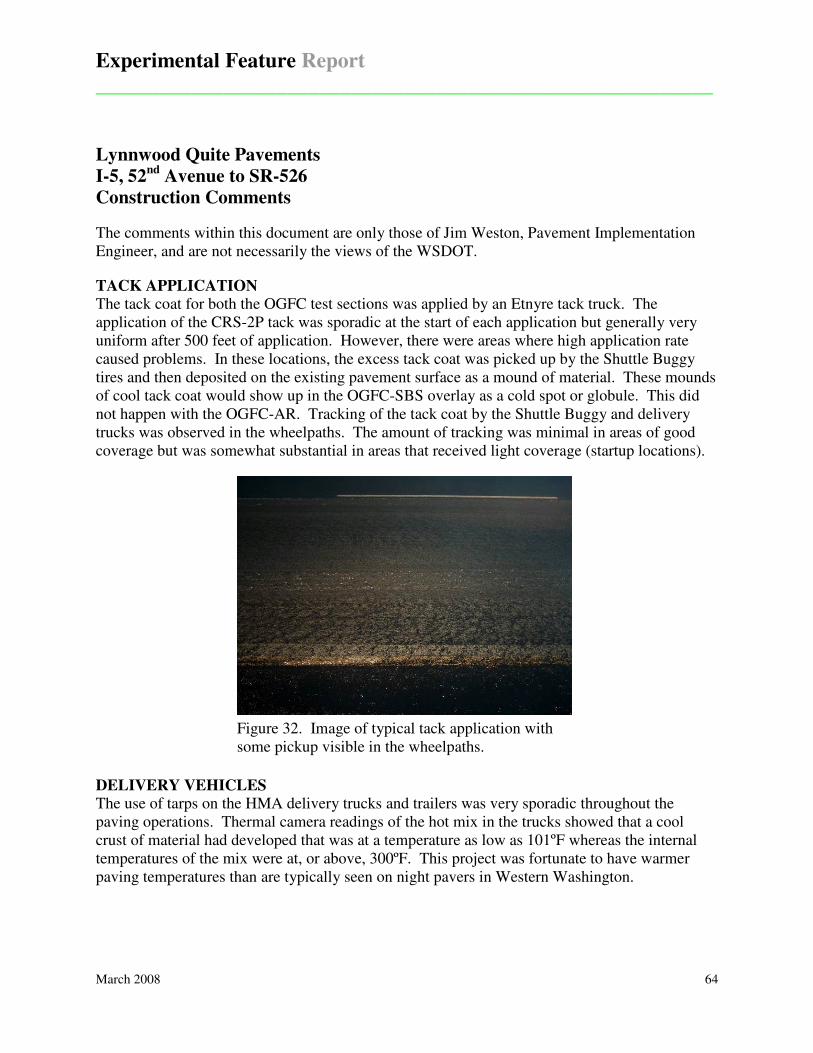
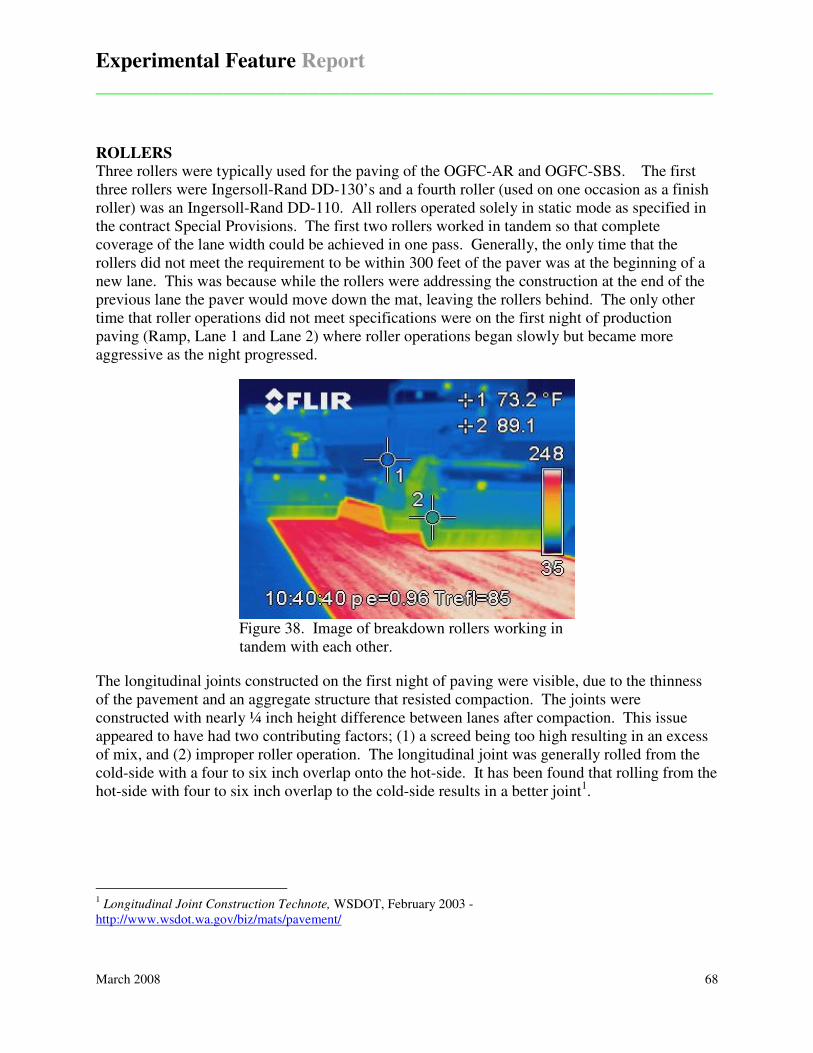
Three rollers were typically used for the paving of the OGFC-AR and OGFC-SBS. The first three rollers were Ingersoll-Rand DD-130’s and a fourth roller (used on one occasion as a finish roller) was an Ingersoll-Rand DD-110. All rollers operated solely in static mode as specified in the contract Special Provisions. The first two rollers worked in tandem so that complete coverage of the lane width could be achieved in one pass. Generally, the only time that the rollers did not meet the requirement to be within 300 feet of the paver was at the beginning of a new lane. This was because while the rollers were addressing the construction at the end of the previous lane the paver would move down the mat, leaving the rollers behind. The only other time that roller operations did not meet specifications were on the first night of production paving (Ramp, Lane 1 and Lane 2) where roller operations began slowly but became more aggressive as the night progressed.

Figure 38. Image of breakdown rollers working in tandem with each other.

The longitudinal joints constructed on the first night of paving were visible, due to the thinness of the pavement and an aggregate structure that resisted compaction. The joints were constructed with nearly ¼ inch height difference between lanes after compaction. This issue appeared to have had two contributing factors; (1) a screed being too high resulting in an excess of mix, and (2) improper roller operation. The longitudinal joint was generally rolled from the cold-side with a four to six inch overlap onto the hot-side. It has been found that rolling from the hot-side with four to six inch overlap to the cold-side results in a better joint1.

1 Longitudinal Joint Construction Technote, WSDOT, February 2003 - http://www.wsdot.wa.gov/biz/mats/pavement/

Experimental Feature Report

__________________________________________________________

March 2008 69

Figure 39. Image of the mismatch at the longitudinal joint.

The only way that roller operations could have adhered to the 300-foot specification would be if the paver slowed down at the beginning of the new lane. This would require coordination with the plant and the timing of the delivery trucks so that all of the operations slowed down at the same time. As it was on this project trucks were lined up waiting to transfer their loads to the SB. The result was that the mix cooled in the trucks and thus the start of the next lane had some cooler pavement temperatures.

Figure 40. Thermal image of construction joint at startup.

OGFC-AR

OGFC-AR was sticky and adhered to the paving equipment (i.e.: rakes, truck beds, SB tires, etc.). It was difficult to work with this material around utilities, catch basins, and other objects and create a good appearing mat. The sticky nature of the mix resulted in the liberal use of

Experimental Feature Report

__________________________________________________________

March 2008 70

release agents on all of the equipment including the tires of the Shuttle Buggy because it had begun to lift the CRS-2P that was now sticking to the tires. It was thought that this action might affect the long-term performance of the OGFC-AR because it would not have proper adhesion to the existing pavement surface.

Temperatures recorded direction behind the paver where generally between 280 ºF to 290ºF. These temperatures were consistent with those measured in Arizona when paving with the same mix.

OGFC-SBS

The OGFC-SBS was even stickier then the OGFC-AR. It also appeared to be more influenced by the CRS-2P tack coat. As the paver passed over a globule of CRS-2P, it would appear as a cold spot in the mat which, if not removed, became a CRS-2P in the pavement. It is not known to what degree this will affect pavement performance, if at all. This also occurred during the paving of the test section.

Figure 41. Thermal image of a cool glob of CRS-2P in the newly place OGFC-SBS surface.

OTHER ISSUES

Other issues that were present but not necessarily related to either OGFC-AR or OGFC-SBS was that of mix on the roadway. On two different instances, one OGFC-AR and the other OGFC-SBS, a substantial amount of material was accidentally dumped on the roadway prior to the SB.

For the OGFC-AR, when this happened the mix was picked up using the end-loader of a backhoe. The residual material was approximately ¼ - ½ inch thick and the paver paved over the top of this. This left a cooler spot in the mat where this was paved. In addition, the tires of the SB also tracked through the material that was loaded into the paver hopper. Results of this caused globs of cooler mix to reflect through the new pavement surface which ended up causing fat spots.

Experimental Feature Report

__________________________________________________________

March 2008 71

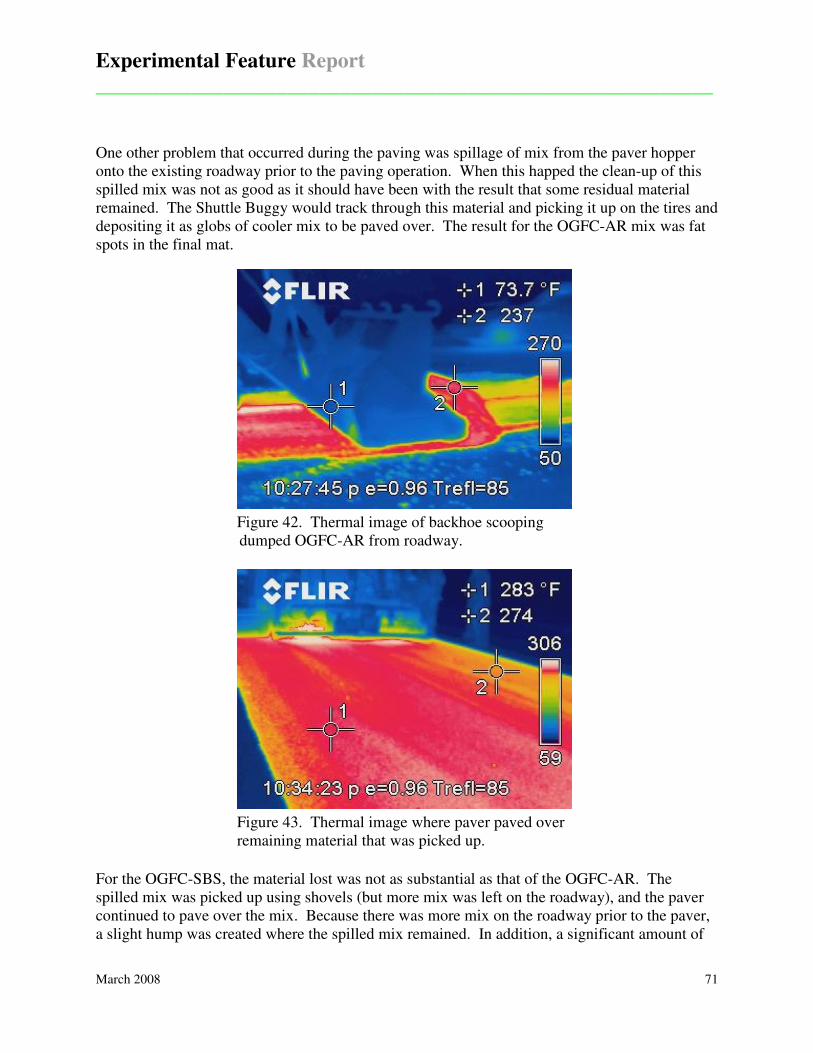
One other problem that occurred during the paving was spillage of mix from the paver hopper onto the existing roadway prior to the paving operation. When this happed the clean-up of this spilled mix was not as good as it should have been with the result that some residual material remained. The Shuttle Buggy would track through this material and picking it up on the tires and depositing it as globs of cooler mix to be paved over. The result for the OGFC-AR mix was fat spots in the final mat.

Figure 42. Thermal image of backhoe scooping dumped OGFC-AR from roadway.

Figure 43. Thermal image where paver paved over remaining material that was picked up.

For the OGFC-SBS, the material lost was not as substantial as that of the OGFC-AR. The spilled mix was picked up using shovels (but more mix was left on the roadway), and the paver continued to pave over the mix. Because there was more mix on the roadway prior to the paver, a slight hump was created where the spilled mix remained. In addition, a significant amount of

Experimental Feature Report

__________________________________________________________

March 2008 72

globs of mix were dropped on the roadway prior to the paver that reflected through. This ended up causing a considerable amount of remedial work to be done. Most of this work was involved in either removing a glob from the pavement, or placing material in a location that had material missing (this was typically caused from a glob that would drag under the paver until coming loose).

Figure 44. Thermal image of dumped material being shoveled.

Figure 45. Thermal image of paver paving over remaining material on roadway.

Experimental Feature Report

__________________________________________________________

March 2008 73

Figure 46. Image of cool spot where paver paved

over remaining mix on roadway.

RECOMMENDATIONS

• It may be of benefit on future projects that use CRS-2P as a tack coat to modify the tack specifications to ensure an even application of the material. This might include a test of the tack coat truck prior to beginning paving to ensure that all of the snivies are clean and operating properly.

• Specify that tarps be used on all trucks and trailers to ensure maximum heat retention in the mix between the plant and the paving operation.

• Specify a material transfer vehicle be used on all thin lift open-graded friction course projects.

• Specify that the retrofit kit be used on all applicable paver models.

• Specify that auger extensions be used when the screed is extended a certain specified distance.

COMMENTS

• Proper procedures need to be adhered to when matching the pavement thicknesses at the longitudinal joint and proper rolling techniques need to be employed in order to ensure a tight, flush joint.

• The temperature of the screed should be at the same temperature as the mix prior to starting the paving operation.

• All of the paving operations need to be coordinated in order to adhere to keep the rollers within 300 feet of paver.

o Slow down production at the plant at the end of the completion of one lane so that the material does not build up when the paver is being moved.

o Don’t load too many trucks prior to working at a construction joint. o Allow the rollers time to work effectively at the construction joint. o Keep the pavers moving consistently at a slow speed.

Experimental Feature Report

__________________________________________________________

March 2008 74

� Ensure the paver doesn’t begin paving out until rollers have completed the work at a construction joint.

• Minimize handwork as much as possible.

• Keep delivery trucks and MTV tires as clean as possible to avoid bringing debris into work area.

• Keep work area as clean as possible at all times. If material gets dumped onto the roadway, or build-up on tires becomes excessive, clean thoroughly. Remember that this is a thin surface and defects will reflect through.

Experimental Feature Report

__________________________________________________________

March 2008 75

Appendix D

In-House Report on Class D HMA Performance

Experimental Feature Report

__________________________________________________________

March 2008 76

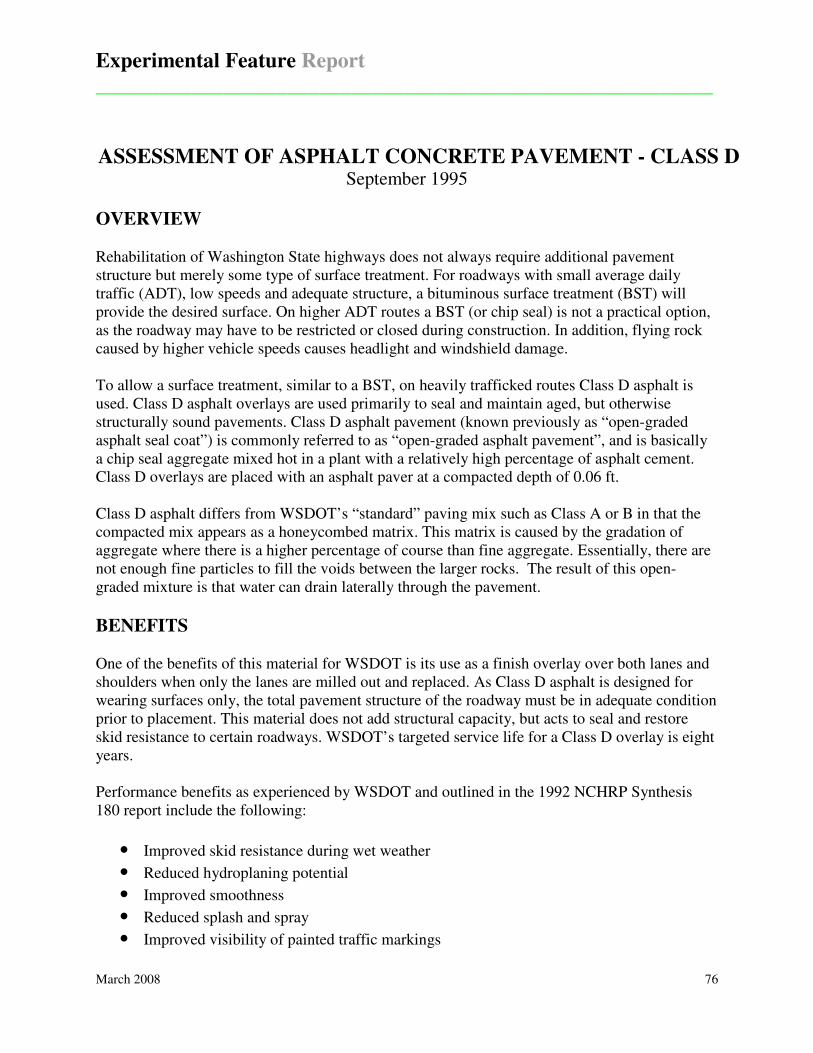
ASSESSMENT OF ASPHALT CONCRETE PAVEMENT - CLASS D September 1995

OVERVIEW Rehabilitation of Washington State highways does not always require additional pavement structure but merely some type of surface treatment. For roadways with small average daily traffic (ADT), low speeds and adequate structure, a bituminous surface treatment (BST) will provide the desired surface. On higher ADT routes a BST (or chip seal) is not a practical option, as the roadway may have to be restricted or closed during construction. In addition, flying rock caused by higher vehicle speeds causes headlight and windshield damage. To allow a surface treatment, similar to a BST, on heavily trafficked routes Class D asphalt is used. Class D asphalt overlays are used primarily to seal and maintain aged, but otherwise structurally sound pavements. Class D asphalt pavement (known previously as “open-graded asphalt seal coat”) is commonly referred to as “open-graded asphalt pavement”, and is basically a chip seal aggregate mixed hot in a plant with a relatively high percentage of asphalt cement. Class D overlays are placed with an asphalt paver at a compacted depth of 0.06 ft. Class D asphalt differs from WSDOT’s “standard” paving mix such as Class A or B in that the compacted mix appears as a honeycombed matrix. This matrix is caused by the gradation of aggregate where there is a higher percentage of course than fine aggregate. Essentially, there are not enough fine particles to fill the voids between the larger rocks. The result of this open-graded mixture is that water can drain laterally through the pavement.

BENEFITS One of the benefits of this material for WSDOT is its use as a finish overlay over both lanes and shoulders when only the lanes are milled out and replaced. As Class D asphalt is designed for wearing surfaces only, the total pavement structure of the roadway must be in adequate condition prior to placement. This material does not add structural capacity, but acts to seal and restore skid resistance to certain roadways. WSDOT’s targeted service life for a Class D overlay is eight years. Performance benefits as experienced by WSDOT and outlined in the 1992 NCHRP Synthesis 180 report include the following:

• Improved skid resistance during wet weather

• Reduced hydroplaning potential

• Improved smoothness

• Reduced splash and spray

• Improved visibility of painted traffic markings

Experimental Feature Report

__________________________________________________________

March 2008 77

• Reduced wet pavement glare at night

• Reduced noise levels

CONCERNS Initially, the performance of Class D pavements is steady as indicated by a flat performance curve. An example of a performance curve for a section on I-90, MP 245.28 to MP 249.02 follows:

Performance Curve: I-90, MP 245.28 to MP 249.02

0

20

40

60

80

100

1982 1984 1986 1988 1990 1992

Year

Pre

sen

t S

erv

iceab

ilit

y

Co

nd

itio

n

The surface condition as indicated by the present serviceability condition changes little or none for several years. Beyond a certain point, the performance curve drops off rapidly as the pavement becomes brittle, micro-cracks, and then fails quickly due to pavement deterioration (such as raveling or delamination). Typically, WSDOT attempts to resurface roads at a present serviceability condition rating of 50. The failure modes of Class D experienced by WSDOT included raveling (aggregate particles that are dislodged from the pavement) and delamination (loss of bond between pavement layers). Raveling can be caused by improper mix design, placement during cold or wet weather, and oxidation. Raveling can also be accelerated by the use of studded tires coupled with high ADT. Delamination can be caused by placement during cold or wet weather or the improper application of the tack coat. The FHWA recommends placing a fog seal at five-year intervals or at the first sign of raveling. The placement of a fog seal may delay raveling, but consequentially some of the internal drainage within the Class D matrix will be lost.

Experimental Feature Report

__________________________________________________________

March 2008 78

Some other concerns that impact the use of this material are:

• Urban areas with high volume ADT should not be considered due to the higher use of studded tires. Studded tires tend to break apart the aggregate structure and cause premature raveling.

• The beneficial effects of reduced splash and spray seems to last only two to three years depending on the amount of sanding and other fine debris that is deposited on the surface. Thus, the benefits obtained from the open-graded nature may be short lived.

• In order to obtain compaction, Class D asphalt must be placed at temperatures above 60º Fahrenheit. Where nighttime paving is required, this material may not be used. Class D overlays are placed in thin lifts and are susceptible to rapid cooling.

• On higher volume roadways consideration must be given to the effects of traffic disruptions since the life of the Class D is shorter than typical dense graded mixes.

• There can be problems with snow and ice removal. Due to the permeability of the material the retention of deicing solutions is reduced. In addition, ice tends to “stick” to the surface and causes snowplows to ride up over it and pull out aggregate from the surface matrix.

• Due to the lower service life occurring in some regions, life cycle cost analysis does not satisfy the expenditure for using the material.

WSDOT’S EXPERIENCE WSDOT has been placing Class D overlays with varied success since the early 1980’s. There are sections on Interstates 82 and 90 that were placed in the early 1980’s that are still in service. However, there are sections that were placed more recently on I-90 and I-5 that are not providing the targeted eight-year service life. During 1995, WSDOT estimated there were about 800 lane miles of Class D asphalt placed in the state. This represents less than eight percent of the statewide 10,500 lane miles. The majority of miles already in place are on the primary highway system where chip seals are not a viable option due to heavy traffic volumes. Eastern Region The Eastern Region has used Class D asphalt concrete overlays since 1980. Projects that have been selected are sections that are structurally sound but are experiencing some type of surface distress such as rutting or raveling. Five projects along I-90 totaling 36.8 miles or 147.2 lane miles have been constructed. Only 35.3 lane miles of Class D pavement remain in the Eastern Region. These remaining miles will be milled and resurfaced during 1995 leaving no Class D pavements in service.

Experimental Feature Report

__________________________________________________________

March 2008 79

Construction of the overlays on I-90 included milling the distressed lanes 0.15 ft and inlaying the lanes with a dense graded asphalt such as ACP Class B. The Class D asphalt concrete was overlaid shoulder-to-shoulder 0.06 ft thick followed by a CSS-1 fog seal. The Eastern Region has obtained varied success with Class D overlays. A summary of the construction history and the years obtained from each overlay in the Eastern Region is as follows:

Eastern Region - Class D Projects

SR

Route

Year

Constructed

Contract

No.

Location Year

Repaved

Pavement

Life

(years)

Average

Daily

Traffic 90 1982 2279 MP 191.89 to

MP 200.36 1993 111 7,800

90 1982 2293 MP 244 90 to MP 254.31

1993 111 11,600

90 1982 2058 MP 254.32 to MP 257.35

1993 111 12,100

90 1980 1869 MP 270.36 to MP 277.51

1988 8 31,000

90 1991 3958 MP 290.36 to MP 299.19

1995 4 40,000

1Noticeable rutting occurred during years seven or eight.

The table indicates some sections have lasted 11 years, well beyond the WSDOT goal of eight years. Actually, the time when rutting becomes noticeable has typically been seven or eight years. Therefore, the service life or the time when rehabilitation should have been performed was indeed closer to eight years. The service life for the project placed during 1980 was closer to six years rather than eight years. The difference in times is the time that rehabilitation was needed and actually programmed. As was indicated earlier WSDOT does not recommend Class D placement in high volume, urban areas. For the 1980 project (Contract 1869) the current ADT is 31,000. For the 1991 project (Contract 3958) the current ADT is 40,000. For the projects outside the Spokane urban area that obtained 11 years between overlays the current ADT ranges from 7,800 to 12,100. Review of the construction history shows the Eastern Region has had two Class D projects that did not perform as expected. One project, paved during 1980, was repaved eight years later and another project, paved during 1991, is being repaved during 1995. The failure mode for these projects was raveling accelerated by the use of studded tires. This raveling typically appears as ruts isolated to car wheel paths and proceeds through the full thickness of the Class D overlay.

Experimental Feature Report

__________________________________________________________

March 2008 80

Other factors may contribute to early raveling, such as late season paving. Late season projects (depending on the weather) do not always allow adequate compaction of the asphalt prior to cooling. Late season projects also do not allow curing of the asphalt before the onset of winter. Another factor that may contribute to early raveling is the mixing of Class D asphalt higher than

the recommended 235° Fahrenheit (asphalt temperatures are sometimes elevated during mixing to compensate for cooler air temperatures). When open-graded mixtures such as Class D are mixed too hot, drain down occurs. The higher mixing temperatures cause the asphalt cement to flow off the rock and settle to the bottom of the mat. The film thickness on the rock at the top of the mat becomes reduced. Heavy asphalt films on the aggregates are essential to resist stripping, oxidation, and ultimately raveling. Since environmental conditions during paving can adversely affect the performance of any pavement, the 1994 WSDOT Standard Specification was revised to prohibit paving past October 15. The October 15 deadline will improve pavement performance and reduce likelihood of problems such as early raveling. Eastern Region Class D Construction Costs Construction costs for the Eastern Regions Class D overlays were researched and are presented in the table that follows: Eastern Region - Class D Construction Costs

Year Contract Location Cost - Class B Cost - Class D

No. (ton) (sy) (ton) (sy)

1982 2279 MP 244.90 to MP 200.36 $15.90 $1.63 $23.50 $0.97 1982 2293 MP 244.90 to MP 254.31 $13.30 $1.37 $23.10 $0.95 1982 2058 MP 254.31 to MP 257.35 $22.10 $2.27 $23.29 $0.96 1992 3958 MP 290.36 to MP 299.10 $22.25 $2.29 $23.00 $0.95

The square yard prices are based on thickness of 0.15 ft for Class B and 0.06 ft for Class D overlays. The Class B and Class D prices were obtained from the same contract with the exception of the ACP Class B on Contract 3958, which was not placed on this project. A price for Class B asphalt concrete was obtained from similar projects placed during that year. It should be noted that Class B is usually placed in thicker lifts providing structural support to the roadway. The Class D overlay is merely a wearing surface that adds little structural benefit. Southwest Region The Southwest Region’s experience has been similar to the Eastern Region’s. The typical age of Class D pavements in the Southwest Region is approximately 11 years. Many Class D pavements are still in service although ruts have developed through the 0.06 ft overlays. Discussions with the region revealed noticeable rutting actually occurred during the seventh or

Experimental Feature Report

__________________________________________________________

March 2008 81

eighth year, sometimes earlier. The use of studded tires is not as extensive in the Southwest Region as in the Eastern Region; however, the Southwest Region does feel that the use of tire chains adds considerably to their Class D pavement distress. Four projects are summarized: Southwest Region - Class D Projects

SR

Route

Year

Constructed

Contract

No.

Location Year

Repaved

Pavement

Life

Average

Daily

(years) Traffic

5 1986 3044 MP 0.27 to MP 2.42

Future 10+1 80,200

5 1984 2591 MP 4.32 to MP 7.53

1996 111 56,000

5 1984 2608 MP 20.11 to MP 22.12

Future 12+1 48,400

5 1990 3522 MP 72.29 to MP 73.28 & MP 78.44 to 79.21

Future 6+ 48,000

1Noticeable rutting occurred during years seven or eight.

South Central Region The South Central Region has experienced good success with Class D pavements and have nearly 200 miles of Class D pavements that are still in service. Some pavements are currently 12 to 15 years old and have only recently raveled the full 0.06 ft thickness. Discussion with the South Central Materials Lab revealed that they have never had a Class D pavement fail in less then 10 years. Fog seals on class D pavements have not been applied. A summary of several Class D project follows: South Central Region - Class D Projects

SR

Route

Year

Constructed

Contract

No.

Location Year

Repaved

Pavement

Life

(years)1

Average

Daily

Traffic

12 1983 2339 MP 277.09 to MP 281.08

Future 12+ 26,000

12 1980 1850 MP 288.95 to MP 290.24

Future 15+ --------

12 1982 2270 MP 295.41 to MP 303.36

Programmed. 1994

13+ 9,100

12 1982 3721 MP 304.97 to 1990 8 6,200

Experimental Feature Report

__________________________________________________________

March 2008 82

SR

Route

Year

Constructed

Contract

No.

Location Year

Repaved

Pavement

Life

(years)1

Average

Daily

Traffic

12 1983 2339 MP 277.09 to MP 281.08

Future 12+ 26,000

MP 305.36 12 1984 2680 MP 314.20 to

MP 318.01 1994 10 4,800

24 1985 2957 MP 0.05 to MP 4.11

Programmed 1997

10+ 9,600

82 1982 2196 MP 0.62 to MP 3.23

1994 1 11,600

82 1984 2692 MP 23.88 to MP 29.02

Programmed 1996

11+ 12,800

82 1983 2310 MP 97.46 to MP 100.66

Programmed 1996

12+ 12,400

90 1981 1904 MP 106.34 to MP 110.00

1994 13 20,000

90 1984 2663 MP 110.00 to MP 122.23

Programmed 1998

11+ 10,400

90 1982 2231 MP 126.14 to MP 137.19

1994 13 10,400

90 1978 1012 MP 102.61 to MP 103.19

Programmed 1998

17+ 18,800

224 1982 2339 MP 7.42 to MP 9.78

1994 12 11,800

1Noticeable rutting occurred beyond 10 years

The South Central Region noted that Class D pavements that go beyond 12 years display the full 0.06 ft depth rutting such as experienced in both the Southwest and Eastern Regions. The South Central Region will continue to consider Class D pavements. Class D overlays have been placed in lieu of chip seals on select routes.

SUMMARY WSDOT should continue to consider Class D asphalt in the analysis of our pavement designs. Class D overlays have performed well for roadways outside of urban areas and may be cost effective. With recommended overlay cycles of eight years, a life cycle cost analysis is necessary to determine the cost effectiveness. To place a statewide moratorium (as some states have done) on Class D overlays may be premature. However, the use of Class D asphalt in areas of high ADT or high studded tire use should be avoided.

Experimental Feature Report

__________________________________________________________

March 2008 83

Appendix E

Performance Data for Open-Graded Pavements

Experimental Feature Report

__________________________________________________________

March 2008 84

The following table was put together by the Pavement Section of the Headquarters Materials Laboratory from historical data derived mainly from the WSPMS, but also in part from other sources within the Pavements Section.

Table 15. Open-graded pavement performance data.

Route Dir.* Beg.

MP

End

MP Region**

Contract Number

Date Constructed

Age At 1/2 Inch Rutting

ADT Per Lane

23 B 42.64 51.86 E 2293 1982 16 500

90 I 191.89 200.36 E 2279 1982 7 3,000

90 D 191.89 200.36 E 2279 1982 7 3,000

97 D 69.32 74.74 SC 4673 1995 9 3,000

970 B 0.77 5.85 SC 4627 1995 9 3,000

82 D 0.61 3.23 SC 2196 1982 11 4,000

82 I 0.63 3.22 SC 2196 1982 10 4,000

90 I 239.15 244.90 E 2058 1982 8 4,000

90 D 239.15 244.90 E 2058 1982 9 4,000

90 I 244.90 254.31 E 2293 1982 8 4,000

90 D 244.90 254.33 E 2293 1982 7 4,000

90 I 254.13 257.35 E 2058 1982 9 4,000

90 D 254.33 257.35 E 2058 1982 8.5 4,000

12 B 304.51 307.66 SC 3721 1990 14 4,000

22 B 35.98 36.45 SC 4819 1997 7 4,000

90 I 110.00 121.96 SC 2663 1984 12 4,500

90 D 110.00 121.96 SC 2663 1984 10.5 4,500

82 D 82.14 84.35 SC 4819 1997 7 5,000

12 B 302.21 305.36 SC 2270 1982 13 5,000

82 I 97.64 100.66 SC 2310 1983 9 6,000

82 D 97.64 100.66 SC 2310 1983 10 6,000

90 I 102.61 106.34 SC 1012 1978 12.3 7,000

90 D 102.61 106.34 SC 1012 1978 14 7,000

90 I 270.36 275.40 E 1869 1980 8 10,000

90 D 270.36 275.55 E 1869 1980 8 10,000

82 I 33.84 36.29 SC 4102 1993 6 12,000

82 D 33.84 36.29 SC 4102 1993 6 12,000

82 I 30.96 33.84 SC 4346 1994 4 12,500

82 D 30.96 33.84 SC 4346 1994 4 12,500

90 I 290.36 299.10 E 3958 1992 2.5 20,000

90 D 290.36 299.10 E 3958 1992 3 20,000

12 I 2.08 4.94 O XE2906 1992 7 6,000

12 D 2.08 4.94 O XE2906 1992 8 6,000

5 I 20.07 22.12 SW 2608 1984 8 8,000

5 D 20.78 22.01 SW 2608 1984 8 8,000

5 I 88.02 98.88 SC 2571 1984 8 14,000

5 D 88.02 98.88 SC 2571 1984 7.5 14,000

5 I 98.88 102.70 O 2571 1984 10 14,000

5 D 98.88 102.70 O 2571 1984 6 14,000

5 I 101.23 102.69 O 3939 1993 7 14,000

5 D 101.23 102.69 O 3939 1993 7 14,000

5 D 70.68 72.24 SW 3934 1991 8.5 15,000

5 I 72.29 73.28 SW 3522 1990 7 15,000

Experimental Feature Report

__________________________________________________________

March 2008 85

Table 16. (Continued) Open-graded pavement performance data.

Route Dir.* Beg.

MP

End

MP Region**

Contract Number

Date Constructed

Age At 1/2 Inch Rutting

ADT Per Lane

5 D 72.29 73.28 SW 3522 1990 8.5 15,000

5 D 77.55 78.44 SW 3934 1991 7 15,000

5 I 4.32 7.53 SW 2591 1984 7.5 16,000

5 D 4.32 7.53 SW 2591 1984 7.5 16,000

5 D 68.96 70.61 SW 2720 1985 8 16,000

5 I 0.27 2.42 SW 3044 1986 8 18,000

5 D 0.27 2.42 SW 3044 1986 8 18,000

5 I 78.44 79.21 O 3522 1990 8 18,000

5 D 78.44 79.21 O 3522 1990 8 18,000

5 I 82.38 83.35 O 3522 1990 8 22,000

5 D 82.38 83.35 O 3522 1990 8 22,000

5 I 135.54 139.50 O 2554 1985 4 22,000

5 D 135.54 139.50 O 2554 1985 6 22,000

*I = Increasing, D = Decreasing, B = Both (for 2 lane undivided highways) **E = Eastern, O = Olympic, SC = South Central, and SW = Southwest

Experimental Feature Report

__________________________________________________________

March 2008 86

Appendix F

Experimental Feature Work Plan

Experimental Feature Report

__________________________________________________________

March 2008 87

Washington State Department of Transportation

WORK PLAN

EVALUATION OF LONG-TERM PAVEMENT

PERFORMANCE AND NOISE CHARACTERISTICS

FOR OPEN-GRADED FRICTION COURSES

Interstate 5

52nd

Avenue West to SR-526 – Southbound

Milepost 180.10 to Milepost 189.30

Linda M. Pierce, PE State Pavement Engineer

Washington State Department of Transportation

Experimental Feature Report

__________________________________________________________

March 2008 88

Introduction

Hot-mix asphalt (HMA) open-graded friction courses (OGFC) can reduce traffic noise and splash and spray from rainfall. These performance benefits come at a cost in durability, greatly reducing pavement life compared to traditional asphalt and concrete pavements. The benefit of noise reduction, and splash and spray reduction degrades over relatively short periods of time, reducing the effectiveness of the OGFC pavement. Pavement lives of less than ten years, and as short as three to four years, have occurred with the use of OGFC pavements in Washington’s high traffic corridors. The life of asphalt based quieter pavement in the USA and around the world tends to average between 8 and 12 years. Compare this to an average pavement life of 16 years in western Washington and the loss of durability is clear. Under RCW47.05, WSDOT is instructed to follow lowest life cycle cost methods in pavement management. Less durable pavements do not meet this legislative direction.

Studded tire usage in Washington State is another complicating factor. Studded tires rapidly damage OGFC pavements, resulting in raveling and wear. When OGFC was used on I-5 in Fife, the pavement had significant wear in as little as four years. States where the use of OGFC has been successful (Florida, Texas, Arizona and California) do not experience extensive studded tire usage. Similarly, these states are southern, warm weather states; a clear advantage when placing a product like OGFC with asphalt-rubber. Arizona DOT, for example, requires the existing pavement to have an 85°F surface temperature at the time of placement. Washington State urban pavements, placed at night to avoid traffic impacts, rarely reach this temperature during the available nighttime hours for paving (10:00 p.m. to 5:00 a.m.), even in summer. Other pavements and bridge decks reach such temperatures at night only on rare occasions, making successful placement of rubberized OGFC difficult or impossible at night.

Plan of Study

The objective of this research study will be to determine the long-term pavement performance characteristics of OGFC pavements in Washington State. It will focus primarily on the OGFC’s resistance to studded tire wear, its durability and its splash/spray characteristics. In addition, noise reduction characteristics will also be measured. WSDOT, at a minimum, will be evaluating noise levels using sound intensity measurement equipment (additional evaluations to be determined in the next couple of months). The pavement performance and noise intensity measurements will be conducted on an annual basis.

In addition, this study will also document any challenges with the construction of the OGFC during nighttime paving operations.

Scope This project will construct two OGFC test sections, each ½-mile in length, one with asphalt-rubber and the other with PG70-22. This section of southbound interstate consists of three 12-foot lanes, a 10-foot right and 10-foot left shoulder.

Both sections of the OGFC will be placed full roadway, including shoulders, to a depth of 0.06 feet.

Experimental Feature Report

__________________________________________________________

March 2008 89

WSDOT will be designing the mixes in accordance with the Arizona DOT specifications for OGFC with asphalt-rubber (AR) and OGFC with a styrene-butadiene-styrene (SBS) modified asphalt binder.

Layout The first test section will begin at MP 188.65 and end at MP 188.15 and the second will begin at MP 188.15 and end at MP 187.65.

Figure 1. Interstate 5 at MP 188.65 Figure 2. Interstate 5 at MP 188.15

This location was selected for ease of construction (occurs at the beginning of the pavement project), relatively similar terrain and the same level of traffic over both test sections.

Control Section A ½ mile length of the project will serve as the control for the evaluation of the OGFC mixes. The project calls for a ½ inch Superpave mix using a PG 64-22 binder. The limits of the control section will be determined after construction is completed. The location will be chosen so that it duplicates, as closely as possible, the same environment and traffic conditions as the two test sections.

Staffing This research project will be constructed as part of a larger rehabilitation project. Therefore the Region Project office will coordinate and manage all construction aspects. Representatives from the WSDOT Materials Laboratory (1 – 3 persons) will also be involved with the process.

Contacts and Report Author Linda Pierce, PE State Pavement Engineer Washington State DOT (360) 709-5470 FAX (360) 709-5588 [email protected]

Experimental Feature Report

__________________________________________________________

March 2008 90

Testing The following annual testing procedures will be conducted on the test sections and control section.

� Pavement condition - Surface condition (cracking, patching, flushing, etc) - Rutting/wear (using the INO laser which provides true transverse profile) - Roughness

� Some measure of splash and spray characteristics - WSDOT is currently in the process of determining if a procedure exists for measuring

splash and spray. - At a minimum, splash and spray may be documented through photographs during a

rainstorm � Sound intensity noise measurements

Reporting An “End of Construction” report will be written following completion of the test sections. This report will include construction details of the test sections and control section, construction test results, and other details concerning the overall process. Annual summary reports will also be issued over the next 5 years that document any changes in the performance of the test sections. At this time a final report will be written which summarizes performance characteristics and future recommendations for use of this process.

Cost Estimate Construction Costs

Description Quantity Unit Cost Unit Total Cost

OGFC – AR 300 $62.00 Ton $86,800 OGFC – SBS 300 $55.00 Ton $77,000

Total

$163,800

Testing Costs The pavement condition survey will be conducted as part of the statewide annual survey (all lanes will be tested).

WSDOT is in the process of purchasing sound intensity measurement equipment and will be installed on the appropriate testing vehicle.

Experimental Feature Report

__________________________________________________________

March 2008 91

Report Writing Costs Initial Report – 60 hours = $4,800 Annual Report – 20 hours (4 hours each) = $1,600 Final Report – 100 hours = $8,000

TOTAL COST = $178,200

Schedule

Project Ad Date – January 2006 Estimated Construction – August 2006

Date Pavement Condition Survey

Sound Intensity

Measurement

End of Construction

Report

Annual Report

Final Report

July 2006 X X January 2007 X

July 2007 X X October 2007 X

July 2008 X X October 2008 X

July 2009 X X October 2009 X

July 2010 X X October 2010 X

July 2011 X X October 2011 X

June 2012 X


Recommended