Page 1
Evaluation of Numerical Methods to Model Structural AdhesiveResponse and Failure in Tension and Shear Loading
Luis F. Trimino1 • Duane S. Cronin1
Received: 30 October 2015 /Accepted: 13 January 2016 / Published online: 1 February 2016
� Society for Experimental Mechanics, Inc 2016
Abstract Improved energy efficiency in transportation
systems can be achieved with multi-material lightweight
structures; however, joining often requires the use of adhe-
sive bonding and design efforts are challenged by the paucity
of data required to represent adhesives in numerical models.
The data for three epoxy structural adhesives tested in ten-
sion and shear over a range of strain rates (0.001–1000 s-1)
is reported. The range of experimentation addresses regular
operation and extreme conditions (crash scenarios) for
vehicles. The data was implemented with cohesive and solid
elements; and the models were assessed on their ability to
reproduce adhesive material response. Good agreement was
achieved using both approaches. In average the coefficients
of determination (r2) between measured experimental
response and simulations were 0.81 for tension and 0.59 for
shear, with 2 % difference in the prediction of stress at
failure. The cohesive formulation was computationally
efficient and reproduced rate effects, but was limited in
representing the response of the non-toughened epoxy. The
solid element formulation required longer simulation times,
but yielded similar accuracy for tension (2 % difference in
stress to failure and r2 values of 0.98, on average). However,
the shear response accuracy (r2 = 0.53) was reduced by
coupling between shear and tension strain rate effects.
Numerical simulation of structural adhesives requires con-
stitutive models capable of incorporating uncoupled defor-
mation rate effects on strength. The results of this study
indicate that a cohesive model can provide adequate repre-
sentation of an adhesive joint for tensile and shear loading
across a range of deformation rates.
Keywords Structural adhesives � Deformation rate
effects � Toughened structural epoxy � Explicit finiteelement model � Cohesive element
Introduction and Background
Increasing requirements for improved energy efficiency in
transportation systems have led to the introduction of
lightweight materials and multi-material structures. These
structures have been enabled by the use of adhesives for
joining. Traditional joining methods such as fasteners or
welding restrict the use of dissimilar materials and/or thin
gage components that are key to producing light weight
structures [1, 2].The adoption of adhesive joining not only
reduces the overall weight of the structure [3]; but also
provides joints that are continuous and therefore stronger
with reduced stress concentrations [3]. Although joining
with structural adhesives is currently in use by some
automobile manufacturers [2, 4] and bonded structures
have been tested under operational conditions [5–9]; a
major obstacle to incorporating adhesive joints in designs
is the lack of appropriate data to characterize and represent
adhesive joints in numerical models and simulations to
support computer aided engineering (CAE) [10]. Incorpo-
ration of adhesive joints in numerical models can be
undertaken with relatively simple implementations using
Electronic supplementary material The online version of thisarticle (doi:10.1007/s40870-016-0045-7) contains supplementarymaterial, which is available to authorized users.
& Luis F. Trimino
[email protected]
Duane S. Cronin
[email protected]
1 Department of Mechanical and Mechatronics Engineering,
University of Waterloo, 200 University Avenue West,
Waterloo, ON N2L 3G1, Canada
123
J. dynamic behavior mater. (2016) 2:122–137
DOI 10.1007/s40870-016-0045-7
Page 2
tied nodes between the adherends and a critical stress cri-
terion, to more comprehensive cohesive element and solid
element constitutive models. All of these representations
vary in complexity and the amount of data required for
implementation, with corresponding requirements for
mechanical testing. The required properties can range from
simple strength values to full traction–separation curves,
and the incorporation of deformation rate effects. Typi-
cally, strain–stress curves for tension, compression and
shear at different strain rates; values for fracture toughness
in Modes I and II, traction–separation behavior, damage
response and strain to failure are required. Mechanical
properties in adhesives are generally measured using bon-
ded joints subjected to uniaxial tension, or peal [11] or by
using thin lap shear tests [12].
Measuring the mechanical properties of adhesives can be
undertaken using many different methods; a search of the
ASTMstandards [13] for themechanical testing of adhesives
identified 517 documents pertaining to testing, out of which
94 are different active standards. These standards include 15
different test protocols for adhesion, 24 for tension; 8 for
compression; and 15 different tests for shear. Generally,
these tests require the preparation of a bonded specimen and
subsequent testing in order to measure the desired mechan-
ical property. Unfortunately, many of the configurations
produce results that are influenced by the adherend material
stiffness, strength, and joint geometries [14] resulting in
stress concentrations and complex modes of loading [15]
affecting the measured properties [16]. The variability in
measured results can be observed in published data for
adhesive testing using lap-shear and T-peel test [17, 18].
Untoughened epoxy adhesives typically exhibit relatively
high strength at failure (C70 MPa), low strain to failure
(B0.1) [19] and low fracture toughness (*0.4 J m-2) [20–
25]. Toughened epoxy formulations incorporate a second
toughening phase, typically butadiene or other polymer
(EPM, ABS, polyolefins) [21, 26, 27], and demonstrate
increased ductility (C0.1 mm/mm at failure) and fracture
toughness (C1.5 J m-2). This type of adhesive is ideal for
applications where the bonded joints are required to maintain
integrity under high deformation, which is generally the case
in crashworthiness scenarios for transportation systems.
Crashworthiness and other load case scenarios result in a
range of deformation rates, and under such conditions, it is
important to consider strain rates effects in the constitutive
model. In particular for adhesives, the literature reports
changes in the mechanical response; typically increase in the
stress to failure and decrease in the strain to failure [10, 28–
33], and in some cases changes in modulus of elasticity.
Conflicting information is reported for fracture toughness. In
certain cases, increaseswith strain rate havebeen reported [34,
35] while others have found that there are no noticeable
changes [25], and still others report decreases with increasing
strain rate [36–38].Many different constitutive models can be
used for modeling adhesives, ranging from simple elastic
models, metals plasticity models, and viscoelastic models
[39–41]. Failure is often incorporated using a critical stress or
fracture toughness criterion. Three common numerical
implementations include: simple tied nodes with a critical
stress failure criterion or crack opening displacement
approach to predict failure, cohesive element formulations
incorporating traction separation curves and material tough-
ness, and solid continuum element formulations. Simple
implementations involving tied nodes, although numerically
efficient and requiring very little information for implemen-
tation are known to be problematic due to numerical insta-
bilities (often termed unzipping). Although the incorporation
of a damage criterion canmitigate this issue, deformation rate
effects are generally not considered in this approach. Further,
this approach can misrepresent the joint stiffness, which is
determined from the adherend materials and not from the
adhesive itself. In recent years [42, 43], advances in cohesive
element formulations have incorporated traction-displace-
ment curves to provide a better description of the material
response to load and fracture mechanics concepts to predict
failure. Cohesive elements allow for progressive failure in
ductile adhesive materials, avoiding the numerical instabili-
ties that are generally observed with tied nodes. In addition to
incorporatingMode I (pure tension),Mode II (pure shear) and
mixed-mode response, recent cohesive formulations [43, 44]
include strain rate effects and are numerically efficient. Dis-
cretization using solid continuumelements and an appropriate
constitutive model is considered to be the most accurate rep-
resentation of an adhesive joint, if the finite element size is
sufficiently small. This approach can require a large numberof
elements, making it computationally expensive. Constitutive
models for use with solid elements include: elastic with fail-
ure,metals plasticitymodels, plasticitymodelswith strain rate
effects, viscoelasticity and continuum damage models. In
general, these models require a relatively large set ofmaterial
properties and data to accurately represent the adhesive joint.
Limitations include a lack of accounting for rate effects,
material asymmetry and prediction of failure. For example, an
elastic model with failure can predict the elastic response of
the material but fails to describe material damage. Metals
plasticity models can incorporate strain rate effects and
damage, but often rely on von Mises or other yield criteria
applicable to metals to link the tensile response to the com-
pression or shear response, which can be inaccurate for many
polymericmaterials. Although traditional viscoelasticmodels
account for deformation rate effects,most donot incorporate a
description of material damage and failure. Some constitutive
models, such as the Semi-Analytical Model for Polymers
(SAMP-1) [45] have been developed specifically for poly-
mers, incorporating tension, shear and compression behavior
separately, along with deformation rate effects.
J. dynamic behavior mater. (2016) 2:122–137 123
123
Page 3
Modeling of structural adhesives is widely discussed in
the literature [39–41, 46–48]. Simple representations start-
ing with the use of beam elements to represent the substrate
coupled with iso-parametric elements to represent the
adhesive was successfully implemented by Wu [49] to
generate the stress distribution of different type of joints.Van
Hoof [50] used tied nodes between surfaces to represent
adhesive joints in the analysis of delamination in composite
materials. These simplified methods can be useful to get
insight into general behavior in joints under load and in some
cases provide stress distributions, but prediction capabilities
are constrained due to the limited information that these
models require (i.e. stresses to failure). For example,
behaviors that depend on the true stiffness in the joint can be
biased since the stiffness of a simple tied contact is generally
assumed in the implementation [51] and is arbitrarily inde-
pendent of the true stiffness of the adhesive itself. In contrast,
highly sophisticated user defined materials have been used
successfully to describe bulk material behavior under linear
elastic conditions, strain softening or strain hardening
effects, and to predict the effects of strain rate dependency or
the effects of damage in the unloading phase [47, 52, 53].
Although these models can be highly accurate, they require
the use of element formulations with refined meshes that are
computationally expensive; calculation times can be pro-
hibitive and impractical, e.g. analysis of a complete vehicle
[7]. Cohesive elements have been used successfully to
accurately describe joint load response and predict crack
propagation of bonded joints in Mode I load conditions [54–
56] and in mixed mode loading scenarios [23]. Even though
limitations in regards to rate dependencies have been par-
tially addressed [34, 42–44], other limitations in cohesive
formulations, as identified by Needleman [57] include size
effects, and the dependence of material parameters on
deformation rate. Success inmodeling structural adhesives is
not only limited to the reproduction of experimental cou-
pons; but also at the structural level [7, 58–60] under quasi-
static and impact loads with good agreement for predicted
loads, deformation patterns and modes of failure between
simulations and experiments. The techniques have also been
used in the analysis of complex joints such as the interface
between welds and adhesive materials in hybrid joints [61].
Regardless of the numerical implementation used for the
analysis of a bonded joint or a bonded structure, the analysis
using numerical methods is not possible without mechanical
properties that can describe the adhesive material response.
The minimal requirements being the uniaxial tension
response or/and pure shear data.
In this study, the mechanical properties of three structural
epoxy adhesives (DP-460NS, SA-9850 and EC-2114, 3M
Limited, Canada) were measured. The testing was under-
taken using bulk material at different strain rates under ten-
sion (0.0001–1000 s-1) and using thick adherend lap shear
samples (0.005–50 s-1) to measure the shear properties.
This study aims to provide much required mechanical data
and an understanding of available numerical implementa-
tions for modeling structural adhesive response and failure
that can be used in the analysis of bonded structures.
Methods
Materials
Three commercial structural adhesives were investigated, a
traditional non-toughened epoxy, and two toughened
epoxies. The non-toughened material was a single part
epoxy (EC-2214, 3M Limited Canada) [17, 62] with a
small percentage of a synthetic elastomer (1–5 % per
weight). The material was cure for an hour at 120 �C. Thisadhesive was designed to bond metals and high tempera-
ture plastics. The second adhesive was a two-part structural
epoxy base in a phenolic resin and modified with acry-
lonitrile butadiene (CTNB) for enhanced strength (7–13 %
per weight) (DP-460NS, 3M Limited, Canada) [18, 63].
The manufacturer data sheet shows that best performance
is obtained with a curing cycle of 2 h at 70 �C. The last
material (SA-9850, 3M Limited Canada) [64] was descri-
bed by the manufacturer as one part impact resistant
adhesive formulated for bonding contaminated or unpre-
pared steel and aluminum materials. From the data sheet a
curing cycle of 1 h at 170 �C was selected. The materials
considered, permit to compare a typical epoxy adhesive
(EC-2214), an adhesive with enhanced toughness (DP-
460NS) and one that was specifically designed for impact
resistance (SA-9850).
Tensile Testing
Specimens were extracted from cast adhesive sheets 3 mm
in thickness by machining. The coupon geometry has been
used previously for high deformation rate tensile testing
[65] and was used for the current study so that the same
sample geometry could be used over a wide range of
deformation rates and maximized the number of samples
that could be machined from the cast material [66]. This
specimen geometry has been compared to the ASTM type
V sample and has provided similar results for metals [65,
67]. To ensure that this geometry would not introduce
artifacts, results of coupon tensile testing at low strain rates
were compared with the ASTM type V geometry [66] for
the uniaxial testing of polymers. It was found that the
critical values (stiffness, yield strength, strain to failure)
were in good agreement for both test geometries.
Materials were tested at quasi-static strain rates
(0.001–0.7 s-1) using a hydraulic test frame (Instron,
124 J. dynamic behavior mater. (2016) 2:122–137
123
Page 4
Model 1331) in conjunction with a dynamic extensometer
(Instron, Model 2620-601) and a load cell (Strain Sert,
model FL25U-2DG). At the intermediate strain rates
(10–100 s-1), a hydraulic frame equipped with a quartz
piezoelectric load cell (Kistler model 9321B) and charge
amplifier (Kistler type 5010B) was used to measure force.
Digital image correlation (DIC) [68] was used to measure
specimen deformation (VIC-2D [69]) with images captured
using a high speed camera (Photron Fastcam SA-4) and
LED light source (AADYN Technologies, Jab Bullet
model). At high strain rates, 1000 s-1 or higher, a tensile
split Hopkinson pressure bar was used (Fig. 1). All testing
was conducted at room temperature.
Shear Testing
The adhesive shear properties were measured using thick
lap shear specimens (TLS), based on the ASTM D5656
standard [70]. The samples were constructed by bonding
two 3 mm thick steel substrates (SAE 1018 HR) 16 mm in
width and 25.53 mm in length. The two pieces overlap by
5.8 mm to create a 1 mm thick adhesive joint and a fixture
was used to maintain the geometrical dimensions of the
bond during the curing process. The specimens were used
to obtain the shear response of the adhesive; since the
adherends were quite rigid compared to the adhesive, it
was assumed that the results correspond to those of the
bulk material since cohesive failure was present during the
test.
The coupons were tested over strain rates ranging from
0.005 up to 50 s-1; and were performed using a hydraulic
test frame in conjunction with a load cell (Transducer
Techniques, model SWP-20K) and a Linear Variable Dif-
ferential Transformer (LVDT) (Omega, type LD-320-7.5)
mounted on the sample to measure displacement. Custom
offset grips were used to maintain the alignment of the
sample with the applied load and minimize the introduction
of bending moments during the test. Imaging of the test and
post-test sample analysis confirmed that there were no
misalignments and that the setup did not introduce any
measurable bending in the test sample.
Adhesive Modeling and CAE Implementation
The ability to model the mechanical response and failure of
adhesive joints is essential for integration into the design
process. One challenge in modeling adhesive joints is the
small thickness of the adhesive bond, resulting in relatively
small elements. For example, vehicles and substructures
are often modeled with elements on the order of 3–5 mm in
dimension; whereas a typical bond thickness may be
0.15 mm leading to a significant reduction in time step and
increased computational cost for solid continuum elements.
A second challenge is the level of detail in the material or
constitutive model, which determines the mechanical
properties that must be measured as inputs to the model. To
address the large number of combinations possible, three
approaches in order of increasing complexity and compu-
tational cost were identified for investigation in this study:
tied nodes, a cohesive zone model, and a continuum model.
A computationally efficient approach to modeling
adhesive joints is a simple tied interface, where nodes on
adjacent adherends are tied to one another and failure is
predicted through the use of a stress-based criterion [39,
71, 72]. Although this method is very computationally
efficient and some implementations include apparent duc-
tility of the adhesive through a prescribed displacement
corresponding to fully damaged material, this method does
not incorporate the actual bond thickness or adhesive
elastic response, and can be prone to numerical instability
[50]. Further, available implementations in a commercial
explicit finite element code (LS-Dyna, LSTC) did not
include deformation rate effects, bond thickness, or the
compliance of the adhesive. Initial studies identified these
Fig. 1 Experimental set-up
a Quasi-static, b intermediate
range and c high strain rate
J. dynamic behavior mater. (2016) 2:122–137 125
123
Page 5
aspects as significant limitations and this formulation was
not pursued further.
Cohesive zone models (CZM) provide a computation-
ally efficient, albeit incomplete, formulation to represent
two important modes of loading on an adhesive joint:
tension and shear. Further, the adhesive bond thickness is
included as is the compliance of the adhesive. In this study,
a cohesive element formulation incorporating tensile,
shear, fracture and damage properties was investigated
[43]. Importantly, this implementation also included
deformation rate effects and an interpolation to consider
mixed-mode loading. The measured parameters included
the tensile traction displacement curve, the shear traction
displacement curve, Mode I fracture toughness, and
deformation rate effects in tension characterized by an
increase in material strength with increasing deformation
rate. The Mode II fracture toughness was not directly
measured and was determined from the shear tests as
described in the methods section.
Continuum approaches incorporating solid elements
have been used to investigate stress gradients in a joint and
can aid the design engineer to understand the adhesive
performance in a particular joint configuration [48, 58], but
are not often used for large structures due to the high
computational cost. Specifically, multiple elements are
required through the small thickness of the adhesive lead-
ing to a large number of elements and increased solution
time for a given model. A continuum approach requires a
constitutive model to describe the material response, often
providing stress as a function of strain history and strain
rate. There are a large number of material models that may
be considered, and the use of a particular model is dictated
by the sensitivity of a material to deformation rate, damage
and mode of loading. Classes of materials investigated
included: elastic, viscoelastic, viscoplastic, metals plastic-
ity, and polymer-specific models. In general, the experi-
mental test results determined that the constitutive model
was required to incorporate elastic response, damage or
plastic response, deformation rate effects, asymmetry in
tension and compression, and shear response. Although
many different models exist with some or all of these
aspects, noted limitations included incorporation of defor-
mation rate effects, the asymmetric yield surface [73], and
the general ability to fit the wide range of data available
from the experimental tests. Following investigation of
several different models, the Semi-Analytical model for
Polymers (SAMP-1) constitutive model developed by
Kolling et. al [45] and implemented in a commercial finite
element solver (LS-DYNA) [74] code was identified for
use in the current study. The SAMP-1 model incorporates
specific stress–strain curves for different modes of loading
(tension, shear, and compression) and incorporates strain
rate effects.
Implementation of Experimental Test Data
in Constitutive Models
Multiple tests were undertaken for each mode of loading
and deformation rate; the experimental data was used in
whole or in part as required to implement the various
constitutive models used in this study. In the case of the
cohesive element, the models required strength data as a
function of strain rate, this information was extracted from
the experimental test data by cross-referencing stress at
failure against strain rate. The strain rate effects were
described with the use of a log-linear model. Mode I
fracture toughness was measured by the manufacturer
using the tapered double cantilever beam tests [75] and the
average values from the measurements [64] were used in
the cohesive constitutive model. Mode II data was first
approximated using an expression (Eq. 1) that relates the
maximum shear strength (s) with the displacement at
failure (dfail), the area under the normalized shear stress–
strain curve (ATSC) and the energy release rate [67]. In the
case where no shear data is available, the value of Mode II
energy release can be approximated as 2–10 times the
Mode I value [76, 77]. In cases where the initial Mode II
approximation (Eq. 1) did not predict the material strain to
failure accurately; the value was recalculated using an
inverse method. The method consisted in varying the Mode
II value until the response of a single element in pure shear
at the lowest strain rate followed that of the experimental
data and there were no differences in strain to failure.
Cohesive elements require a curve to describe the traction
separation response in the material, the literature [55, 78–
80] suggest the use of bilinear or bilinear with plateau
curves; although some authors have claimed that the shape
does not have a significant effect on the response [55]. The
traction separation curve was determined by normalizing
the shear response at the lowest strain rate. The normal-
ization process consisted of dividing the measured curve by
the maximum measured stress and strain values respec-
tively in each axis to obtain the normalized traction-dis-
placement curve.
In the case of the implemented solid formulation and
constitutive model (SAMP-1) the model required true
stress as a function of plastic strain to define the material
response for tension and shear. For the tensile tests, the
measured experimental stress–strain data for each speci-
men at each strain rate was processed as follows. The
elastic (linear) region was identified and the elastic
Equation 1 Energy release rate for mode II [81]
126 J. dynamic behavior mater. (2016) 2:122–137
123
Page 6
modulus was determined for each test. The end of the
linear region (yield strength) was identified with the aid of
Eq. 2 to determine when the plastic strain was greater than
zero, using the modulus measured in the linear region of
the response. The stress–strain response was then separated
into elastic and plastic components (Eq. 2) and the result-
ing plastic strain versus stress data was fit using an
empirical relationship between stress and strain(Eq. 3),
which resulted in good quality fits and coefficients of
determination (e.g. r2[ 0.95). Finally, the plastic strain-
true stress curves were averaged in a point-wise manner
(Eq. 4) and the strains at failure were determined from
averaging the failure strains for all of the tests, denoted by
the counter i, at a particular strain rate, denoted by the
counter j (Eq. 5). The same procedure was followed with
the shear data, although in this case a polynomial curve
type fit (Eq. 6) was more appropriate (r2[ 0.90). It is
worth noting that the described procedure was successful at
preserving the integrity of the physical response in the
material, which was not the case when all the available data
for a single strain rate was curve fitted into a single
expression.
Additionally, both models require values for modulus of
elasticity in tension, in shear, density and Poisson’s ratio.
This information was ready available from the manufac-
turer and was verified in the experimental tests.
CAE Modeling
Single element simulations were used for a first level
assessment of the constitutive models. In these simulations,
the boundary conditions were implemented to obtain pure
tension and pure shear (Fig. 2). In the second stage of this
implementation, the actual test samples used in the
experiments (TSHB and TLS) were simulated and sub-
jected to the same loading as the experimental test condi-
tions. The TLS used both CZM and continuum elements
while the TSHB geometry used solid elements only
(Fig. 2).
Results
Experimental Test Results
The tensile and shear test results showed that all three
adhesive materials demonstrated significant strain rate
sensitivity for both tension and shear modes of loading.
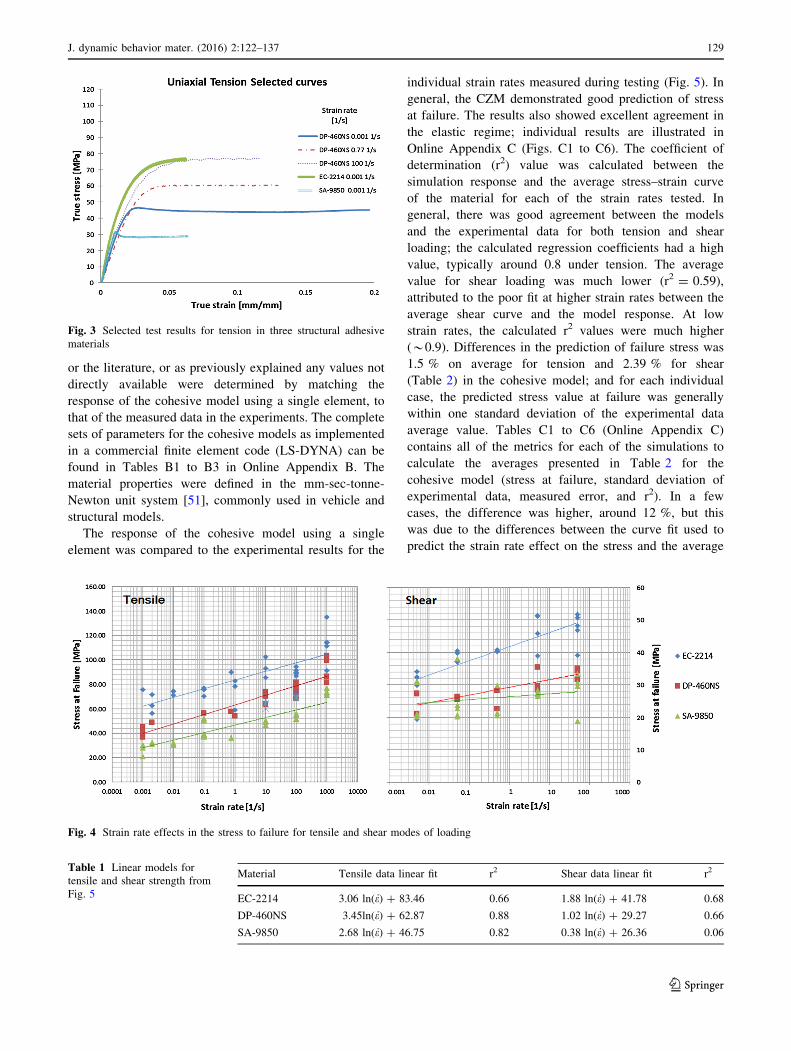
Figure 3 describes a data set from the testing showing
strain dependency for one of the materials in tension as
well as the relative strength between all three adhesives
under quasi-static loading. The complete set of experi-
mental results and material properties is provided in Online
Appendix A. The dependency of material ultimate strength
on strain rate for both tension and shear (Fig. 4) was
quantified by fitting a log-linear curve (Table 1). In
metallic materials, the strain rate effects are typically log-
linear [82], but as can be seen in Table 1, for these three
polymeric materials a non-linear fit may provide improved
coefficients of determination. Non-linearity has been
reported in the literature [29, 83, 84] for polymers and
epoxy adhesives. However, a linear fit was required for the
cohesive constitutive model implementation. It was noted
that variability in the data contributed to lower coefficients
of determination and should be investigated in future
studies. The EC-2214 and DP-460NS adhesives demon-
strated the highest dependence on strain rate, based on the
coefficient of the log-linear curve fit to the tensile strength
data.
The shear response was different for each material as
described by the stress–strain curves. In shear, the strain
rate effects on the shear stress to failure were relatively
small for DP-460NS while an increased sensitivity was
noted in the curve fit for both EC-2214 and SA-9850 below
strain rates of 50 s-1. The three materials also showed
slight changes in modulus of elasticity with strain rate
(Table A1; Fig. A1), where the modulus of elasticity was
determined following the procedures described by the
ASTM E-111-04 standard [85]. These changes in modulus
were not incorporated in the numerical models but should
be investigated in future studies.Equation 2 Strain decomposition
Equation 3 Mathematical expression for curve fitting in tension
Equation 4 Average curve for a particular strain rate _eJ
Equation 5 Strain to failure in the average curve for a particular
strain rate _eJ
Equation 6 Mathematical expression for curve fitting in shear
J. dynamic behavior mater. (2016) 2:122–137 127
123
Page 7
CAE Implementation
Cohesive Zone Model
The cohesive element formulation was implemented using
the measured data from the tension and shear tests to
describe the strain rate effects on the strength of the
material (Table 1), also the modulus of elasticity and shear
modulus used matched those published by the manufac-
turer and confirmed during the experimental testing
(Table A2). The required fracture toughness values in
Mode I and Mode II were obtained from the manufacturer
Fig. 2 Single element cases (top), TLS geometry (bottom left) and TSHB geometry (bottom right)
128 J. dynamic behavior mater. (2016) 2:122–137
123
Page 8
or the literature, or as previously explained any values not
directly available were determined by matching the
response of the cohesive model using a single element, to
that of the measured data in the experiments. The complete
sets of parameters for the cohesive models as implemented
in a commercial finite element code (LS-DYNA) can be
found in Tables B1 to B3 in Online Appendix B. The
material properties were defined in the mm-sec-tonne-
Newton unit system [51], commonly used in vehicle and
structural models.
The response of the cohesive model using a single
element was compared to the experimental results for the
individual strain rates measured during testing (Fig. 5). In
general, the CZM demonstrated good prediction of stress
at failure. The results also showed excellent agreement in
the elastic regime; individual results are illustrated in
Online Appendix C (Figs. C1 to C6). The coefficient of
determination (r2) value was calculated between the
simulation response and the average stress–strain curve
of the material for each of the strain rates tested. In
general, there was good agreement between the models
and the experimental data for both tension and shear
loading; the calculated regression coefficients had a high
value, typically around 0.8 under tension. The average
value for shear loading was much lower (r2 = 0.59),
attributed to the poor fit at higher strain rates between the
average shear curve and the model response. At low
strain rates, the calculated r2 values were much higher
(*0.9). Differences in the prediction of failure stress was
1.5 % on average for tension and 2.39 % for shear
(Table 2) in the cohesive model; and for each individual
case, the predicted stress value at failure was generally
within one standard deviation of the experimental data
average value. Tables C1 to C6 (Online Appendix C)
contains all of the metrics for each of the simulations to
calculate the averages presented in Table 2 for the
cohesive model (stress at failure, standard deviation of
experimental data, measured error, and r2). In a few
cases, the difference was higher, around 12 %, but this
was due to the differences between the curve fit used to
predict the strain rate effect on the stress and the average
Fig. 3 Selected test results for tension in three structural adhesive
materials
Fig. 4 Strain rate effects in the stress to failure for tensile and shear modes of loading
Table 1 Linear models for
tensile and shear strength from
Fig. 5
Material Tensile data linear fit r2 Shear data linear fit r2
EC-2214 3.06 ln( _e) ? 83.46 0.66 1.88 ln( _e) ? 41.78 0.68
DP-460NS 3.45ln( _e) ? 62.87 0.88 1.02 ln( _e) ? 29.27 0.66
SA-9850 2.68 ln( _e) ? 46.75 0.82 0.38 ln( _e) ? 26.36 0.06
J. dynamic behavior mater. (2016) 2:122–137 129
123
Page 9
stress value calculated from the available data points at
those particular strain rates.
After the single element verification, the cohesive model
was further investigated with the TLS geometry using rigid
elements to represent the adherends. The response of the
TLS models were identical to those of the single element
simulations for DP-460NS, the same result was observed
for the other two adhesives.
Continuum Model
The response of a continuum model using solid elements
using the SAMP-1 constitutive model was evaluated using
single element models and with simulations of the TLS and
TSHB geometries. During the tensile single element sim-
ulations, all cases showed good agreement between model
and experimental data although there was a small differ-
ence in the predicted plastic behavior, which increased
with increasing strain rate. Even though in the imple-
mented model the stress during the plastic deformation was
slightly lower than the measure (Table 2; Fig. 6).
One specific assumption in the SAMP-1 model is that
the material behaves linear elastic until yield, defined as the
departure from linearity. Further, the model predicts the
departure from the linear-elastic region of the material to
occur at the strength corresponding to the lowest defor-
mation rate provided (i.e. the first strength value of the
plastic curve with lowest strain rate in the implementation),
and did not initially follow the strength versus plastic strain
data provided. In essence, the model uses the first yield
from the lowest strain rate curve and then interpolates the
plastic behavior using the provided curves at different
deformation rates. This caused the differences noted in the
transition region from elastic to plastic behavior.
In the shear loading cases, at low strain rates (*0.005
s-1), the simulation response was in very good agreement
with the actual elastic and plastic response from the test
data (\2 % difference in maximum stress value, see
Tables D1–D6 and Figures D1–D6 in Online Appendix D
for each case results). In addition, the regression coeffi-
cients between the experimental data and the simulation
were[0.90, but as the strain rate increased the difference
in stress prediction increased up to 40 % in some cases and
the regression coefficient diminished in all cases (\0.5). It
was noted that the SAMP-1 model used the tensile strain
rate sensitivity to scale both tension and shear loading
response. In case of shear loading, the strain rate was
calculated using the von Mises flow rule [45], linking the
Table 2 Model summary
response metrics in single
element simulations
Model Adhesive Tensile response Shear response
Difference (%) Average (r2) Difference (%) Average (r2)
Cohesive model EC-2214 4.08 0.70 1.90 0.53
DP-460NS 0.18 0.91 1.58 0.61
SA-9850 0.00 0.83 3.68 0.64
Overall 1.42 0.81 2.39 0.59
SAMP-1 model EC-2214 4.03 0.96 22.64 0.43
DP-460NS 0.61 0.99 14.61 0.55
SA-9850 1.23 0.98 3.00 0.61
Overall 1.96 0.98 13.42 0.53
Fig. 5 Single element simulations results, CZM
130 J. dynamic behavior mater. (2016) 2:122–137
123
Page 10
applied shear deformation to the provided uniaxial tension
curves and hence did not accurately represent the strain rate
effects for shear loading.
Further verification of the SAMP-1 model was pursued
using simulations of the actual tested samples (i.e. tensile
sample and thick adherend lap shear). In both cases a mesh
convergence study was performed. Convergence was
evaluated using the stress–strain response, element stress in
a selected region, as well as the measured modulus of
elasticity and shear modulus. From the study results it was
determine that elements between 1.5 and 1 mm in char-
acteristic length provide a converged solution for the ten-
sile coupon while a smaller size (0.25 mm) was required
for the TLS. The mesh size in the TLS model was con-
strained by the 1 mm adhesive bond used in the actual
experiment, at least three elements across the joint thick-
ness are recommended when using single integration point
elements to capture any possible bending effects and the
resulting stress gradient [39].
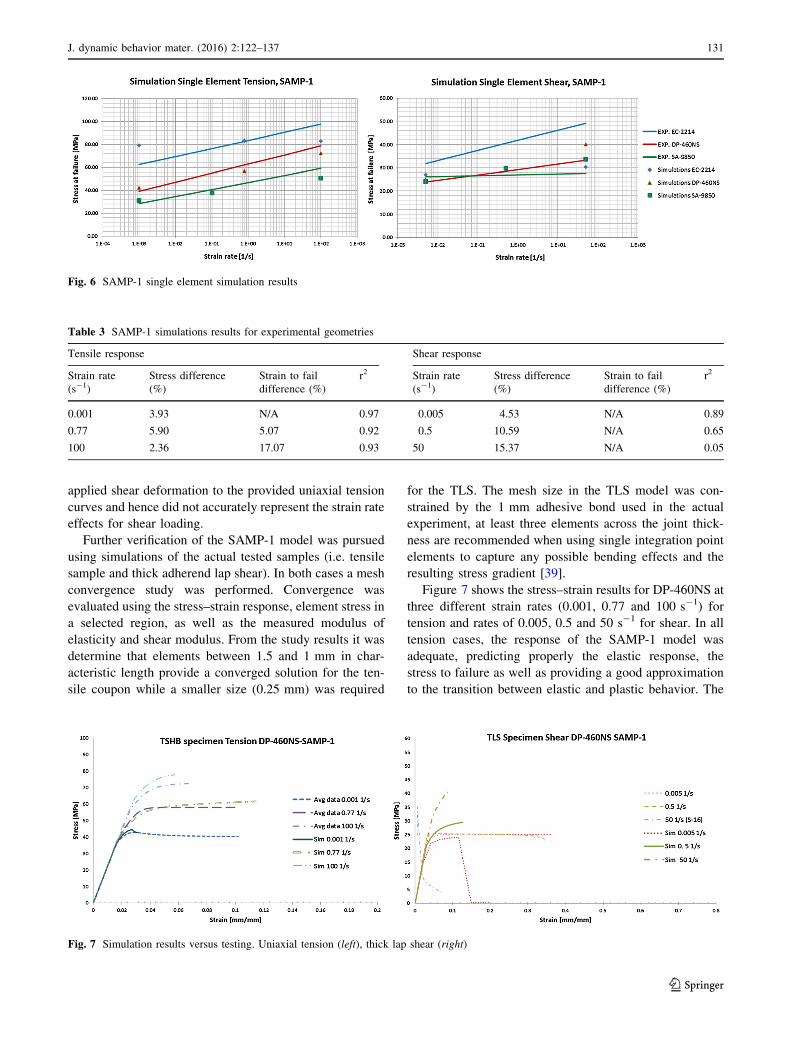
Figure 7 shows the stress–strain results for DP-460NS at
three different strain rates (0.001, 0.77 and 100 s-1) for
tension and rates of 0.005, 0.5 and 50 s-1 for shear. In all
tension cases, the response of the SAMP-1 model was
adequate, predicting properly the elastic response, the
stress to failure as well as providing a good approximation
to the transition between elastic and plastic behavior. The
Fig. 6 SAMP-1 single element simulation results
Fig. 7 Simulation results versus testing. Uniaxial tension (left), thick lap shear (right)
Table 3 SAMP-1 simulations results for experimental geometries
Tensile response Shear response
Strain rate
(s-1)
Stress difference
(%)
Strain to fail
difference (%)
r2 Strain rate
(s-1)
Stress difference
(%)
Strain to fail
difference (%)
r2
0.001 3.93 N/A 0.97 0.005 4.53 N/A 0.89
0.77 5.90 5.07 0.92 0.5 10.59 N/A 0.65
100 2.36 17.07 0.93 50 15.37 N/A 0.05
J. dynamic behavior mater. (2016) 2:122–137 131
123
Page 11
implemented strain to failure criteria in the model was
close to the specified parameters (below 13 % error,
Table 3). The TLS simulation presented the same type of
limitations noticed in the single element simulations. That
is, a good response at low strain rates, but departure from
the measured behavior at higher strain rates. Simulations
for SA-9850 and EC-2214 materials using the testing
geometries was not pursued.
Discussion
Experimental Testing
Three different epoxy adhesive materials where tested
under uniaxial tension using bulk samples and under shear
loading using a thick lap shear sample geometry across a
range of strain rates. The experimental results were of good
quality but some challenges were identified during high
strain rate testing. Under tensile loading using the split
Hopkinson bar with the proposed geometry showed that the
specimen was susceptible to non-equilibrium conditions.
Even though the sample geometry is acceptable for testing
metals, and impedance compatible aluminum bars were
used; the sample gauge length was too long so that
dynamic equilibrium was not achieved. Reducing the
gauge length was not considered since previous testing has
demonstrated the required reduction in length would not
allow for uniform stresses to develop in the sample. The
reported ultimate strength of the adhesive follows the trend
from lower strain rates (Fig. 4). Efforts are underway to
investigate modifications to the test using low impedance
polymeric bars, pulse shaping techniques [86–88], or the
atypical setup implemented by Rae [88].
Challenges were also noted with the shear testing at high
strain rates, in this case high frequency oscillation were
identified in the response at strain rates of 50 s-1 and
higher, attributed to vibration in the test apparatus. To
address this challenge, it is proposed that an alternate
sample geometry (e.g. ASTM B831-14 [89]), be investi-
gated. In general, most of the challenges identified were
related to displacement or strain measurement while the
measured load, particularly the maximum load, was found
to be representative, since the differences between the
calculated average stress at peak load and the shear data
measured by the manufacturer (Table 4) are\5 % in dif-
ference for both DP and EC materials. The SA-9850
adhesive result from the manufacturer was lower, but the
manufacturer data reported adherend failure, hence the
actual adhesive property will be higher.
It is clear from the experimental data that all three
materials were sensitive to strain rate for both tension and
shear loading, exhibiting an increase in strength with
increasing strain rate. To describe the effects of strain rate
in the mechanical properties of these adhesives, the use of
traditional log-linear models, as implemented for metals
provided a reasonable fit to the data (Table 1). Previously,
Nagai [29] demonstrated that the Cowper-Symonds model
can be used to describe the effects on the compressive
stress of DP-460 (a variant of DP-460NS as used in the
current study), but over a limited range of strain rates
(B100 s-1).
A similar result was found for the data in this work. Out
of the three materials tested, only DP-460NS show an
improvement in the correlation coefficient when the strain
rate range was narrowed. This is partially due to the scatter
in the data, and may also support the possibility of a non-
linear relationship between strength and strain rate effects
for this particular material. It is recommended that future
testing consider non-linear models; however, this was not
investigated in the current study since the constitutive
models used could only account for linear variation in
strength with the log of strain rate. Other authors have also
highlighted the importance of considering non-linear
models when selecting constitutive models to represent
polymeric materials [83, 90].
Another important finding is that traditional yield cri-
teria (e.g. Tresca or von Mises) that link tensile and shear
properties are not applicable to the materials investigated in
this study. For example, the shear response cannot be
accurately predicted from the tensile data (Fig. 8), and the
stress transformation (using von Mises theory) confirms
that the strain rate effect is clearly not the same between
the tensile and the shear data. As a result, complex concave
yield surfaces may be required to properly capture and
predict the yield behavior under load [73].More elaborate
test apparatus (e.g. the modified Arcan [23, 91]) that can
subject the samples to mixed mode loading, will be
required to fully define the actual yield surface.
Table 4 TLS results versus
manufacturer dataMaterial Manufacturer shear (MPa) TLS shear (MPa) Difference (%)
EC-2214 31.02 (ASTM D-1002) 31.82 2.51
DP-460NS 24.82 (ASTM D-1002) 23.86 3.86
SA-9850 19.00 (ISO 4587) 24.34 21.93
132 J. dynamic behavior mater. (2016) 2:122–137
123
Page 12
CAE Implementation and Evaluation
Two constitutive models, a cohesive zone model and a
continuum approach using solid elements, were imple-
mented to describe the measured mechanical behavior of
three epoxy adhesives. Although both models were capable
of describing the material response under the considered
load conditions, some limitations were identified. From the
experimental testing, it was clear that the strain rate effects
may not follow a log-linear relationship across the entire
strain rate range; however, in cases where the range of
strain rates encountered was limited to only a few decades,
a log-linear description of strain rate effects was found to
be adequate.
Some authors have noted that [36, 37, 92, 93] the energy
release rate for a polymer can be strain rate dependent or
that the shape of the traction displacement curve changes
with the strain rate. In particular, for this work the single
element simulation for DP-460NS at higher strain rates
other than quasi-static (0.77 and 100 s-1) in tension
demonstrated that it was not possible to obtain a match to
the experimental response unless either the energy release
rate was increased or the traction curve was modified.
Although the cohesive model considered in this study
allows for energy release rate to depend on deformation
rate, there was no experimental data to support incorpo-
ration of this in the present study. Although the individual
response under tension and shear was very good, further
investigation is needed to evaluate the model under mixed
mode loading conditions.
In the case of the solid element formulation, the accu-
racy of the response was limited due to issues with strain
rate effects implementation; in particular when loaded in
pure shear at high strain rates or under mixed mode loading
conditions. As noted in the model description, the shear
response was scaled from the strain rate effects defined for
tension, which is a limitation of the model. The strain rate
dependency for these two modes of loading is not the same
in the investigated materials (Fig. 8). This has been
acknowledged as a limitation of the SAMP-1 [45] and
further highlighted in the current study, particularly when
considering intermediate to high strain rate effects in shear
or under complex states of stress. It was also noted that
similar challenges may be encountered for strain rate
effects in compression based on the data measured by
Nagai [29]. The Nagai data shows dependency of the
Fig. 8 Equivalent tensile stress from shear stress against experimental tensile data
J. dynamic behavior mater. (2016) 2:122–137 133
123
Page 13
modulus of elasticity and stress to failure with strain rate. If
symmetric behavior between tension and compression
stress to failure were to be assumed; the compressive data
measured by Nagai [29, 52] overestimates the stress to
failure in tension when compared against the measured
data in this study, therefore the strain rate effects could also
be decoupled between tension and compression. Although
these tests concentrated on DP-460, a variation of DP-
460NS, similar effects may be expected for DP-460NS.
Work by other researchers, Chen [87] and Farrokh [31];
has demonstrated asymmetric response in other epoxy
materials between tension and compression for a wide
range of strain rates. Considering the possible highly
asymmetric nature of the yield surface based on the tensile
and shear results, Tresca or von Mises yield theories are not
applicable and models such as Coulomb-Mohr or Drucker-
Prager may be considered. Ideally, the models need to
incorporate more flexibility in regards to load decoupling.
Although the implemented strain to failure criteria in the
model works well under pure tension, again issues with
coupling affect the shear strain to failure, nevertheless the
SAMP-1 model is the only available material model that
can address some of the idiosyncrasies of polymeric
materials and seems to be a good starting point for mod-
eling structural adhesives using solid elements.
Summary
In this study, three different epoxy adhesives were
mechanically tested under tension and shear modes of
loading across a range of strain rates and the properties
were implemented in two numerical formulations.
Tensile testing was undertaken using samples machined
from bulk material and the stress–strain data demonstrated
increasing failure strength, and decreasing failure strain,
with increasing strain rate. The modulus of elasticity did
not vary significantly with strain rate and was in good
agreement with the reported values from the supplier.
Variability in the quasi-static tests was low, but higher
variability was noted for intermediate and high strain rate
test data. Further, it was found that the samples were not in
equilibrium for the high rate testing (*1000 s-1). How-
ever, the measured strength values followed the log-linear
relationship established at the lower strain rates and were
therefore reported in this study. Further testing is recom-
mended to measure the complete stress–strain response for
high deformation rate loading. The adhesive shear response
was measured using a thick adherend lap shear test, also
demonstrating an increase in strength with increasing strain
rate. The Mode I fracture toughness was previously mea-
sured using tapered double cantilever beam testing, while
the Mode II energy release rate was determined from the
shear test data. Future studies should include direct mea-
surement of Mode II toughness and the dependence of
toughness on deformation rate.
Implementation of the mechanical properties required
average curves which were established for a given loading
condition and deformation rate through an empirical curve
fit followed by a point-wise average of the plastic strain–
stress curves. The effect of deformation rate was incorpo-
rated through a linear relationship between the material
strength and the deformation rate. The strength values were
adequately described with a log-linear relationship; typical
coefficients of determination (r2) were 0.8 for tension and
0.6 for shear.
Two different numerical implementations were consid-
ered in this study, and verified using single element sim-
ulations, followed by simulation of the actual test samples.
A cohesive zone model using a cohesive element and the
associated constitutive model, incorporating deformation
rate effects provided a computationally efficient method of
representing the adhesive joint dimensions, stiffness and
failure response. It was noted, for the adhesives considered
in this study, the incorporation of deformation rate effects
was essential to accurately represent the material proper-
ties. In general, the cohesive model was able to reproduce
the experimental test data for pure tension and pure shear
for the toughened epoxy adhesives (DP-460NS and SA-
9850), with \8 % difference on average. The cohesive
zone model was able to reproduce the material strength of
the non-toughened epoxy adhesive (EC-2214) but did not
accurately reproduce the stress–strain response. Further
investigations should consider evaluation of the cohesive
model under mixed-mode loading.
Modeling was also undertaken using solid continuum
elements and a constitutive model developed for polymeric
materials. The solid elements were computationally more
expensive, with the benefit of improved prediction of the
stress conditions in the joint, when the mesh was suffi-
ciently small (1 mm for the tensile test simulation, and
0.25 mm for the thick lap shear simulation). The SAMP-1
constitutive model was accurate for stress prediction and
stress–strain response for all adhesive materials when pure
tension at different strain rates was considered. Under shear
loads at low strain rates, around the nominal strain rate of
the provided data, the response was very close to the
experimental data. One of the primary limitations of this
model, the use of strain rate effects in tension to describe
shear rate effects, was identified using the single element
test cases. For all materials tested in this study, the effect of
deformation rate on strength (i.e. log-linear slope) differed
for tension and shear. It was shown that the model can
produce large errors in the shear response at high strain
rates, and this is also expected to affect results for mixed
mode loading conditions. Additionally, it was shown that
134 J. dynamic behavior mater. (2016) 2:122–137
123
Page 14
the shear stress could not be linked to the tensile stress by
the use of traditional theories (e.g. von Mises). The three
tested materials demonstrated the need to have at least both
tensile and shear data available for proper modeling; it is
possible that this is the general case for structural epoxies.
Numerical simulation of structural adhesives requires a
constitutive model capable of calculating uncoupled strain
rate effects for tension and shear loading, and deformation
rate effects on strength must be considered if dynamic
conditions are expected. The results of this study indicate
that a cohesive zone model can provide an adequate rep-
resentation of an adhesive joint for tensile and shear
loading across a range of deformation rates.
Acknowledgments The authors would like to thank 3M Company,
Initiative for Advanced Manufacturing Innovation and Automotive
Partnerships Canada for financially supporting this research. The
authors would like thank Compute Canada for providing the neces-
sary computing resources and gratefully acknowledge Christopher
Thom and Jeff Wemp for their assistance in adhesive material testing.
References
1. SuperLight Car program (2013)
2. Lightweight Vehicle Structure Conference (2009)
3. Symietz D (2005) Structural adhesive bonding: the most inno-
vative joining technique for modern lightweight design, safety
and modular concepts—progress report. SAE International
4. Kochan A (1996) Lotus: aluminium extrusions and adhesives.
Assem Autom 16:19–21
5. Peroni L, Avalle M (2006) Experimental investigation of the
energy absorption capability of bonded crash boxes 87:445–454
6. Peroni L, Avalle M, Belingardi G (2009) Comparison of the
energy absorption capability of crash boxes assembled by spot-
weld and continuous joining techniques. Int J Impact Eng
36:498–511
7. Avalle M, Peroni L, Peroni M, Scattina A (2010) Bi-material
joining for car body structures: experimental and numerical
analysis. J Adhes 86:539–560
8. Fay PA, Suthurst GD (1990) Redesign of adhesively bonded box
beam sections for improved impact performance. Int J Adhes
Adhes 10:128–138
9. Belingardi G, Goglio L, Rossetto M (2005) Impact behaviour of
bonded built-up beams: experimental results. Int J Adhes Adhes
25:173–180
10. Goglio L, Peroni L, Peroni M, Rossetto M (2008) High strain-rate
compression and tension behaviour of an epoxy bi-component
adhesive. Int J Adhes Adhes 28:329–339
11. ASTM (2015) Standard D1876-08, 2015, standard test method for
peel resistance of adhesives (T-peel test). ASTM International,
West Conshohocken
12. ASTM (2015) Standard D1002-10, 2015, Standard test method
for aparent shear strength of single-lap-joint adhesively bonded
metal specimens by tension loading (metal-to-metal) peel resis-
tance of adhesives (T-peel test). West Conshohocken, ASTM
13. ASTM Website
14. Zhao X, Adams RD, Da Silva LFM (2011) Single lap joints with
rounded adherend corners: experimental results and strength
prediction. J Adhes Sci Technol 25:837–856
15. Zhao X, Adams RD, da Silva LFM (2010) A new method for the
determination of bending moments in single lap joints. Int J
Adhes Adhes 30:63–71
16. Adams RD, Harris JA (1987) The influence of local geometry on
the strength of adhesive joints. Int J Adhes Adhes 7:69–80
17. 3M. 3M Scoth Weld, EC-2214 Technical data sheet
18. 3M. 3M Scoth Weld, DP-460NS Technical data sheet
19. Gilat A, Goldberg RK, Roberts GD (2007) Strain rate sensitivity of
epoxy resin in tensile and shear loading. J Aerospace Eng 20:75–89
20. Kinloch AJ, Kodokian GA, Jamarani MB (1987) Impact prop-
erties of epoxy polymers. J Mater Sci 22:4111–4120
21. Sue HJ, Garcia-Meitin E, Orchard NA (1993) Toughening of
epoxies via craze-like damage. J Polym Sci Part B 31:595–608
22. Jang BZ, Uhlmann DR, Vander Sande JB (1985) Rubber particle
size dependence of crazing in Polypropylene. Polym Eng Sci
25:643–651
23. Choupani N (2008) Mixed-mode cohesive fracture of adhesive
joints: experimental and numerical studies. Eng Fract Mech
75:4363–4382
24. Liu K, Piggott MR (1998) Fracture failure processes in polymers.
I: mechanical tests and results. Polym Eng Sci 38:60–68
25. Mostovoy S, Ripling E, Bersch C (1971) Fracture toughness of
adhesive joints. J Adhes 3:125–144
26. Kinloch AJ, Kodokian GKA, Jamarani MB (1987) Impact of
properties of engineering adhesives. In: 2nd international con-
ference of adhesion. Plastic & Rubber Institute, p 1400
27. Cheng CM, Hiltner A, Baer E, Soskey P, Mylonakis SG (1994)
Deformation of rubber-toughened polycarbonate—macroscale
analysis of the damage zone. J Appl Polym Sci 52:177–193
28. Tang CY, Tsui CP, Shen W, Li CC, Peng LH (2000) Modelling
of non-linear stress and strain behaviour of \HIPS with craze
damage in tensile loading and unloading process. Polym Test
20:15
29. Nagai T, Iwamoto T, Sawa T, Sekiguchi Y, Kuramoto H, Uesugi
N (2008) An experimental study on the impact deformation and
the strain rate sensitivity in some structural adhesives. In: 9th
AEPA 2008-Engineering plasticity and it’s applications confer-
ence, pp 218–223
30. Yokoyama T, Nakai K (2006) Determination of impact tensile
properties of structural epoxy adhesive butt joints using a hat-
shaped specimen. J de Phys IV 134:789–795
31. Farrokh B, Khan AS (2010) A strain rate dependent yield crite-
rion for isotropic polymers: low to high rates of loading. Eur J
Mech A/Solids 29:274–282
32. Mulliken AD, Boyce MC (2006) Mechanics of the rate-dependent
elastic–plastic deformation of glassy polymers from low to high
strain rates. Int J Solids Struct 43:1331–1356
33. Beguelin P, Barbezat M, Kausch HH (1991) Mechanical char-
acterization of polymers and composites with a servohydraulic
high-speed tensile tester. J de Phys 1:1867–1880
34. Georgiou I, Ivankovic A, Kinloch AJ, Tropsa V (2003) Rate
dependent fracture behaviour of adhesively bonded joints. Eur
Struct Integr Soc 32:317–328
35. Jamarani MB, Reed PE, Davies WR (1989) Fracture behaviour of
UPVC thin tubes at high loading rates. Part 2. Validity of fracture
toughness tests and the effects of rate. J Mater Sci 24:2917–2922
36. Khalil AA, Bayoumi MR (1991) Effect of loading rate on fracture
toughness of bonded joints. Eng Fract Mech 39:1037–1043
37. Loo S, Zhang X, Ng H, Tee T, Mhaisalkar SG (2007) Impact of
thermal, moisture, and mechanical loading conditions on inter-
facial fracture toughness of adhesively bonded joints. J Electron
Mater 36:110–116
38. Selby K, Miller L (1975) Velocity dependent fracture toughness
of epoxy-resins—reply. J Mater Sci 10:2003
39. LS-Dyna Aerospace working group (2013) Modeling guideline
document:163
J. dynamic behavior mater. (2016) 2:122–137 135
123
Page 15
40. da Silva LFM, Ochsner A (2008) Modeling of adhesively bonded
joints. Springer, Berlin
41. da Silva LFM (2012) Advances in numerical modelling of
adhesive joints. Springer, Berlin
42. Morin D, Bourel B, Bennani B, Lauro F, Lesueur D (2013) A new
cohesive element for structural bonding modelling under dynamic
loading. Int J Impact Eng 53:94–105
43. Marzi S, Hesebeck O, Brede M, Kleiner F (2009) A rate-de-
pendent, elasto-plastic cohesive zone mix-mode model for crash
analysis of adhesively bonded joints. In: LS-Dyna European
conference. Dynamore Gmbh
44. Marzi S, Hesebeck O, Brede M, Kleiner F (2009) A rate-de-
pendent cohesive zone model for adhesively bonded joints loaded
in mode i. J Adhes Sci Technol 23:881–898
45. Kolling S, Haufe A, Feucht M, Du Bois PA (2006) A constitutive
formulation for polymers subjected to high strain rates. In: 9th
international LS-Dyna users conference. Detroit, pp 15–55
46. Richardson G, Crocombe AD, Smith PA (1993) Comparison of
two- and three-dimensional finite element analyses of adhesive
joints. Int J Adhes Adhes 13:193–200
47. Garcıa JA, Chiminelli A, Garcıa B, Lizaranzu M, Jimenez MA
(2011) Characterization and material model definition of tough-
ened adhesives for finite element analysis. Int J Adhes Adhes
31:182–192
48. Castagnetti D, Dragoni E (2009) Standard finite element tech-
niques for efficient stress analysis of adhesive joints. Int J Adhes
Adhes 29:125–135
49. Wu G, Crocombe AD (1996) Simplified finite element modelling
of structural adhesive joints. Comput Struct 61:385–391
50. van Hoof J (1999) Modelling of impact induced delamination in
composite materials. Doctoral dissertation, Carleton University,
Ottawa
51. Livermore software technology corporation (LSTC) (2007) LS-
DYNA Keyword user manual, Version 971. Livermore: LSTC
52. Iwamoto T, Nagai T, Sawa T (2010) Experimental and compu-
tational investigations on strain rate sensitivity and deformation
behavior of bulk materials made of epoxy resin structural adhe-
sive. Int J Solids Struct 47:175–185
53. Boyce MC, Parks DM, Argon AS (1988) Large inelastic defor-
mation of glassy polymers. part I: rate dependent constitutive
model. Mech Mater 7:15–33
54. Needleman A (1990) An analysis of tensile decohesion along an
interface. J Mech Phys Solids 38:289–324
55. Yang QD, Thouless MD, Ward SM (1999) Numerical simulations
of adhesively-bonded beams failing with extensive plastic
deformation. J Mech Phys Solids 47:1337–1353
56. Mi Y, Crisfield MA, Davies GAO, Hellweg HB (1998) Pro-
gressive delamination using interface elements. J Compos Mater
32:1246–1272
57. Needleman A (2014) Some issues in cohesive surface modeling.
Procedia IUTAM 10:221–246
58. Trimino L (2012) Analysis and performance of adhesively bon-
ded crush tube structures. M.Sc. Mech. Eng Thesis, University of
Waterloo, Waterloo, Ontario, Canada
59. Boqaileh K (2015) Experimental testing and modelling of adhe-
sively joined T-structures. M.Sc. Mech. Eng Thesis, University of
Waterloo, Waterloo, Ontario, Canada
60. Belingardi G, Chiandussi G (2004) Stress flow in thin-walled box
beams obtained by adhesive bonding joining technology. Int J
Adhes Adhes 24:423–439
61. Cavalli MN, Thouless MD, Yang QD (2004) Cohesive-zone
modeling of the deformation and fracture of weld-bonded joints.
Weld J (Miami Fla) 83:133-S–139-S
62. 3M. 3M Scoth Weld, EC-2214 Safety data sheet
63. 3M. 3M Scoth Weld, DP-460NS Safety data sheet
64. Caruso Dailey MM, Trimino L, Cronin D. 3M Scotch Weld
(2012) SA-9850 Preliminary Technical data sheet, personal
communication
65. Smerd R, Winkler S, Salisbury C, Worswick M, Lloyd D, Finn M
(2006) High strain rate tensile testing of automotive aluminum
alloy sheet. Int J Impact Eng 32:541–560
66. ASTM (2008) Standard, D638-08, 2008, standard test method for
tensile properties of plastics. West Conshohocken, ASTM
67. Bardelcik A, Worswick MJ, Wells MA (2014) The influence of
martensite, bainite and ferrite on the as-quenched constitutive
response of simultaneously quenched and deformed boron steel—
experiments and model. Mater Des 55:509–525
68. Sutton MA (2009) Image correlation for shape, motion and
deformation measurements basic concepts, theory and applica-
tions. Springer, New York
69. Correlated solutions (2009) VIC-2D
70. ASTM (2012) Standard D5656-10, 2012, standard test method for
thick adherend metal lap-shear joint for determination of the
stress–strain behavior of adhesives in shear by tension loading.
West Conshohocken, ASTM
71. Doghri I, Muller A, Taylor RL (1998) A general three-dimen-
sional contact procedure for implicit finite element codes. Eng
Comput (Swansea, Wales) 15:233–259
72. Greve L, Andrieux F (2007) Deformation and failure modelling
of high strength adhesives for crash simulation. Int J Fract
143:143–160
73. Trimino LF, Cronin DS, Caruso Dailey MM (2015) Characteri-
zation of structural epoxy adhesives. In: SEM 2014 conference
procedures. Springer, p 185
74. Livermore software technology corporation (LSTC). LS-DYNA.
2014;ls971_d_R5.1.1
75. ASTM (2012) Standard, D3433-99, 2012, standard test method
for fracture strength in cleavage of adhesives in bonded metal
joints. West Conshohocken, ASTM
76. Sridharan S (2008) Delamination behaviour of composites, vol
726. Woodhead Pub, Cambridge
77. Blackman BRK, Kinloch AJ, Paraschi M (2003) On the mode ii
loading of adhesive joints. Eur Struct Integr Soc 32:293–304
78. Kafkalidis MS, Thouless MD, Yang QD, Ward SM (2000)
Deformation and fracture of adhesive layers constrained by plas-
tically-deforming adherends. J Adhes Sci Technol 14:1593–1607
79. Tvergaard V, Hutchinson JW (1992) Relation between crack
growth resistance and fracture process parameters in elastic-
plastic solids. J Mech Phys Solids 40:1377
80. Turon A, Davila CG, Camanho PP, Costa J (2007) An engineering
solution for mesh size effects in the simulation of delamination
using cohesive zone models. Eng Fract Mech 74:1665–1682
81. Livermore software technology corporation (LSTC) (2007) LS-
DYNA Keyword user manual, Material Models, Version 971.
Livermore: LSTC
82. Blazynski TZ (1987) Materials at high strain rates. Elsevier
Applied Science, London
83. Alves M (2000) Material constitutive law for large strains and
strain rates. J Eng Mech 126:215–218
84. Morin D, Haugou G, Bennani B, Lauro F (2011) Experimental
characterization of a toughened epoxy adhesive under a large
range of strain rates. J Adhes Sci Technol 25:1581–1602
85. ASTM (2010) Standard, E11–04, 2010, standard test method for
young’s modulus, tangent modulus and chord modulus. West
Conshohocken, ASTM
86. Chen W, Zhang B, Forrestal MJ (1999) A split Hopkinson bar
technique for low-impedance materials. Exp Mech 39:81–85
87. Chen W, Lu F, Cheng M (2002) Tension and compression tests of
two polymers under quasi-static and dynamic loading. Polym
Test 21:113–121
136 J. dynamic behavior mater. (2016) 2:122–137
123
Page 16
88. Rae PJ, Brown EN (2005) The properties of poly(tetrafluo-
roethylene) (PTFE) in tension. Polymer 46:8128–8140
89. ASTM (2014) Standard, B831-14, 2014, standard test method for
shear testing of thin aluminum products. West Conshohocken,
ASTM
90. Morin D, Haugou G, Bennani B, Lauro F (2010) Identification of
a new failure criterion for toughened epoxy adhesive. Eng Fract
Mech 77:3481–3500
91. Banks-Sills L, Arcan M, Bortman Y (1984) Mixed mode fracture
specimen for mode II dominat deformation. Eng Fract Mech
20:145–157
92. Jamarani MB, Reed PE, Davies WR (1988) Fracture behaviour of
UPVC thin tubes at high loading rates. J Mater Sci 23:4437–4444
93. Selby K, Miller L (1975) Fracture toughness and mechanical-
behavior of an epoxy-resin. J Mater Sci 10:12–24
J. dynamic behavior mater. (2016) 2:122–137 137
123