Evaluation of Rebar Corrosion in Concrete by Active Thermal Sensing DANA E. POULAIN DENNIS R. ALEXANDER JOSEPH K. KRAUSE University of Nebraska–Lincoln ABSTRACT Active thermal (infrared) sensing has been used to locate simulated areas of corrosion in uncoated rebar test specimens embedded in concrete slabs. Varying amounts of rebar corrosion were simulated experimentally by milling notches into steel bars and then filling the notches with an iron oxide paste. The rebars were embedded in concrete and then resistively heated using DC current. Images of the heated rebars (in concrete) were acquired using an infrared focal plane array camera. Infrared images, illustrating the ability to detect non-destructively a reduction in rebar cross-sectional area of only 10 percent, are presented. In addition, results are presented demonstrating the dependence of the resulting thermal images on the orientation of the defect. INTRODUCTION In recent years the sensitivity of infrared cameras has increased considerably. This increase in sensitivity has led to new investigations to determine their usefulness in a variety of testing and diagnostic applications. Among these are locating corrosion in aluminum aircraft components (1) and delaminations in composite materials (2), evaluation of coatings (3), and a wide variety of predictive/preventative maintenance applications. Infrared imaging has also been used in the last 10–15 years to identify delaminations in concrete (4,5 ). The sensitivity of the cameras in these early studies was on the order of 0.1°C. Due to advances in infrared focal plane technology, today’s cameras have a greater temperature resolution than those used just a few years ago. The infrared focal plane array (IR-FPA) camera used in this investigation measures the intensity of radiation in the 3–5 µm range, and has a relative temperature sensitivity of less than 0.01°C for an object at room temperature and emissivity of 0.95. This increased sensitivity allows less significant flaws to be detected through their previously undetectable surface temperature change. Subsurface structures, with at least slightly differing thermal properties, can be viewed by observing variations in the surface temperature profile during transient heat flow through the material. For example, air has a thermal conductivity seventy times less than that of concrete. Thus, concrete containing a pocket of air will conduct much less heat than a neighboring region of solid concrete. The heat flux required to produce an observable surface temperature variation in a bridge deck or similarly large concrete structure is significant. A readily available source for a large transient heat flux occurs during the rising and setting of the sun. The diurnal cycle has been used effectively in B-7 / 1
Transcript
Evaluation of Rebar Corrosion in Concreteby Active Thermal Sensing
DANA E. POULAIN
DENNIS R. ALEXANDER
JOSEPH K. KRAUSE
University of Nebraska–Lincoln
ABSTRACT
Active thermal (infrared) sensing has been used to locate simulated areas of corrosion inuncoated rebar test specimens embedded in concrete slabs. Varying amounts of rebarcorrosion were simulated experimentally by milling notches into steel bars and thenfilling the notches with an iron oxide paste. The rebars were embedded in concrete andthen resistively heated using DC current. Images of the heated rebars (in concrete) wereacquired using an infrared focal plane array camera. Infrared images, illustrating theability to detect non-destructively a reduction in rebar cross-sectional area of only 10 percent, are presented. In addition, results are presented demonstrating the dependenceof the resulting thermal images on the orientation of the defect.
INTRODUCTION
In recent years the sensitivity of infrared cameras has increased considerably. Thisincrease in sensitivity has led to new investigations to determine their usefulness in avariety of testing and diagnostic applications. Among these are locating corrosion inaluminum aircraft components (1) and delaminations in composite materials (2),evaluation of coatings (3), and a wide variety of predictive/preventative maintenanceapplications. Infrared imaging has also been used in the last 10–15 years to identifydelaminations in concrete (4,5 ). The sensitivity of the cameras in these early studies wason the order of 0.1°C. Due to advances in infrared focal plane technology, today’scameras have a greater temperature resolution than those used just a few years ago. Theinfrared focal plane array (IR-FPA) camera used in this investigation measures theintensity of radiation in the 3–5 µm range, and has a relative temperature sensitivity ofless than 0.01°C for an object at room temperature and emissivity of 0.95. This increasedsensitivity allows less significant flaws to be detected through their previouslyundetectable surface temperature change.
Subsurface structures, with at least slightly differing thermal properties, can beviewed by observing variations in the surface temperature profile during transient heatflow through the material. For example, air has a thermal conductivity seventy times lessthan that of concrete. Thus, concrete containing a pocket of air will conduct much lessheat than a neighboring region of solid concrete. The heat flux required to produce anobservable surface temperature variation in a bridge deck or similarly large concretestructure is significant. A readily available source for a large transient heat flux occursduring the rising and setting of the sun. The diurnal cycle has been used effectively in
B-7 / 1
ISC
PC WITHPCI
INTERFACE
REINFORCED CONCRETE
IR FPACAMERA
FOV
BATTERY
SWITCH
CALIBRATEDRESISTOR
B-7 / 2 TRB Transportation Research Circular 498
many infrared imaging applications. However, “passive” thermal heating by the sun hastwo drawbacks: (a) use is limited to specific times of day and is subject to climateconditions, and (b) the length of time over which the thermal transients occur is relativelylong, such that thermal diffusion results in image “blurring” and a loss of resolution. Asan alternative, “active” heating can be used to produce large thermal transients in manyapplications. Flashlamps have been used successfully to produce microsecond transientsin materials with high thermal conductivity, such as sheet metals and compositematerials. Carbon dioxide lasers have also been used in locating simulated landmines insand and soil (6 ). By reducing the time span of the thermal impulse, thermal diffusioneffects are minimized, resulting in more detailed image resolution.
The active heating technique in this work uses an electrical current to resistivelyheat a section of rebar embedded in concrete. Resistive heating was chosen because ofthe ability to uniformly heat a rebar, overall simplicity of the components, and costeffectiveness. Results are presented on the ability of the thermal imaging system toevaluate rebar containing simulated regions of corrosion. The degree of cross-sectionreduction and orientation of corroded regions relative to the imaging plane have beeninvestigated.
EXPERIMENTAL SETUP
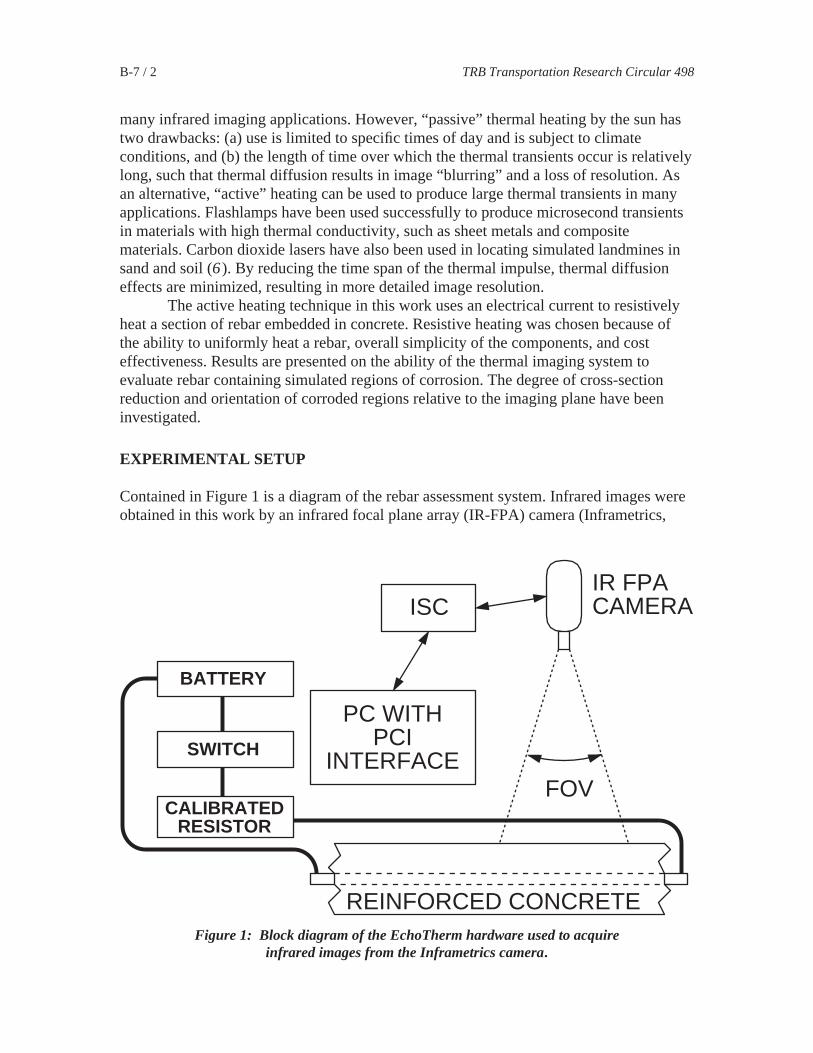
Contained in Figure 1 is a diagram of the rebar assessment system. Infrared images wereobtained in this work by an infrared focal plane array (IR-FPA) camera (Inframetrics,
Figure 1: Block diagram of the EchoTherm hardware used to acquireinfrared images from the Inframetrics camera.
Poulain, Alexander, and Krause B-7 / 3
Model SC1000 ThermaCam). The IR-FPA is a platinum silicide (PtSi) CMOS 256×256array, sensitive in the 3.4–5.0 µm spectral range and has variable integration time.Interchangeable zinc selenide lenses provide either a 16° or 32° field of view. Thetemperature sensitivity of the camera is ~0.01°C. The camera can be operated manuallythrough a keypad or remotely through a serial RS-232 interface.
Two automotive car batteries (Sears Diehard Gold), each rated at 1000 A, wereused to resistively heat the rebar. Voltage measurements across a calibrated 50 µΩresistor connected in series with the rebar were used to accurately measure the currentpassing through the circuit. Stranded copper wire (4 AWG) was used to make the circuitconnections.
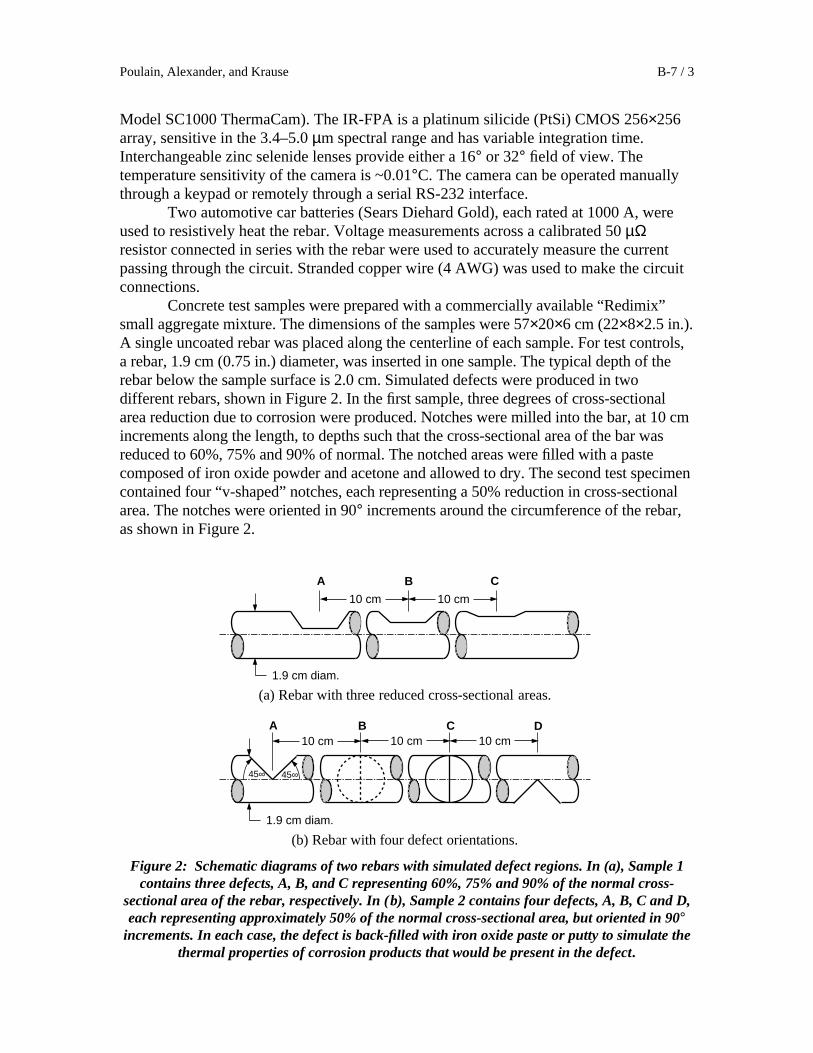
Concrete test samples were prepared with a commercially available “Redimix”small aggregate mixture. The dimensions of the samples were 57×20×6 cm (22×8×2.5 in.).A single uncoated rebar was placed along the centerline of each sample. For test controls,a rebar, 1.9 cm (0.75 in.) diameter, was inserted in one sample. The typical depth of therebar below the sample surface is 2.0 cm. Simulated defects were produced in twodifferent rebars, shown in Figure 2. In the first sample, three degrees of cross-sectionalarea reduction due to corrosion were produced. Notches were milled into the bar, at 10 cmincrements along the length, to depths such that the cross-sectional area of the bar wasreduced to 60%, 75% and 90% of normal. The notched areas were filled with a pastecomposed of iron oxide powder and acetone and allowed to dry. The second test specimencontained four “v-shaped” notches, each representing a 50% reduction in cross-sectionalarea. The notches were oriented in 90° increments around the circumference of the rebar,as shown in Figure 2.
10 cm 10 cm
1.9 cm diam.
A B C
(a) Rebar with three reduced cross-sectional areas.
10 cm 10 cm 10 cm
1.9 cm diam.
45∞ 45∞
A B C D
(b) Rebar with four defect orientations.
Figure 2: Schematic diagrams of two rebars with simulated defect regions. In (a), Sample 1contains three defects, A, B, and C representing 60%, 75% and 90% of the normal cross-
sectional area of the rebar, respectively. In (b), Sample 2 contains four defects, A, B, C and D,each representing approximately 50% of the normal cross-sectional area, but oriented in 90°
increments. In each case, the defect is back-filled with iron oxide paste or putty to simulate thethermal properties of corrosion products that would be present in the defect.
B-7 / 4 TRB Transportation Research Circular 498
The data acquisition system (Thermal Wave Imaging Inc., EchoTherm) consistsof a program interface and three main hardware components: ISC-PCI interface card,Intelligent System Controller (ISC), and camera bus interface. The IR-FPA cameraoutputs image data at the rate of 60 frames per second. The bus interface converts thevoltage levels of the IR-FPA data to the voltage used by the ISC data bus. The ISCtransmits acquired data to the computer through the PCI interface, and transmitscommands from the computer to the IR-FPA. If it is desired to collect data at less than60 frames per second, the ISC can select every nth frame by specifying an index n. Thestored data can be combined through software into a series of gates. Each gate consistsof a prescribed number of frames averaged together. Up to 20 gates can be selected froma set of data. By averaging multiple frames together, the signal to noise ratio (SNR) canbe reduced to provide clearer images. The infrared data acquisition system wasoriginally designed with an emphasis on imaging relatively fast thermal variations, suchas those associated with sheet metal and composite plates. With large concrete massesthe characteristic time of the thermal processes is much slower. To increase thecapabilities of the system to investigate much longer time frames, a manual dataacquisition box was constructed. The box increases the length of time over which datacan be acquired and permits a greater number of frames to be averaged together toreduce the SNR.
RESULTS
IR-FPA Calibration
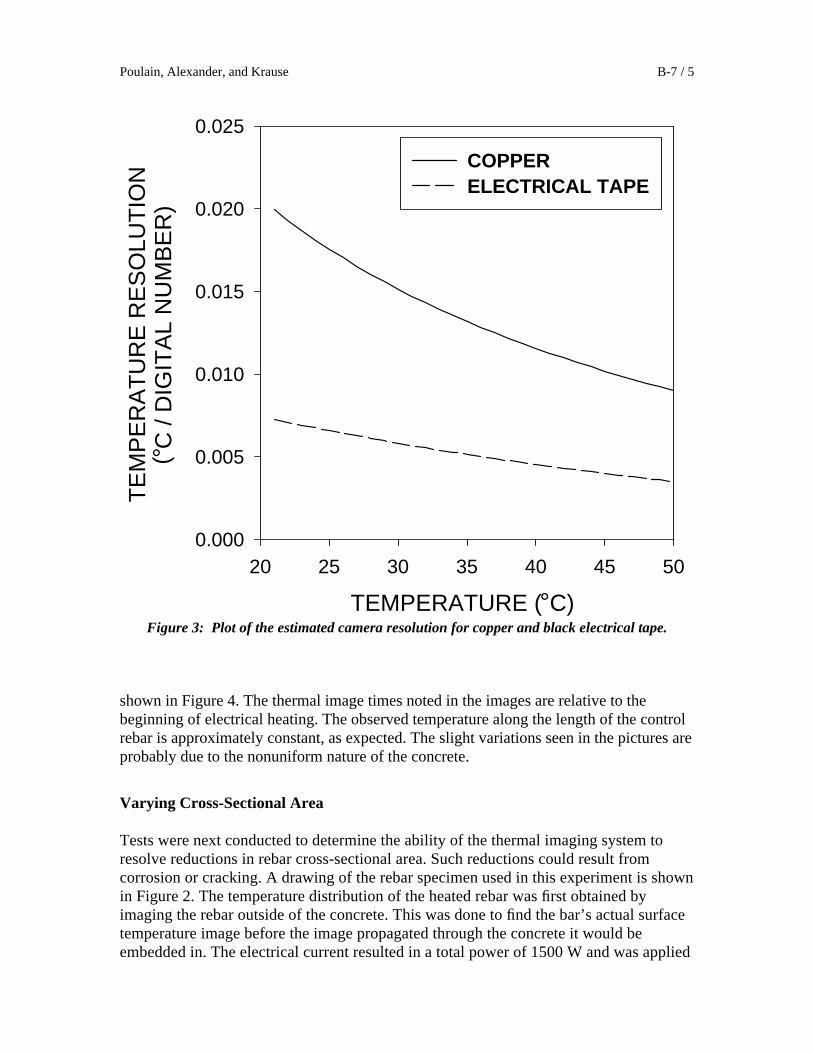
The IR-FPA was first calibrated so that digital numbers (DN) from the camera could beconverted to temperatures. Since the camera measures the temperature through theintensity of the infrared light reaching the detector, the approximate emissivity of thesurface to be imaged should be known (7 ). A calibration was done for both copper (ε = 0.38) (8) and black electrical tape (ε = 0.95) (9). The experimental data was taken atan ambient temperature of 24°C. The temperature resolution of the IR-FPA for copperand black electrical tape as a function of temperature was derived from a quadraticapproximation of the temperature calibration, and is shown in Figure 3. The temperatureresolution is dependent upon both the temperature of the object and its emissivity. Thedifference in emissivity of copper and black electrical tape results in more than a factor oftwo difference in the temperature resolution. This means that if the maximumtemperature resolution is desired, an object’s surface should have an emissivity near one,and that the object’s temperature should be as high as possible.
Control Rebar
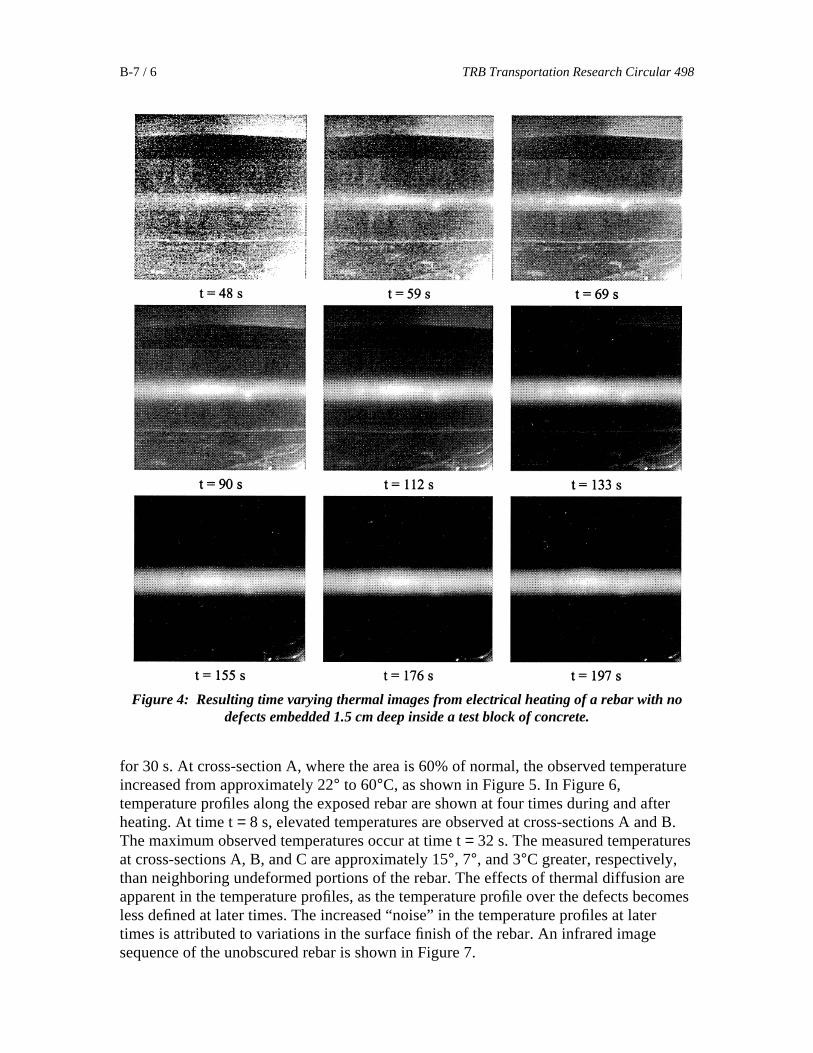
In order to determine the difference between rebars with and without defects, one rebarwithout any defects was embedded into a concrete test block. The control rebar was 1.9 cm in diameter and 93 cm in length and contained no apparent defects. An electricalcurrent of 1500 A was applied to the rebar for 30 s. The power generated in the rebar wasestimated to 1350 W. A series of infrared images acquired over a period of 3.5 minutes is
Poulain, Alexander, and Krause B-7 / 5
shown in Figure 4. The thermal image times noted in the images are relative to thebeginning of electrical heating. The observed temperature along the length of the controlrebar is approximately constant, as expected. The slight variations seen in the pictures areprobably due to the nonuniform nature of the concrete.
Varying Cross-Sectional Area
Tests were next conducted to determine the ability of the thermal imaging system toresolve reductions in rebar cross-sectional area. Such reductions could result fromcorrosion or cracking. A drawing of the rebar specimen used in this experiment is shownin Figure 2. The temperature distribution of the heated rebar was first obtained byimaging the rebar outside of the concrete. This was done to find the bar’s actual surfacetemperature image before the image propagated through the concrete it would beembedded in. The electrical current resulted in a total power of 1500 W and was applied
TEMPERATURE ( C)
20 25 30 35 40 45 50
TE
MP
ER
AT
UR
E R
ES
OLU
TIO
N(
C /
DIG
ITA
L N
UM
BE
R)
0.000
0.005
0.010
0.015
0.020
0.025
COPPERELECTRICAL TAPE
°
°Figure 3: Plot of the estimated camera resolution for copper and black electrical tape.
B-7 / 6 TRB Transportation Research Circular 498
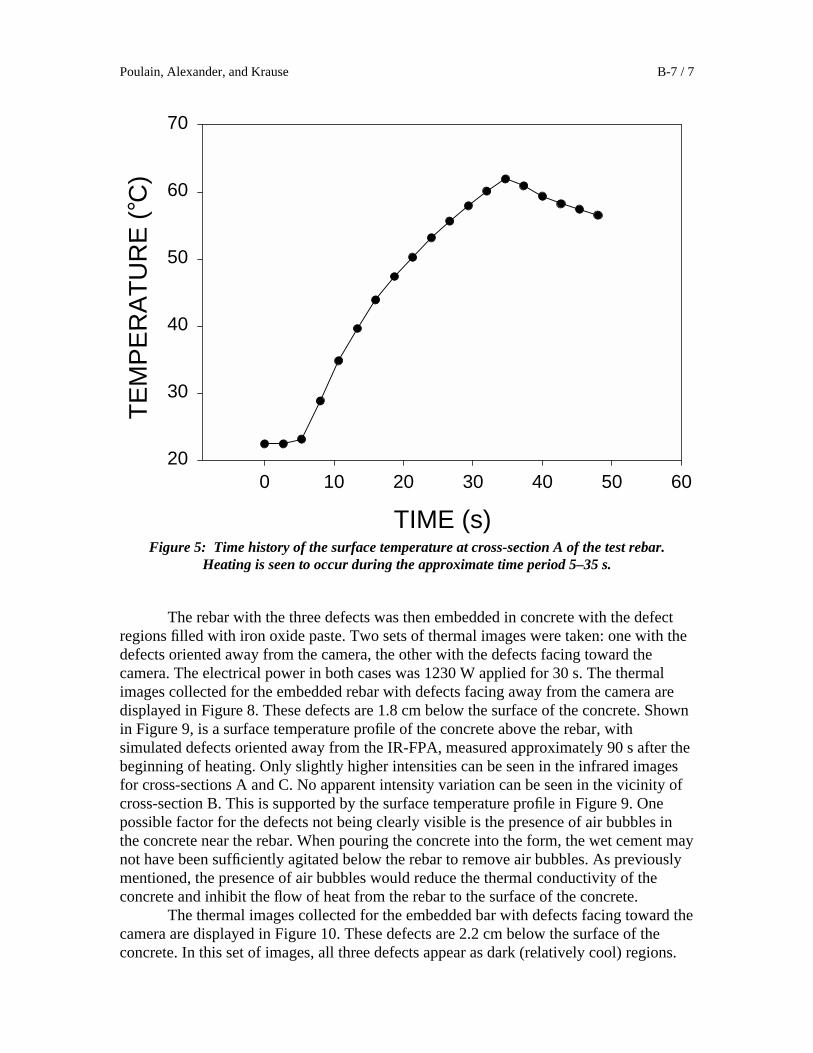
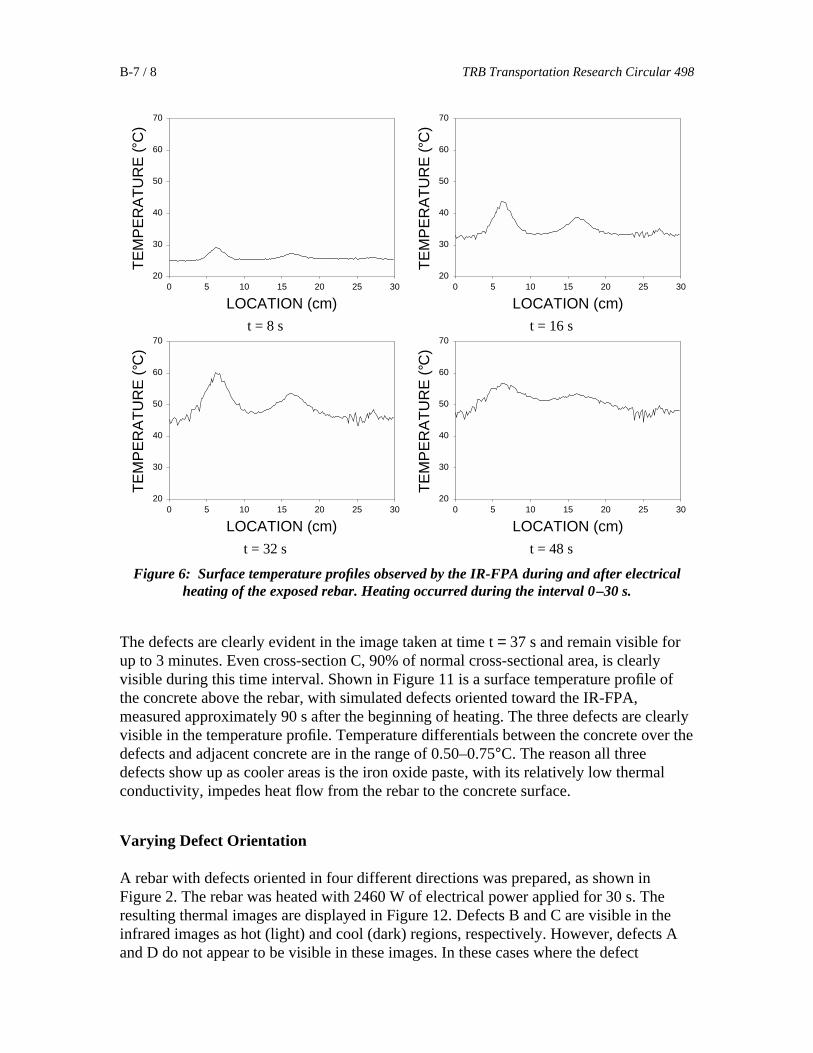
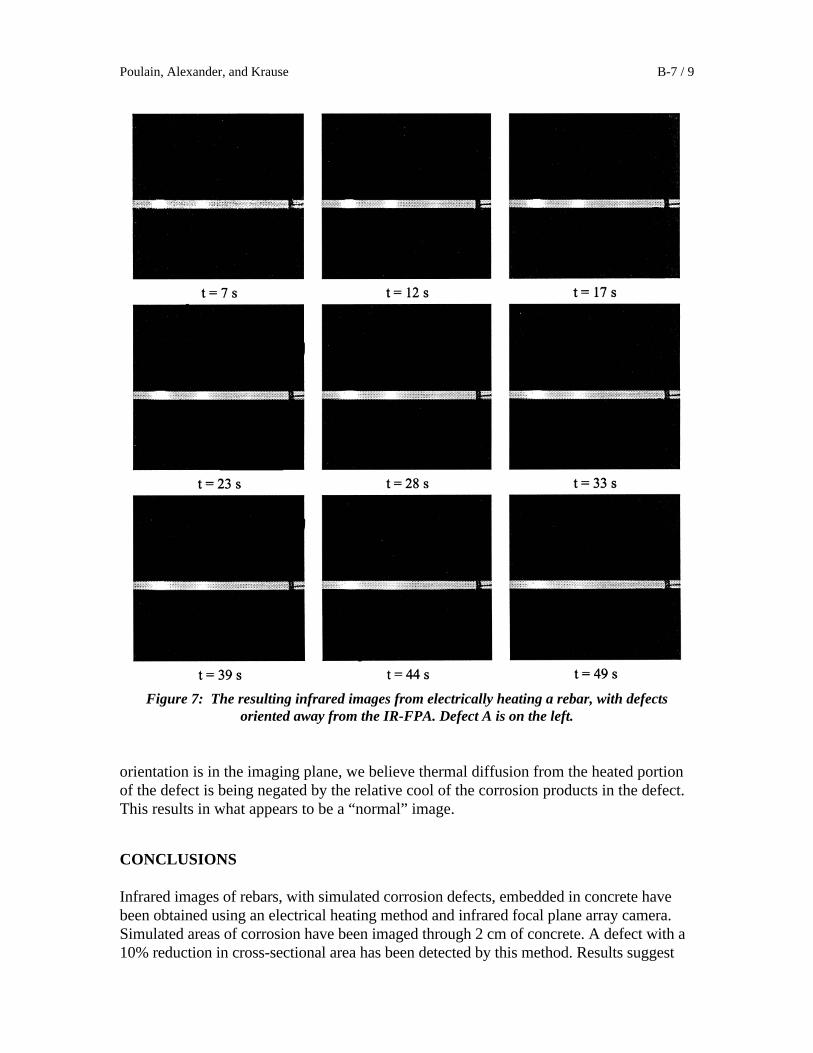
for 30 s. At cross-section A, where the area is 60% of normal, the observed temperatureincreased from approximately 22° to 60°C, as shown in Figure 5. In Figure 6,temperature profiles along the exposed rebar are shown at four times during and afterheating. At time t = 8 s, elevated temperatures are observed at cross-sections A and B.The maximum observed temperatures occur at time t = 32 s. The measured temperaturesat cross-sections A, B, and C are approximately 15°, 7°, and 3°C greater, respectively,than neighboring undeformed portions of the rebar. The effects of thermal diffusion areapparent in the temperature profiles, as the temperature profile over the defects becomesless defined at later times. The increased “noise” in the temperature profiles at latertimes is attributed to variations in the surface finish of the rebar. An infrared imagesequence of the unobscured rebar is shown in Figure 7.
Figure 4: Resulting time varying thermal images from electrical heating of a rebar with nodefects embedded 1.5 cm deep inside a test block of concrete.
Poulain, Alexander, and Krause B-7 / 7
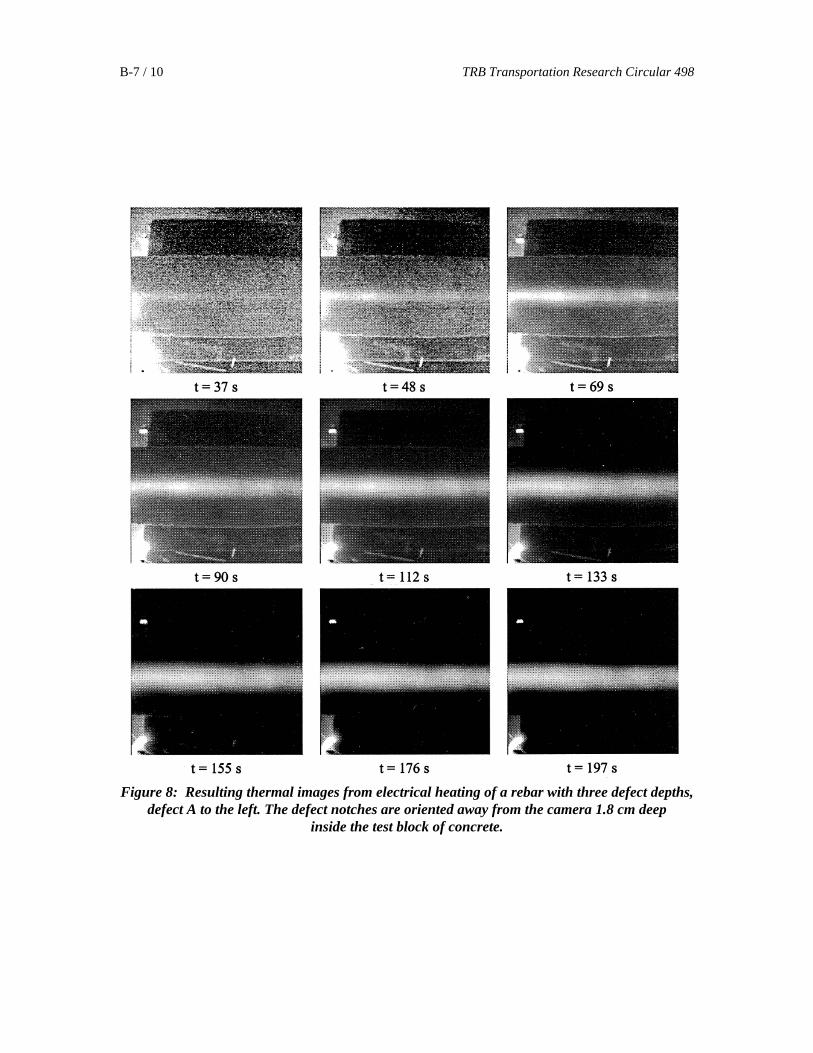
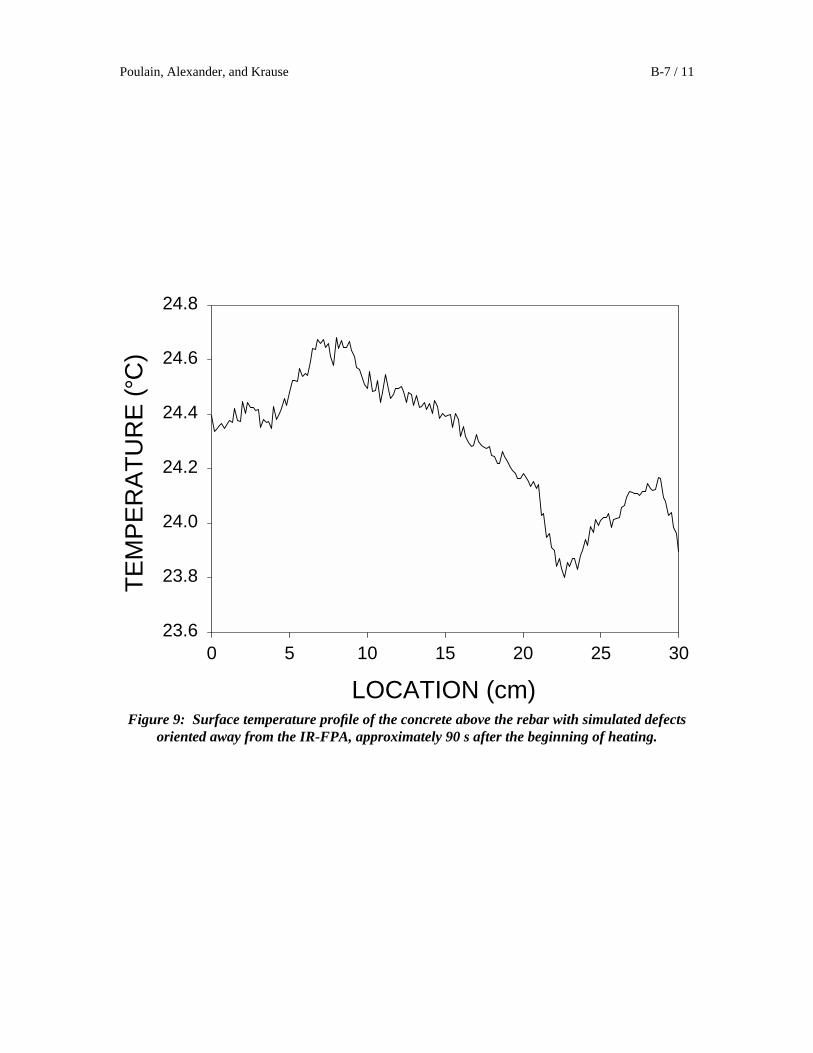
The rebar with the three defects was then embedded in concrete with the defectregions filled with iron oxide paste. Two sets of thermal images were taken: one with thedefects oriented away from the camera, the other with the defects facing toward thecamera. The electrical power in both cases was 1230 W applied for 30 s. The thermalimages collected for the embedded rebar with defects facing away from the camera aredisplayed in Figure 8. These defects are 1.8 cm below the surface of the concrete. Shownin Figure 9, is a surface temperature profile of the concrete above the rebar, withsimulated defects oriented away from the IR-FPA, measured approximately 90 s after thebeginning of heating. Only slightly higher intensities can be seen in the infrared imagesfor cross-sections A and C. No apparent intensity variation can be seen in the vicinity ofcross-section B. This is supported by the surface temperature profile in Figure 9. Onepossible factor for the defects not being clearly visible is the presence of air bubbles inthe concrete near the rebar. When pouring the concrete into the form, the wet cement maynot have been sufficiently agitated below the rebar to remove air bubbles. As previouslymentioned, the presence of air bubbles would reduce the thermal conductivity of theconcrete and inhibit the flow of heat from the rebar to the surface of the concrete.
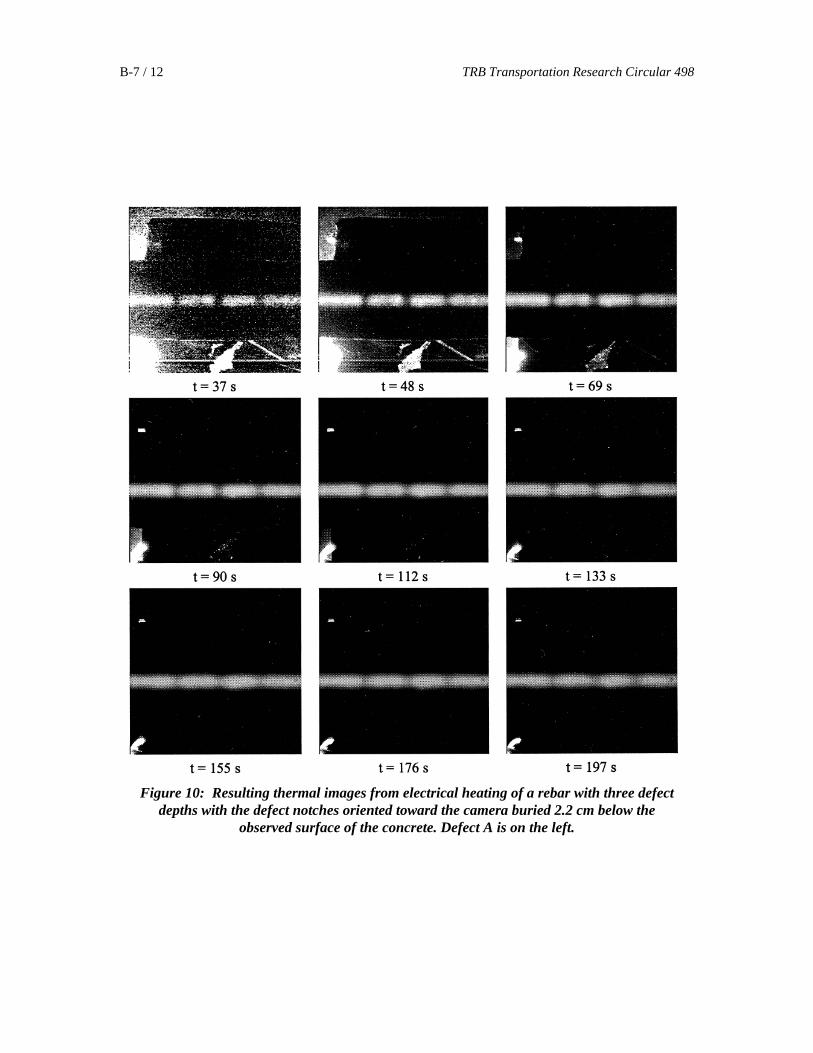
The thermal images collected for the embedded bar with defects facing toward thecamera are displayed in Figure 10. These defects are 2.2 cm below the surface of theconcrete. In this set of images, all three defects appear as dark (relatively cool) regions.
TIME (s)
0 10 20 30 40 50 60
TE
MP
ER
AT
UR
E (
C)
20
30
40
50
60
70
°
Figure 5: Time history of the surface temperature at cross-section A of the test rebar.Heating is seen to occur during the approximate time period 5–35 s.
B-7 / 8 TRB Transportation Research Circular 498
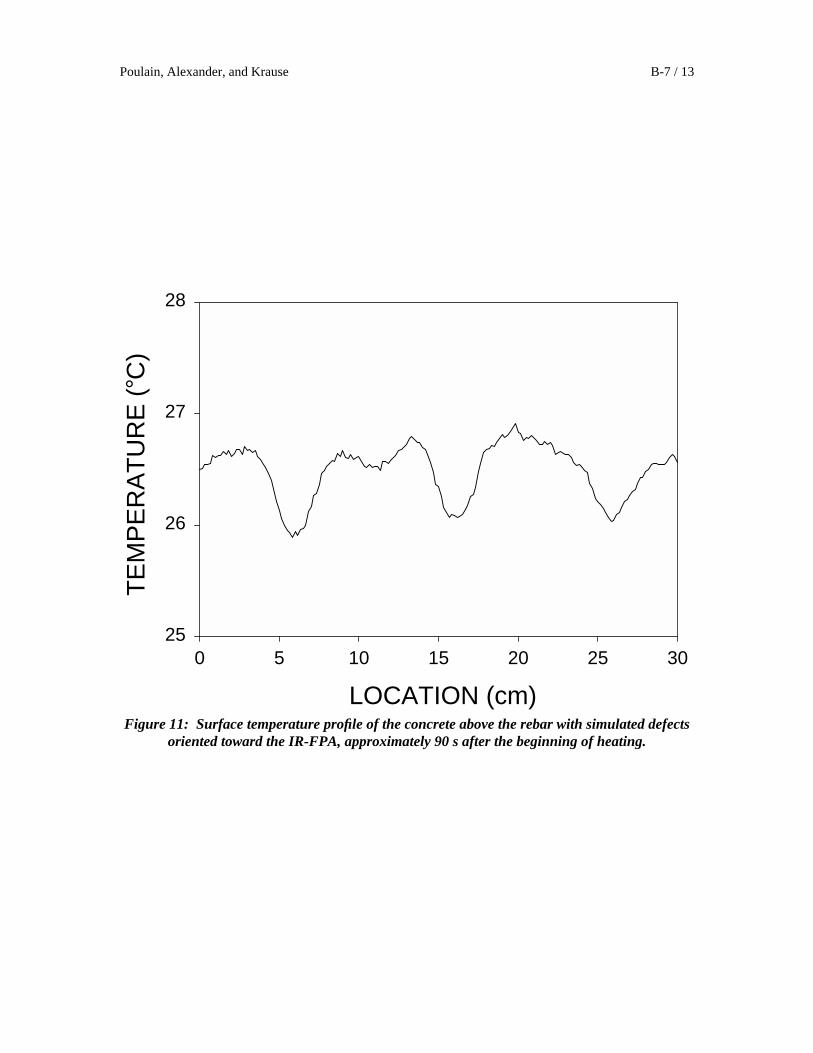
The defects are clearly evident in the image taken at time t = 37 s and remain visible forup to 3 minutes. Even cross-section C, 90% of normal cross-sectional area, is clearlyvisible during this time interval. Shown in Figure 11 is a surface temperature profile ofthe concrete above the rebar, with simulated defects oriented toward the IR-FPA,measured approximately 90 s after the beginning of heating. The three defects are clearlyvisible in the temperature profile. Temperature differentials between the concrete over thedefects and adjacent concrete are in the range of 0.50–0.75°C. The reason all threedefects show up as cooler areas is the iron oxide paste, with its relatively low thermalconductivity, impedes heat flow from the rebar to the concrete surface.
Varying Defect Orientation
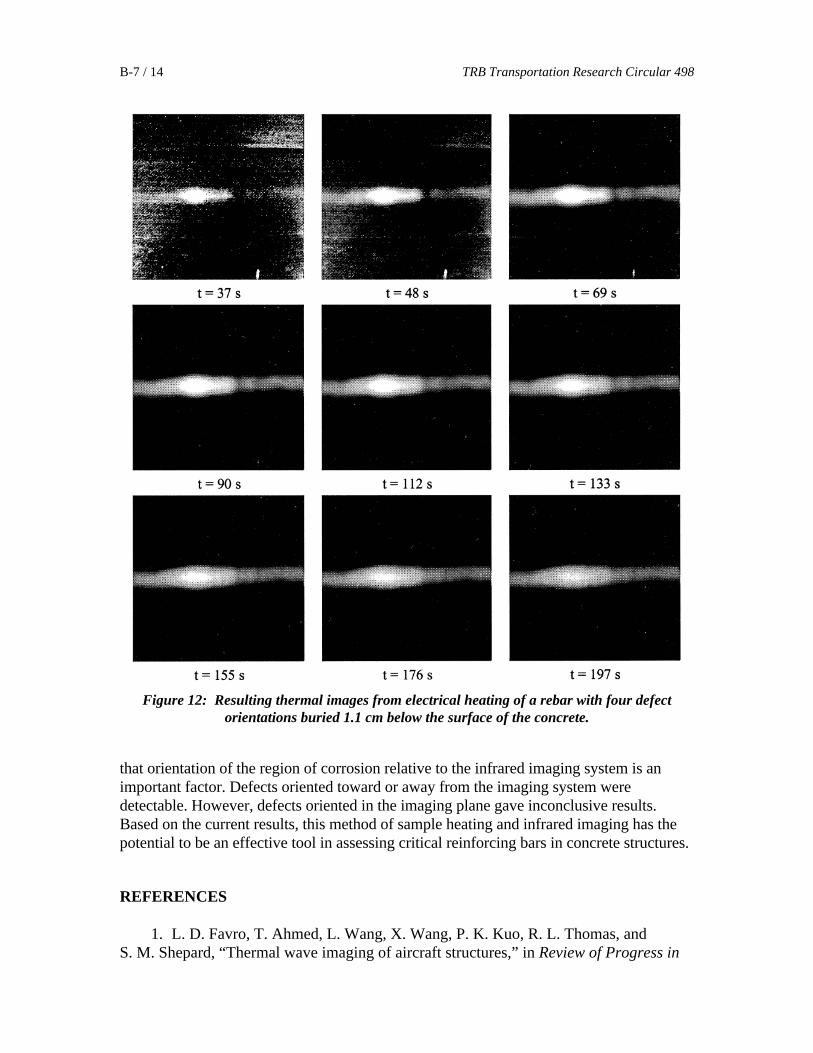
A rebar with defects oriented in four different directions was prepared, as shown inFigure 2. The rebar was heated with 2460 W of electrical power applied for 30 s. Theresulting thermal images are displayed in Figure 12. Defects B and C are visible in theinfrared images as hot (light) and cool (dark) regions, respectively. However, defects Aand D do not appear to be visible in these images. In these cases where the defect
LOCATION (cm)0 5 10 15 20 25 30
TE
MP
ER
AT
UR
E (
C)
20
30
40
50
60
70
LOCATION (cm)0 5 10 15 20 25 30
TE
MP
ER
AT
UR
E (
C)
20
30
40
50
60
70
t = 8 s t = 16 s
LOCATION (cm)0 5 10 15 20 25 30
TE
MP
ER
AT
UR
E (
C)
20
30
40
50
60
70
LOCATION (cm)0 5 10 15 20 25 30
TE
MP
ER
AT
UR
E (
C)
20
30
40
50
60
70
t = 32 s t = 48 s
°
° °
°
Figure 6: Surface temperature profiles observed by the IR-FPA during and after electricalheating of the exposed rebar. Heating occurred during the interval 0–30 s.
Poulain, Alexander, and Krause B-7 / 9
orientation is in the imaging plane, we believe thermal diffusion from the heated portionof the defect is being negated by the relative cool of the corrosion products in the defect.This results in what appears to be a “normal” image.
CONCLUSIONS
Infrared images of rebars, with simulated corrosion defects, embedded in concrete havebeen obtained using an electrical heating method and infrared focal plane array camera.Simulated areas of corrosion have been imaged through 2 cm of concrete. A defect with a10% reduction in cross-sectional area has been detected by this method. Results suggest
Figure 7: The resulting infrared images from electrically heating a rebar, with defectsoriented away from the IR-FPA. Defect A is on the left.
B-7 / 10 TRB Transportation Research Circular 498
Figure 8: Resulting thermal images from electrical heating of a rebar with three defect depths,defect A to the left. The defect notches are oriented away from the camera 1.8 cm deep
inside the test block of concrete.
LOCATION (cm)
0 5 10 15 20 25 30
TE
MP
ER
AT
UR
E (
C)
23.6
23.8
24.0
24.2
24.4
24.6
24.8
°
Poulain, Alexander, and Krause B-7 / 11
Figure 9: Surface temperature profile of the concrete above the rebar with simulated defectsoriented away from the IR-FPA, approximately 90 s after the beginning of heating.
B-7 / 12 TRB Transportation Research Circular 498
Figure 10: Resulting thermal images from electrical heating of a rebar with three defectdepths with the defect notches oriented toward the camera buried 2.2 cm below the
observed surface of the concrete. Defect A is on the left.
Poulain, Alexander, and Krause B-7 / 13
LOCATION (cm)
0 5 10 15 20 25 30
TE
MP
ER
AT
UR
E (
C)
25
26
27
28
°
Figure 11: Surface temperature profile of the concrete above the rebar with simulated defectsoriented toward the IR-FPA, approximately 90 s after the beginning of heating.
B-7 / 14 TRB Transportation Research Circular 498
Figure 12: Resulting thermal images from electrical heating of a rebar with four defectorientations buried 1.1 cm below the surface of the concrete.
that orientation of the region of corrosion relative to the infrared imaging system is animportant factor. Defects oriented toward or away from the imaging system weredetectable. However, defects oriented in the imaging plane gave inconclusive results.Based on the current results, this method of sample heating and infrared imaging has thepotential to be an effective tool in assessing critical reinforcing bars in concrete structures.
REFERENCES
1. L. D. Favro, T. Ahmed, L. Wang, X. Wang, P. K. Kuo, R. L. Thomas, and S. M. Shepard, “Thermal wave imaging of aircraft structures,” in Review of Progress in
Poulain, Alexander, and Krause B-7 / 15
Quantitative NDE, Vol. 14, D. O. Thompson and D. Chimenti, eds., Plenum, New York,1995, 461–466.
2. L. D. Favro, P. K. Kuo, and R. L. Thomas, “Thermal-Wave Imaging ofComposites and Polymers,” Proc. SPIE Thermosense XVI, Orlando, FL, April 12–16,1993, Vol. 2245, pp. 90–94 (1994).
3. T. M. Yonushonis, R. J. Stafford, T. Ahmed, L. D. Favro, P. K. Kuo, and R. L. Thomas, “Infrared thermal wave imaging of thermal barrier coatings for dieselapplications,” Am. Ceram. Soc. Bull., 71(8), 1191–1202 (1992).
4. CRC Handbook on Nondestructive Testing of Concrete, V. M. Malhotra and N. J. Carino, eds., CRC Press Inc., Boca Raton, FL, 1991.
5. P. F. Durbin, N. K. Del Grande, and P. C. Schaich, “Demonstration of Dual-BandInfrared Thermal Imaging for Bridge Inspection,” Lawrence Livermore NationalLaboratory, Livermore, CA, 1998.
6. S. A. Schaub, D. E. Poulain, and D. R. Alexander, “Feasibility of detection andlocation of buried metallic and non-metallic objects using laser-based thermal wave echoimaging,” U. S. Army CECOM SBIR Phase I Final Report, Contract DAAB07-97-G001,Mission Research Corp., Santa Barbara, CA, 1997.
7. P. Li, A. Maad, F. Moshary, M.F. Arend, and S. Ahmed, “Infrared imaging ofburied objects by thermal step-function excitations,” Appl. Opt., 34(25), 5809–5816(1995).
8. CRC Handbook of Chemistry and Physics, 75th Ed., D. R. Lide, ed., CRC Press,Boca Raton, FL, 1997.
9. ThermaCam PM300/PM200/PM100 Operating Instructions, Inframetrics, North Billerica, MA, 1996.