Evaluation of Simple Methods forEstimating Drift of Reinforced ConcreteBuildings Subjected to Earthquakes
Adolfo Matamoros,a) M.EERI, JoAnn Browning,a) M.EERI, and Maren Lufta)
A simplified procedure to estimate drift based on the area of load-resisting elements is presented and its results are compared with those of theequivalent-period method and the target-displacement method as defined inFEMA-273 (1997). All three methods are used to estimate the upper-bounddrift based on simple parameters that represent the lateral stiffness and massof a structure. The accuracy of the methods was evaluated using experimentalresults from 152 earthquake simulator tests found in the literature. Coeffi-cients of variation for the measured-to-calculated drift ratios ranged between0.6 and 0.75, indicating that the accuracy of the drift estimates afforded bythe three methods was similar for the set of test results evaluated. Additionalcomparisons are presented for the proposed method based on 720 nonlinearanalyses of notional frames and the measured response of an instrumentedbuilding. [DOI: 10.1193/1.1623781]
INTRODUCTION
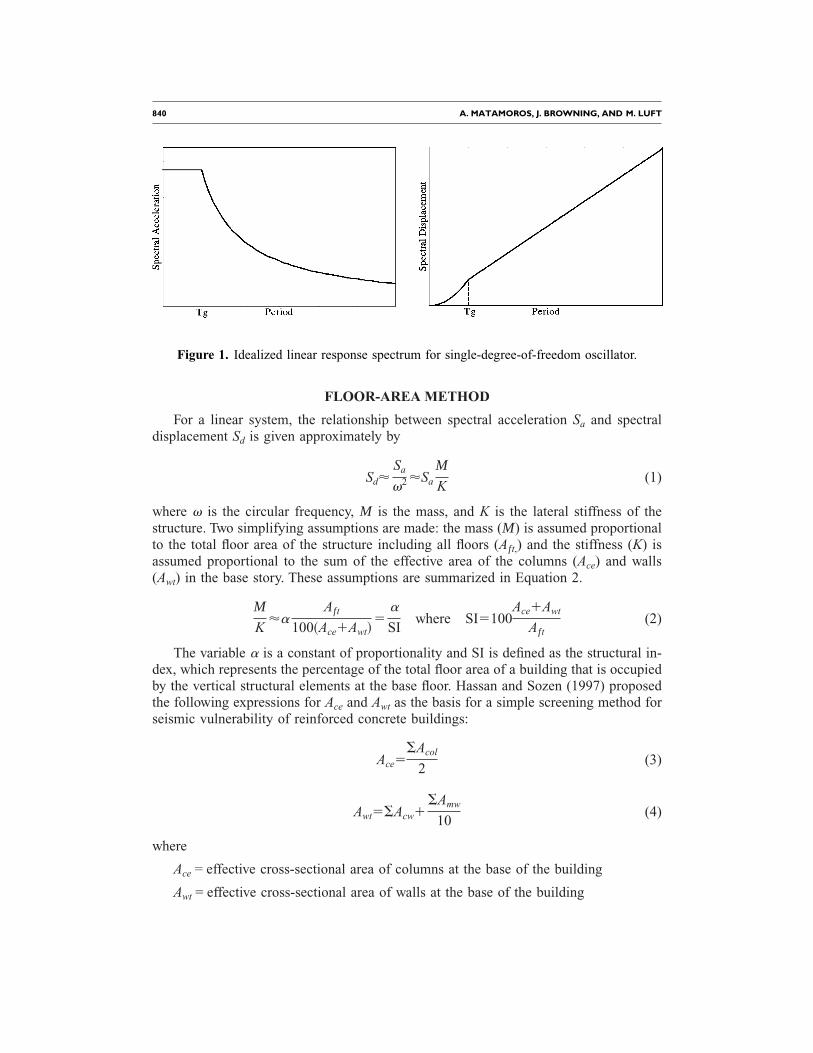
Previous studies have shown that for systems with a fundamental period greater thanthe characteristic period of the ground motion (designated Tg in Figure 1), the maximumnonlinear displacement is insensitive to base shear strength (Shimazaki and Sozen1984), and a reasonable upper bound for the maximum nonlinear displacement is givenby the maximum displacement of an equivalent linear system. For periods smaller thanTg , Shimazaki indicated that base shear strength had a significant effect on the maxi-mum nonlinear displacement. An expression for the minimum base shear strength nec-essary to limit the nonlinear response was proposed later by Lepage (1997).
For low and medium-rise structures that are regular in plan and elevation (withoutabrupt changes in stiffness or mass) a simple relationship between the maximum driftresponse and the period of the linear system can be established using an idealized dis-placement response spectrum (Figure 1). It follows from the observations by Shimazakiand Sozen (1984) and Lepage (1997) that a reasonable upper bound for the maximumnonlinear displacement can be calculated based on the flexibility and mass of the struc-ture. The methods analyzed in this article provide an estimate for the upper-bound driftbased on the lateral stiffness and mass of a structure, and a simplified displacementspectrum proposed by Shimazaki and Sozen (1984).
a) Department of Civil Engineering, University of Kansas, 2006 Learned Hall, Lawrence, KS 66045
For a linear system, the relationship between spectral acceleration Sa and spectraldisplacement Sd is given approximately by
Sd'Sa
v2 'Sa
M
K(1)
where v is the circular frequency, M is the mass, and K is the lateral stiffness of thestructure. Two simplifying assumptions are made: the mass (M) is assumed proportionalto the total floor area of the structure including all floors (Aft,) and the stiffness (K) isassumed proportional to the sum of the effective area of the columns (Ace) and walls(Awt) in the base story. These assumptions are summarized in Equation 2.
M
K'a
Aft
100~Ace1Awt!5
a
SIwhere SI5100
Ace1Awt
Aft(2)
The variable a is a constant of proportionality and SI is defined as the structural in-dex, which represents the percentage of the total floor area of a building that is occupiedby the vertical structural elements at the base floor. Hassan and Sozen (1997) proposedthe following expressions for Ace and Awt as the basis for a simple screening method forseismic vulnerability of reinforced concrete buildings:
Ace5SAcol
2(3)
Awt5SAcw1SAmw
10(4)
where
Ace = effective cross-sectional area of columns at the base of the building
Awt = effective cross-sectional area of walls at the base of the building
Figure 1. Idealized linear response spectrum for single-degree-of-freedom oscillator.
SIMPLIFIED METHODS FOR ESTIMATING DRIFT OF R/C BUILDINGS SUBJECTED TO EARTHQUAKES 841
Acw = total area of reinforced concrete walls at base of building
Amw = total area of masonry filler walls at base of building, assuming the walls arecontinuous above the base
Acol = total cross-sectional area of columns at the base
Combining Equation 1 and Equation 2, it follows that
Sd5Sa
a
SI(5)
Equation 5 shows the relationship between the structural index SI, the spectral accelera-tion Sa , and the spectral displacement Sd . Shimazaki and Sozen (1984) proposed thefollowing expression to define the idealized linear acceleration response spectrum of asingle-degree-of-freedom oscillator
Sa5PGA•g•Aa for T,Tg (6)
Sa5PGA•g•Aa
Tg
Tfor T.Tg (7)
where Tg is the characteristic period of the ground motion, PGA is the peak ground ac-celeration normalized to the acceleration of gravity g, and Aa is the amplification factorfor the ground motion. A set of expressions for the spectral displacement is obtained bysubstituting into Equation 5 the spectral acceleration equations for the linear responsespectrum proposed by Shimazaki and Sozen (1984) given in Equations 6 and 7:
Sd5PGA•g•Aa
a
SIfor T,Tg (8)
Sd5PGA•g•Aa
a
SI
Tg
Tfor T.Tg (9)
Equation 8 provides an estimate of the spectral displacement of low-rise structures interms of the structural index SI and the peak ground acceleration. An estimate of thedisplacement at the roof can be obtained by multiplying the spectral displacement by theappropriate modal participation factor for the fundamental mode. An appropriate valuefor the parameter a was determined by calibrating the method to provide a conservativeestimate of the roof drift of reinforced concrete frames tested using earthquake simula-tors. Because the majority of the specimens were reduced-scale models of buildings, theproperties of the specimens had to be adjusted to account for the scale factors as de-scribed in the following section.
842 A. MATAMOROS, J. BROWNING, AND M. LUFT
CALCULATION OF STRUCTURAL INDEX FOR SMALL-SCALE SPECIMENS
The equivalent floor area (Afe) for the reduced-scale specimens was calculated basedon the story weight and the adjusted weight per unit area for each model. The ratio ofstory weight of the model to weight of the building can be written in terms of the periodand the lateral stiffness as
Wm
W5
Mm
M5STm
T D2 Km
K(10)
where
T = period of building
Tm = period of model
K = building stiffness
Km = model stiffness
The stiffness terms in Equation 10 are proportional to the modulus of elasticity mul-tiplied by units of length. Equation 10 can be rewritten in terms of the scale factors fortime, length, and modulus of elasticity as
Wm
W5SF T
2SFESFL (11)
where
SFL = Lm /L5scale factor for length, <1 for reduced-scale specimens
SFT = Tm /T5scale factor for time, <1 for time-compressed earthquake records
SFE = Em /E5scale factor for the modulus of elasticity, typically 1
The ratio of unit story weights was obtained by dividing Equation 11 by the ratio ofthe story area of the model to the story area of the full scale structure, which is propor-tional to SFL
2 , and setting SFE51:
gm5g•SFT
2
SFL(12)
where
g = story weight per unit area of full-scale structure (approximately equal to0.009 N/mm2).
The equivalent floor area for the models was obtained by dividing story weights bythe adjusted unit weight as indicated by Equation 13:
Afe5SWm
gm5
SWm•SFL
g•SFT2 (13)
where
SIMPLIFIED METHODS FOR ESTIMATING DRIFT OF R/C BUILDINGS SUBJECTED TO EARTHQUAKES 843
Afe = equivalent floor area of model
SWm = story weight of model
RESPONSE OF LOW-RISE BUILDINGS
The measured roof drift from 52 dynamic tests of reduced-scale, low-rise specimensis plotted against the ratio PGA/SI in Figure 2, where SI was calculated based on theequivalent floor area obtained with Equation 13. In order to obtain an upper-bound es-timate of drift using Equation 8, a value of a52•1023 s2 is proposed on the basis that asafe estimate of roof drift was obtained for approximately the mean plus one standarddeviation of the total test results of low-rise specimens. A general expression for themaximum roof displacement of low-rise buildings in terms of the properties of the struc-ture and the ground motion is developed using the following parameters with Equation8: an amplification factor Aa of 3.75 (Shibata and Sozen 1976), the proposed value of aequal to 2•1023 sec2, and a modal factor of 1.3
Sroof52.6•1023Sa
SI5
PGA•g
SI•100for T,Tg (14)
The constant 1/100 in Equation 14 has units of s2, while the parameters SI and PGA aredimensionless quantities. The units for the roof displacement are consistent with theunits chosen for the acceleration of gravity g. As indicated, the value of a used to deriveEquation 14 is consistent with an amplification factor Aa of 3.75, which Shibata and
Figure 2. Roof displacement for low-rise specimens.
844 A. MATAMOROS, J. BROWNING, AND M. LUFT
Sozen (1976) proposed for a design spectrum with a damping ratio of 2%. A similarestimate of roof drift may be obtained using the spectral acceleration of a 5% dampedspectrum by adjusting the value of the constant a to reflect the effect of the higherdamping. Based on the amplification factors recommended by Newmark et al. (1973) fordesign spectra with 2 and 5% damping, the value of a that should be used with a 5%damped spectrum is 3•1023 sec2.
A comparison between Equation 14 and the results from 52 dynamic tests of low-risespecimens is shown in Figure 2. The solid line in Figure 2 corresponds to the estimatedroof drift using Equation 14. Figure 2 shows that Equation 14 provided a reasonable up-per bound to the measured values, and the results tended to be more conservative as thepeak ground acceleration increased. The statistical analysis did not include specimenswith peak ground acceleration above gravity because they were not deemed representa-tive of practical design cases. A relationship to estimate the mean drift ratio can be es-tablished by recognizing that
MDR5Sroof
Nstories H5
2.6•1023
Nstories H
Sa
SI5
PGA•g
100 SI Nstories H(15)
where Nstories is the number of stories and H is the average story height. If the spectralacceleration of a 5% damped spectrum is used instead, the constant 2.6•1023 would bereplaced by a value of 3.5•1023 in Equation 15.
Tables 1 and 2 summarize measured and calculated MDR values for earthquakesimulator tests found in the literature. Table 2 shows that there was a relatively high de-gree of scatter associated with the floor-area approach, and that the average calculated tomeasured MDR in specimens having between 1 and 3 stories was quite conservative(3.7).
The same comparison between MDR calculated using Equation 15 and experimentalresults is shown in Figure 3 for the tests with low-rise specimens. The estimated MDRbecame more conservative as the lateral stiffness of the specimens decreased (SI de-creased). For the group of specimens with the largest lateral stiffness, the method tendedto underestimate the measured drift. This trend is consistent with previous studies thathave shown that estimates of nonlinear drift of short-period structures based on elasticanalyses tend to underestimate the observed nonlinear response (Lepage 1997).
The effect of the flexibility of the girders on the accuracy of Equation 15 is an im-portant consideration because the stiffness properties of the girders have no effect on thestructural index SI. Figure 4 shows that the majority of the low-rise specimens found inthe literature had span-length to girder-depth (L/h) ratios of approximately 12. Figure 4also shows that the accuracy of Equation 15 was not very sensitive to the girder span todepth ratio for the group of specimens considered.
CORRECTION FOR RESPONSE OF MEDIUM-RISE BUILDINGS
The response of medium-rise buildings, defined in this paper as those with 4 to 10stories, is affected by the reduction in the acceleration response that occurs in structureswith periods larger than the characteristic period of the ground motion (Figure 1). This
SIMPLIFIED METHODS FOR ESTIMATING DRIFT OF R/C BUILDINGS SUBJECTED TO EARTHQUAKES 845
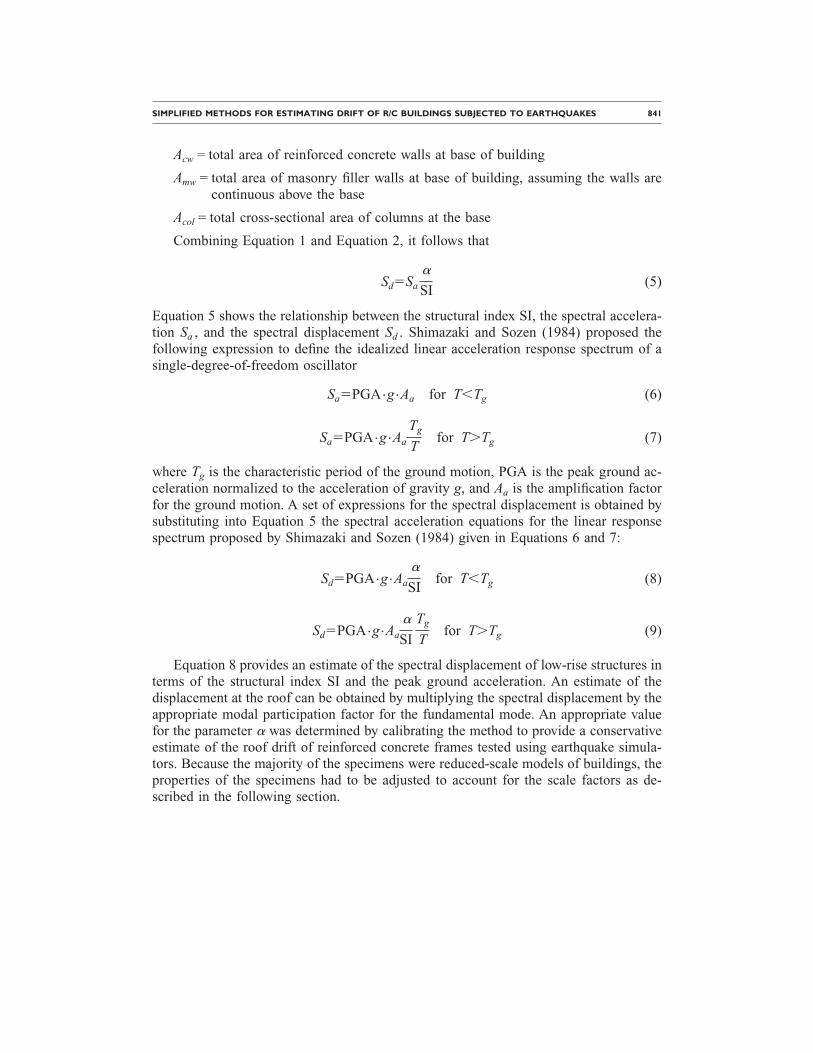
Table 1. Measured and calculated drifts for reduced-scale models
Type A 1 0.14 1.14 0.82 144 223 1.55 0.22 0.040 0.080 2.03
Type A 0.14 1.14 0.74 165 204 1.24 0.22 0.035 0.088 2.54
Type B 1 0.14 1.14 0.64 109 176 1.61 0.22 0.026 0.069 2.65
848 A. MATAMOROS, J. BROWNING, AND M. LUFT
reduction is recognized in Equation 7 and Equation 9 by the factor Tg /T. Given the ac-curacy of the proposed method it is deemed reasonable to assume that the period of astructure is proportional to the number of stories, so that the ratio of the characteristicperiod Tg to the period of the structure T also can be expressed in terms of the numberof stories. A simple expression is adopted to relate the characteristic period to a limitnumber of stories above which the displacement calculated with Equation 15 must bereduced:
Ng limit'Tg
0.1(16)
Based on Equation 16 the reduction factor for the calculated displacement is
Tg
T'
Ng limit
Nstoriesif Nstories.Ng limit (17)
Lepage (1997) suggested a characteristic period of 0.6 s for ground motions on firmsoil conditions, which is approximately the effective period of a 6-story structure ac-cording to Equation 16. In general, the following correction is adopted for calculatingthe mean drift ratio of mid-rise structures using Equation 15 and the dimensionless cor-rection factor given by Equation 17:
MDR'PGAg
100•SI
1
Nstories H
Ng limit
Nstoriesif Nstories.Ng limit (18)
Figure 5 shows the ratio of calculated to measured MDR based on Equation 18 for70 earthquake simulator tests of mid-rise structures with peak ground acceleration belowgravity. Test results were divided into groups of specimens with and without structuralwalls. The group of specimens without walls had the best correlation, with an averagecalculated to measured mean drift ratio of 2.8 and a coefficient of variation of 0.3. As
Table 1. (cont.). Measured and calculated drifts for reduced-scale models
SIMPLIFIED METHODS FOR ESTIMATING DRIFT OF R/C BUILDINGS SUBJECTED TO EARTHQUAKES 849
expected, the accuracy of Equation 18 was affected by the height-to-length ratio (Hw /lw)of the structural walls, which ranged between 5 and 19. In specimens with walls that hadlow height-to-length ratios the stiffness of the walls was underestimated by Equation 18and the calculated values of roof drift tended to be more conservative. Based on a mini-mum squares power fit a correction factor was applied to account for this effect:
CFwall5S Hw
15lwD2
,Hw
lw>5 (19)
With the correction factor included, the average measured to calculated mean driftratio of mid-rise specimens with structural walls was 1.3 with a coefficient of variation
Table 2. Average and standard deviation for MDR, peak ground acceleration
Structure No. of stories
Floor-Area Method:Ratio of Calculatedto Measured MDR
of 0.75, which is similar to the value obtained for frame structures between 1 and 3 sto-ries. Although the correlation improved considerably with the correction factor in Equa-tion 19, the statistical results indicate that the method performed best for mid-rise framestructures, and the variation was larger for low-rise specimens and specimens with struc-tural walls.
A second comparison was carried out using notional frames to investigate whetherthe results obtained with reduced scale specimens could be projected to full-scale struc-tures. The notional frames used in the study (Figure 6) ranged between 5 and 11 storiesin height, had span lengths of 6.1 and 9.1 m (20 and 30 ft.) and girder depths of L/10and L/12.
The parameters of the notional frame study are summarized in Table 3. A total of 720frames were subjected to a suite of 10 different ground motions (Table 4) that werescaled so that they would be representative of a linear displacement spectrum. The non-linear analysis was carried out with the program LARZ (Saiidi and Sozen 1979), anddetails for the modeling of the frames are presented elsewhere (Browning 1998).
The analysis was carried out for two groups of 360 frames each. The first group,designated moderate seismicity group, was proportioned to resist gravity loads and sub-jected to the suite of records presented in Table 4, scaled to represent a linear displace-ment spectrum of approximately 125·T (in mm). The peak ground accelerations of thescaled records ranged between 12% and 39% of gravity. The second group, designatedhigh seismicity group, was proportioned for a performance objective consisting of alimit mean drift ratio of 1.5% and a linear displacement spectrum of 250·T (in mm).
Figure 3. Calculated to measured MDR ratio vs. structural index for low-rise specimens.
SIMPLIFIED METHODS FOR ESTIMATING DRIFT OF R/C BUILDINGS SUBJECTED TO EARTHQUAKES 851
This group of frames was subjected to the suite of records presented in Table 4 scaled torepresent a linear displacement spectrum of approximately 250·T (in mm). The peakground accelerations of the scaled records ranged between 24% and 78% of gravity asshown in Table 4.
The structural index ranged between 0.04 for the most flexible frame and 0.21 for theleast flexible frame. The fundamental period of the frames ranged between 0.50 and 0.61s for 5-story frames, 0.72 and 0.84 s for 7-story frames, 0.92 and 1.11 s for 9-storyframes, and 1.12 and 1.35 s for 11-story frames (Browning 1998). Figure 7 shows theresults sorted according to the intensity of shaking. For the moderate seismicity groupthe average ratio of approximated MDR (using the floor-area method) to calculated non-linear MDR was 3.6 and the coefficient of variation was 0.5, compared with a values of2.0 and 0.6 for experimental results of medium-rise specimens (Table 2). For the highseismicity group the average ratio of estimated to nonlinear MDR was 2.1 with a coef-ficient of variation of 0.6. The statistical analysis shows that while the coefficient ofvariation was comparable, estimates were more conservative for the moderate seismicitygroup, which was subjected to the suite of ground motion records scaled to have lowerpeak ground accelerations.
The best possible approach to evaluate the accuracy of the approximate methods dis-cussed in this paper is to compare estimated and measured displacements from instru-mented full-scale structures obtained during earthquakes. Although it was not possible toconduct a statistically meaningful analysis given the amount of information available, a
Figure 4. Calculated to measured MDR ratio vs. beam span to depth ratio (L/h) for low-risespecimens.
852 A. MATAMOROS, J. BROWNING, AND M. LUFT
complete set of records from the Northridge earthquake (CSMIP 1994) for a 7-storystructure in Van Nuys (Browning et al. 2000) was used to provide some background withfull-scale structures. Estimated and measured relative displacements are summarized inTable 5. In this case the ratios of calculated to measured drift obtained with the floor-area method were lower than the averages from the notional frame analysis.
EQUIVALENT-PERIOD METHOD
The structural index is not sensitive to a number of parameters that affect the flex-ibility of structures such as span length, girder depth, or compressive strength of theconcrete. A more rational estimate of drift not subject to these limitations can be ob-tained using the equivalent-period method. This method requires the calculation of the
Figure 5. Calculated to measured MDR ratio vs. structural index for medium-rise specimens.
Figure 6. Plan view of notional frame with span length L.
SIMPLIFIED METHODS FOR ESTIMATING DRIFT OF R/C BUILDINGS SUBJECTED TO EARTHQUAKES 853
initial period of the structure based on gross-section properties. The method has its rootsin the substitute-structure method (Shibata and Sozen 1976) as used by Shimazaki andSozen (1984) and later modified by Lepage (1997).
The equivalent period of a given structure is determined based on its initial periodand an amplification factor appropriate for the damping ratio used in the calculation ofthe linear response spectrum. Earthquake demand is represented as a linearly increasing
Table 4. Earthquake records used for nonlinear analysis of notional frames
Event Station Component Source PGA, g
Scaled PGA, g
HighSeismicity
ModerateSeismicity
San Fernando9-Feb-71
CastaicOld Ridge Route,
California
N21E CalTech 1973b 0.32 0.78 0.39
Northridge17-Jan-94
TarzanaCedar Hill Nursery,
California
NS CSMIP 1994 0.31 0.62 0.31
Chile3-Mar-85
LlolleoDEC, Chile
N10E Saragoni et al. 1985 0.28 0.55 0.28
ImperialValley
18-May-40
El CentroIrrigation District,
California
NS CalTech 1971 0.25 0.50 0.25
Hyogo-Ken-Nanbu
17-Jan-95
KobeKMMO, Japan
NS JMA 1995 0.20 0.39 0.20
Kern County21-Jul-52
TaftLincoln School
Tunnel, California
N21E CalTech 1971 0.19 0.38 0.19
WesternWashington13-Apr-49
SeattleArmy Base,Washington
S02W CalTech 1973a 0.15 0.31 0.15
Miyagi-Ken-Oki
12-Jun-78
SendaiTohoku University,
Japan
NS Mori and Crouse 1981 0.14 0.29 0.14
Kern County21-Jul-52
Santa BarbaraCourthouse,California
S48E CalTech 1971 0.13 0.27 0.13
Tokachi-Oki16-May-68
HachinoheHarbor, Japan
EW Mori and Crouse 1981 0.12 0.24 0.12
Table 3. Variables for study with notional frames
Number ofStories
Story Height,m
Bay Length,m Girder Depths
5 3.0 6.1 L/127 3.7 9.1 L/109 3.0 with tall first story
11
854 A. MATAMOROS, J. BROWNING, AND M. LUFT
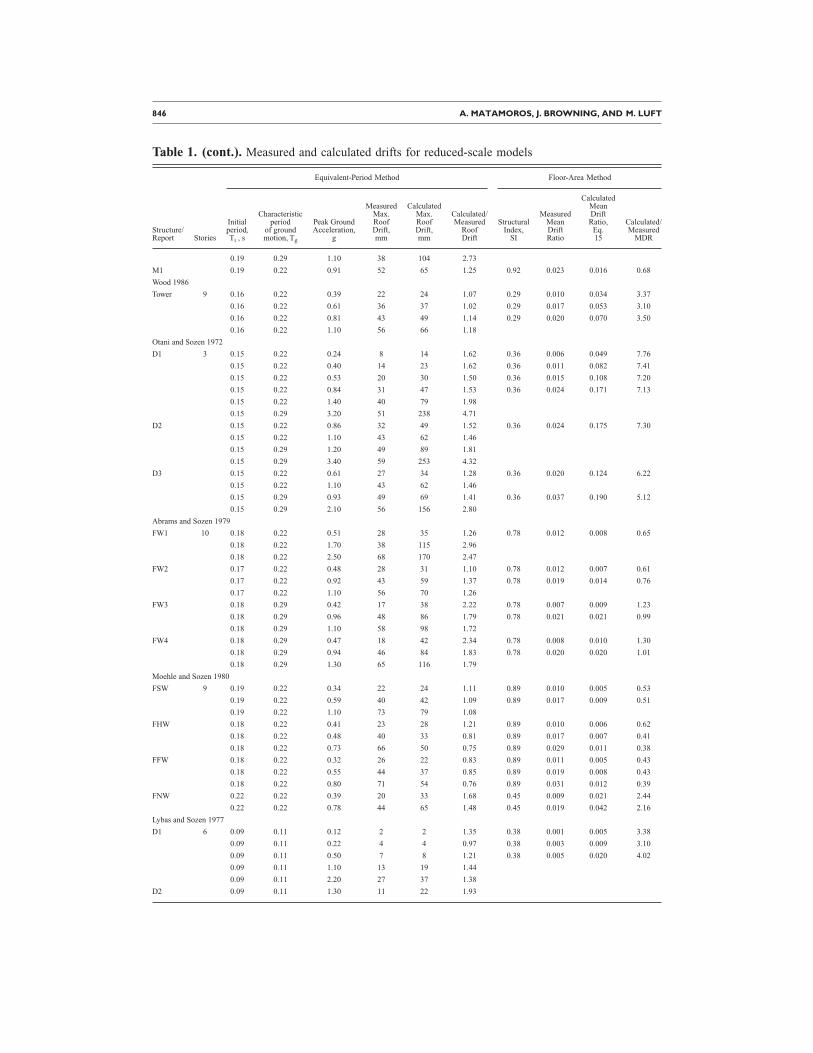
relationship between drift demand and the period of the structure. A simple way to de-rive the displacement demand curve is to modify the displacement response spectrumfor a given site (using 2% of critical damping) as shown in Figure 8.
According to Shimazaki and Lepage, a reasonable upper-bound estimate of drift forreinforced concrete buildings is given by the ordinate of the simplified displacement re-sponse spectrum corresponding to a period equal to the initial period (Ti , calculated us-ing gross section properties) of the structure multiplied by a correction factor of &. Areasonable value for the expected maximum drift (D) for the structure is calculated us-ing the simple relationship
D5&•Ti•kd•MPF (20)
Figure 7. Calculated to measured MDR ratio (using the floor-area method) vs. PGA for no-tional medium-rise frames.
Table 5. Measured and calculated drifts for instrumented buildings
SIMPLIFIED METHODS FOR ESTIMATING DRIFT OF R/C BUILDINGS SUBJECTED TO EARTHQUAKES 855
where kd is a constant that defines the slope of the demand curve (Figure 8) and MPF isthe modal participation factor for the first mode. The slope of this curve is variable de-pending on the earthquake demands at the site. A reasonable approximation of this slopecan be obtained using the formula (Lepage 1997):
kd5Aa•Tg•PGA•g
~2p!2 (21)
A value of 3.75 was adopted for Aa (Shibata and Sozen 1976) as in the case of the floor-area method. The characteristic period listed for each input ground motion (Table 1) wasdetermined by comparing the relative shapes of energy response spectra and accelerationresponse spectra calculated using the proposed ground motion at 2% and 10% of criticaldamping (Lepage 1997).
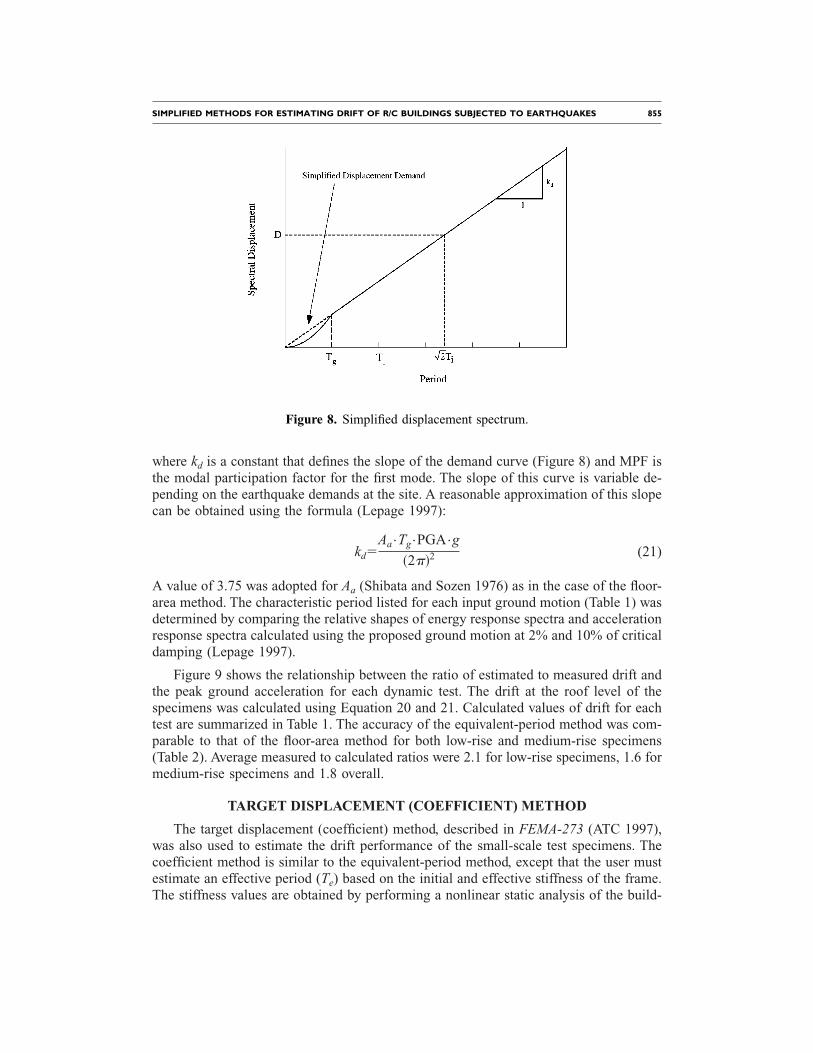
Figure 9 shows the relationship between the ratio of estimated to measured drift andthe peak ground acceleration for each dynamic test. The drift at the roof level of thespecimens was calculated using Equation 20 and 21. Calculated values of drift for eachtest are summarized in Table 1. The accuracy of the equivalent-period method was com-parable to that of the floor-area method for both low-rise and medium-rise specimens(Table 2). Average measured to calculated ratios were 2.1 for low-rise specimens, 1.6 formedium-rise specimens and 1.8 overall.
TARGET DISPLACEMENT (COEFFICIENT) METHOD
The target displacement (coefficient) method, described in FEMA-273 (ATC 1997),was also used to estimate the drift performance of the small-scale test specimens. Thecoefficient method is similar to the equivalent-period method, except that the user mustestimate an effective period (Te) based on the initial and effective stiffness of the frame.The stiffness values are obtained by performing a nonlinear static analysis of the build-
Figure 8. Simplified displacement spectrum.
856 A. MATAMOROS, J. BROWNING, AND M. LUFT
ing. Also, there are various coefficients that must be determined based on the number ofstories (C0), effective period (C1), hysteretic response (C2), whether there is negativepost-yield stiffness for the structural response (C3), and the demand spectrum (Sa with5% damping). The equation to estimate drift using the coefficient method is given as
dt5C0C1C2C3Sa
Te
4p2 g @FEMA-273, Equation 3-11# (22)
The primary difference between the coefficient method and the two methods pre-sented previously is that it requires detailed data about the amount and location of rein-forcement within the structure, which was not available for all of the reduced-scalespecimens. Engineers often face this problem when conducting vulnerability assess-ments of existing structures. Obtaining information about the detailing of all membersmay be particularly difficult and expensive when a large set of structures must be ana-lyzed. Screening structures according to stiffness allows engineers to select a smallergroup of structures that are unlikely to achieve the desired performance objective andmerit deeper scrutiny.
To provide a consistent comparison between the three methods, a procedure was de-veloped to use the coefficient method with fewer calculations and assumptions. A 5%-damped spectrum was adopted instead of the 2% spectrum used in the equivalent-period
Figure 9. Ratio of calculated to measured (using the equivalent-period method) roof drift vs.PGA for all earthquake simulator tests.
SIMPLIFIED METHODS FOR ESTIMATING DRIFT OF R/C BUILDINGS SUBJECTED TO EARTHQUAKES 857
method, and the effective period of the structure was estimated by assuming a relation-ship between the initial and effective periods. By selecting a value of effective stiffness(Ke) equal to 50% of the initial stiffness (Ki , calculated on the basis of gross sectionproperties), the effective period of each frame (Te) was approximately & times the ini-tial period of the structure (Ti):
Te5TiAKi
Ke@FEMA-273, Equation 3-10# (23)
The coefficient C0 was selected from Table 3-2 in FEMA-273 based on the numberof stories in the structure. The coefficient C1 is intended to adjust the calculated dis-placement for short-period structures, in which the displacement response may exceedthe estimate based on an elastic spectrum. In the equivalent-period method this compli-cation is circumvented by using a linear displacement demand spectrum. For the coef-ficient method the displacement estimate is magnified by the coefficient C1 , which iscalculated based on the strength ratio, R, which is given by
R5Sa
Vy /W•
1
C0@FEMA-273, Equation 3-12# (24)
The nonlinear yield strength (Vy) is determined using nonlinear static analysis of themodeled structure. As mentioned previously, information about the detailing and prop-erties of the reinforcement was not available for all the specimens that were analyzedusing the other two methods. Consequently, a strength ratio (Vy /W) of 0.15 was adoptedfor those structures with effective periods within the short period region. The remainingcoefficients were set equal to 1.0. This assumption is deemed reasonable for the reduced-scaled specimens, which are reasonably well-detailed structures and did not experiencesignificant second-order effects.
The spectral acceleration value for each test was determined using a spectrum simi-lar to that used for the equivalent-period method. The primary difference being that a5%-damped spectrum was selected for the coefficient method in comparison to the 2%-damped spectrum used for the equivalent-period method. Using the peak ground accel-eration (PGA) and corner period (Tg) for the ground motion of each test, the spectralacceleration was calculated as
Sa5H 2.5•PGA Te<Tg
2.5•PGA•Tg
TeTe.Tg
(25)
The drift estimates obtained using the coefficient method are shown in Table 2. Ofthe three methods, the average estimated displacement was closest in value to the mea-sured displacement. The average ratio of calculated to measured mean-drift ratios for thecoefficient method was 1.2, for the equivalent-period method was 1.8, and for the floor-area method was 2.6. However, when considering the standard deviations for eachmethod (0.7, 1.1, and 2.0, respectively), the range of estimated drifts was less conserva-
858 A. MATAMOROS, J. BROWNING, AND M. LUFT
tive for the coefficient method. The coefficients of variation (ranging between 0.6 and0.75) were comparable for all three methods, with the floor-area method providing theleast accuracy of the three.
CONCLUSIONS
Expressions to estimate mean drift ratio (MDR) in terms of nondimensional param-eters (structural index SI and peak ground acceleration PGA) were proposed for low-rise(Equations 15) and medium-rise reinforced concrete buildings (Equation 18). The maxi-mum mean drift ratio estimated with the proposed floor-area method provided a reason-able upper bound to the nonlinear displacement of reduced-scale models based on verysimple parameters to describe the intensity of the ground motion and the properties ofthe building.
The accuracy of the proposed methodology (floor-area method), the equivalent-period method, and the target-displacement (coefficient) method was evaluated usingmeasurements from reduced-scale models tested in earthquake simulators. The accuracyof the proposed method, as indicated by the coefficient of variation of drift estimates ofreduced-scale models, was comparable with that of the equivalent-period method andthe coefficient method as implemented in the paper. The safety index, defined as the per-centage of the standard deviation that results from subtracting 1 from the mean ratio ofmeasured to calculated drift, was 0.8 for the floor-area method, 0.7 for the target-periodmethod, and 0.2 for the coefficient method. According to the calculated values for thesafety index, the floor-area method, which was the most conservative of the three interms of the average ratio of calculated to measured drift, resulted in the safest estimateof displacement, although its safety index was comparable to that of the equivalent-period method. This is to be expected because both methods were derived with the goalof providing an upper-bound estimate of drift. The coefficient method, implemented withthe simplifying assumptions used in this paper, resulted in an estimate of drift that ismuch closer to the measured values, although the safety index was considerably lower.
Additional comparisons were carried out using notional frames and displacementsfrom an instrumented 7-story building recorded during the Northridge earthquake. Theaverage ratio of estimated to calculated displacement using the floor-area method for thenotional frames was 2.7. This was similar to the overall value for reduced-scale models,which indicates that the methodology used to account for the scale effects resulted inadequate estimates of equivalent floor area. The drift estimates of notional frames had acoefficient of variation of 0.6, which was lower than the value observed in reduced scalemodels. Consequently, the safety index was higher with a value of 1.1. The average ratioof calculated to estimated drift was 3.6 for the moderate seismicity frames and 2.1 forthe high seismicity frames, with coefficients of variation of 0.5 and 0.6 respectively.These results indicate that the floor-area method was more conservative for frames thatwere relatively more flexible and subjected to ground motions with lower peak groundaccelerations. In the case of the 7-story instrumented structure the drift estimates wereless conservative than the average for reduced-scaled models and notional frames.
The coefficients of variation of the drift estimates, which ranged between 0.6 and0.75 in all cases, indicate that the three methods presented are not appropriate to be used
SIMPLIFIED METHODS FOR ESTIMATING DRIFT OF R/C BUILDINGS SUBJECTED TO EARTHQUAKES 859
as accurate tools to calculate the maximum displacement of structures subjected to spe-cific ground motion records. However, when using drift as a means to estimate overalldamage in a structure, the accuracy afforded by the methods is sufficient to determinewhether structures will have adequate stiffness to achieve an intended performance ob-jective, or to identify buildings in which proper detailing is likely to play a significantrole in the structural response. Consequently, the simplified methods presented are bestsuited for the following:
• Rapid screening or evaluation of large quantities of buildings for policy-makingdecisions,
• Assessing the expected performance of buildings in areas of moderate seismic-ity, where a significant percentage of the structures are not detailed for toughnessand stiffness will play a primary role in the probable performance level, and
• Determining if a more thorough evaluation and the use of nondestructive evalu-ation methods is warranted in buildings in which information about the detailingis missing or incomplete.
The methods presented also may be used to develop a simple understanding of theexpected performance of structures before a more detailed method of analysis is em-ployed. Such situations include the initial proportioning of reinforced concrete structuresand the formulation of simple guidelines that engineers, building officials, and architectscan use to quickly assess the expected level of performance.
REFERENCES
Abrams, D. P., and Sozen, M. A., 1979. Experimental study of frame-wall interaction in rein-forced concrete structures subjected to strong earthquake motions, Structural Research Se-ries No. 460, Civil Engineering Studies, University of Illinois, Urbana, IL.
Applied Technology Council (ATC), 1997. NEHRP Guidelines for the Seismic Rehabilitation ofBuildings, prepared for the Building Seismic Safety Council, published by the Federal Emer-gency Management Agency, FEMA-273, Washington D.C.
Aristizabal-Ochoa, J. D., and Sozen, M. A., 1976. Behavior of ten-story reinforced concretewalls subjected to earthquake motions, Structural Research Series No. 431, Civil Engineer-ing Studies, University of Illinois, Urbana, IL.
Bracci, J., Reinhorn, A., and Mander, J., 1995. Seismic resistance of reinforced concrete framestructures designed for gravity loads: Performance of structural system, ACI Struct. J. 92 (5),597–609.
Browning, J., 1998. Proportioning of Earthquake-Resistant Reinforced Concrete BuildingStructures, Ph.D. thesis, School of Civil Engineering, Purdue University, West Lafayette, IN.
Browning, J., Li, Y. R., Lynn, A., and Moehle, J. P., 2000. Performance assessment for a rein-forced concrete frame building, Earthquake Spectra 16 (3), 541–556.
Cecen, H., 1979. Response of Ten-Story, Reinforced Concrete Model Frames to SimulatedEarthquakes, Ph.D. thesis, University of Illinois, Urbana, IL.
CalTech, 1971. Strong Motion Earthquake Accelerograms, Digitized and Plotted Data, Vol. II,Part A, Report EERL 71-50, Earthquake Engineering Laboratory, California Institute ofTechnology, Pasadena, CA.
CalTech, 1973a. Strong Motion Earthquake Accelerograms, Digitized and Plotted Data, Vol. II,
860 A. MATAMOROS, J. BROWNING, AND M. LUFT
Part B, Report EERL 72-50, Earthquake Engineering Laboratory, California Institute ofTechnology, Pasadena, CA.
CalTech, 1973b. Strong Motion Earthquake Accelerograms, Digitized and Plotted Data, Vol. II,Part D, Report EERL 72-52, Earthquake Engineering Laboratory, California Institute ofTechnology, Pasadena, CA.
California Strong Motion Instrumentation Program (CSMIP), 1994. Processed CSMIP Strong-Motion Data from the Northridge California Earthquake of 17 January 1994: Release No. 1through Release No. 6, Report Nos. OSMS 94-06 through 94-12, California Department ofConservation, Division of Mines and Geology, Office of Strong-Motion Studies, Sacra-mento, CA.
Eberhard, M. O., and Sozen, M. A., 1989. Experiments and analyses to study the seismic re-sponse of reinforced concrete frame-wall structures with yielding columns, Structural Re-search Series No. 548, Civil Engineering Studies, University of Illinois, Urbana, IL.
Eto, H., and Takeda, T., 1980. Dynamic collapse tests of reinforced concrete frame structureswith a column subjected to high compressive stress, Proceedings of the Seventh World Con-ference on Earthquake Engineering, September 8–13, 1980, Istanbul, Turkey, pp. 257–264.
Filiatrault, A., Lachapelle, E., and Lamontagne, P., 1998. Seismic performance of ductile andnominally ductile reinforced concrete moment resisting frames: I. Experimental study, Can.J. Civil Eng. 25 (2), 331–341.
Hassan, A. F., and Sozen, M. A., 1997. Seismic vulnerability assessment of low-rise buildingsin regions with infrequent earthquakes, ACI Struct. J. 94 (1), 31–39.
Healey, T. J., and Sozen, M. A., 1978. Experimental study of the dynamic response of a ten-story reinforced concrete frame with a tall first story, Structural Research Series No. 450,Civil Engineering Studies, University of Illinois, Urbana, IL.
Hidalgo, P. A., 1975. Earthquake Simulator Study of a Reinforced Concrete Frame, Ph.D. the-sis, University of California, Berkeley.
Japan Meteorological Agency (JMA), 1995. Strong Motion Accelerograms for Hyogo-Ken-Nanbu Earthquake, 17 January 1995.
Kitagawa, Y., Kubota, T., Kaminosono, T., and Kubo, T., 1984. Correlation study on shakingtable tests and pseudo-dynamic tests by R.C. models, Proceedings of the Eighth World Con-ference on Earthquake Engineering, San Francisco, CA.
Lepage, A., 1997. A Method for Drift-Control in Earthquake-Resistant Design of ReinforcedConcrete Building Structures, Ph.D. thesis, University of Illinois at Urbana-Champaign, Ur-bana, IL.
Lybas, J. M., and Sozen, M. A., 1977. Effect of beam strength and stiffness on dynamic behav-ior of reinforced concrete coupled walls, Structural Research Series No. 444, Civil Engineer-ing Studies, University of Illinois, Urbana, IL.
Minowams, C., Otani, K., Ogawas, N., Mikoshiba, T., Hayashida, T., and Okada, T., 1994. Shak-ing table failure tests of actual size RC structures, NIST Special Publication No. 871.
Moehle, J. P., and Sozen, M. A., 1978. Earthquake simulation tests of a ten-story reinforcedconcrete frame with a discontinued first-level beam, Structural Research Series No. 451,Civil Engineering Studies, University of Illinois, Urbana, IL.
Moehle, J. P., and Sozen, M. A., 1980. Experiments to study earthquake response of R/C struc-tures with stiffness interruptions, Structural Research Series No. 482, Civil EngineeringStudies, University of Illinois, Urbana, IL.
Mori, A. W., and Crouse, C. B., 1981. Strong Motion Data from Japanese Earthquakes, Report
SIMPLIFIED METHODS FOR ESTIMATING DRIFT OF R/C BUILDINGS SUBJECTED TO EARTHQUAKES 861
SE-29, National Geophysical Data Center, National Oceanic and Atmospheric Administra-tion, Boulder, CO.
Newmark, N. M., Hon, M., Blume, J. A., and Kapur, K. K., 1973. Seismic design spectra fornuclear power plants, Journal of the Power Division, ASCE, 99 (PO2), 287–303.
Oliva, M. G., 1980. Shaking table testing of a reinforced concrete frame with biaxial response,Report No. UCB/EERC-80/28, Earthquake Engineering Research Center, University of Cali-fornia, Berkeley.
Oliva, M. G., and Clough, R. W., 1987. Biaxial seismic response of R/C frames, J. Struct. Eng.113 (6), 1264–1281.
Otani, S., and Sozen, M. A., 1972. Behavior of multistory reinforced concrete frames duringearthquakes, Structural Research Series No. 392, Civil Engineering Studies, University ofIllinois, Urbana, IL.
Saiidi, M., and Sozen, M. A., 1979. User’s manual for the LARZ family: Computer programsfor nonlinear seismic analysis of reinforced concrete planar structures, Structural ResearchSeries No. 466, Civil Engineering Studies, University of Illinois, Urbana, IL.
Saragoni, R., Gonzalez, P., and Fresard, M., 1985. Analisis de los Acelerogramas del Terremotodel 3 de Marzo de 1985, Publicacion SES-I-4/1985(199), Universidad de Chile.
Schultz, A. E., 1985. An Experimental and Analytical Study of the Earthquake Response of R/CFrames with Yielding Columns, Ph.D. thesis, University of Illinois, Urbana, IL.
Shibata, A., and Sozen, M. A., 1976. Substitute-structure method for seismic design in rein-forced concrete, Journal of the Structures Division, ASCE, 102 (ST1), 1–18.
Shimazaki, K., and Sozen, M. A., 1984. Seismic Drift of Reinforced Concrete Structures, Tech-nical Research Report of Hazama-Gumi Ltd., pp. 145–166.
Vintzileou, E., Lu, Y., and Zhang, G., 1998. Seismic behaviour of multi-story R/C frames testedon an earthquake simulator, Seismic Design Practice into the Next Century, Research andApplication, Edmund Booth, ed., A. A. Balkema, Rotterdam, pp. 443–450.
Wolfgram, C. E., 1984. Experimental Modeling and Analysis of Three One-Tenth-Scale Rein-forced Concrete Frame-Wall Structures, Ph.D. thesis, University of Illinois, Urbana, IL.
Wood, S. L., 1986. Experiments to Study the Earthquake Response of Reinforced ConcreteFrames with Setbacks, Ph.D. thesis, University of Illinois, Urbana, IL.