* Corresponding author: Lecturer in Structural Engineering, School of Civil and Environmental Engineering, Faculty of Engineering and Information Technology, University of Technology Sydney (UTS) Building 11, Level 11, Broadway, Ultimo NSW 2007 (PO Box 123), Phone:+6129514 2640, Email: [email protected]Evaluation of Structural Systems in Slender High-Rise Buildings Patrick Walsh, Ali Saleh and Harry Far * School of Civil and Environmental Engineering, Faculty of Engineering and Information Technology, University of Technology Sydney (UTS), Australia Abstract With the rapid population growth and scarcity of developable space, especially in large cities, there is a need for increased density in both commercial and residential housing, and hence a strong demand to maximise floor space by constructing not only tall, but also slender buildings. This study considers different structural systems available for constructing slender high-rise buildings and evaluates their feasibility in terms of the lateral deformation being one of the key governing design criteria for very tall buildings. To examine the performance of different structural systems in buildings of varying height and floorplan, this study applies finite element analyses in a parametric study to compare nine different building configurations under static loading with heights varying from 80m to 460m. The study shows that buildings with square footprints can achieve greater heights over rectangular footprints with the same area and that multiple towers when connected structurally at one or more levels can achieve even greater heights. Keywords: Slender High-Rise Buildings, Structural Systems, Large Cities, Building Footprint, Housing, Floor Space, Structural Performance 1. Introduction Creating tall structures first began as an expression of wealth, power and structural engineering advancement. However, with the rapid population growth and expanding urbanisation, tall structures remain highly relevant for both commercial and residential construction. In particular, slender buildings are becoming more commonplace as developers look to build higher in plots of lands that were previously considered too small to reach such heights. As indicated by Willis (2016), structural engineers generally consider skyscrapers with a minimum 1:10 or 1:12 ratio - the width of the building's base to its height - to be slender. However, many of the newest skyscrapers far exceed this ratio. For instance, “111 West 57th Street” tower in New York has a slenderness ratio of 1:24; this is more than twice as slender as what is required to be considered ‘slender’. A challenging design consideration of slender buildings to find the optimal compromise between usable floor space and structural performance is the arrangement of the vertical structural elements (columns and shear walls) within the building footprint. According to Khan (2004), the key structural performance criterion with creating taller and more slender structures is the excessive deflections under lateral wind loads. As buildings grow taller and thinner, gravity loads are no longer the critical loading case. Therefore, lateral wind loads become the dominate design case.
Transcript
* Corresponding author: Lecturer in Structural Engineering, School of Civil and Environmental Engineering, Faculty of
Engineering and Information Technology, University of Technology Sydney (UTS) Building 11, Level 11, Broadway,
Evaluation of Structural Systems in Slender High-Rise Buildings
Patrick Walsh, Ali Saleh and Harry Far*
School of Civil and Environmental Engineering, Faculty of Engineering and Information Technology, University of Technology Sydney (UTS), Australia
Abstract
With the rapid population growth and scarcity of developable space, especially in large cities, there is a need for increased density in both commercial and residential housing, and hence a strong demand to maximise floor space by constructing not only tall, but also slender buildings. This study considers different structural systems available for constructing slender high-rise buildings and evaluates their feasibility in terms of the lateral deformation being one of the key governing design criteria for very tall buildings. To examine the performance of different structural systems in buildings of varying height and floorplan, this study applies finite element analyses in a parametric study to compare nine different building configurations under static loading with heights varying from 80m to 460m. The study shows that buildings with square footprints can achieve greater heights over rectangular footprints with the same area and that multiple towers when connected structurally at one or more levels can achieve even greater heights.
Keywords: Slender High-Rise Buildings, Structural Systems, Large Cities, Building Footprint, Housing, Floor Space, Structural Performance
1. Introduction
Creating tall structures first began as an expression of wealth, power and structural engineering
advancement. However, with the rapid population growth and expanding urbanisation, tall
structures remain highly relevant for both commercial and residential construction. In
particular, slender buildings are becoming more commonplace as developers look to build
higher in plots of lands that were previously considered too small to reach such heights. As
indicated by Willis (2016), structural engineers generally consider skyscrapers with a minimum
1:10 or 1:12 ratio - the width of the building's base to its height - to be slender. However, many
of the newest skyscrapers far exceed this ratio. For instance, “111 West 57th Street” tower in
New York has a slenderness ratio of 1:24; this is more than twice as slender as what is required
to be considered ‘slender’.
A challenging design consideration of slender buildings to find the optimal compromise
between usable floor space and structural performance is the arrangement of the vertical
structural elements (columns and shear walls) within the building footprint. According to Khan
(2004), the key structural performance criterion with creating taller and more slender structures
is the excessive deflections under lateral wind loads. As buildings grow taller and thinner,
gravity loads are no longer the critical loading case. Therefore, lateral wind loads become the
dominate design case.
2
Lateral sway deflections can cause discomfort to the building’s occupants, especially on the
higher levels and can increase the design action effects associated with geometric non-linearity.
Several studies (e.g. Fatahi et al., 2011; Fatahi et al., 2014; Tabatabaiefar and Mansoury, 2016)
have highlighted detrimental effects of excessive lateral sway deflections on performance level
and overall stability of tall buildings. Developing an effective lateral load resisting system is
therefore one of the greatest challenges for structural engineers designing tall slender towers.
Traditionally, a large central concrete core is constructed to provide sufficient stiffness to
minimise deflection (Ho 2016). To increase the slenderness of tall buildings, other innovative
structural systems such as a ‘trussed tube’ can be utilised. Mitigation of deflection can be
achieved through structural system modifications, auxiliary damping devices, and aerodynamic
modifications (Tamura & Kareem 2013). This study is mainly concerned with static action
effects and the impact that structural systems modifications can have on reducing maximum
deflection and ensuring they remain within acceptable serviceability limits.
When considering the deformational response of tall buildings, inter-story drifts must be taken
into account for the design of individual structural elements. However, based on empirical
observations and theoretical dynamic response considerations, Scholl (1984) emphasised that
the potential for drift related damage is highly variable, and is dependent on the structural and
non-structural detailing provided by the designer. For this reason, a uniform structural design
details were adopted for all buildings in this study and inter-story drift effects have not been
included for comparing the deformational responses of different building systems. The
maximum deflection was therefore chosen as it provides a single indicative parameter to
comparing the global response of different building.
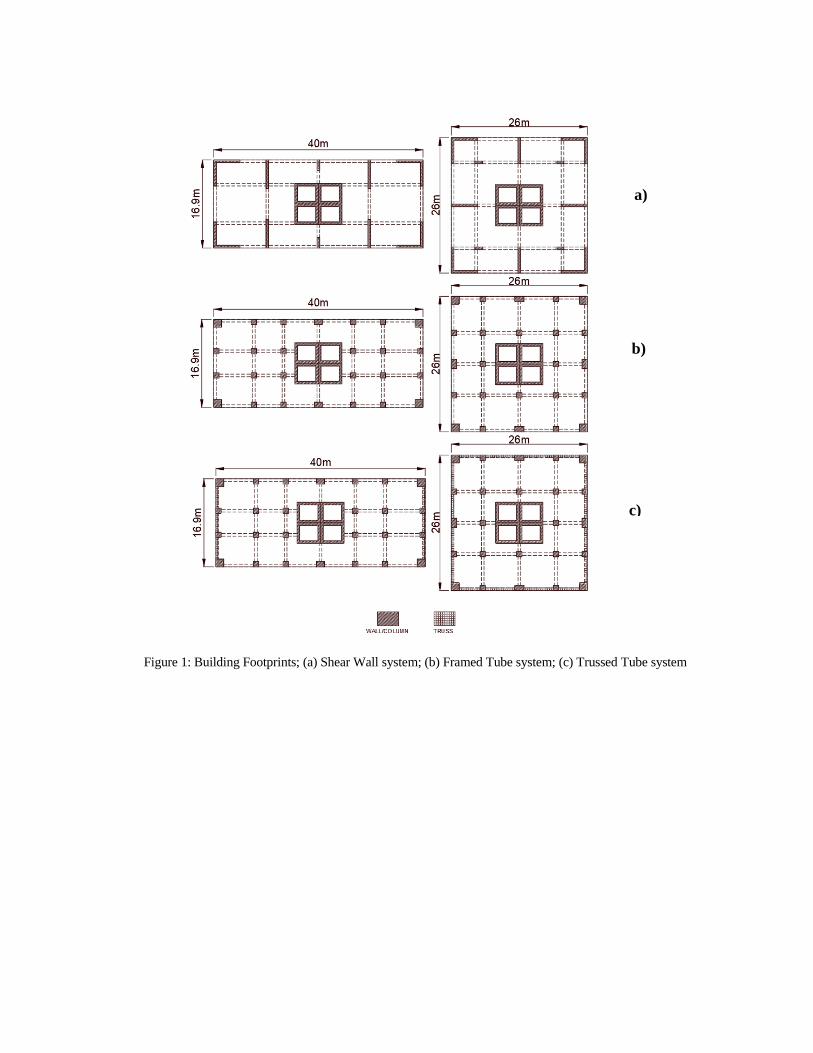
2. Comparative Study Overview To investigate the structural performance of slender buildings, three common structural
systems as shown in Figure 1 were examined. Each of those buildings has a total footprint
area, which was chosen to be 676 m2, which is slightly smaller than the 800m2 footprint of 432
Park Avenue depicted in Figure 2 (Ho 2016); a square slender tower in New York that reached
426m, with a slenderness ratio of 1:15 (smallest width to height ratio). However, it is worth
noting that in the design of 432 Park Avenue tower, a tuned mass damper was used to achieve
the high slenderness ratio, which would not be feasible without the damping device.
2.1. Structural System Prototypes
3
As indicated in Figure 1, each of the buildings examined has either a square (26m × 26m) or a
rectangular (40m × 16.9m) foot print configuration. For comparison purposes, each building
design has an identical concrete core, housing four 3.5m × 2.95m lift shafts and uses a total of
51.8m2 cross-section area for shear walls and columns. Additionally, as will be presented later,
a multiple tower concept was examined. All building prototypes were given the same cross
section properties as far as possible. Dimensions and material properties adopted for all
structural components were based on typical dimensions of similar high-rise buildings. All
models use 60MPa high strength concrete. Tying the walls together are 800mm × 500mm (D
× W) concrete beams and 200mm thick concrete slabs. The core and shear walls have a 500mm
wall thickness. The total cross section area of all vertical structural elements, excluding the
32m2 core is constant on all floors to simplify comparison. Furthermore, a constant floor-to-
floor height of 4m is maintained throughout.
The trussed tube prototype has the same configuration as both the shear wall and the framed
tube prototypes, but with the inclusion of a truss placed on the external face of the buildings.
The exterior truss uses round steel hollow sections with an outside diameter of 1000mm and a
wall thickness of 100mm. Each exterior truss diagonal extends across 5 storeys and connects
into large concrete corner columns. The finite element model with rectangular plan has the
trusses included only on its shorter sides, to resist the lateral loads in the buildings weakest and
most critical bending axis. The finite element model with square plan has the truss on all sides,
as the critical bending axis is along the diagonal of the building.
2.2. Finite Element Models
The finite element models were created using CSI ETABS, a structural analysis software
typically used in the analysis of high-rise buildings. All FE simulations have considered the
combined actions of wind and gravity loading, as well as nonlinear P-Delta effects. Figures 3 to
8 depict finite element models of the different systems corresponding to the floor plans shown in
Figure 1. All FE models depicted in Figures 3 to 8 were analysed for a range of the number of
storeys varied from 20 to 70 and corresponding heights from 80m to 280m, respectively.
The ETABS models have each been created using the same design methodology and have a
uniform floorplan throughout the superstructures. Each of the models depicted in Figures 3 to
8 were subjected to a uniformly distributed lateral load; and a preliminary validation of the
models indicated that their maximum deflection was reasonably correlated to the deflection of
an analogous fixed cantilever beam from first principals.
4
3. Structural Loading
Loads applied to all structural models were limited to gravity and wind actions as representative
of the dominant loads affecting sway displacements in tall buildings. Other load conditions
were considered not relevant for the purpose of investigating the lateral static deflections.
Gravity loads applied to all floors were applied uniformly with typical values of 4 kPa and 2
kPa for dead and live loads respectively. Lateral wind forces were determined in accordance
with AS/NSZ 1170.2 (2011) standards leading to the parameters listed in Table 1. A terrain
Category 2 (Well-scattered obstructions having heights generally from 1.5 m to 10 m) was
assumed as this is fairly conservative, and allows for a wider application for the results. The
regional wind speed parameter was chosen to be 45m/s, which corresponds to a 500-year
average recurrence interval, in the region of Sydney, Australia.
In the FE model, lateral (wind) forces were generated automatically by an in-built module of
the ETABS software. The wind loads were simulated as resultants of the corresponding
tributary façade area acting at each floor level, whereby floors were modelled to act as rigid
‘diaphragms’ in the horizontal plane that in turn distribute the loads to the vertical elements.
As the framing plan is doubly symmetrical, the centre of stiffness coincides with the geometric
centroid and hence twisting with respect to the vertical axis was not present. As an example,
Figure 9 shows the force resultants applied at each floor level to both the narrow face and the
wide face of a 70-storey building with rectangular footprint. Additionally, a load case
representing diagonal wind exposure is applied in the FE simulation as a combination of
directional forces acting simultaneously on the narrow and wide faces.
4. Parametric Study
As discussed earlier, the key structural performance criterion for tall slender buildings is
limiting excessive deflections under lateral wind loads (Khan 2004). According to Section 2
of AS3600 (2009), the limiting lateral deflection allowed for a building is the Height/500 as
expressed by ∆Limit in Equation 1.
∆𝐿𝐿𝐿𝐿𝐿𝐿𝐿𝐿𝐿𝐿=𝐻𝐻500
(1)
The deflection limit of Equation 1 is therefore adopted as conservative criterion in order to
determine the maximum possible building height of the different structural systems considered
in this study.
4.1. Building Deflections, Height Limit and Slenderness Ratio
5
The approach used to identify the limiting height for a given structural system can be explained
by referring to the examples of buildings with shear walls presented in Table 2 and Figure 10.
As key parameter, the building height is varied by varying the number of storeys between 20
and 70 and a separate FE simulation was conducted in each case to establish the maximum
lateral deflection of the building. In plotting the curves of both, the allowable deflection values
(∆Limit) were determined based on Equation 1 while the maximum deflections (∆max) were
obtained from the FE analysis as functions of number of storeys, the limiting height and
corresponding slenderness ratio is able to be interpolated using the intersection of the two
curves. In the example of Figure 10 for the case of the rectangular building with shear wall,
the critical height reached is 176m which corresponds to a maximum of 44 storeys and a 1:10.7
slenderness ratio.
When the above approach is also applied to the building with the square footprint, the
comparison in performance with the rectangular case can be easily established as shown in
Table 3 and Figure 11.
4.2. Shear Wall Lateral Deflection Performance Comparison From Figure 11 and Table 3, it can be seen that the square footprint model has a higher lateral
stiffness and consequently performs significantly better in terms of its lateral deflection.
Instead of a maximum possible height of 44 storeys, the square footprint design reached 62
storeys; a 41% improvement in performance.
5. Results and Discussion
The approach outlined above was applied to all other studied structural systems in order to
compare their performance in terms of height while marinating the required lateral deflections
limits under the same wind conditions. The results of individual building prototypes are given
in Tables 4 to 7 and a summary is presented in Figure 12 and Table 8. It can be seen from
Figure 12 that in all cases considered, the buildings with the square footprint perform better
than the buildings with rectangular footprints. This difference is due to two major factors. The
first is the critical wind exposure direction of the square tower with the loads acting in the
diagonal direction, which has a smaller exposure width of 36.7m compared to the 40m critical
exposure width of the rectangular tower’s wide facade. The second reason is the square tower’s
larger effective moment of inertia around its diagonal axis compared with the weaker principal
axis of the rectangular tower. It is also observed that the difference between the shear wall and
framed tube systems considered in this study is minimal, due to a similar effective moment of
inertia, while the trussed tube system shows the best results due to the additional lateral
stiffness provided by the truss action.
6
5.1. Non-structural Consideration
While structural performance is essential for maximising building height and thereby floor
space, other aspects not investigated in this study concerning cost, construction constraints and
architectural function should also be considered as part of the design. For example, in order to
facilitate comparison in this parametric study, the total cross-section area of vertical structural
members (columns, shear walls and lift core) is kept constant over the entire height of the
building, whereas in practice, these may be optimised to reduce cost of construction materials.
It is also worth noting that for the trussed tube system, the erection of the steel trusses including
complex steel to concrete connections can be costly and may extend the overall duration of
construction.
Another aspect to consider is the amount of open vs blocked façade areas. An open façade is
crucial for improving comfort for occupants, and usually has a positive financial return value
attached to it. A comparison between different systems, in terms of open and blocked façade
per floor, is provided in Table 9 and Figure 13.
The buildings with rectangular footprint have a total perimeter of 113.8m compared to 104m
for the square floorplate design and hence a greater open façade area in comparison. The framed
tube designs were the least obstructive to the façade area, with an average of 24% of the total
perimeter per floor being blocked. More obstructive than the framed tube, was the shear wall
structural systems, with an average of 39% of the façade area being blocked. Figure 13 shows
that the shear wall structural systems block more of the available façade perimeter than the
framed tube, limiting the openness of liveable building space. Even though a rectangular
footprint gives a greater total perimeter, the square framed tube structural system was able to
outperform the rectangular shear wall structural system by 9% or 6.2m in terms of open façade
length per floor. The most obstructive structural system was the trussed tube structural system.
While based on the framed tube models, the addition of the exterior trusses obstructed 25% of
the façade on each floor; resulting in a 49% blocked façade on average. The aforementioned
points emphasise the need for compromises between structural performance and architectural
function.
6. Multiple Tower System
By structurally connecting two or more towers as indicated by the example of Figure 15b, it is
assumed that their combined lateral stiffness will increase, thereby reducing deformation and
consequently enabling the construction of taller towers compared with a standalone case
7
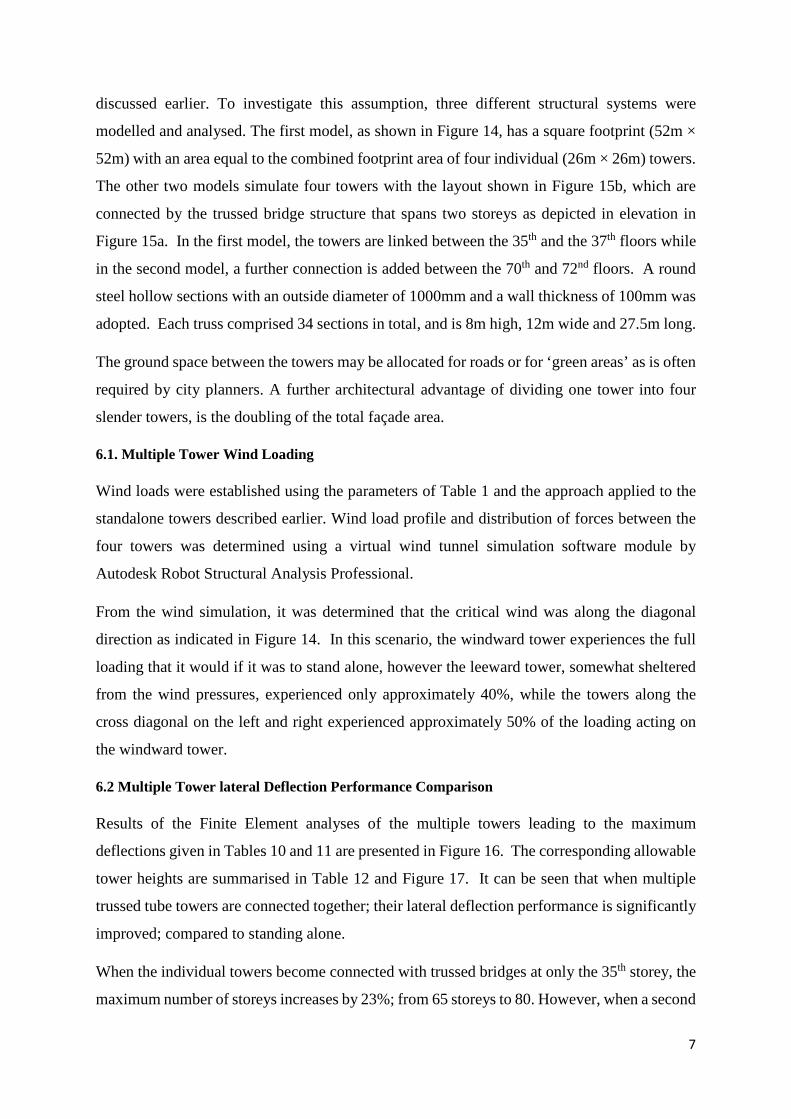
discussed earlier. To investigate this assumption, three different structural systems were
modelled and analysed. The first model, as shown in Figure 14, has a square footprint (52m ×
52m) with an area equal to the combined footprint area of four individual (26m × 26m) towers.
The other two models simulate four towers with the layout shown in Figure 15b, which are
connected by the trussed bridge structure that spans two storeys as depicted in elevation in
Figure 15a. In the first model, the towers are linked between the 35th and the 37th floors while
in the second model, a further connection is added between the 70th and 72nd floors. A round
steel hollow sections with an outside diameter of 1000mm and a wall thickness of 100mm was
adopted. Each truss comprised 34 sections in total, and is 8m high, 12m wide and 27.5m long.
The ground space between the towers may be allocated for roads or for ‘green areas’ as is often
required by city planners. A further architectural advantage of dividing one tower into four
slender towers, is the doubling of the total façade area.
6.1. Multiple Tower Wind Loading
Wind loads were established using the parameters of Table 1 and the approach applied to the
standalone towers described earlier. Wind load profile and distribution of forces between the
four towers was determined using a virtual wind tunnel simulation software module by
Autodesk Robot Structural Analysis Professional.
From the wind simulation, it was determined that the critical wind was along the diagonal
direction as indicated in Figure 14. In this scenario, the windward tower experiences the full
loading that it would if it was to stand alone, however the leeward tower, somewhat sheltered
from the wind pressures, experienced only approximately 40%, while the towers along the
cross diagonal on the left and right experienced approximately 50% of the loading acting on
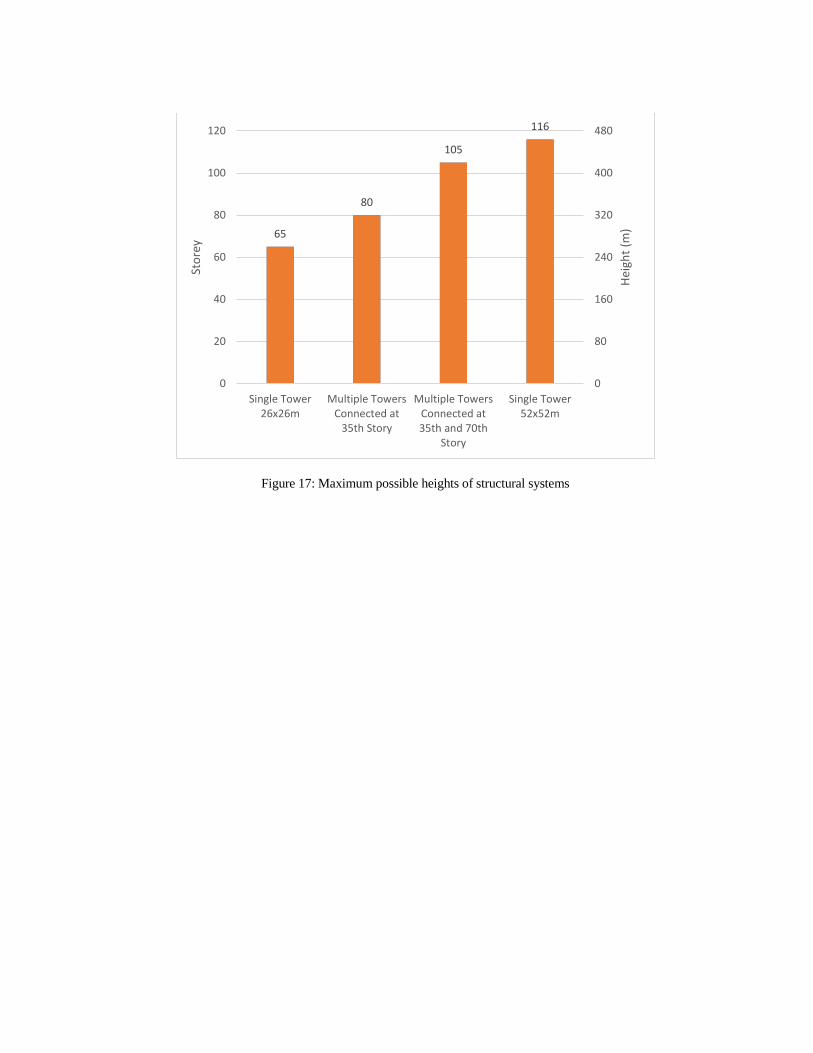
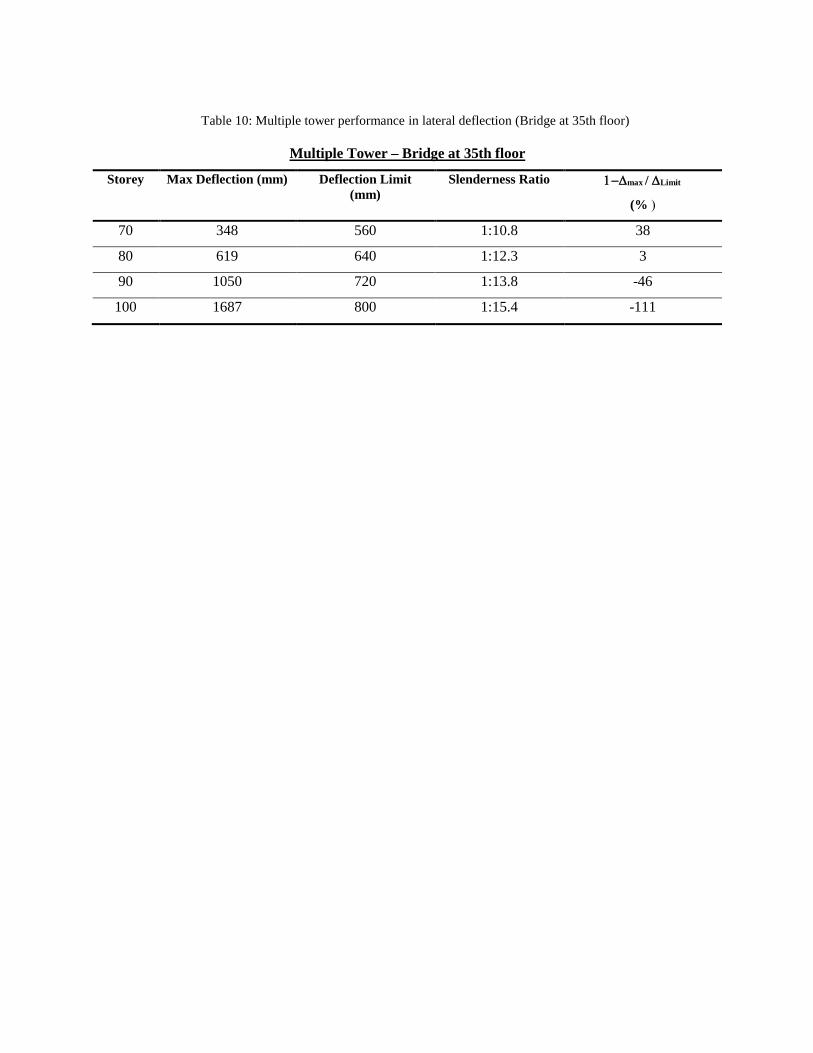
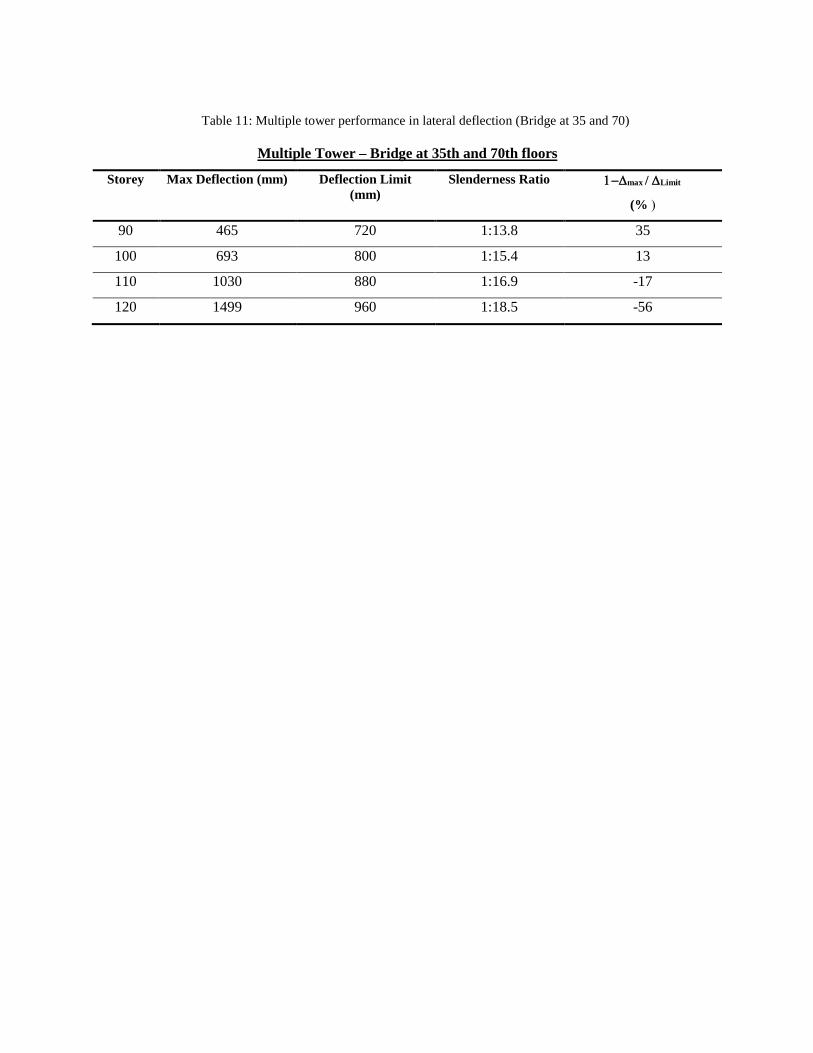
Results of the Finite Element analyses of the multiple towers leading to the maximum
deflections given in Tables 10 and 11 are presented in Figure 16. The corresponding allowable
tower heights are summarised in Table 12 and Figure 17. It can be seen that when multiple
trussed tube towers are connected together; their lateral deflection performance is significantly
improved; compared to standing alone.
When the individual towers become connected with trussed bridges at only the 35th storey, the
maximum number of storeys increases by 23%; from 65 storeys to 80. However, when a second
8
set of steel trussed bridges is introduced at the 70th floor, the maximum number of possible
storeys increases to 105 or 62% compared to the single tower. The 62% improvement is very
significant, and gives the multiple tower concept great merit. This is assuming that the
complexity and added construction and project development costs can be overcome. It is worth
noting that combining the four buildings together into one large 52×52m tower will result in
an even structurally superior design by achieving the greatest height of 464m with 116 storeys.
However, with only 10% increase in number of storeys compared with the multiple towers,
this design has only half the perimeter length per storey and therefore much reduced open
façade area which may be less architecturally attractive.
7. Final Remarks
A summary of the results obtained from the nine structural systems investigated in this study
is presented in Figure 18. It can be seen that the variation in maximum possible heights
achieved for a given footprint by changing the structural systems is relatively small. The larger
variations occur due to changing the aspect ratio of the floor plates, and therefore also the
effective bending stiffness and the wind exposures. The rectangular building designs were only
able to achieve approximately 70% of the height of their square counterparts; despite having
an identical floorplate area. This was due to a combination of a higher critical wind exposure
surface area, and a decreased moment of inertia around the weak principal bending axis of the
rectangular buildings. While in terms of effective slenderness ratio, the rectangular designs
were still able to outperform the square designs by approximately 10%, the square
configuration enabled more storeys and hence more liveable floor space to be constructed on
the same footprint area.
The multiple tower concept was able to significantly outperform the single trussed tube square
tower that is used as the structural basis of the concept. This was mainly due to a larger
combined lateral stiffness and the reduced wind pressures experienced by the leeward towers,
due to the sheltering by the windward towers. This resulted in an average wind pressure 40%
lower compared to a single exposed tower; assuming the structure is able to act as a single
system.
8. Conclusion
Through this study, the structural response of nine different tall building systems was
investigated. The structures were subjected to gravity and wind loads in order to determine the
lateral deflection of the buildings and to establish the maximum possible height that would
satisfy the serviceability requirement of height/500 as allowable deformation. Each of the
9
buildings examined, which had either a square (26m × 26m) or a rectangular (40m × 16.9m)
foot print configuration, was analysed with different floorplan arrangements including a shear
wall, a framed tube and a trussed tube configuration. Individual towers were analysed for
heights varying between 80m and 280m while multiple towers that were connected structurally
by truss bridges at one or two locations were analysed for heights varying between 280m and
464m. It was observed that the difference between the shear wall and framed tube systems
considered in this study is minimal, while the trussed tube system showed the best results due
to the additional lateral stiffness provided by the truss action. It was also found that buildings
with a square footprint can achieve greater heights over rectangular buildings with the same
footprint due to the rectangular building having in comparison a larger wind exposure façade
area and weaker bending stiffness in the critical wind direction. Furthermore, multiple towers
when connected structurally at one or more levels were found to achieve even greater heights
than if they were not connected.
10
References
AS/NZS 1170.0. (2002) Australian/New Zealand Standard and supplement, Structural Design Actions: General Principles, Standard Australia, Sydney
AS/NZS 1170.1. (2002) Australian/New Zealand Standard and supplement, Structural Design Actions – Part 1: Permanent, Imposed and Other Actions, Standard Australia, Sydney
AS/NZS 1170.2. (2002) Australian/New Zealand Standard and supplement, Structural Design Actions – Part 2: Wind Actions, Standard Australia, Sydney
AS/NZS 3600. (2009) Australian/New Zealand Standard and supplement, Plain and Reinforced Concrete – Code of Practice\
Fatahi, B., Tabatabaiefar, H.R & Samali, B. 2011, 'Performance Based Assessment of Dynamic Soil-Structure Interaction Effects on Seismic Response of Building Frame', Proceedings of Georisk 2011 - Geotechnical Risk Assessment & Management (Geotechnical Special Publication No. 224), American Society of Civil Engineers (ASCE), pp. 344-351.
Fatahi, B., Tabatabaiefar, H.R & Samali, B. 2014, 'Soil-Structure Interaction vs Site Effect for Seismic Design of Tall Buildings on Soft Soil', Geomechanics and Engineering, vol. 6, no. 3, pp. 293-320, Techno Press.
Khan, Y. 2004, 'Engineering Architecture: The vision of Fazlur R. Khan', Norton
Ho, G. 2016, 'Tall Building Structures: Analysis and Design’, Council on Tall Buildings and Urban Habitat
Scholl, R. 1984, Brace Dampers: An Alternative Structural System for Improving the Earthquake Performance of Buildings, Prentice Hall, pp1017
Tabatabaiefar, H.R. & Mansoury, B. 2016, 'Detail Design, Building and Commissioning of Tall Building Structural Models for Experimental Shaking Table Tests', The Structural Design of Tall and Special Buildings, vol. 25, no. 8, pp. 357–374, Wiley-Blackwell.
Tamura, Y. & Kareem, A. 2013, 'Advanced Structural Wind Engineering', Springer Japan, pp378-407
Willis, C. 2016, 'Singularly Slender: Sky Living in New York, Hong Kong, and Elsewhere', Council on Tall Buildings and Urban Habitat.
Figure 1: Building Footprints; (a) Shear Wall system; (b) Framed Tube system; (c) Trussed Tube system
a)
b)
c)
Figure 2: 432 Park Avenue (Ho 2016)
Figure 3: Rectangular shear wall finite element model
Figure 4: Square shear wall finite element model
Figure 5: Rectangular framed tube finite element model
Figure 6: Square framed tube finite element model
Figure 7: Rectangular trussed tube finite element model
Figure 8: Square trussed tube finite element model
(a) (b)
Figure 9: Example of lateral loads of a 70 storey rectangular building; (a) Narrow face; (b) Wide face
Figure 10: Rectangular shear wall maximum possible storeys
Figure 11: Rectangular and square shear wall maximum possible storeys
Figure 12: Comparison of structural systems lateral deflection performance
Figure 13: Façade openness of structural systems (per floor)