Aydin E.R.B., Ayeri T., Sisman Y. and Ardali Y. (2018), Evaluation of the anthropogenic impact in Suat Ugurlu Dam lake using multivariate
statistical techniques, Global NEST Journal, 20(X), XX-XX.
Evaluation of the anthropogenic impact in Suat Ugurlu Dam lake using multivariate statistical techniques
Aydin E.R.B.1, Ayeri T.1, Sisman Y.2 and Ardali Y.1,* 1Ondokuz Mayis University, Department of Environmental Engineering, 55139, Atakum, Samsun, Turkey 2Ondokuz Mayis University, Department of Geomatics Engineering, 55139, Atakum, Samsun, Turkey
Received: 13/06/2017, Accepted: 14/11/2017, Available online: 30/01/2018
*to whom all correspondence should be addressed: e-mail: [email protected]
Abstract
Sediments play an important role in the quality of aquatic ecosystems in the Dam Lake where they can either be a sink or a source of contaminants, depending on the management. This purpose of this study is to identify the sediment quality in order to find out the causes for the malodor and the eutrophication that is causing a bad scenario. Solutions for improving the dam are proposed. Multivariate statistical techniques, such as a principal component analysis (PCA) and cluster analysis (CA), were applied to the data regarding sediment quality in relation to anthropogenic impact in Suat Ugurlu Dam Lake. This data was generated during 2014-2015, with monitoring at four sites for 11 parameters. A PCA and CA were used in the study of the samples. The total variance of 84.1%, 74.3%, 87.4% and 91.5% suggest 4, 3, 3 and 4 principle components (PCs) in the four locations: LC1, LC2, LC3 and LC4, respectively. Also, a CA was applied to both the variables and the observations. Some variables and observations showed a high similarity based on the results of variables in the CA. Also, the similarity ratio of temperature-mercury (Hg) and oxidation reduction potential (ORP) was high and generally, the cluster number of variables was 5, according to the selected similarity level.
The continuously growing environmental problems constitute a serious threat to human and animal life. In particular, the ever increasing pollution of the aquatic ecosystem causes economical, ecological and sociological problems (Köse and Uysal, 2008). The sediment layer contains heavy metals, apart from other various toxic pollutants. The heavy metals, which are toxic pollutants, generally accumulate in the surface and groundwater. Their transportation and accumulation mechanisms in water vary, depending on many parameters and a quite complicated processes. It is very important to determine the metal loads of the lake sediment. The metal loads are important because of their potential uses, such as the amelioration of surface soils. The accumulation of these
metals in sediments is an important corcern, as it affects the quality of the water. Sediments may constitute an important resource, as they are often extremely rich in nutrients in chemical forms easily available to plants. In the framework of an extensive study, the use of rock-related materials enhanced the fertility of impoverished soils. In the last two decades, researchers have studied the characteristics of sediments that had accumulated in various dam reservoirs that were being developed under local climatic conditions, and we have successfully developed an innovative and sustainable concept for the use of these sediments as soil additives or artificial soils. The integration of reservoir sediments into the soil increases the water-holding capacity, which reduces the need for irrigation; the microbiological activity, which is often essential in bridging soil and plants' root systems; and the levels of a large range of nutrients that are critical to plant development. These factors turn a universally important problem-namely, the excessive silting of reservoirs-into a valuable resource with ample environmental benefits (Fyfe, 2000; Fonseca et al., 2003, 2007a, 2009; Fu et al., 2012).
Dam lakes are physical barriers limiting the natural transport of water, which leads to a decrease of the water-flow rate. As a result of the increase in sediment-residence time, Dam Lakes are typical sites where sediment accumulation is favored (Friedl and Wüest, 2002; Zhao et al., 2013; Fremion et al., 2016). Soil erosion and the consequent loss of nutrients and organic matter have both direct and indirect effects, ranging from the diminished productivity and profitability of the soils to the physical and chemical contamination of water resources (Soares et al., 1999).
The heavy metal pollution in the environment has lately attracted attention due to the metals' high toxicity, continuity, and accumulation in the aquatic environments (Wang et al., 2015; Shafie et al., 2014; Nan et al., 2014). Due to economic growth and the rapid development of industrialization, heavy metals are being continuously introduced into coastal environments through surface-water drainage and river flow and into point sources where metal-refinishing products are produced in coastal reaches worldwide. When pollution due to metals enters the lake
environment, it is incorporated into sediments with organic matter, sulfides, clay and iron/manganese (Fe/Mn) oxides. The accumulating heavy metals in sediment may be chemically altered by organisms and converted into organic complexes. These substances can be dangerous to humans and animals when introduced into the food chain. Therefore, it is important to understand the distribution of heavy metals in sediments in relation to pollution control.
In recent years the statistical research has developed a lot of multivariate statistical techniques-such as the principal component analysis (PCA), cluster analysis (CA). These methods helped to evaluate the complex data and allowed the reduction of the observed variables, or the observation number (Shrestha and Kazama, 2007; Khalil et al., 2010; Mahapatra et al, 2011).
The aim of the present study is to understand the effects of heavy metals, pH, and temperature on the lake sediments based on the statistical processing of the experimental data by means of multivariate procedures such as the PCA and the CA.
Materials and Methods
2.1 Study area
The study area covers Suat Ugurlu Dam Lake within the borders of the Ayvacık Samsun province in northern Turkey. The region is located at 40°59'22.0" North and 36°38'02.3" East. Suat Ugurlu Dam was built at Yeşilırmak
in Samsun between 1975 and 1982 with the objective of providing irrigation and electricity. The dam, which is a type of soil body fill, has a volume of 2.151.000 m³, a height of 51,00 m from the stream bed, a volume of 182,00 hm³ at normal water level, and a lake area of 9,70 km² at normal water level. The dam serves an irrigation area of 83,312 hectares, and hydroelectric power plant, with a capacity of 46 MW, produces 273 GWh of electricity per year (URL1).
In this study, a total of four sampling stations with the potential to emit pollutants into Suat Ugurlu Dam Lake were determined after land surveys (Fig. 1). The coordinates and station names are shown in Table 1. The stations were selected from the regions that have a sediment-like structure to represent the pollution near the discharge points in Suat Ugurlu Dam's reservoir. These stations are LC1 (Sahil Village), LC2 (Terice Stream), LC3 (Wastewater Treatment Plant), LC4 (Pazaronu).
Table 1. Sampling area locations and their coordinates
Station Number
Station Name Coordinates
LC1 Sahil Village 41.012641, 36.639087
LC2 Terice Stream 40.974083, 36.632711
LC3 Wastewater Treatment Plant
41.007341, 36.631352
LC4 Pazaronu 40.989445,36.633963
Figure 1. Location map of study area representing various sampling stations along Suat Ugurlu Dam Lake
2.2. Sample collection
This study was conducted with the aim of detecting and monitoring the pollution caused by the undesirable changes in Suat Ugurlu Dam Lake. Four sampling points
(Sahil Village, Terice Stream, Wastewater Treatment Plant and Pazaronu) were identified seasonlly in places where the pollution load was intense in the study area. Sediment samples were taken between 2014 and 2015 from the surface sediment in the sampling stations. Samples were
EVALUATION OF THE ANTHROPOGENIC IMPACT IN SUAT UGURLU DAM LAKE 3
collected in sample vessels from the point collection stations and they were transferred to the laboratory in refrigators in order to reduce the degradation of the samples before analysis.
2.3 Sediment analysis
Samples were taken from surface sediment at four sampling stations through the use of the Beeker sediment-sampling device. The analytical methods were accordance with the internationally accepted procedures and standard (APHA, 2017). The experimental measurements were carried out in two steps. One part-which included pH, temperature, conductivity and dissolved oxygen concentrations-was done immediately in the feild, and the other part was done in the laboratory. The sediments were carried to the laboratory in acid-rinsed polyethylene plastic bags in an ice box and then were dried at 80 °C. The sediment was first sieved through a 2-mm steel sieve to remove coarse debris and fragments of shells and was then squashed and mildly ground with an agate mortar and pestle until it could pass through a 63-µm steel mesh. The analyses of the metal contents and speciation were conducted for the <63-µm grain size fraction. The metal samples were analyzed for copper (Cu), mercury (Hg), nickel (Ni), lead (Pb) and zinc (Zn) concentrations using an atomic absorption spectrometer. The brand of the AAS device is Unicam929.
2.4 Statistical analytical procedures
2.4.1 Multivariate analysis
The multivariate analysis of the sediment-quality data set was performed by means of the PCA and CA using the Minitab 16 statistic software package.
A PCA, based on the standardized samples, was performed to identify the significant parameters for the characterization of the sediment quality (Liang and Yu, 2000). The PCA provides both determined predictive models of data and large scale variables. PCA models should be used on the correlation matrix of data if the variables have different units. The correlation coefficients are determined positively or negatively relationship between variables using correlation analysis. The correlation matrix is created from the values of the correlation coefficients, and these coefficients can range from -1 to +1. The correlation coefficient also represented in the similarity tendency between the variables. In this case, variables number can be reduced in future work. Generally, if the correlation coefficient is bigger than 0.75, it is considered that there is a siginificsnt relationship between the variables (Bingol et al., 2013). In this case, the number of significant components can be determined according to the eigenvalues in the PCA (Accornero et al., 2008; Beck et al., 2013; Adams et al., 1992)
The CA is a statistical data-management technique (Lyapina, 2016). The aim of the CA is to divide the observations according to similar properties, location, measurement time, and so on. The CA method is based on the spatial-distance measure between observations. There are different hierarchical clustering methods as such single
and complete cluster, centroid, Ward’s minimum variance, and the average distance method (Liao et al., 2016). Hierarchical clustering is the most common approach. It provides instinctive similarity relationships between any one sample and the entire data set, and it is typically illustrated by a dendrogram (tree diagram).
Results and Discussion
In recent years, heavy-metal pollution has become a serious ecological problem. Industrial activities related to mining and ore processing constitute the main source of heavy-metal pollution. Also, pollutants coming from other industrial branches lead to enhanced pollution. In addition to industrial applications, agricultural activities and domestic discharges cause heavy-metal pollution. Fertilizers used in agricultural activities contain nitrogen (N) and phosphorus (P) at high levels. Both sides of the Suat Ugurlu Dam Lake have a sloping soil profile, which leads the pollutants with suspended soil particles to travel through the surface drainage along to the Dam Lake with the precipitation (rain fall). The pollutants entering the lake gradually accumulate, forming a layer (i.e. the sediment). The Sediment layer increases over time and threatens the aquatic ecosystem. Materials-such as heavy metals, N, and P that accumulate in the sediment affect not only the aquatic ecosystems but also the ecosystem along with the ecological cycle. Fluctuations in heavy-metal concentrations were observed in the sampling that was carried out for one year in the Suat Ugurlu Dam Lake. In particular, after the first six months of the year, the rapid increase of the mercury (Hg) concentration was most probably caused by the uncontrolled discharges. Changes in the nitrogen and phosphorus concentrations of the water have also been found to be caused by domestic sources related to agricultural activities. In this study, variations in parameters-such as heavy metals, nitrogen and phosphorus-were evaluated with different multivariate techniques.
The PCA was applied to the sediment samples using the Minitab 16 software. The data matrix was performed for the four locations: LC1, LC2, LC3, and LC4 (Sahil, Terice, Ayvacık and Pazar). The Pearson correlation coefficients were calculated for these samples at the 0.05 significance level, using the Minitab 16 software (Tables 2, 3, 4 and 5). These correlated variables were important in the PCA, as they reduced the number of the variables (Accornero et al., 2008).
The CA revealed different properties at the selection site with respect to physical and chemical variables. The five groups varied according to the natural background features. Additionally, the water quality measured at these sites appeared to be affected by different pollutant sources. A comprehensive pollution index was applied to further demonstrate the results of the CA.
4 AYDIN et al.
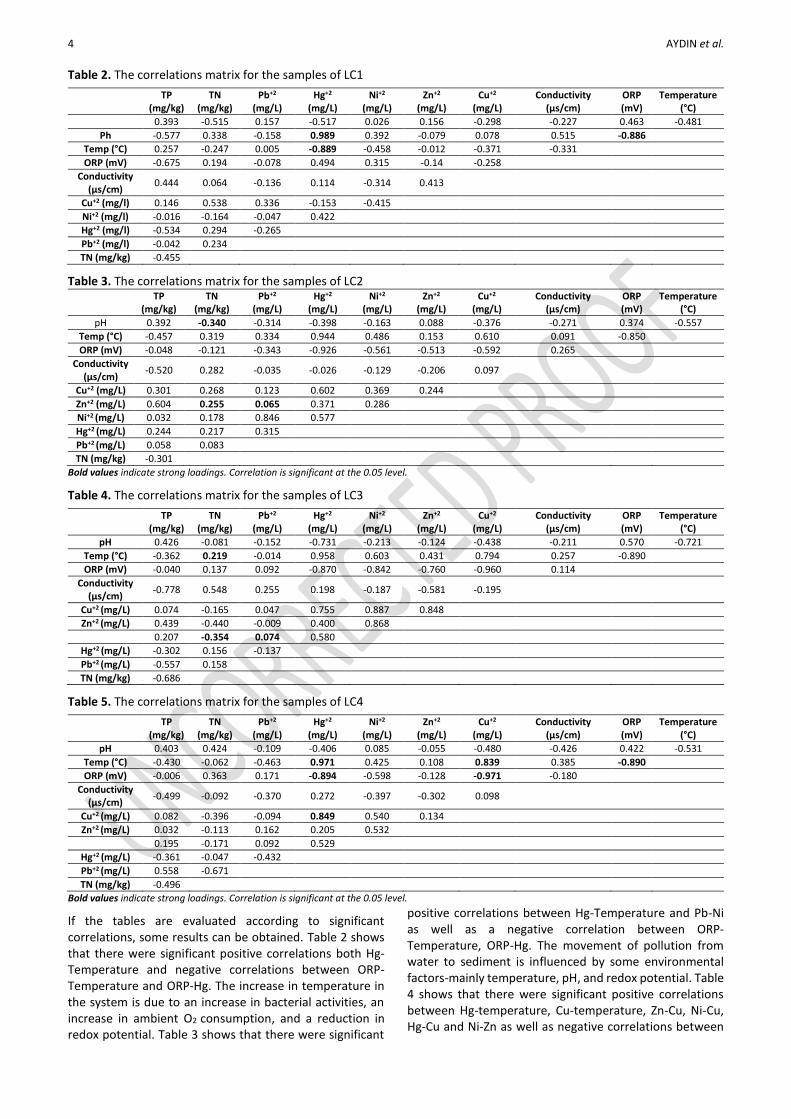
Table 2. The correlations matrix for the samples of LC1
Bold values indicate strong loadings. Correlation is significant at the 0.05 level.
If the tables are evaluated according to significant correlations, some results can be obtained. Table 2 shows that there were significant positive correlations both Hg-Temperature and negative correlations between ORP-Temperature and ORP-Hg. The increase in temperature in the system is due to an increase in bacterial activities, an increase in ambient O2 consumption, and a reduction in redox potential. Table 3 shows that there were significant
positive correlations between Hg-Temperature and Pb-Ni as well as a negative correlation between ORP-Temperature, ORP-Hg. The movement of pollution from water to sediment is influenced by some environmental factors-mainly temperature, pH, and redox potential. Table 4 shows that there were significant positive correlations between Hg-temperature, Cu-temperature, Zn-Cu, Ni-Cu, Hg-Cu and Ni-Zn as well as negative correlations between
EVALUATION OF THE ANTHROPOGENIC IMPACT IN SUAT UGURLU DAM LAKE 5
water temperature-pH, Hg-pH, ORP-temperature, Cu-ORP, Zn-ORP, Ni-ORP, Hg-ORP and TP-conductivity. According to these results, the lake's water temperatures showed a characteristic annual cycle, with higher values during the summer (22.0-27 °C) and lower values in the winter
(9.2-16 °C). The pH values varied between 6.2 and 8.2 within the limit range of 6-9. Table 5 shows that there were significant positive correlations between Hg-Temperature, Cu-Temperature and Hg-Cu as well as negative correlations between ORP-Temperature, Cu-ORP and Hg-ORP.
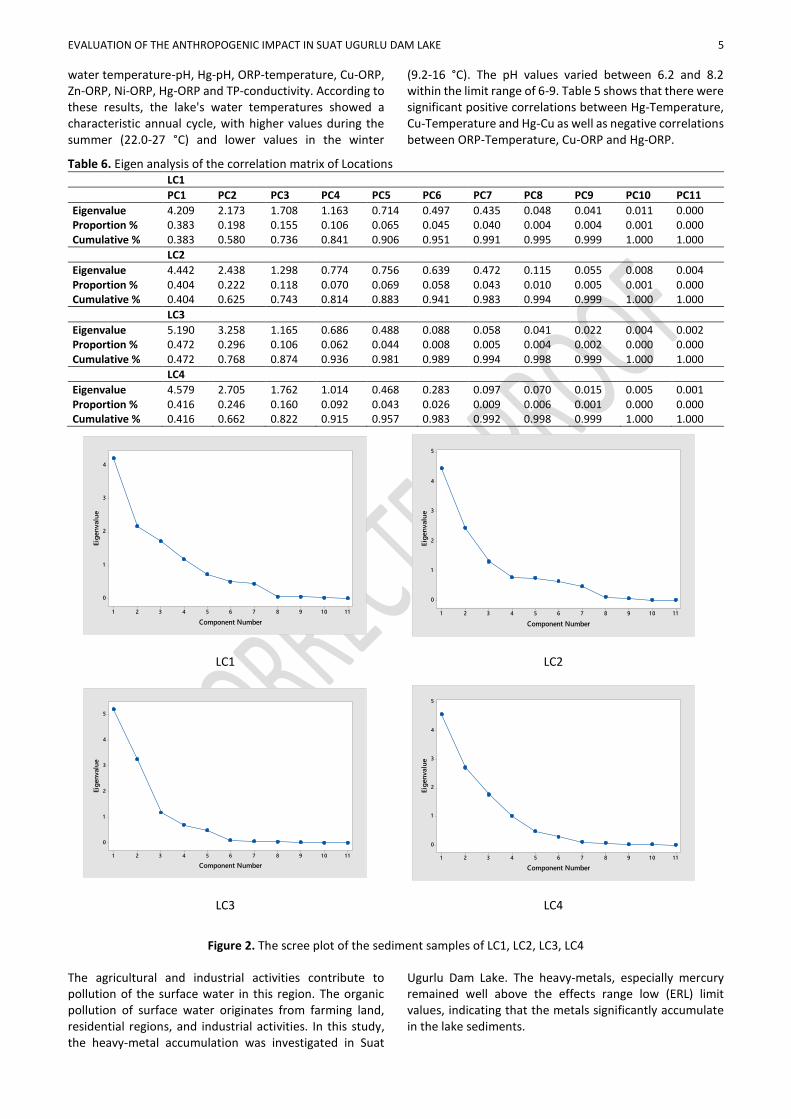
Table 6. Eigen analysis of the correlation matrix of Locations LC1
Figure 2. The scree plot of the sediment samples of LC1, LC2, LC3, LC4
The agricultural and industrial activities contribute to pollution of the surface water in this region. The organic pollution of surface water originates from farming land, residential regions, and industrial activities. In this study, the heavy-metal accumulation was investigated in Suat
Ugurlu Dam Lake. The heavy-metals, especially mercury remained well above the effects range low (ERL) limit values, indicating that the metals significantly accumulate in the lake sediments.
1 11 0987654321
4
3
2
1
0
Component Number
Eig
en
valu
e
1 11 0987654321
5
4
3
2
1
0
Component Number
Eig
en
valu
e
1 11 0987654321
5
4
3
2
1
0
Component Number
Eig
en
valu
e
1 11 0987654321
5
4
3
2
1
0
Component Number
Eig
en
valu
e
6 AYDIN et al.
The PCA was applied to the data matrix to divide it into the score and PCA matrices. The most common stopping rule in PCA is based on the average value of the eigenvalues (Jackson, 1993). Eigenvalues measure the amount of the variation explained by each PC and predict which will be largest for the first PC and smaller for subsequent PCs. An eigenvalue greater than 1 indicates that the PCs account for more variance than that accounted for by one of the original variables in the standardized data. This is commonly used as the cutoff point at which PCs are retained (URL2). The eigenvalues of the sediment samples are given in Tables 5, 6, 7, 8.
As shown in Table 6, the eigenvalues of the 4 components were greater than 1 for LC1 and LC4, the eigenvalues of the
3 components were greater than 1 for LC2 and LC3. In this case, the significant PCA numbers were taken as 4, 3, 3 and 4 for these locations, respectively. The significant components in the LCs can explain 84.1%, 74.4%, 87.4%, and 91.5% of the total variance. The scree plot of the components is also shown in the component’s number (Figure 2). For this study, the first part of the PCA matrix is given in Table 7 for principal components. The temperature, Hg, and ORP have higher effects than the other variables in first component of LC1. The similarity results were obtained in LC2 and LC4 for the first component. The first component of LC3 includes the affected ORP and Cu variables. Generally, conductivity, Zn, and TP have a higher effect than the other variables in the other components.
Table 7. PCAs of the sediment samples of locations LC1 LC2 LC3 LC4
Also, the CA is applied to the data matrix to determine the cluster of variables and observations as (a) and (b) according to Hierrarchical clustering using single linkage method and Euclidean distance measure. It is seen that the results of CA in Figure 3.
The results of the CA, according to the variables, are similar to the PCA's results. Under the 0.67% line, the results were the 6, 6, 5, and 5 clusters in LC1, LC2, LC3, and LC4. The results of the CA showed that there is a seasonal similarity. Generally, January, February and December; September, October and November; March, April and May; and June, July and August are grouped in the results.
The sediment samples taken from 4 locations in a year were analyzed, and the concentrations of the heavy metals-such as Hg, Ni, Zn, Cu, and Pb- were determined; the Hg concentration was very high. The most important pollutant sources of the lake are the uncontrolled discharges, of the wastewater treatment facilities. This clearly indicates that the lake is affected by anthropogenic pollutants. In addition, drugs and fertilizers used in agricultural activities around the lake cause pollution and disrupt the sustainable structure of the lake.
According to the evaluations made, seasonal factors, industrial discharges, and agricultural activities seem to be the main contributing to the lake's pollution. To secure the water quality of the lake, regular monitoring should be done and uncontrolled discharges should be avoided. Moreover, care must be taken to control all the other pollution sources, which degrade the water quality and adversely affect the water and the environmental quality.
Conclusion
In this study, LC1, LC4 the first four components were sufficient, the other locations the first their components was sufficient to explain the data. This can be explained by the total variance of the original data set and the eigenvalues of these components which were greater than 1. Some variables had a greater value after the analysis of these components. The CA gave nearly the same result. Also, the CA was made for observation, and it found seasonal similarities. Measures should be taken to reduce anthropogenic interventions in the dam lake; this is necessary in order to avoid high levels of pollution, which adversely influences public health and the environment. These results must be taken into serious consideration for the future planning and management of the dam lake.
EVALUATION OF THE ANTHROPOGENIC IMPACT IN SUAT UGURLU DAM LAKE 7
LC1 (a) LC1(b)
LC2 (a) LC2 (b)
LC3 (a) LC3 (b)
LC4 (a) LC4 (b)
Figure 3. The CA results for variables and observations
References
Accornero A., Gnerre R. and Manfra L. (2008), Sediment
concentrations of trace metals in the Berre lagoon (France):
an assessment of contamination, Arch. Environ. Contam.
Toxicol., 54, 372–385.
Adams W.J., Kimerle R.A. and Barnett Jr. J.W. (1992), Sediment
quality and aquatic life assessment, Environ. Sci. Technol.,
26(10), 1864–1875
APHA (2017), Standard Methods for the Examination of Water
and Wastewater, 23rd Edition American Public Health