43
Impact Evaluation of the Rwanda Community Performance-Based Financing Program College of Medicine and Health Sciences School of Public Health
| Date post: | 12-Apr-2017 |
| Category: |
Healthcare |
| Upload: | rbfhealth |
| View: | 94 times |
| Download: | 1 times |

Impact Evaluation of the Rwanda Community Performance-Based
Financing Program
College of Medicine and Health Sciences School of Public Health
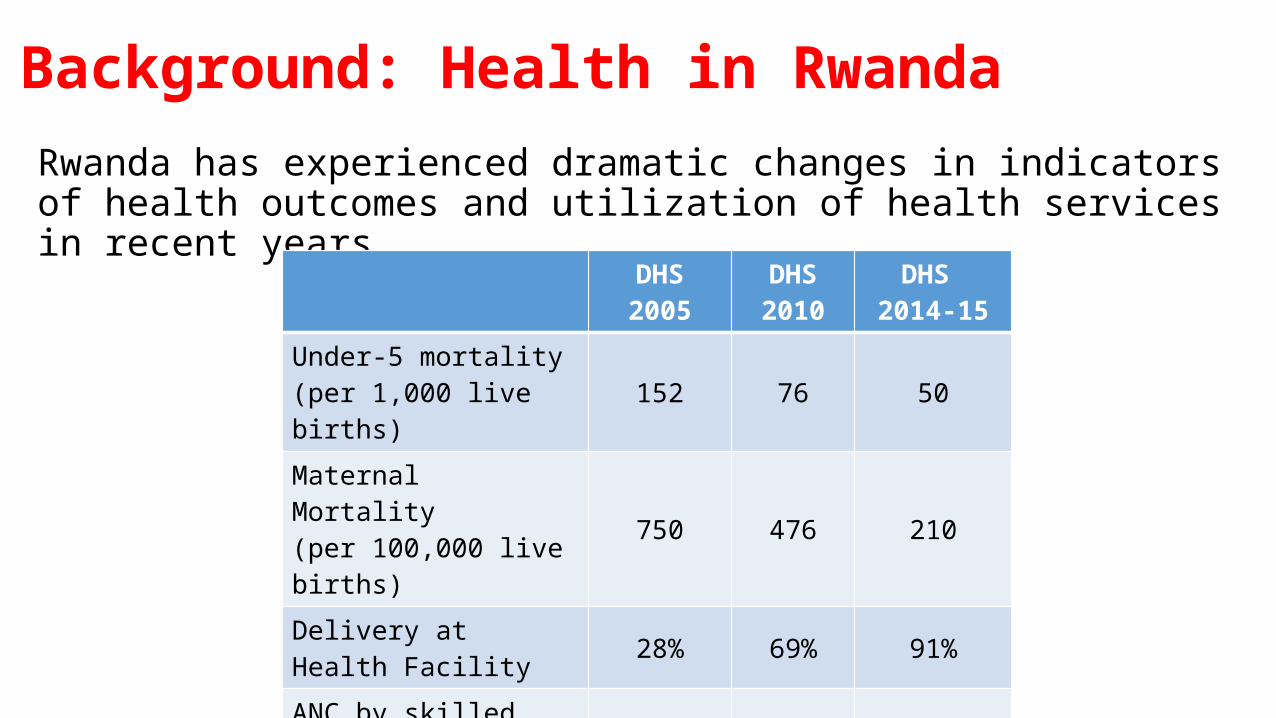
Background: Health in RwandaRwanda has experienced dramatic changes in indicators of health outcomes and utilization of health services in recent years
DHS 2005 DHS 2010
DHS 2014-15
Under-5 mortality(per 1,000 live births) 152 76 50
Maternal Mortality(per 100,000 live births) 750 476 210
Delivery at Health Facility 28% 69% 91%ANC by skilled provider 94% 98% 99.8%Total Fertility Rate 6.1 4.6 4.2
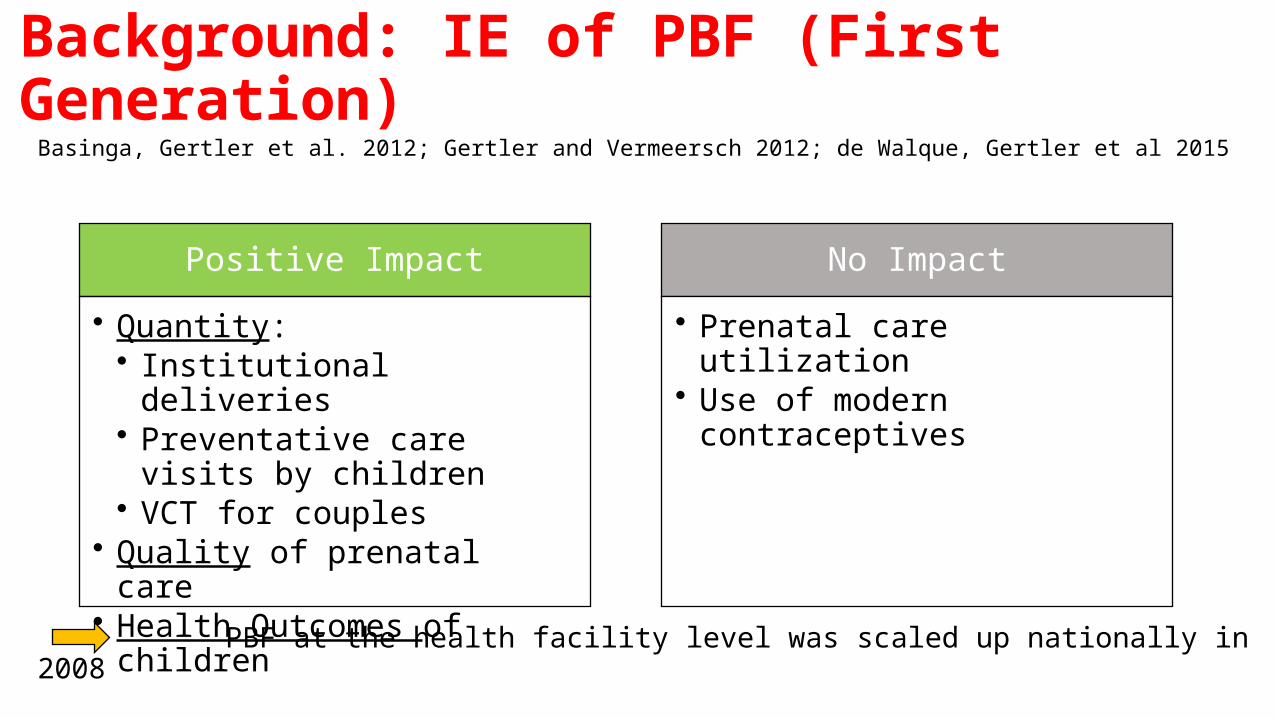
Background: IE of PBF (First Generation)
Basinga, Gertler et al. 2012; Gertler and Vermeersch 2012; de Walque, Gertler et al 2015
PBF at the health facility level was scaled up nationally in 2008
Positive Impact
• Quantity:• Institutional deliveries• Preventative care visits by
children• VCT for couples
• Quality of prenatal care• Health Outcomes of children
No Impact
• Prenatal care utilization• Use of modern contraceptives
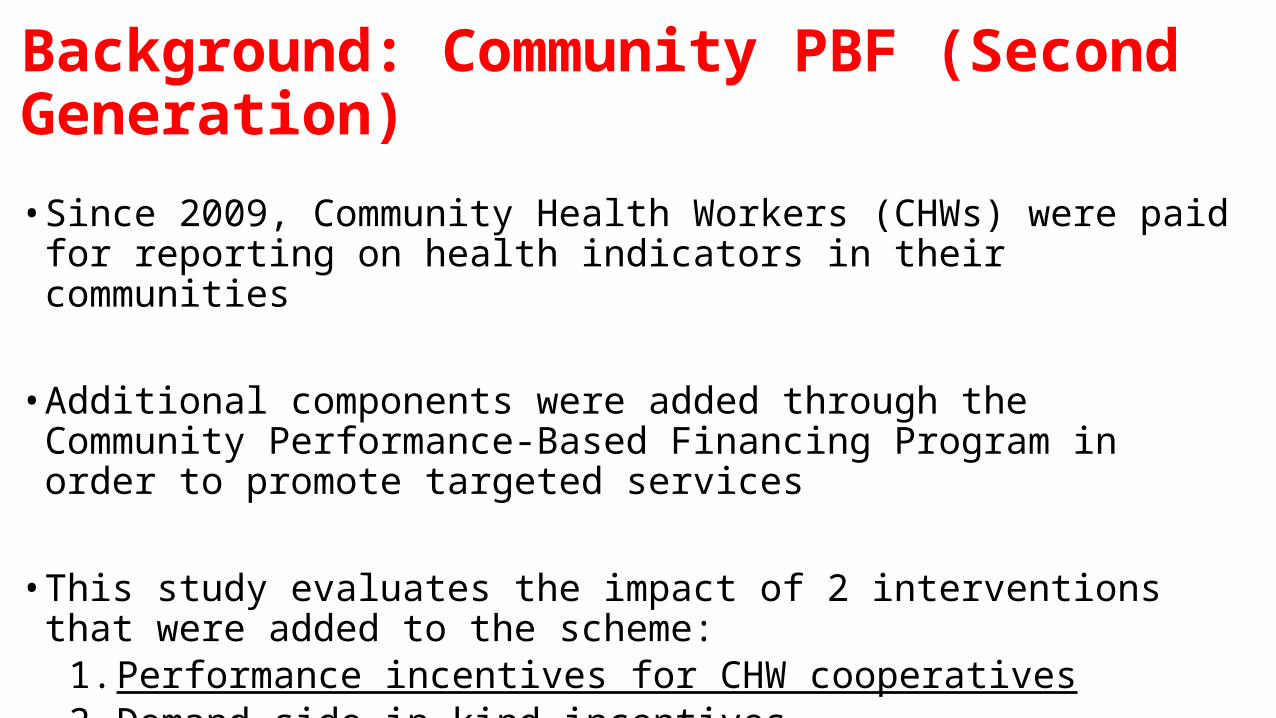
Background: Community PBF (Second Generation)• Since 2009, Community Health Workers (CHWs) were paid for reporting on
health indicators in their communities
• Additional components were added through the Community Performance-Based Financing Program in order to promote targeted services
• This study evaluates the impact of 2 interventions that were added to the scheme:
1. Performance incentives for CHW cooperatives2. Demand-side in-kind incentives

Background: organization of CHWs in RwandaEach village has 3 volunteers serving as Community Health Workers (CHWs).
Multidisciplinary CHWs
CHW in Charge of Maternal and
Neonatal Health
Criteria• Can read and
write• Age 20-50• Lives in the
village• Elected by the
village residents
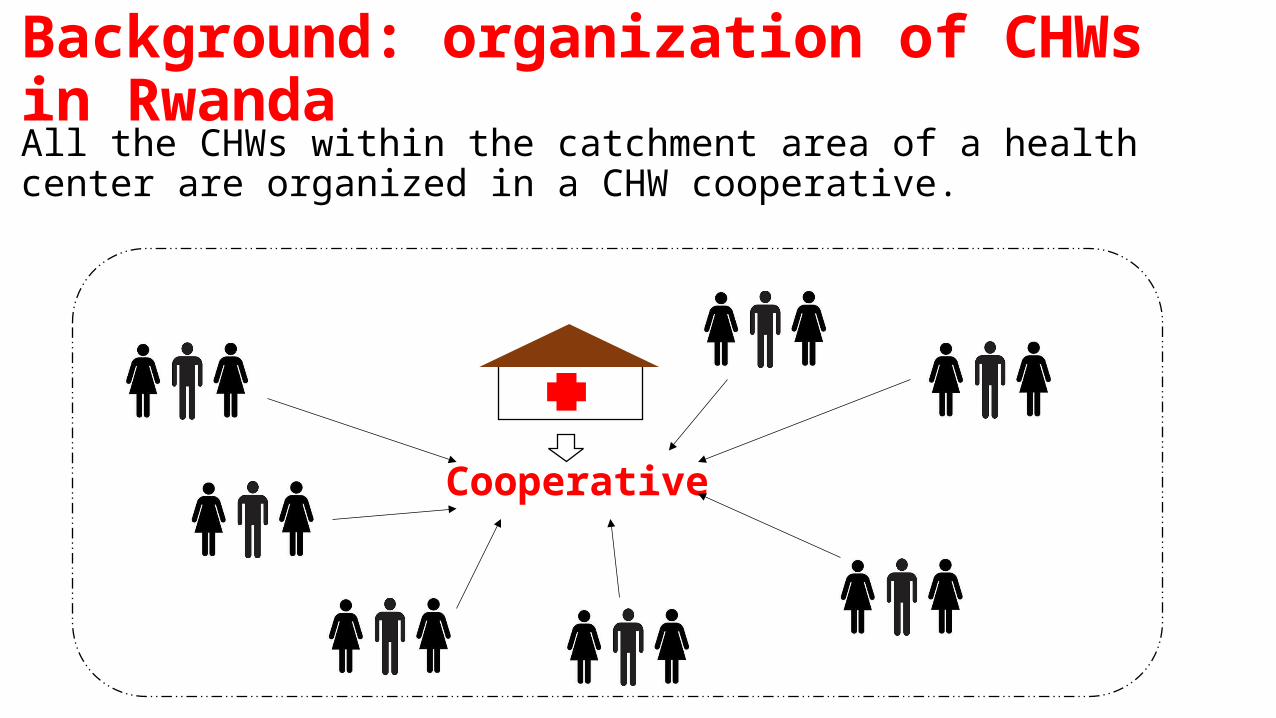
Background: organization of CHWs in RwandaAll the CHWs within the catchment area of a health center are organized in a CHW cooperative.
Cooperative
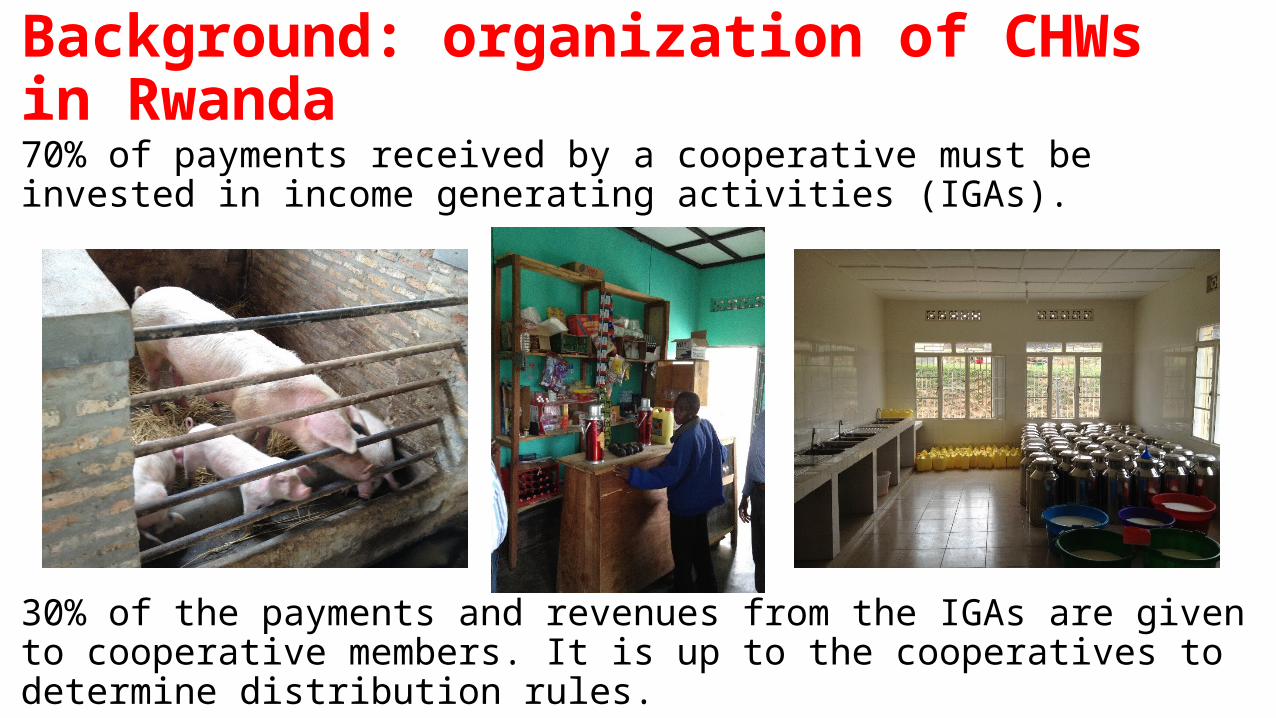
Background: organization of CHWs in Rwanda70% of payments received by a cooperative must be invested in income generating activities (IGAs).
30% of the payments and revenues from the IGAs are given to cooperative members. It is up to the cooperatives to determine distribution rules.

Intervention #1: Performance Incentives for CHW CooperativesCHW cooperatives received financial rewards for:1. Nutrition monitoring: # children 6-59 months monitored2. Timely Antenatal Care: # of women accompanied/referred within first 4 months
of pregnancy3. In-Facility Delivery: # of women accompanied/referred for assisted delivery 4. New Family Planning users: # referred to health center5. Regular Family Planning Users: # regular users at health center
• 4 indicators related to TB and HIV were added at a later stage and not evaluated
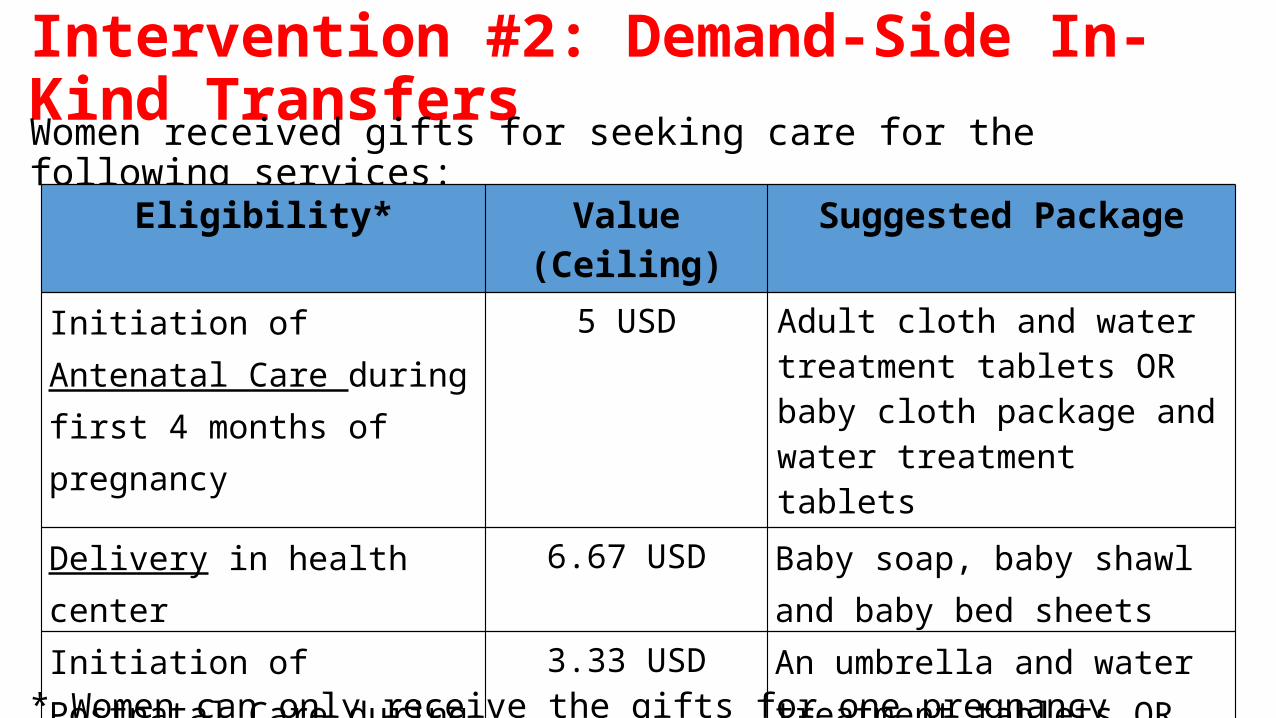
Intervention #2: Demand-Side In-Kind TransfersWomen received gifts for seeking care for the following services:
* Women can only receive the gifts for one pregnancy every 3 years.
Eligibility* Value (Ceiling) Suggested Package
Initiation of Antenatal Care during first 4 months of pregnancy
5 USD Adult cloth and water treatment tablets OR baby cloth package and water treatment tablets
Delivery in health center 6.67 USD Baby soap, baby shawl and baby bed sheets
Initiation of Postnatal Care during the 10 days after delivery
3.33 USD An umbrella and water treatment tablets OR Adult cloths

Research Questions1. Do the demand-side in-kind transfers and the performance incentives to
CHW coops increase• Initiation of prenatal care within first 4 months of pregnancies?• Total prenatal care visit?• In-facility deliveries?• Rate of postnatal care within 10 days after delivery?
2. Is there a multiplicative effect when both interventions are implemented?
3. Do the performance incentives to CHW coops affect• Behavior and motivation of the CHWs?• Use of modern contraceptives?• Growth monitoring of children under 5
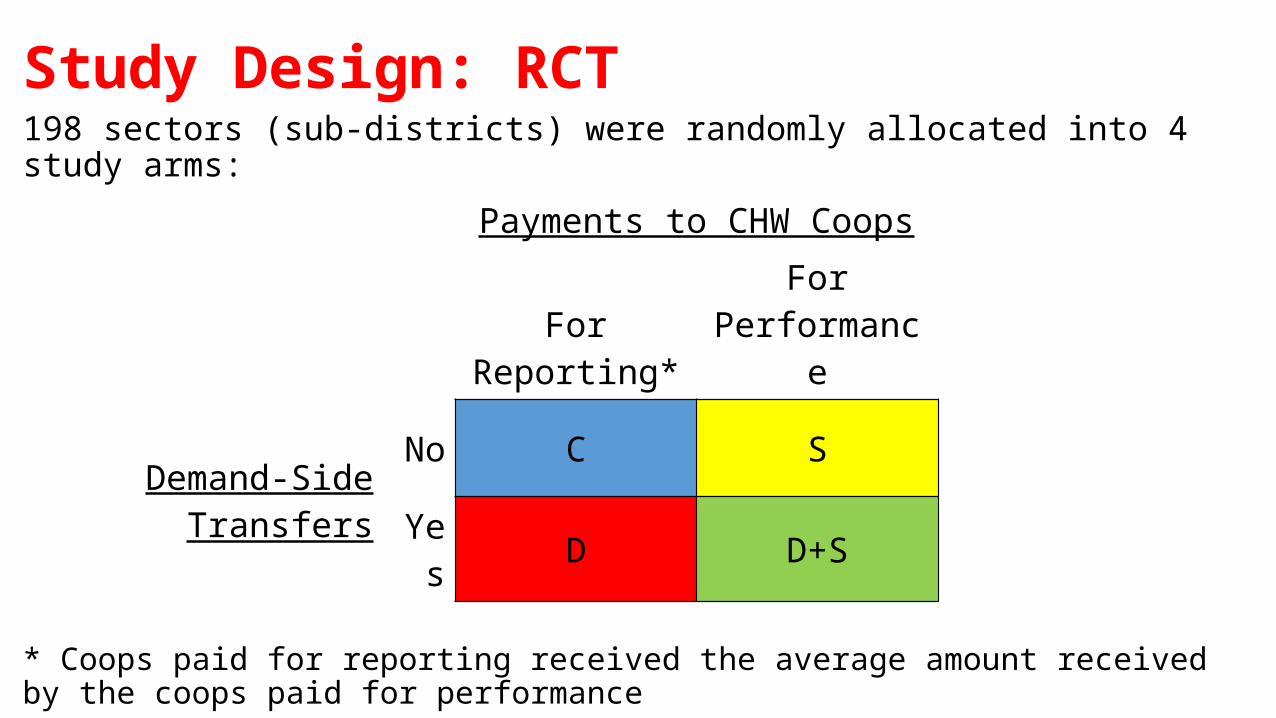
Study Design: RCT 198 sectors (sub-districts) were randomly allocated into 4 study arms:
* Coops paid for reporting received the average amount received by the coops paid for performance
Payments to CHW Coops
For Reporting*For
Performance
Demand-Side TransfersNo C S
Yes D D+S
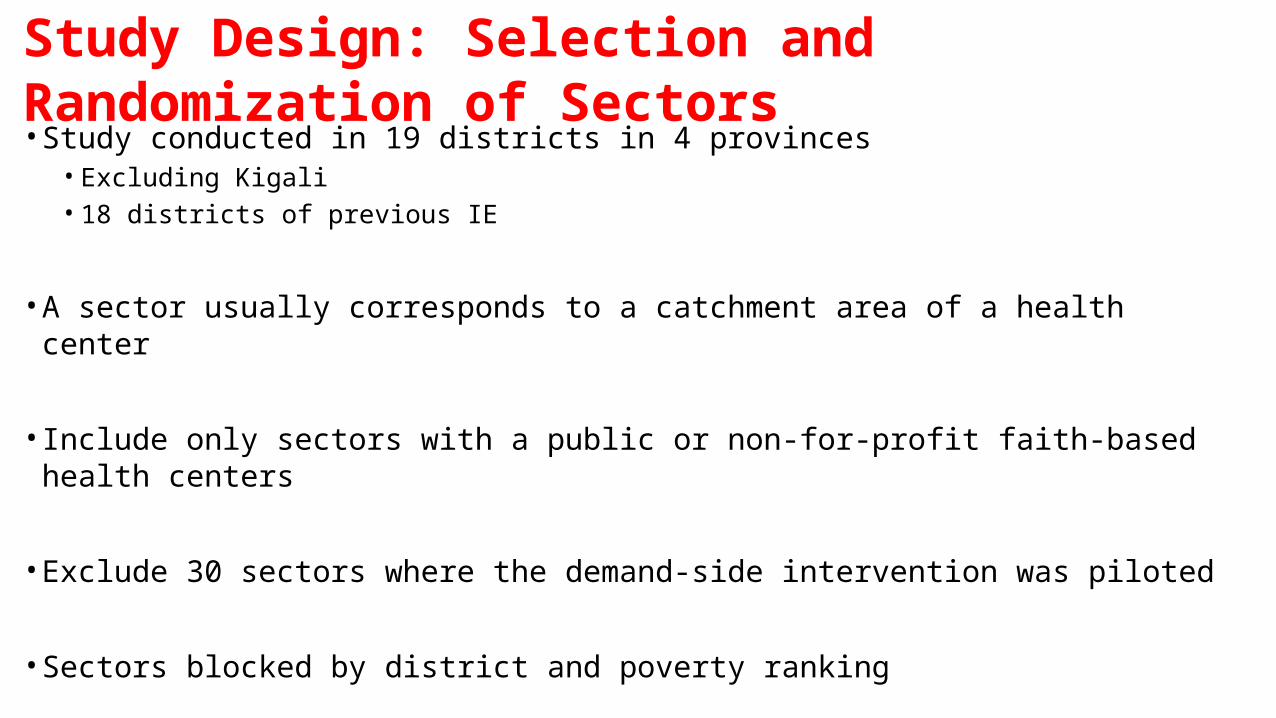
Study Design: Selection and Randomization of Sectors• Study conducted in 19 districts in 4 provinces
• Excluding Kigali• 18 districts of previous IE
• A sector usually corresponds to a catchment area of a health center
• Include only sectors with a public or non-for-profit faith-based health centers
• Exclude 30 sectors where the demand-side intervention was piloted
• Sectors blocked by district and poverty ranking

Study Design: Randomization of Sectors
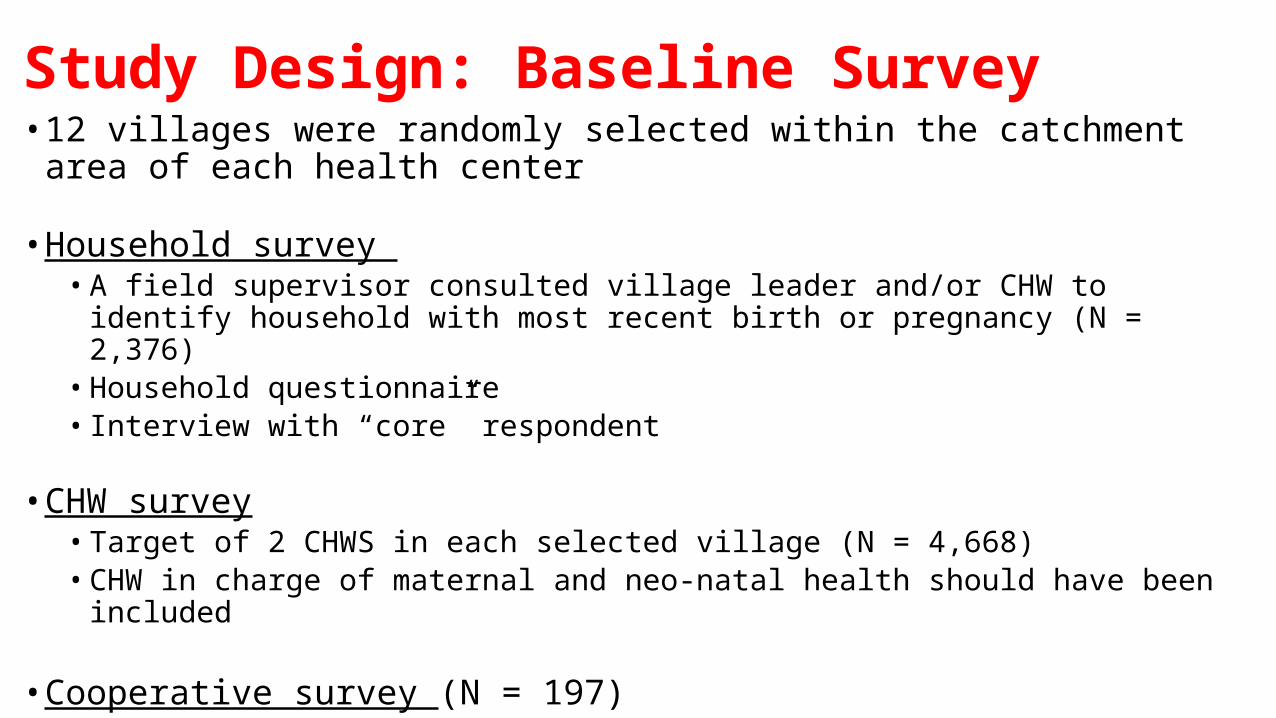
Study Design: Baseline Survey• 12 villages were randomly selected within the catchment area of each health
center
• Household survey • A field supervisor consulted village leader and/or CHW to identify household with most
recent birth or pregnancy (N = 2,376)• Household questionnaire• Interview with “core” respondent
• CHW survey• Target of 2 CHWS in each selected village (N = 4,668)• CHW in charge of maternal and neo-natal health should have been included
• Cooperative survey (N = 197)
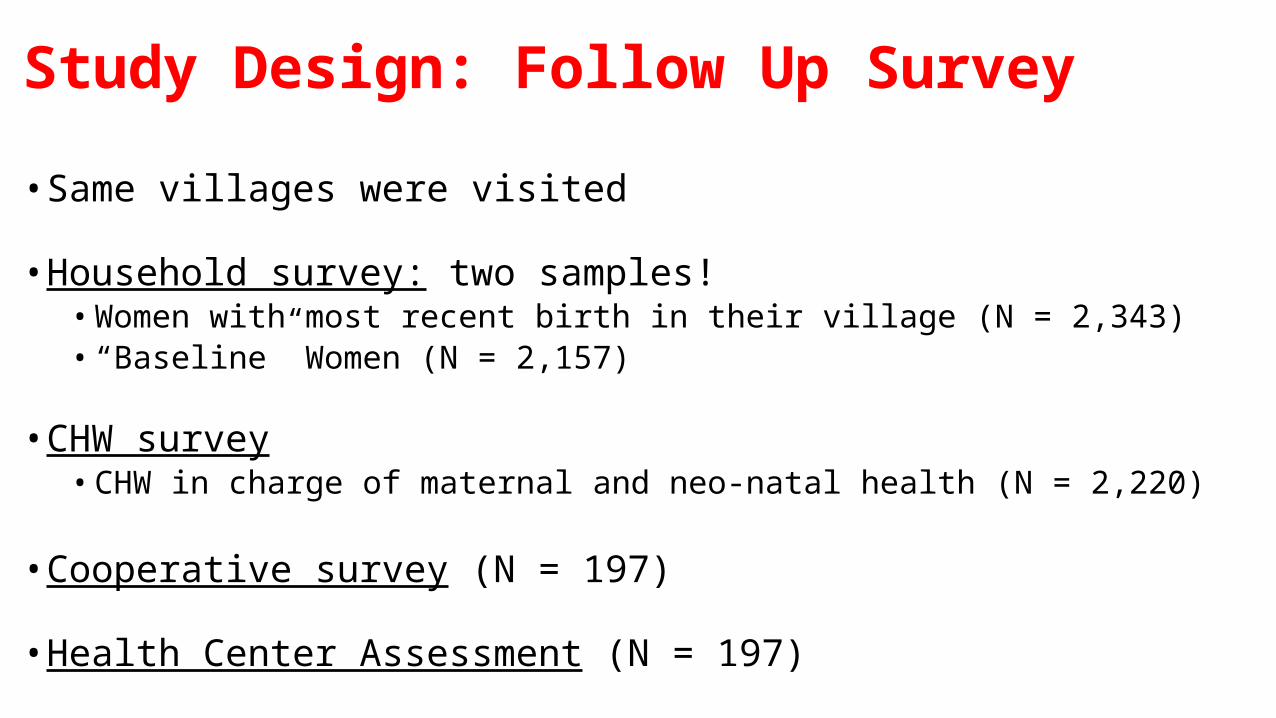
Study Design: Follow Up Survey• Same villages were visited
• Household survey: two samples!• Women with most recent birth in their village (N = 2,343)• “Baseline” Women (N = 2,157)
• CHW survey• CHW in charge of maternal and neo-natal health (N = 2,220)
• Cooperative survey (N = 197)
• Health Center Assessment (N = 197)

Timeline
2010
2011
2012
2013
2014
February-May 2010
•Baseline Survey
November 2013-June 2014
• Follow-up Survey
October 2010
•Interventions Introduced
February 2013
•Last transfer of funds for in-kind transfers
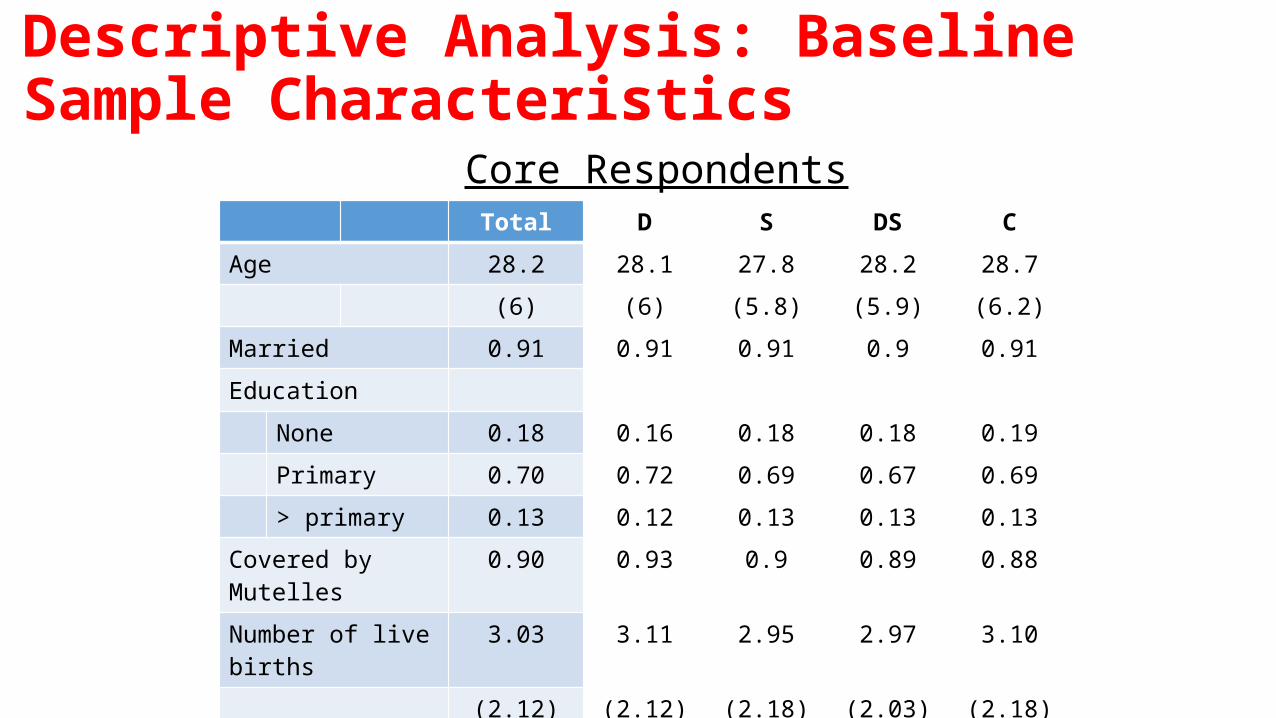
Descriptive Analysis: Baseline Sample Characteristics
Total D S DS C
Age 28.2 28.1 27.8 28.2 28.7
(6) (6) (5.8) (5.9) (6.2)
Married 0.91 0.91 0.91 0.9 0.91
Education
None 0.18 0.16 0.18 0.18 0.19
Primary 0.70 0.72 0.69 0.67 0.69
> primary 0.13 0.12 0.13 0.13 0.13
Covered by Mutelles 0.90 0.93 0.9 0.89 0.88
Number of live births 3.03 3.11 2.95 2.97 3.10
(2.12) (2.12) (2.18) (2.03) (2.18)
Ever used modern FP 0.4 0.4 0.37 0.41 0.41
Core Respondents
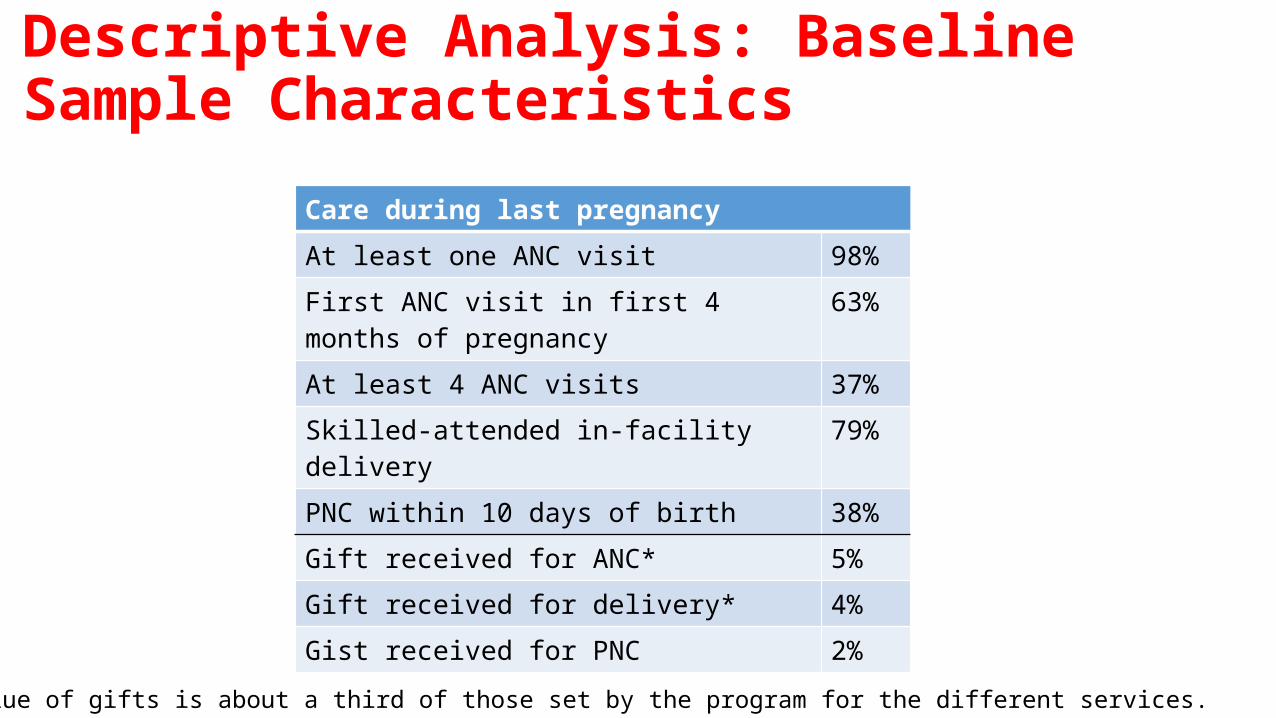
Descriptive Analysis: Baseline Sample Characteristics
Care during last pregnancyAt least one ANC visit 98%First ANC visit in first 4 months of pregnancy 63%At least 4 ANC visits 37%Skilled-attended in-facility delivery 79%PNC within 10 days of birth 38%Gift received for ANC* 5%Gift received for delivery* 4%Gist received for PNC 2%
*The reported value of gifts is about a third of those set by the program for the different services.
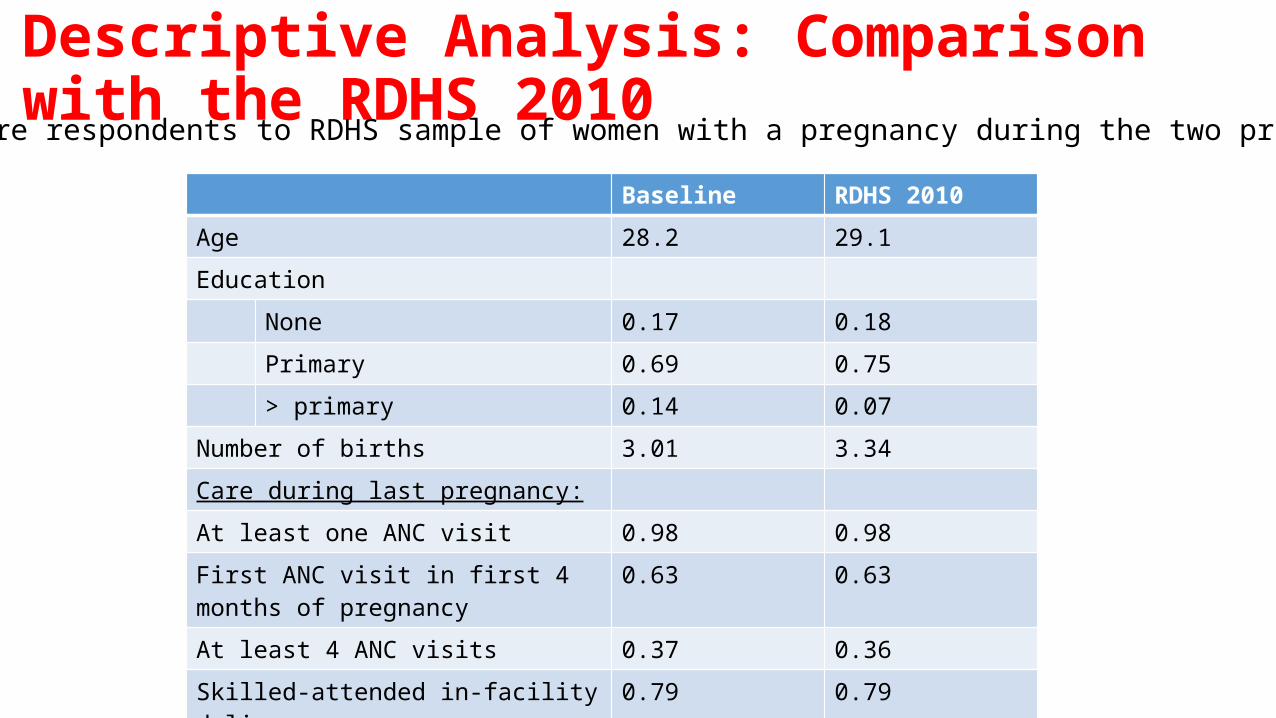
Descriptive Analysis: Comparison with the RDHS 2010
Baseline RDHS 2010
Age 28.2 29.1
Education
None 0.17 0.18
Primary 0.69 0.75
> primary 0.14 0.07
Number of births 3.01 3.34
Care during last pregnancy:
At least one ANC visit 0.98 0.98
First ANC visit in first 4 months of pregnancy
0.63 0.63
At least 4 ANC visits 0.37 0.36
Skilled-attended in-facility delivery 0.79 0.79
PNC within 10 days of birth 0.38 0.18
Comparing core respondents to RDHS sample of women with a pregnancy during the two previous years
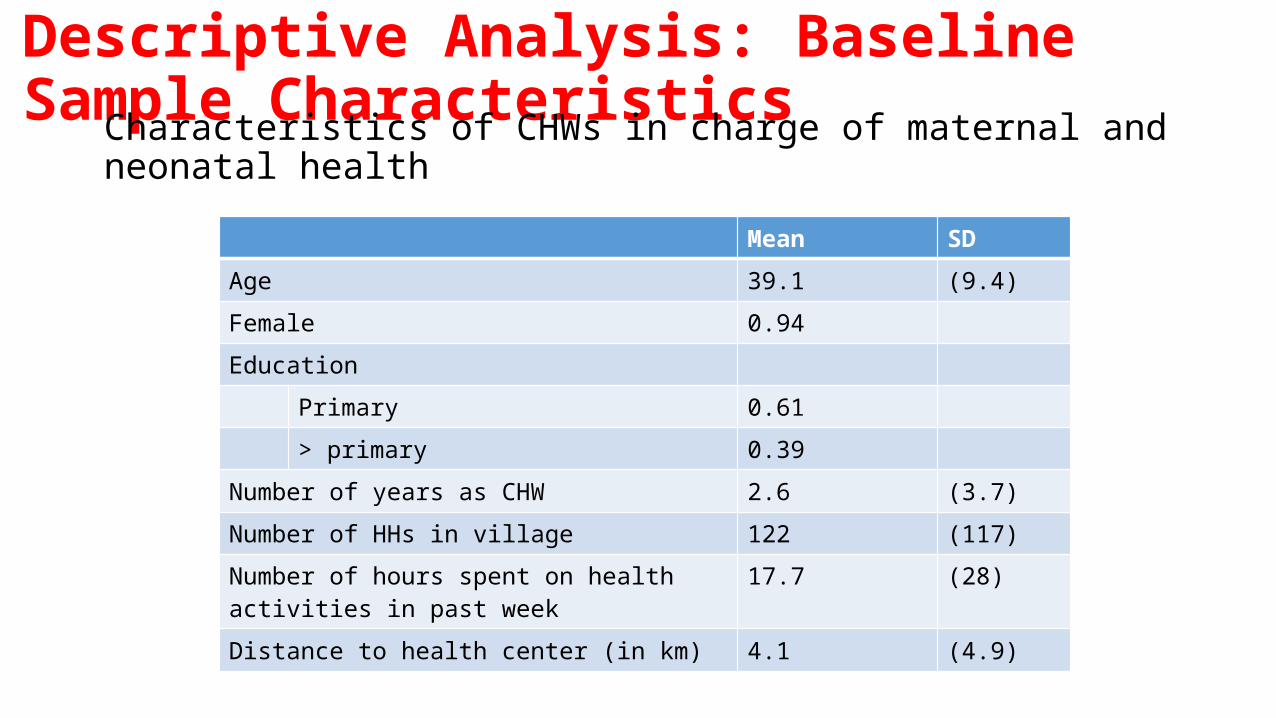
Descriptive Analysis: Baseline Sample CharacteristicsCharacteristics of CHWs in charge of maternal and
neonatal health Mean SD
Age 39.1 (9.4)
Female 0.94
Education
Primary 0.61
> primary 0.39
Number of years as CHW 2.6 (3.7)
Number of HHs in village 122 (117)
Number of hours spent on health activities in past week
17.7 (28)
Distance to health center (in km) 4.1 (4.9)
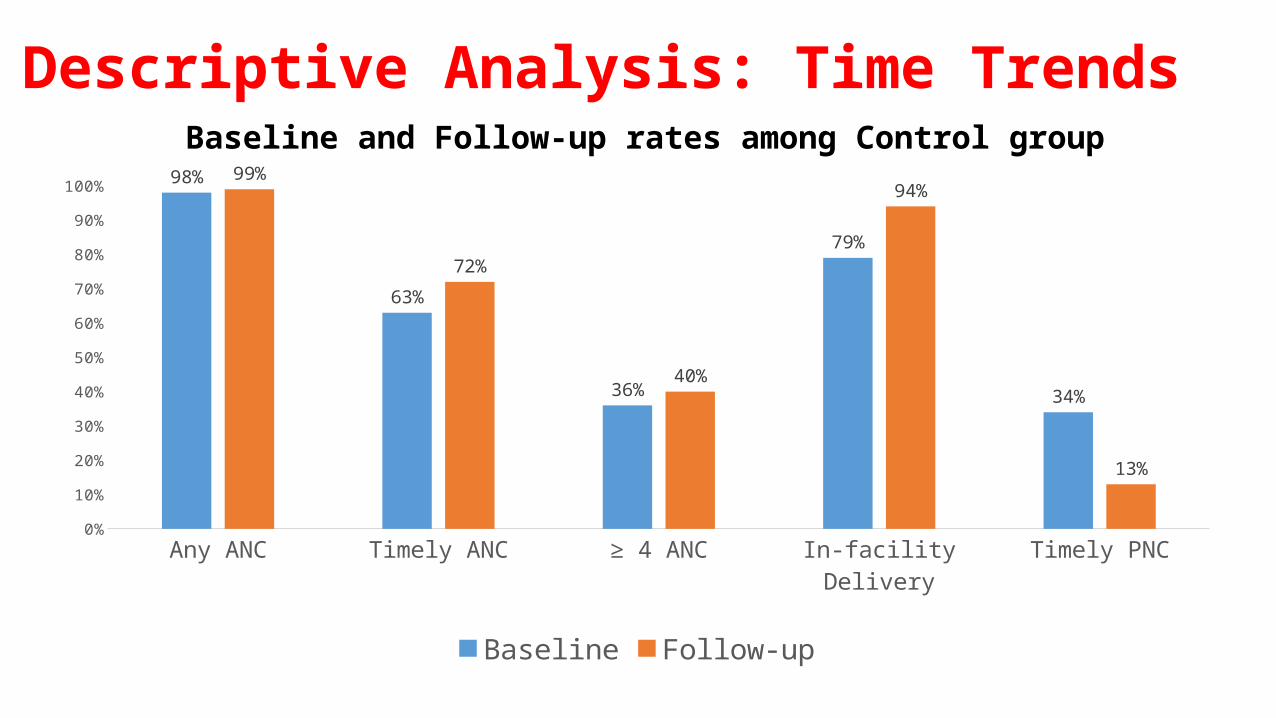
Descriptive Analysis: Time Trends
Any ANC Timely ANC ≥ 4 ANC In-facility Delivery Timely PNC0%
10%
20%
30%
40%
50%
60%
70%
80%
90%
100% 98%
63%
36%
79%
34%
99%
72%
40%
94%
13%
Baseline Follow-up
Baseline and Follow-up rates among Control group
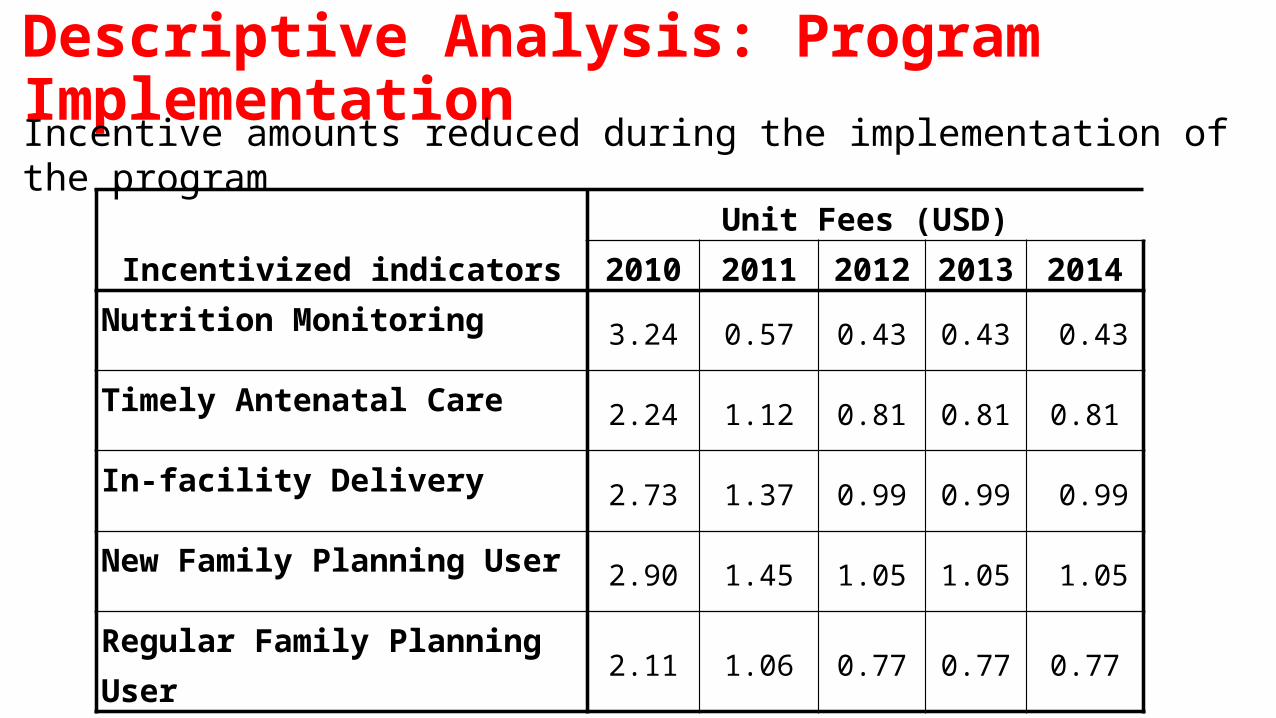
Descriptive Analysis: Program Implementation
Incentivized indicators Unit Fees (USD)
2010 2011 2012 2013 2014Nutrition Monitoring
3.24 0.57 0.43 0.43 0.43
Timely Antenatal Care2.24 1.12 0.81 0.81 0.81
In-facility Delivery2.73 1.37 0.99 0.99 0.99
New Family Planning User2.90 1.45 1.05 1.05 1.05
Regular Family Planning User2.11 1.06 0.77 0.77 0.77
Incentive amounts reduced during the implementation of the program
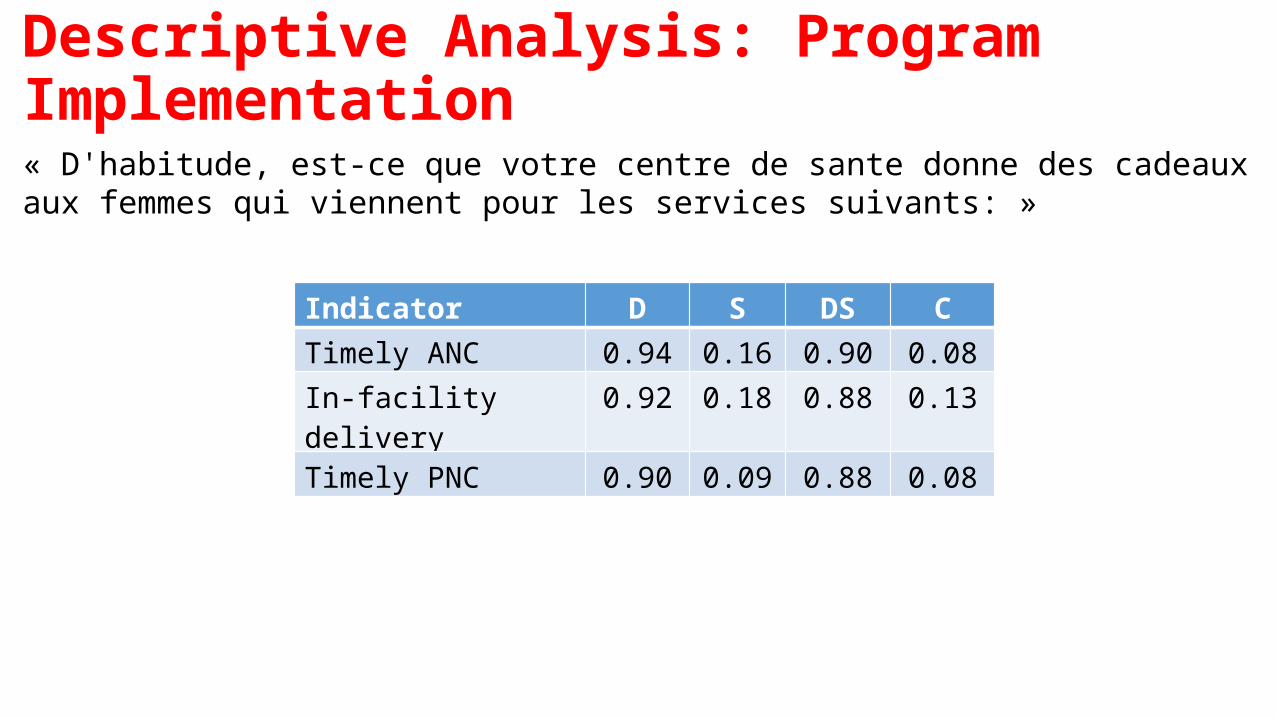
Descriptive Analysis: Program Implementation« D'habitude, est-ce que votre centre de sante donne des cadeaux aux femmes qui viennent pour les services suivants: »
Indicator D S DS CTimely ANC 0.94 0.16 0.90 0.08In-facility delivery 0.92 0.18 0.88 0.13Timely PNC 0.90 0.09 0.88 0.08
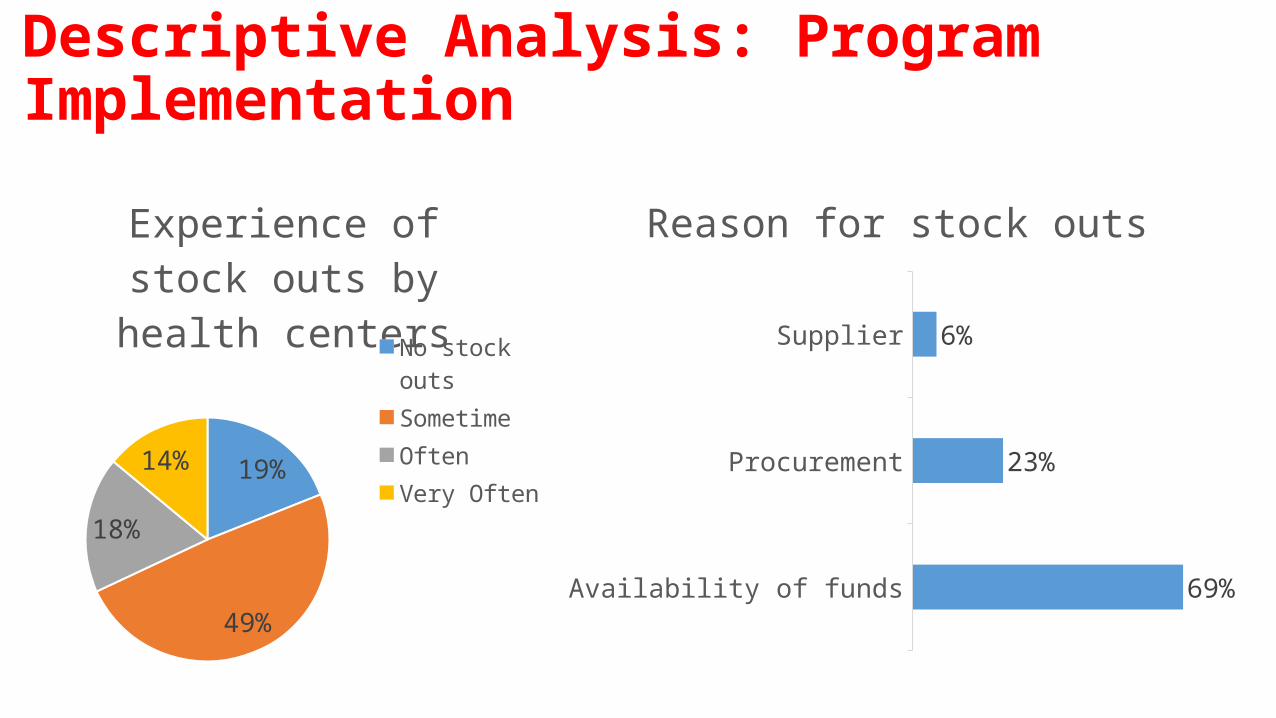
Descriptive Analysis: Program Implementation
19%
49%
18%
14%
Experience of stock outs by health centers
No stock outsSometimeOften Very Often
Availability of funds
Procurement
Supplier
69%
23%
6%
Reason for stock outs
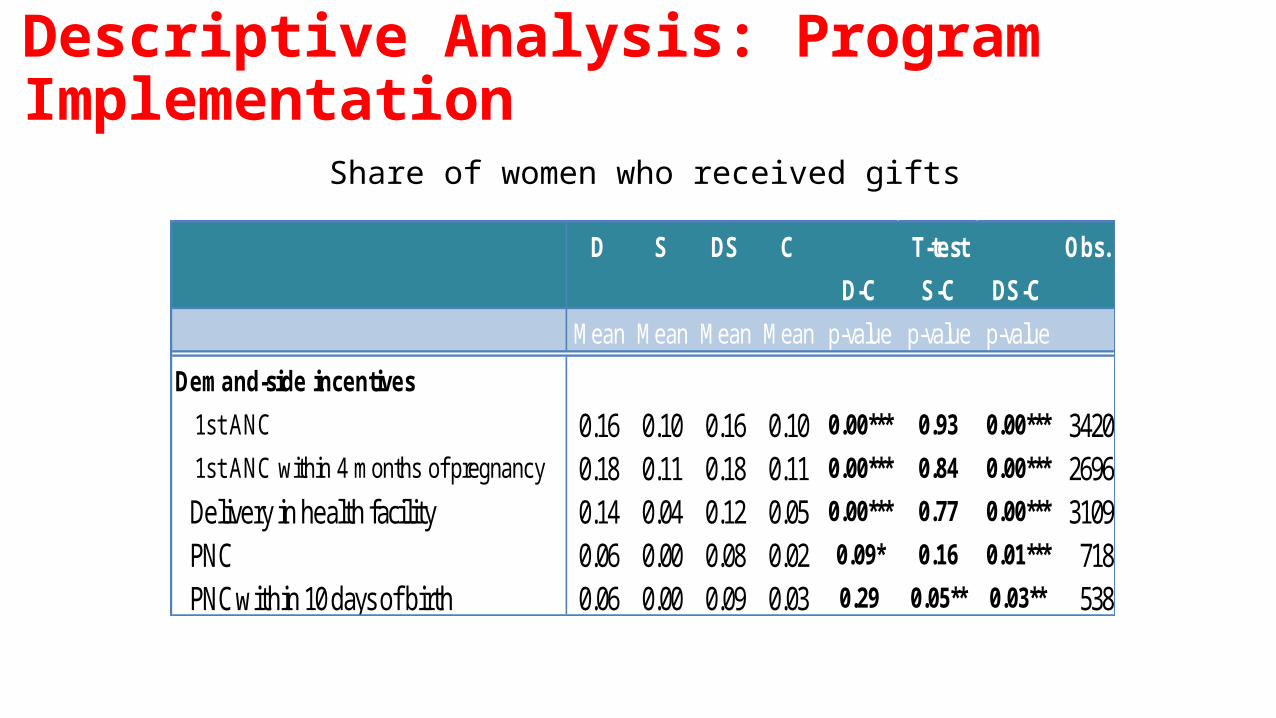
Descriptive Analysis: Program Implementation
D S DS C Obs.D-C S-C DS-C
Mean Mean Mean Mean p-value p-value p-value
Demand-side incentives 1st ANC 0.16 0.10 0.16 0.10 0.00*** 0.93 0.00*** 3420 1st ANC within 4 months of pregnancy 0.18 0.11 0.18 0.11 0.00*** 0.84 0.00*** 2696 Delivery in health facility 0.14 0.04 0.12 0.05 0.00*** 0.77 0.00*** 3109 PNC 0.06 0.00 0.08 0.02 0.09* 0.16 0.01*** 718 PNC within 10 days of birth 0.06 0.00 0.09 0.03 0.29 0.05** 0.03** 538
T-test
Share of women who received gifts
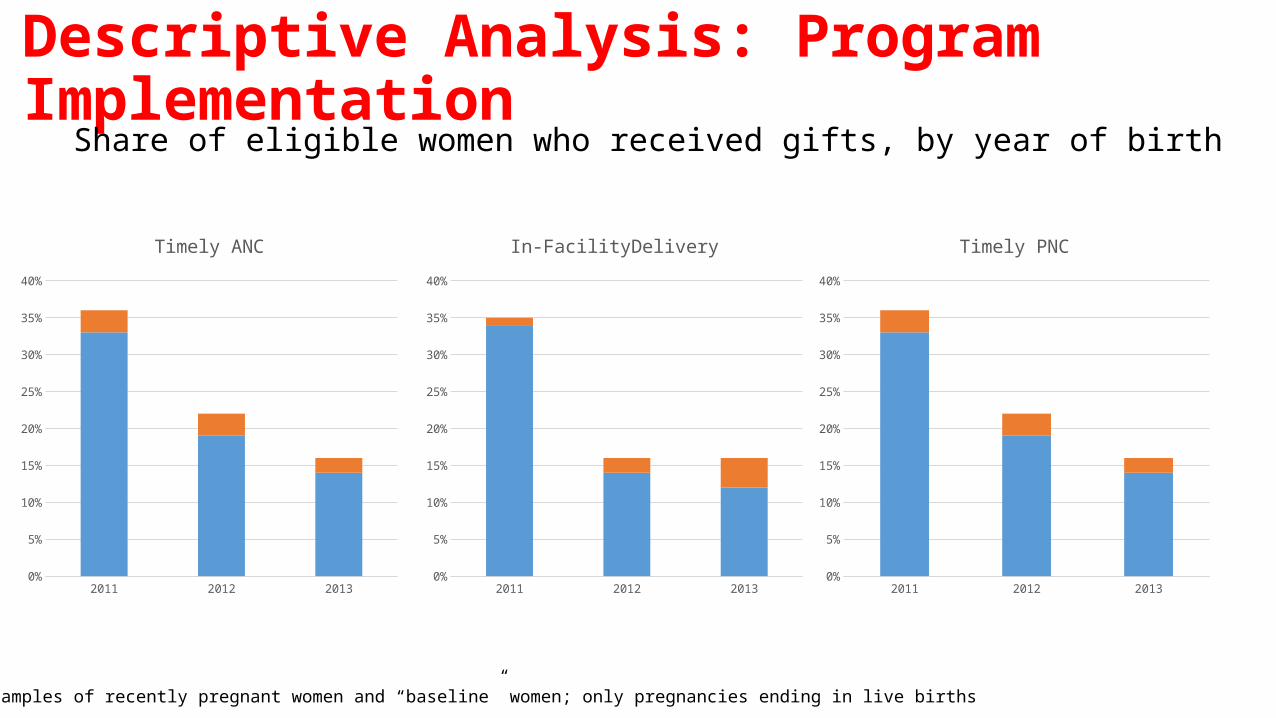
Descriptive Analysis: Program Implementation
Share of eligible women who received gifts, by year of birth
2011 2012 20130%
5%
10%
15%
20%
25%
30%
35%
40%
Timely ANC
2011 2012 20130%
5%
10%
15%
20%
25%
30%
35%
40%
In-FacilityDelivery
2011 2012 20130%
5%
10%
15%
20%
25%
30%
35%
40%
Timely PNC
* Combining samples of recently pregnant women and “baseline” women; only pregnancies ending in live births
Results: Maternal Health Services• Indicators:
• Timely ANC• In-facility deliveries• Timely PNC
• Sample of women with most recent birth in their village• Pregnancies resulting in a live birth
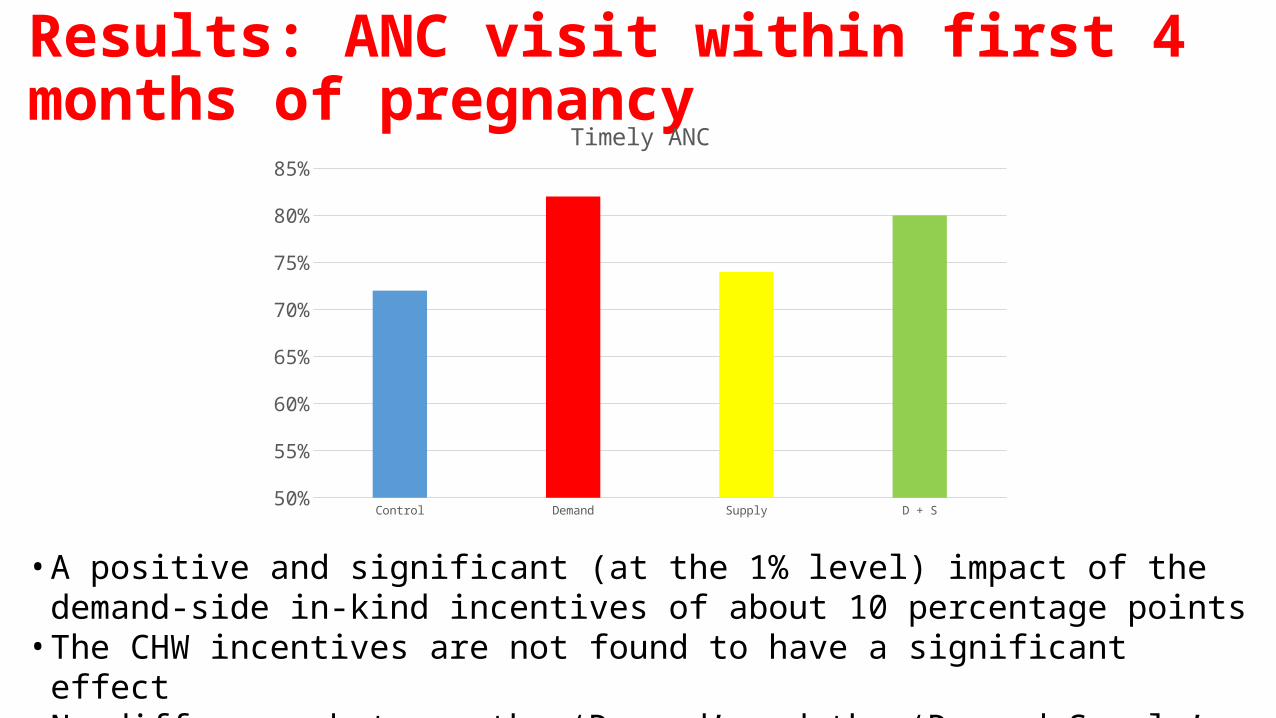
Results: ANC visit within first 4 months of pregnancy
• A positive and significant (at the 1% level) impact of the demand-side in-kind incentives of about 10 percentage points
• The CHW incentives are not found to have a significant effect• No difference between the ‘Demand’ and the ‘Demand+Supply’ treatment arms
Control Demand Supply D + S50%
55%
60%
65%
70%
75%
80%
85%
Timely ANC
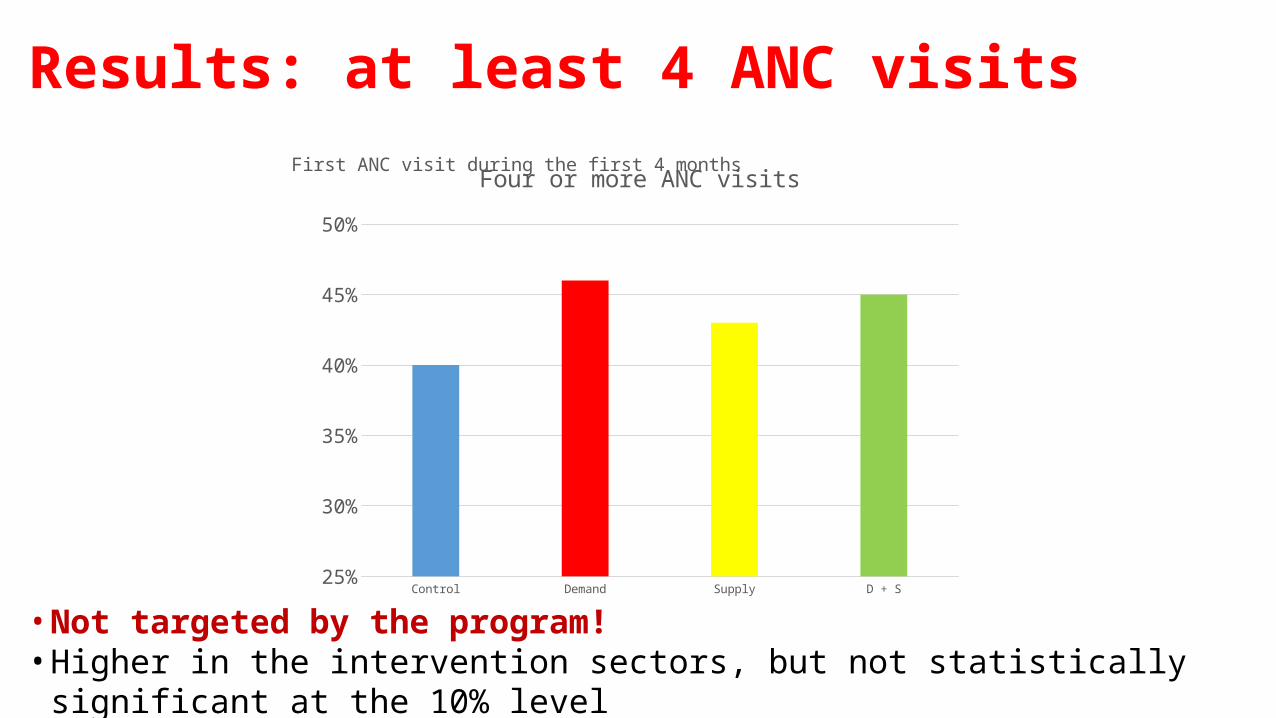
Results: at least 4 ANC visitsFirst ANC visit during the first 4 months
• Not targeted by the program!• Higher in the intervention sectors, but not statistically significant at the 10% level
Control Demand Supply D + S25%
30%
35%
40%
45%
50%
Four or more ANC visits
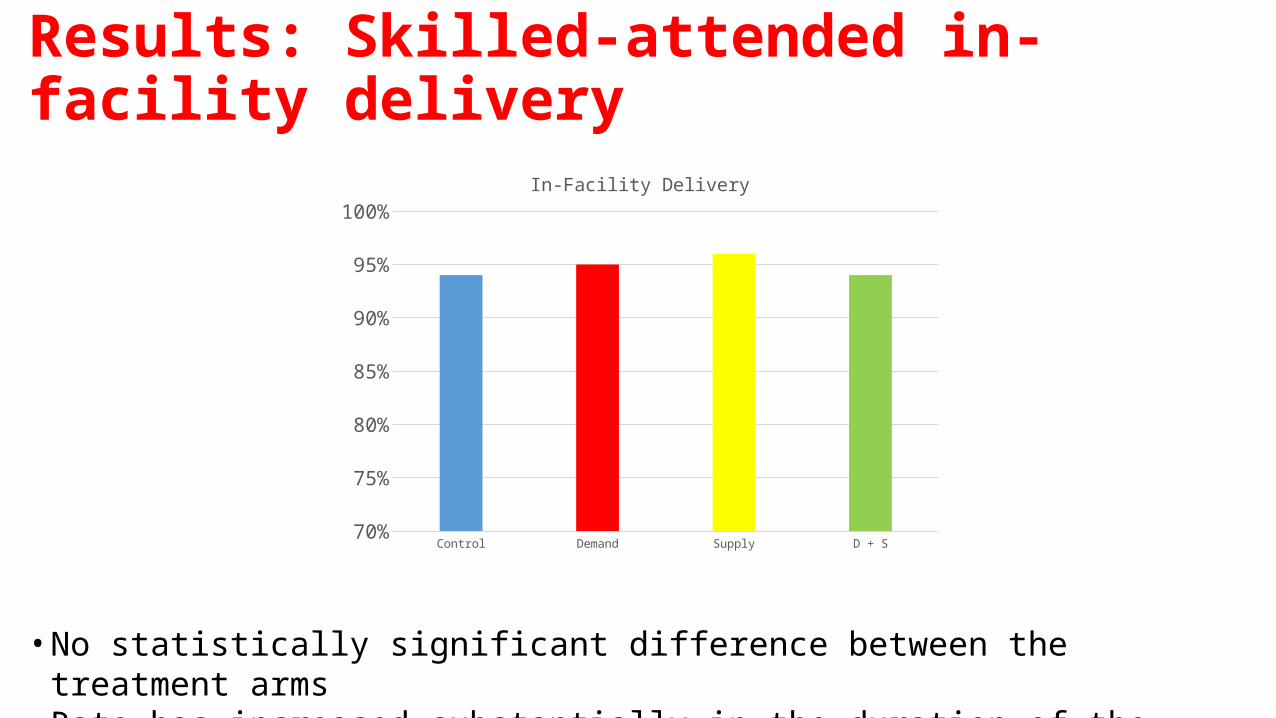
Results: Skilled-attended in-facility delivery
• No statistically significant difference between the treatment arms• Rate has increased substantially in the duration of the study for other reasons
Control Demand Supply D + S70%
75%
80%
85%
90%
95%
100%
In-Facility Delivery
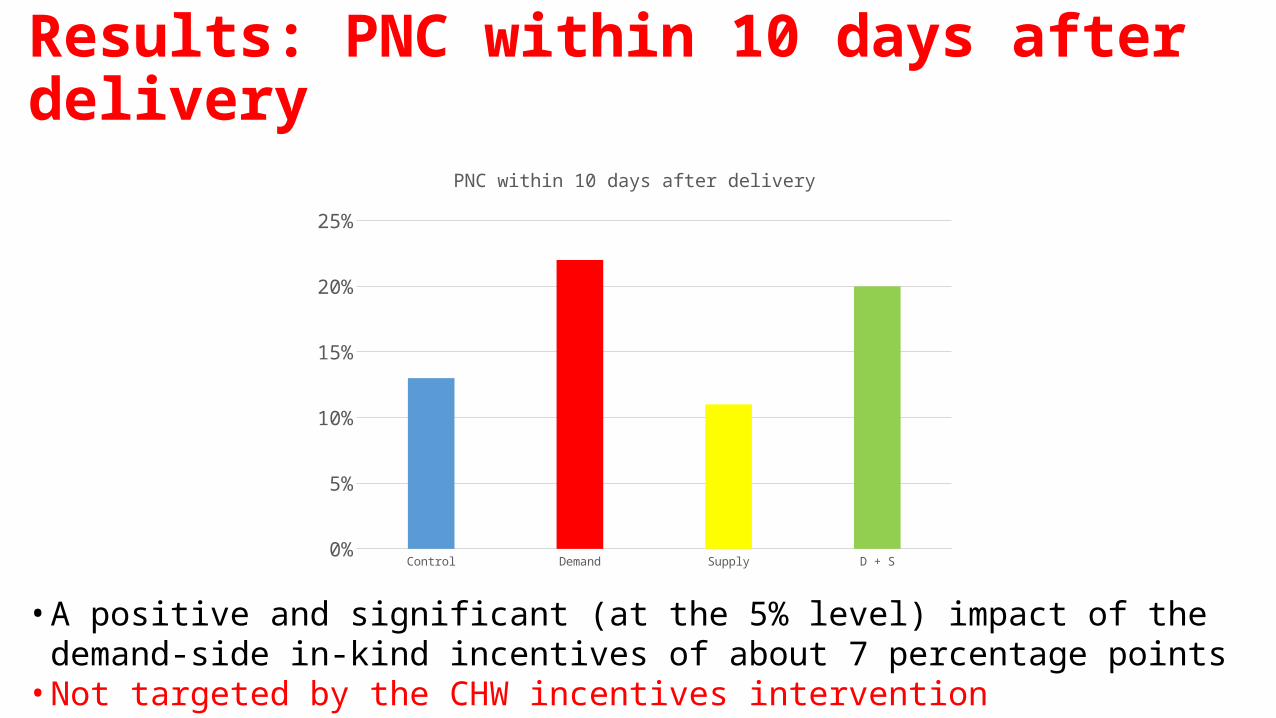
Results: PNC within 10 days after delivery
• A positive and significant (at the 5% level) impact of the demand-side in-kind incentives of about 7 percentage points
• Not targeted by the CHW incentives intervention
Control Demand Supply D + S0%
5%
10%
15%
20%
25%
PNC within 10 days after delivery
Results: targeted maternal health indicators• Results are robust
• Inclusion of controls• Diff-in-diff specification• Exclusion of 3 misclassified sectors
• Negligible changes when sample weights are used• Using data on number of households in each sector
Results: Fertility and Family Planning• Indicators
• Birth since baseline• Ever used modern family planning method
• With and without adjustment for baseline response
• Sample of baseline women• Caveat: not optimal for estimating this• Caveat: higher attrition among treatment groups implementing the supply-
side intervention
Results: Fertility and Family Planning
Control Demand Supply D + S0%
10%
20%
30%
40%
50%
60%
70%
80%
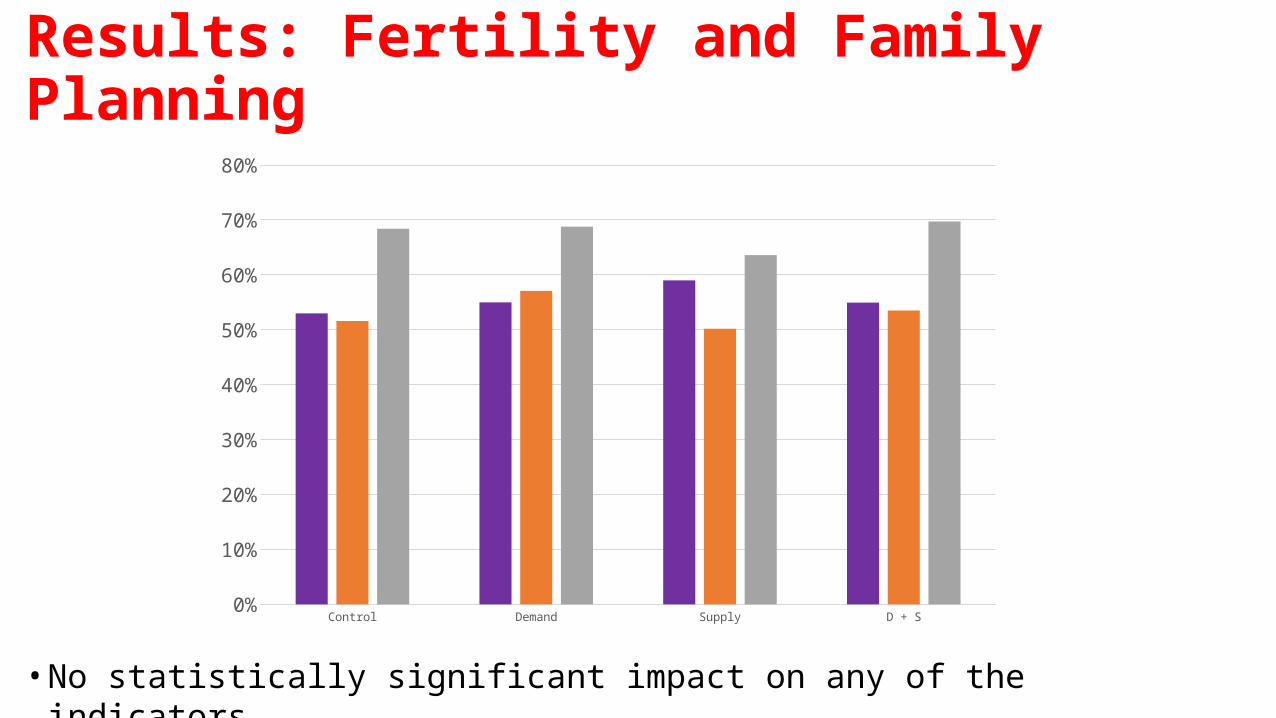
• No statistically significant impact on any of the indicators
Results: Nutritional monitoring
• Indicator:• Child was measured in the past 6 months to determine nutritional status
• Sample of children 6-59 months• Of all women (recent pregnancies and baseline women)
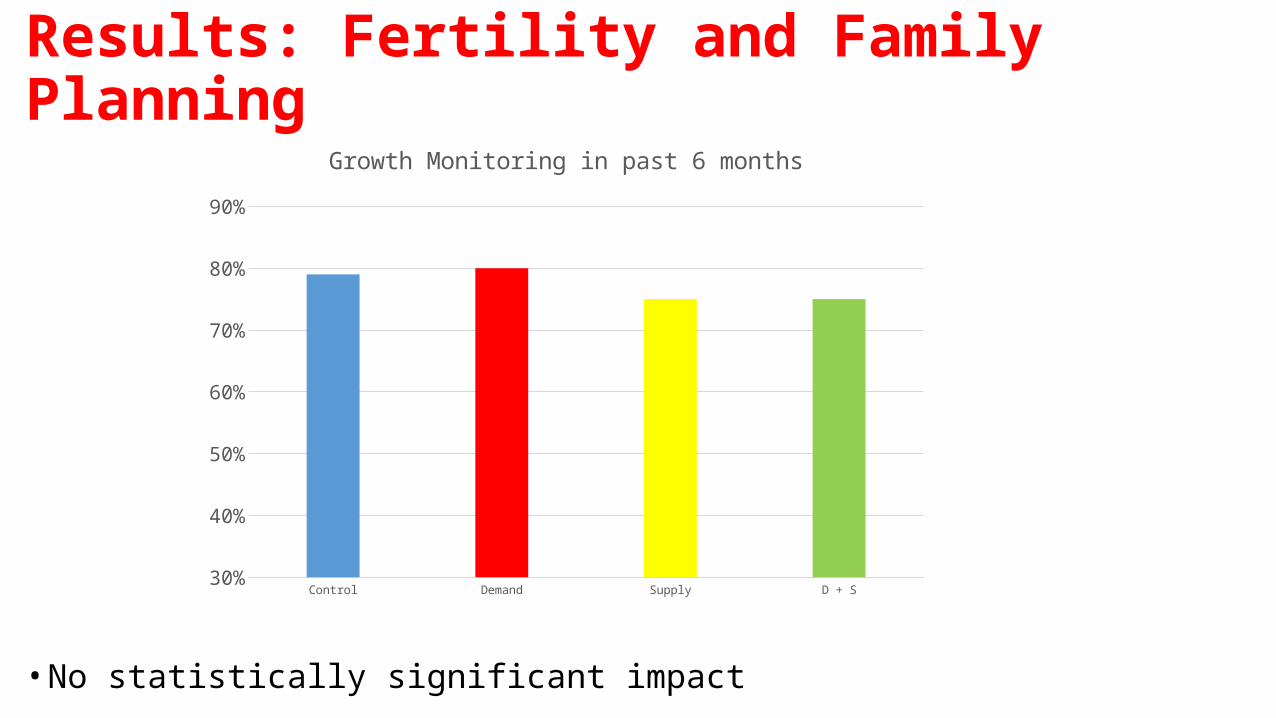
Results: Fertility and Family Planning
Control Demand Supply D + S30%
40%
50%
60%
70%
80%
90%
Growth Monitoring in past 6 months
• No statistically significant impact
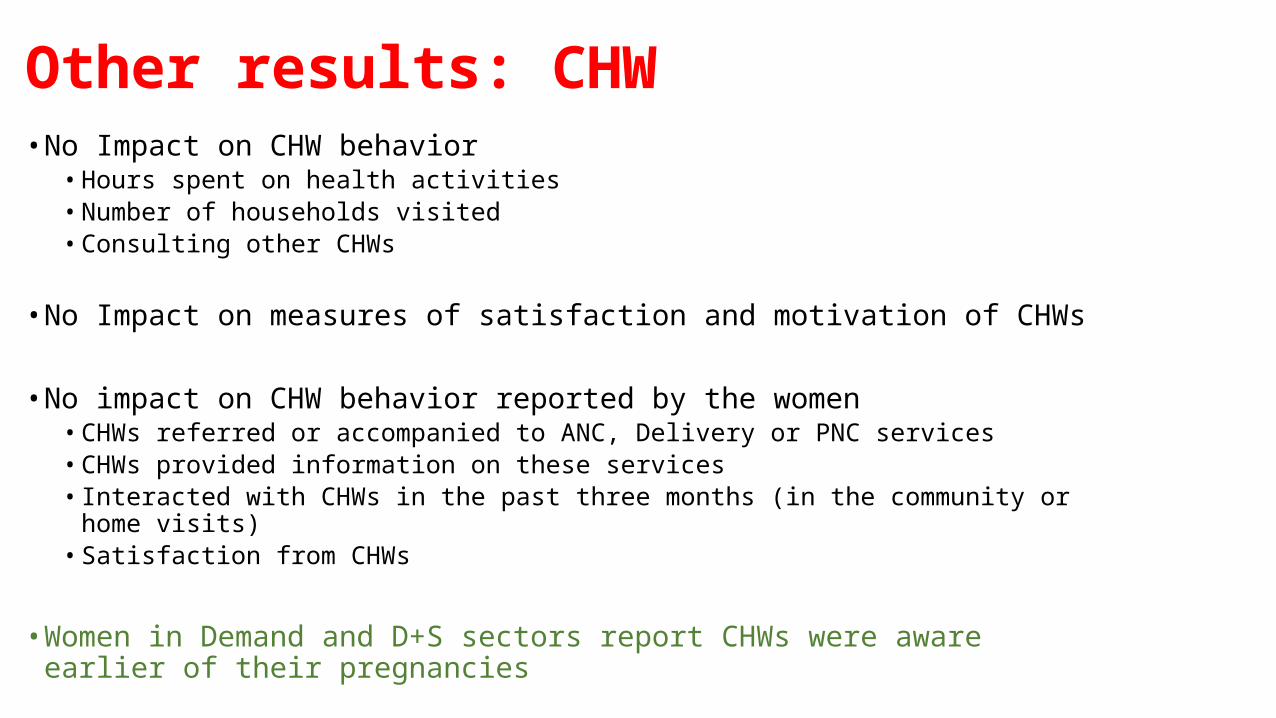
Other results: CHW• No Impact on CHW behavior
• Hours spent on health activities• Number of households visited• Consulting other CHWs
• No Impact on measures of satisfaction and motivation of CHWs
• No impact on CHW behavior reported by the women• CHWs referred or accompanied to ANC, Delivery or PNC services• CHWs provided information on these services• Interacted with CHWs in the past three months (in the community or home visits)• Satisfaction from CHWs
• Women in Demand and D+S sectors report CHWs were aware earlier of their pregnancies

Other results: Cooperatives
• No Impact on..• Number of meetings• Number of members recruited, dismissed, resigned in the past 12 month• Cooperative income• Whether payments are allocated by performance• Internal assessment of coop members
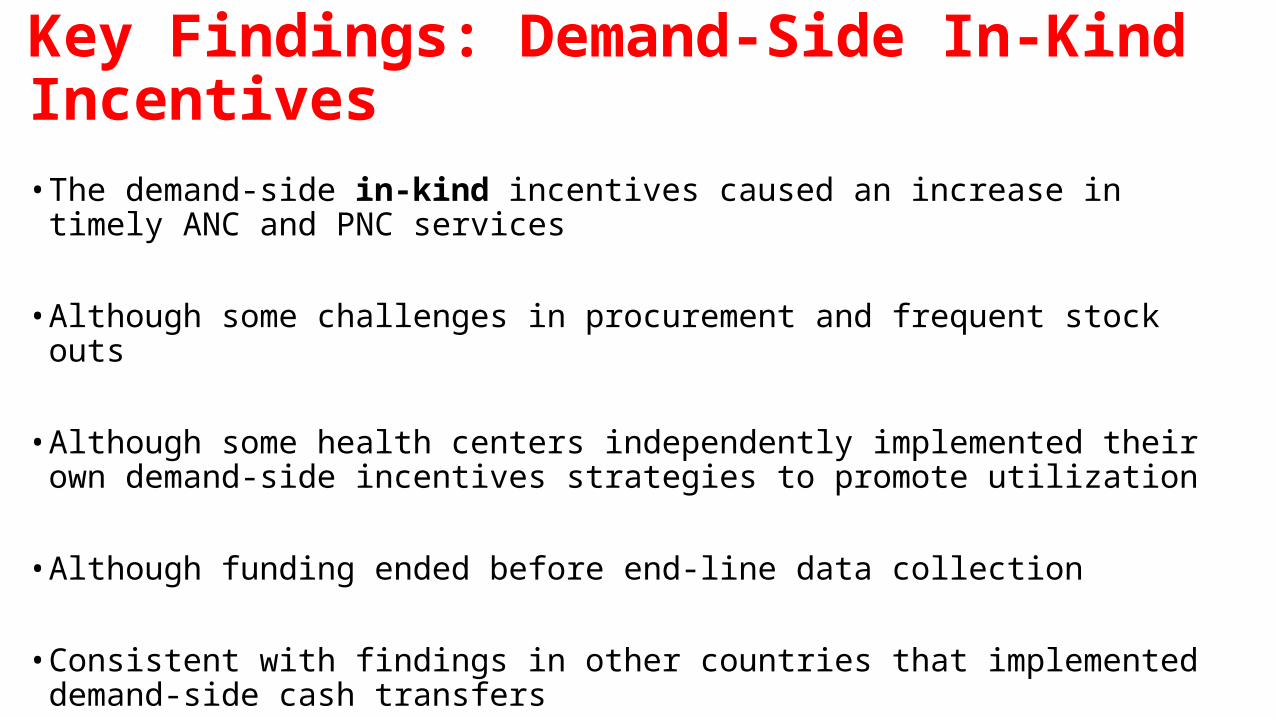
• The demand-side in-kind incentives caused an increase in timely ANC and PNC services
• Although some challenges in procurement and frequent stock outs
• Although some health centers independently implemented their own demand-side incentives strategies to promote utilization
• Although funding ended before end-line data collection
• Consistent with findings in other countries that implemented demand-side cash transfers
Key Findings: Demand-Side In-Kind Incentives
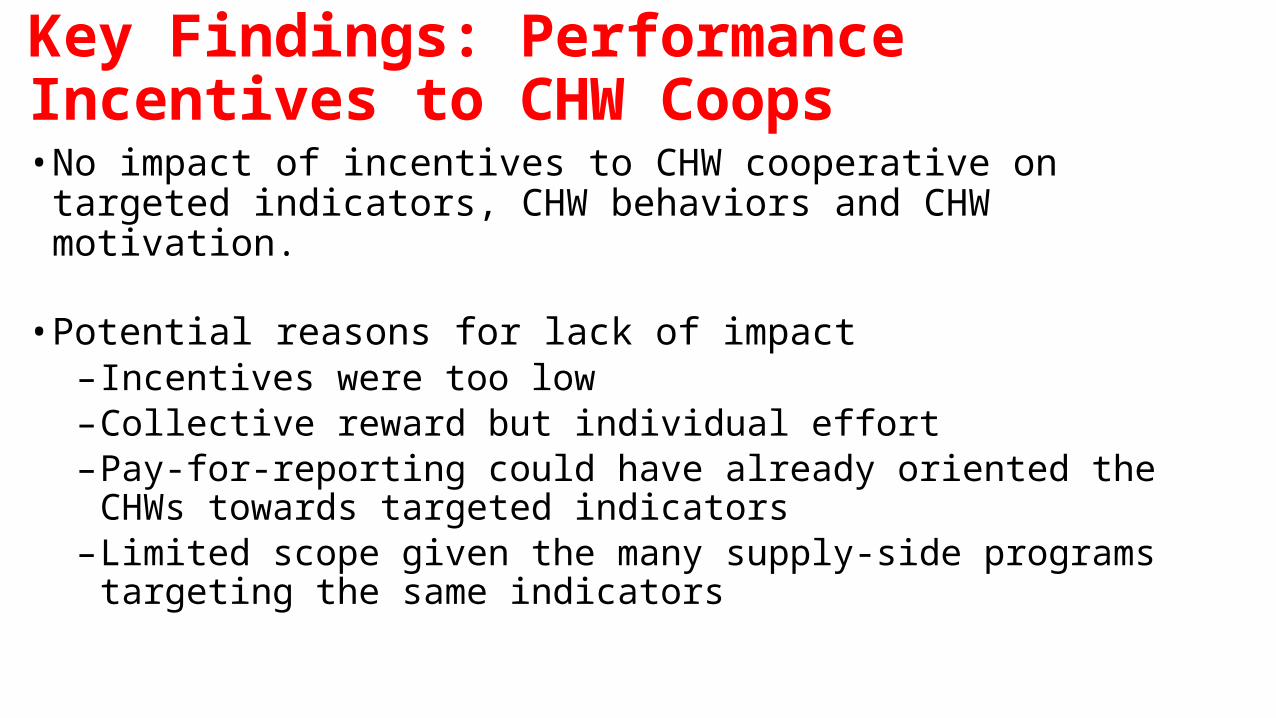
• No impact of incentives to CHW cooperative on targeted indicators, CHW behaviors and CHW motivation.
• Potential reasons for lack of impact– Incentives were too low–Collective reward but individual effort–Pay-for-reporting could have already oriented the CHWs towards targeted
indicators–Limited scope given the many supply-side programs targeting the same
indicators
Key Findings: Performance Incentives to CHW Coops
• Self-reported indicators
• Timing of survey relative to termination of the demand-side intervention• Hoping to include analysis of administrative data
• Not optimal sample for the analysis of fertility and family planning indicators
Caveats
• Ministry of Health • Fidel Ngabo • Cathy Mugeni
• University of Rwanda• Ina R. Kalisa• James Humuza• Jeanine Condo• Vedaste Ndahindwa
• The World Bank• Gil Shapira• Netsanet W. Workie• Jeanette Walldorf
Research Team
The study was funded by the Health Results Innovation Trust Fund (HRITF)

Thank you!


