Ten heavy metals (Fe, Cu, Mn, Cr, Zn, Hg, Pb, Cd, NI, and V) were analyzed in sediment samples in the dry and wet seasons of year 2008 using AAS. Mercury was not detected in all the samples. The mean concentrations of the heavy metals in sediment (0.38±0.03ppm to 6,619±290ppm – dry season and 0.24±0.05ppm to 8,144±229ppm – wet season) were lower than the values recommended in Consensus-Based Sediment Quality Guidelines of Wisconsin. In the dry season, Enrichment Factors (EF) of the heavy metals in sediment calculated ranged from 0.52 to 2.20. The low values of EF show that the enrichment of sediment by heavy metals was by natural process. The Geo-accumulation Index (Igeo) calculated in both dry and wet seasons gave values indicating no pollution to moderately polluted. From the analysis of variance with Statistical Analysis System (SAS), the mean concentration of metals in sediment in the two seasons (α level=0.05) are not significantly different which implied that the metals were held firmly in the matrix of sediment. Keywords: Heavy metal, sediment, concentrations, Enrichment factor (EF), Geo-
accumulation Index (Igeo) 1. Introduction Bitumen is a general term for a group of mineral composed of a mixture of hydrocarbons that are soluble in carbon disulphide (Akande and Akinbinu, 2005). Bitumen has similar composition as the light crude, that is, hydrogen, carbon, and minor amount of sulphur and oxygen. Agbabu is one of the farm settlements in Ondo State hosting a vast deposit of bitumen (Figure 1). This is where bitumen was first spotted in Nigeria in 1910 and the first bitumen well MBC-7 was drilled there. Agbabu bitumen belt is made of the main Agbabu village inhabited by about 400 people and other smaller farm settlements such as Temidire village made up of about 200 people. Farmers in this area deal mainly in cash crops such as cocoa and colanut and food crops such as yam and plantain and fishing along River Oluwa which flows through the whole land. These villages depend on River Oluwa for their farming
Evaluation of the Status of Heavy Metal Pollution of Sediment of Agbabu Bitumen Deposit Area, Nigeria 374 activities and other domestic use while hand dug shallow wells serve as their only some of potable water.
Sediment is the loose sand, clay, silt and other soil particles that settle at the bottom of body of water (Davies and Abowei, 2009). The erosion of bedrock and soils leads to accumulation of sediments of past or on-going natural and anthropogenic processes and components. Data from sediments can provide information on the impact of distant human activity on the wider ecosystem. The composition of sediment sequences provides the best natural archives of recent environmental changes.
Figure 1: Map of Nigeria showing Agbabu sampling point
Sediment is a habitat and major nutrient source for aquatic organisms. Sediment analysis is important in evaluating qualities of total ecosystem of a body of water in addition to water sample analysis practiced for many years because it reflects the long term quality situation independent of the current inputs (Adeyemo et al., 2008) and it is the ultimate sink of contaminants in the aquatic system (Davies and Abowei, 2009). The traces of the heavy metals in plants or animals are not toxic (De Vries et al., 2007), lead, cadmium and mercury are exceptions; they are toxic even in low concentrations (Galas-Gorcher, 1991). Monitoring of the contamination of soil and sediment with heavy metals is of interest due to their influence on ground water and surface water and also on plants, animals and humans (Ioan Suciu et al., 2008). Accumulation of trace metals occur in upper sediment in aquatic environment by biological and geochemical mechanisms and become toxic to sediment-dwelling organisms and fish, resulting in death, reduced growth, or in impaired reproduction and lower species diversity (Praveena et al., 2007). Trace elements also occur naturally in rock forming minerals and ore minerals; hence they can reach the environment from natural processes (Akinmosin et al., 2009). The occurrence of metals in aquatic ecosystems in excess of natural background loads has become a problem of increasing concern. Heavy metals in environment may accumulate to toxic levels without visible signs. This may occur naturally from normal geological phenomenon such as ore formation, weathering of rocks and leaching or due to increased population, urbanization, industrial activities, agricultural practices, exploration and exploitation of natural resources (Ajayi and Osibanjo, 1981). Since there are no industrial activities yet in this bitumen deposit area, the likely sources of heavy metal contamination in the environment are the basic natural process and the presence of bitumen.
A common approach to estimate how much the sediment is impacted (naturally and anthropogenically) with heavy metal is to calculate the Enrichment Factor (EF) for metal concentrations above un-contaminated background levels (Huu et al., 2010). Pollution will be measured as the amount or ratio of the sample metal enrichment above the concentration present in the reference station or material (Abrahim and Parker, 2008; Mediola et al., 2008). The EF method
375 Fagbote Emmanuel Olubunmi and Olanipekun Edward Olorunsola
normalizes the measured heavy metal content with respect to a samples reference such as Fe, Al or Zn (Mendiola et al., 2008). The EF of a heavy metal in sediment can be calculated with the following formula: (Huu et al., 2010)
EF = [Cmetal/Cnormalizer]soil/[Cmetal/Cnormalizer]control where Cmetal and Cnormalizer are the concentrations of heavy metal and normalizer in sediment and in unpolluted control. Enrichment factor (EF) can be used to differentiate between the metals originating from anthropogenic activities and those from natural procedure, and to assess the degree of anthropogenic influence. Five contamination categories are recognized on the basis of the enrichment factor as follows: (Sutherland, 2000)
• EF < 2 is deficiency to minimal enrichment • EF 2 – 5 is moderate enrichment • EF 5 – 20 is significant enrichment • EF 20 – 40 is very high enrichment • EF > 40 is extremely high enrichment As the EF values increase, the contributions of the anthropogenic origins also increase
(Sutherland, 2000). Index of Geo-accumulation (Igeo) has been used widely to evaluate the degree of metal
contamination or pollution in terrestrial, aquatic and marine environment (Tijani et al., 2009). The Igeo of a metal in sediment can be calculated with formula: (Mediola et. al, 2008; Asaah and Abimbola, 2005)
Igeo = Log2Cmetal/1.5Cmetal (control) Where Cmetal is the concentration of the heavy metal in the enriched sample and Cmetal(control) is
the concentration of the metal in the unpolluted sample or control. The factor 1.5 is introduced to minimize the effect of the possible variations in the background or control values which may be attributed to lithogenic variations in the sediment (Mediola et al., 2008). The degree of metal pollution is assessed in terms of seven contamination classes based on the increasing numerical value of the index as follows: (Huu et al., 2010)
• Igeo <0 = means unpolluted • 0<=Igeo<1 means unpolluted to moderately polluted • 1<=Igeo<2 means moderately polluted • 2<=Igeo<3 means moderately to strongly polluted • 3<=Igeo<4 means strongly polluted • 4<=Igeo<5 means strongly to very strongly polluted • Igeo>=5 means very strongly polluted.
2. Previous Research Ololade, Lajide and Amoo (2008) examined the distribution of heavy metals in stream bed sediment from an oil-producing region in Nigeria in the two seasons (dry and wet) of the year. Comparison of sediment with guidelines values indicated anthropogenic enrichment and it was considered that only Cu, and possibly Pb posed potential threats to the ecology of the area.
Adefemi, Olaofe and Asaolu (2007) studied the seasonal variation in heavy metal distribution in the sediment of major dams in Ekiti State, Nigeria. The concentration of most the metals appear higher in the dry season than those recorded for the wet season.
Adaikpoh, Nwajei and Olada (2005) studied heavy metals concentration in coal and sediments from River Ekulu in Enugu, coal city of Nigeria. This research established the presence of toxic metals in the area and called for a follow up study to determine how the human and aquatic lives have been affected.
Evaluation of the Status of Heavy Metal Pollution of Sediment of Agbabu Bitumen Deposit Area, Nigeria 376
Adekola, Eletta and Atanda (2002) carried out the determination of levels of some heavy metals in urban run-off sediments in Ilorin and Lagos, Nigeria. Zn, Fe and Cd were found in very high concentrations in the urban sediments from the cities while Pb had the lowest level.
Some studies have been carried out on Agbabu bitumen deposit area. Abass, Abass, Adejare, and Odeyemi (2007) investigated the distribution of Polycyclic Aromatic hydrocarbons (PAH) in surface soils and water from the vicinity of Agbabu bitumen field. The research showed that the total PAH levels in water samples from all the sampling stations, except one, were sufficiently high to cause acute toxicity to the exposed organisms.
Adebiyi and Omode (2006) studied the organic, chemical and elemental chracerization of components of Nigerian bituminous sands bitumen. The results showed high concentration of Zn, Ni, V and Fe in the bituminous components. 3. Scope of Study A combination of factors has prevented the exploitation of bitumen in Nigeria to date; the most important is the environmental effects that may pose threat to both physical and biological components in the area of occurrence. It is therefore, of utmost importance to know the average background amounts of each metal in the natural uncontaminated geological materials, soils and waters before assessing the contribution of anthropogenic sources to environmental contamination that may be associated with mining project when it eventually commences (Akinmosin et al., 2009).
The aim of this study therefore, was to evaluate the status of heavy metal pollution at Agbabu bitumen deposit area. 4. Materials and Methods Five sediment samples were picked in the dry season and six sediment samples in the wet season. Sampling points were geo-located using geographical positioning system (GPS) to ensure consistency. Sediment samples were collected inside polythene bags and stored under ice chest. 4.1. Procedure (ASTM, 1981; IITA, 1979):
Sediment samples were digested after drying in the oven and ground into fine powder using pestle and mortar. 5g of sample was weighed into a 250ml beaker. An empty beaker was included in the analysis as reagent glassware blank.
50ml distilled water, 0.5ml concentrated HNO3 and 5.0ml concentrated HCL were added to each sample and the blank. Each beaker was covered with s watch glass and digestion carried out on a hot plate in a fume chamber avoiding splattering all through. Digestion was continued until the entire volume was reduced to about 15ml. The beakers were allowed to cool to room temperature. The digests were then filtered into a 50ml volumetric flask and made up to volume with distilled water.
Analysis was carried out with AAS using GBC Avanta PM. Ver 2.02. To validate the procedure, the instrument was programmed and it carried out metal detection by displaying three absorbance readings and what was reported was the average. Blanks were also used for correction of background and other sources of error. Apart from calibration before use, quality checks were also performed on the instrument by checking the absorbance after every ten sample runs.
Analysis of variance (ANOVA) and Duncan’s multiple range tests were used to find out statistical differences among various parameters.
377 Fagbote Emmanuel Olubunmi and Olanipekun Edward Olorunsola
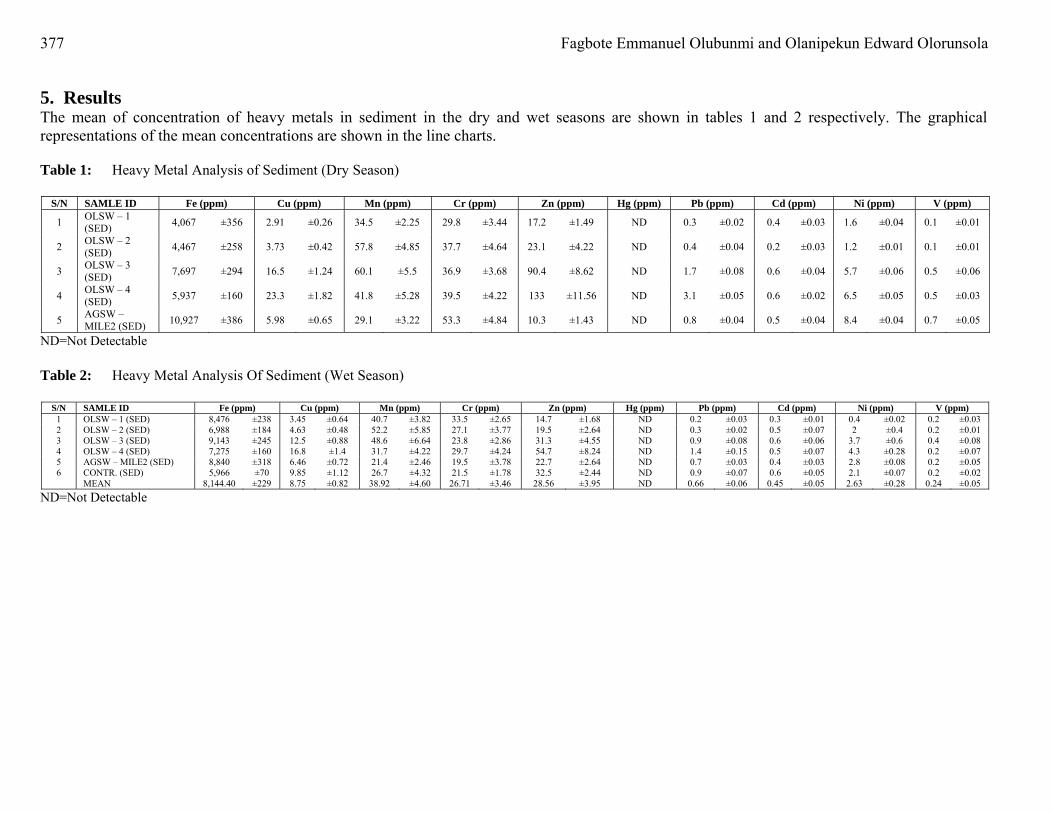
5. Results The mean of concentration of heavy metals in sediment in the dry and wet seasons are shown in tables 1 and 2 respectively. The graphical representations of the mean concentrations are shown in the line charts. Table 1: Heavy Metal Analysis of Sediment (Dry Season)
S/N SAMLE ID Fe (ppm) Cu (ppm) Mn (ppm) Cr (ppm) Zn (ppm) Hg (ppm) Pb (ppm) Cd (ppm) Ni (ppm) V (ppm)
Evaluation of the Status of Heavy Metal Pollution of Sediment of Agbabu Bitumen Deposit Area, Nigeria 378
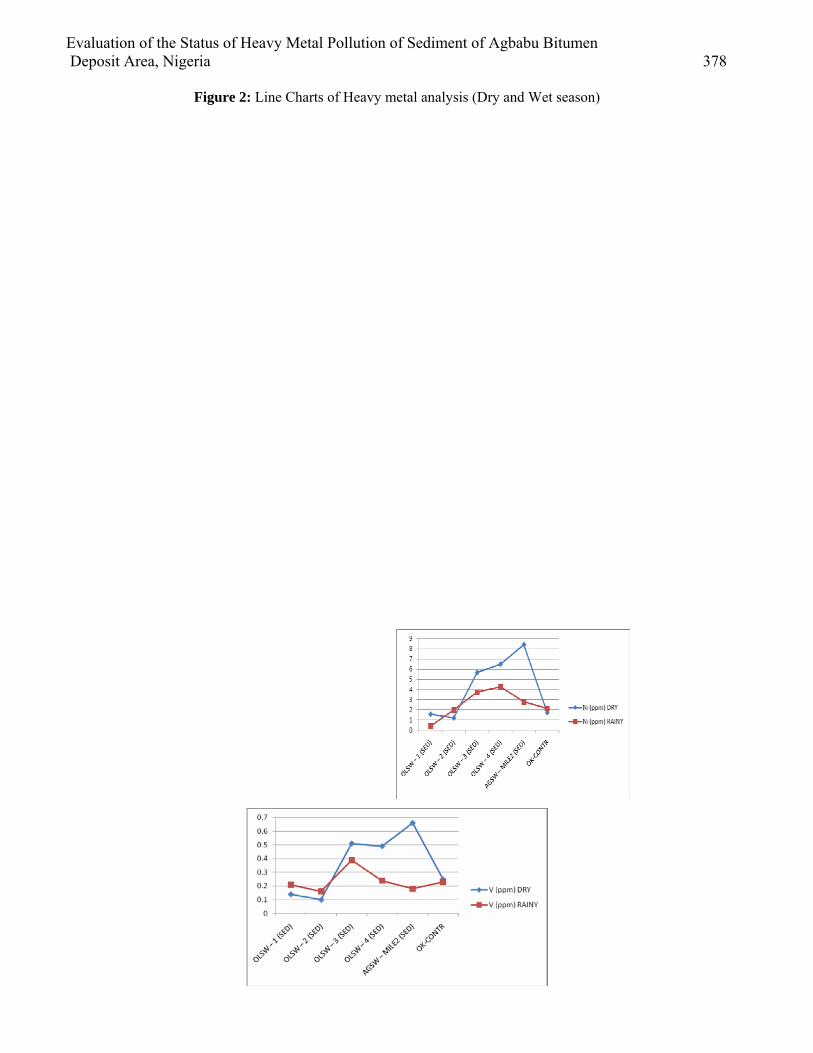
Figure 2: Line Charts of Heavy metal analysis (Dry and Wet season)
Evaluation of the Status of Heavy Metal Pollution of Sediment of Agbabu Bitumen Deposit Area, Nigeria 379
Mercury was not detected in any of the samples. The mean concentrations of Pb (1.23±0.05ppm – dry, 0.66±0.06ppm - wet), Cd (0.46±0.03ppm - dry, 0.45±0.05ppm - wet) and V (0.38±0.03ppm – dry, 0.24±0.05ppm - wet) were low in the two seasons. The concentrations of Fe (6.619.00±290.8ppm in dry season, 8,144.40±229ppm in wet season), Cu (10.50±0.88 in dry season, 8.75±0.82ppm in wet season), Mn (44.63±4.22 in dry season, 38.92±4.60ppm in wet season), Cr (39.44±4.16ppm in dry season, 26.71±3.46ppm in wet reason), Zn (54.74±5.46ppm in dry season, 28.56±3.95ppm in wet season) and Ni (4.67±0.04ppm in dry season, 2.53±0.28ppm in wet season) were high in the sediment samples. 5.1. Discussion
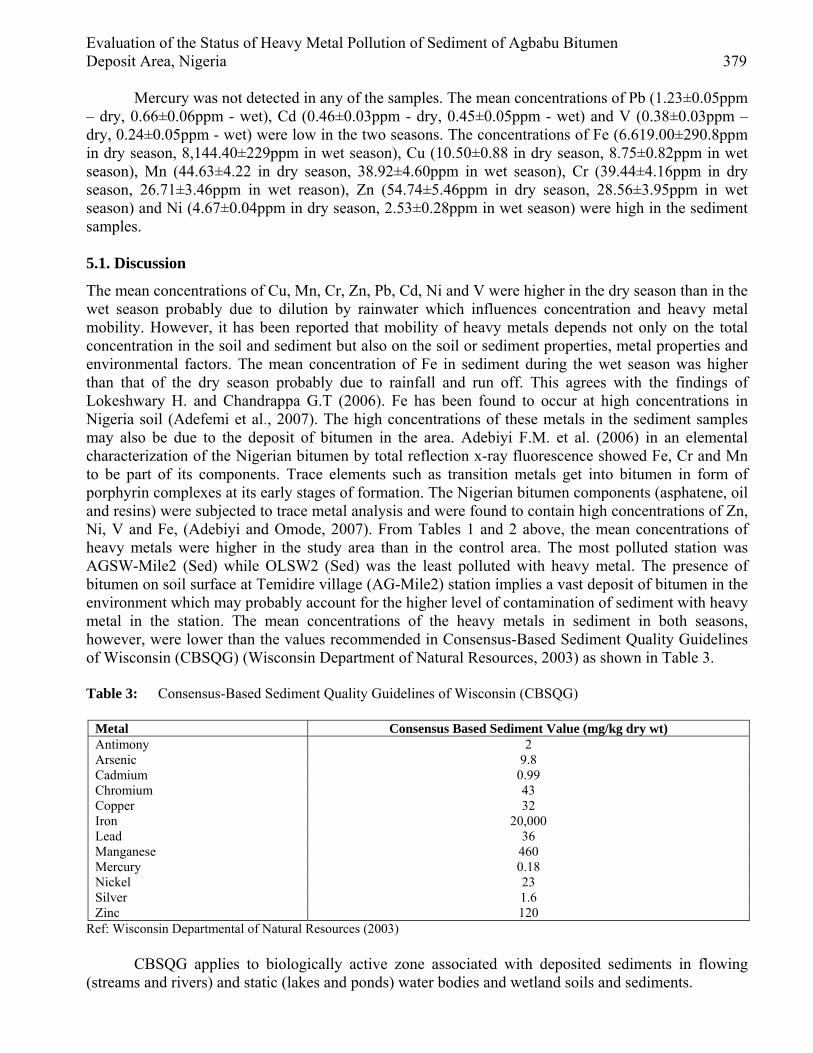
The mean concentrations of Cu, Mn, Cr, Zn, Pb, Cd, Ni and V were higher in the dry season than in the wet season probably due to dilution by rainwater which influences concentration and heavy metal mobility. However, it has been reported that mobility of heavy metals depends not only on the total concentration in the soil and sediment but also on the soil or sediment properties, metal properties and environmental factors. The mean concentration of Fe in sediment during the wet season was higher than that of the dry season probably due to rainfall and run off. This agrees with the findings of Lokeshwary H. and Chandrappa G.T (2006). Fe has been found to occur at high concentrations in Nigeria soil (Adefemi et al., 2007). The high concentrations of these metals in the sediment samples may also be due to the deposit of bitumen in the area. Adebiyi F.M. et al. (2006) in an elemental characterization of the Nigerian bitumen by total reflection x-ray fluorescence showed Fe, Cr and Mn to be part of its components. Trace elements such as transition metals get into bitumen in form of porphyrin complexes at its early stages of formation. The Nigerian bitumen components (asphatene, oil and resins) were subjected to trace metal analysis and were found to contain high concentrations of Zn, Ni, V and Fe, (Adebiyi and Omode, 2007). From Tables 1 and 2 above, the mean concentrations of heavy metals were higher in the study area than in the control area. The most polluted station was AGSW-Mile2 (Sed) while OLSW2 (Sed) was the least polluted with heavy metal. The presence of bitumen on soil surface at Temidire village (AG-Mile2) station implies a vast deposit of bitumen in the environment which may probably account for the higher level of contamination of sediment with heavy metal in the station. The mean concentrations of the heavy metals in sediment in both seasons, however, were lower than the values recommended in Consensus-Based Sediment Quality Guidelines of Wisconsin (CBSQG) (Wisconsin Department of Natural Resources, 2003) as shown in Table 3. Table 3: Consensus-Based Sediment Quality Guidelines of Wisconsin (CBSQG)
Metal Consensus Based Sediment Value (mg/kg dry wt) Antimony 2 Arsenic 9.8 Cadmium 0.99 Chromium 43 Copper 32 Iron 20,000 Lead 36 Manganese 460 Mercury 0.18 Nickel 23 Silver 1.6 Zinc 120
Ref: Wisconsin Departmental of Natural Resources (2003)
CBSQG applies to biologically active zone associated with deposited sediments in flowing (streams and rivers) and static (lakes and ponds) water bodies and wetland soils and sediments.
380 Fagbote Emmanuel Olubunmi and Olanipekun Edward Olorunsola
The results of the calculation of Enrichment Factor (EF) of heavy metal in sediment in the dry and wet seasons are shown in Table 4 and 5 respectively. Table 4: Enrichment Factor (Ef) And Geoaccumulation Index (Igeo) Of Heavy Metals In Sediment (Dry
Enrichment factors were calculated from the mean concentrations of the heavy metals in the
sampling points in the study area. The control sampling point was considered to be the unpolluted or background point. The normalizing element used in study was Fe due to low occurrence variability. Enrichment Factor (EF) of the heavy metals in sediment showed that Fe (1), Cu (1.10) and Cd (0.74) had no enrichment; Mn (1.39), Cr (1.39), Zn (1.46), Pb (1.52) and V (1.22) had minimal enrichment; Ni (2.19) had moderate enrichment in the dry season. In the wet season, Fe (1), Cu (0.65), Mn (1.06), Cr (0.91), Zn (0.64), Pb (0.51), Cd (0.58), Ni (0.91) and V (0.75) had no enrichment. The enrichment values were higher in the dry season than in the wet season. Normally, as the EF values increase, the contributions of the anthropogenic origins also increase. Therefore, the low values of EF (0.51 to 2.19) in sediment show that the slight heavy metal pollution of Agbabu bitumen deposit area was not likely to originate from anthropogenic activities. The heavy metals probably originated from natural procedure due to the presence of bitumen in the environment.
The results of the calculation of Geo-accumulation Index (Igeo) in sediment are shown in Tables 4 and 5. In the dry season the negative Igeo values of Cd (-1.48) and V (-3.72), and zero value of Fe, according to Huu et al. 2010 showed that sediment was not polluted by Cd, V and Fe. The values of Cu (0.29), Mn (0.14), Cr (0.15), Zn (0.13), Pb (0.31) and Ni (0.86) were less that 1 showing that sediment was moderately polluted with these metals. In the wet season, the negative values of Pb (-0.42), Cd (-1.39) and (-6.03) indicates that sediment was unpolluted with these metals. The remaining metals Cu (0.21), Mn (0.13), Cr (0.15), Zn (0.09) and Ni (0.44) have Igeo values less than 1 indicating sediment was moderately polluted with these metals. The Igeo factor is not readily comparable with EF due to the nature of Igeo calculation which involves a logarithm function and a background multiplication factor of 1.5.
Analysis of variance was carried out with Statistical Analysis System (SAS) and Duncan’s multiple range tests. The mean concentration of metals in soil in the two seasons (α level=0.05) were found not to be significantly different. This implies that the metals are firmly bounded within the crystal structure of the minerals comprising the sediment and were not largely affected by dilution due to rain. This may also imply that the heavy metals in the sediment of Agbabu bitumen deposit area were immobile. However, the mean concentrations of the metals such as Cu, Mn and Pb in different locations, including the control points, were found to be significantly different. This shows that the metals probably originated from many sources. These sources include contamination by bitumen, run-off due to rain fall and an anthropogenic activity such as agriculture.
Evaluation of the Status of Heavy Metal Pollution of Sediment of Agbabu Bitumen Deposit Area, Nigeria 381
6. Conclusion Data available in this study can be used as the exploitation base line data at Agbabu bitumen deposit. The environment presently has been imparted slightly by the presence of bitumen. The mean concentrations of some the heavy metals were high in the sediment samples considered but not beyond the values recommended in Consensus-Based Sediment Quality Guidelines of Wisconsin. The enrichment factors calculated for the heavy metals showed that the enrichment of the heavy metals ranged from no enrichment to moderate enrichment. The enrichment factor values were higher in the dry season than in the wet season. The low EF values obtained also indicate that the moderate heavy metal pollution observed in the soil of Agbabu bitumen deposit area probably originated from natural process. The Geo-accumulation Index calculated for the heavy metals showed that the pollution status ranged from unpolluted to moderately polluted. Further research has to be carried out to determine the concentration of heavy metals in the various organs of the aquatic animals in the environment and the speciation of heavy metals in sediment of this environment to determine their mobility. References [1] Abass, A.A., Abass O.A, Adejare A.A. and Ojeyemi M.D. (2007). Distribution of Polycyclic
Aromatic Hydrocarbons in surface soils and water from the vicinity of Agbabu bitumen field of south-western Nigeria). J. of Environ. Sci. and Health, Part A 42(8): 1043 - 1049
[2] Abrahim, G. M. S, and Parker, P. J. (2008). Assessment of heavy metal enrichment factors and the degree of contamination in marine sediment from Tamaki Estuary, Auckland, New Zealand. Environ. Monit. Assessment 136: 227-238
[3] Adaikpor, E. O., Nwajei, G. E. and Olada, J. E. (2005). Heavy metals concentration in coal and sediments from River Ekulu in Enugu, coal city of Nigeria. J. of Applied Sci. Environ. Mgt 9(3): 5-8
[4] Adebiyi, F.M., Asubiojo O.I. and Ajayi, F.R. (2006). Multi-elemental analysis of Nigerian Bitumen by TX RF spectrometry and the physical constants characterization of its hydro-carbon component. Fuel 85: 396-400
[5] Adebiyi, F.M. and Omode, A.A. (2007). Chemical and elemental characterization of components of Nigerian bitumen sands. Energy sources 29(8): 669-676.
[6] Adefemi, O. S., Olaofe, D. and Asaolu S.S. (2007). Seasonal variation in heavy metal distribution in the sediment of major dams in Ekiti-State. Pakistan journal of Nutrition 6(6): 705-707
[7] Adegoke, O. S. and Ibe, E. C. (1982). The tar sand and heavy crude resources of Nigeria. Proc. 2nd Intern. Conf. on heavy crude and tarsands, Caracas, Venezuela, ch 32: 280 – 285
[8] Adegoke, O. S., Omatsola, M. E. and Coker, J. L. (1991). The geology of the Nigerian tarsands. In: Heavy crude and tarsands hydrocarbons for the 21st century. Proc. 5th UNITAR Intern. Conf. on Heavy Crude and Tarsands 1991: 369 – 385
[9] Adeyemo, O. K., Adedokun, O. A., Yusuf, R. K. and Adeleye, E. A (2008). Seasonal changes in physicao-chemical parameters and nutrient load of river sediment in Ibadan city, Nigeria. Global NEST Journal 10(3): 326 – 336
[10] Adekola, F. A., Eletta, O. A. and Atanda, S. A. (2002). Determination of the levels of some heavy metals in urban run-off sediments in Ilorin and Lagos, Nigeria. J. of Appl. Sci. and Environ. Mgt 6(2): 23-26
[11] Ajayi, S. O. and Osibanjo, O. (1981). Pollution studies in Nigerian Rivers. Water quality of some Nigerian rivers. Environ. Pollut. (Series B) 2: 87 - 95
[12] Akande, J. M. (2007). Environmental Impact Assessment of Steam Injection Mining method of Agbabu bitumen deposit. J. of Engineering and Applied Science 2 (10):1497-1500.
382 Fagbote Emmanuel Olubunmi and Olanipekun Edward Olorunsola
[13] Akande, J. M. and Akinbinu, V. A. (2005). Impact Assessment of bitumen mining on the water and soil characterization of mining area of Ondo State. J. Sci. Eng. Technol 12:2
[14] Akinmosin, A., Osinowo, O. O. and Oladunjoye, M. A. (2009).Radiogenic components of the Nigeria Tarsand Deposits. Earth Sci. Res. J. 13(1): 64 - 73
[15] Asaah A. V. and Abimbola, A. F. (2005). Heavy metal concentrations and distribution in surface soils of the Bassa Industrial Zone 1, Doula, Cameroon. The Journal for Science and Engineering 31(2A): 147 - 158
[16] ASTM D 3974 (1981). Standard Practices for Extraction of Trace Elements from Sediments. ASTM International, 100 Barr Harber Drive, West Conshohocken, United States. pp 393 – 395
[17] Davies, O. A. and Abowei, J. F. N. (2009). Sediment quality of lower reaches of Okpoka Creek, Niger Delta, Nigeria. European Journal of Scientific Research 26(3): 437 - 442
[18] Galas- Gorcher, H. (1991). Dietary intake of petricide residues: Cadmium, Mercury and Lead. Food add 8: 793-80.
[19] Huu, H. H., Rudy S. and An Van Damme (2010). Distribution and contamination status of heavy metals in estuarine sediments near Cau Ong harbor, Ha Long Bay, Vietnam. Geology Belgica 13(1-2): 37 - 47
[20] Lokeshwary H. and Chandrappa G. T. (2006). Impact of heavy metal Contamination of Bellandur Lake on Soil and cultivated vegetation. Current science 91(5): 622-627
[21] Oboh, O. B., Ilori, M. O., Akinyemi, J. O. and Adebusoye S. A. (2006). Hydrocarbon Degrading potentials of bacteria isolated from a Nigerian bitumen (Tarsand) deposit. Nature and Sciences 4: 3
[22] Mediolla, L. L., Domingues, M. C. D. and Sandoval M. R. G. (2008). Environmental Assessment of and Active Tailings Pile in the State of Mexico (Central Mexico). Research Journal of Environmental sciences 2 (3): 197 – 208
[23] Ololade, I. A., Lajide, L. and Amoo, I A. (2008). The distribution of heavy metals in streambed sediment from an oil-producing region in Nigeria. J. of Applied Science and Environmental Management 12(14): 11-18
[24] Onwerendu, E.U., E shett E.T. and Onyi, G.E. (2007). Temporal variability of selected heavy metals in automobile soils. Int. Journal of Environmental Science and Tech 4(1): 35-41
[25] Praveena, S. M., Radojevic, M., Abdullah, M. H. and Avis, A. Z. (2007). Factor-cluster analysis and enrichment study of mangrove sediments – An example from Mengkabong Sabah. The Malysian Journal of Analytical Sciences 2(2): 421 - 430
[26] Selected methods for Soil and Plant Analysis (1979), International Institute for Tropical Agriculture, Oyo road, Ibadan, Nigeria. Anal 102
[27] Suciu, I., Cosma, C., Todica, M, Bolboaca, S. D. and Jantschi, L. (2008). Analysis of soil heavy metal pollution and pattern in Central Transylvania. Int. J. Mol. Sci 9: 434-453
[28] Sutherland, R.A. (2000). Bed sediment-associated trace metals in an urban stream, Oahu, Hawaii. Environmental Geology 39: 611 – 37.
[29] Tijani, M. N. and Onodera, S. (2009). Hydrogeochemical Assessment of metals contamination in an urban drainage system: A case study of Osogbo township, SW-Nigeria. J. Water Resource and Protection 3: 164-173
[30] Vries, W. de, Romkens, P.F.A.M. and Schutze, G. (2007). Critical soil concentrations of cadmium, lead and mercury in view of health effect on humans and animals. Reviews of Environmental contamination and Toxicology 191: 91-30
[31] Wisconsing Department of Natural Resources. (2003). Cncensus based sediment quality guidelines. Recommendations for use and application. Department of interior, Washington D.C. 20240 pp 17.