95
Evaluation study on Total Sanitation campaign Page 1 PROGRAMME EVALUATION ORGANISATION 2013 Evaluation Study on Total Sanitation Campaign-VolumeII PLANNING COMMISSION GOVERNMENT OF INDIA

Evaluation study on Total Sanitation campaign Page 1
C O N T E N T S – VOLUME - II
PROGRAMME EVALUATION ORGANISATION
2013
Evaluation Study on Total Sanitation Campaign-VolumeII
P L A N N I N G C O M M I S S I O N G O V E R N M E N T O F I N D I A

Evaluation study on Total Sanitation Campaign Page 2
CONTENTS – VOLUME II List of Annexure Page No Annex-1: List of selected State Districts………………………………………...6
Annex-2: Table: Involvement of Village Water Sanitation CommitteeTSC....................7 Annex-3: Table: Criteria adopted in Selection of Blocks/GPs/HHs at District
Level for yet not Covere areas..............................................................8
Annex-4: Organisational Chart..............................................................................9-27
Annex-5: Table: Availability and functionality RSM/PC………………………………..28
Annex-6: Table: Operation and maintenance RSM/PC…………………………………..29
Annex-7: Table: Coverag RSM/PC………………………………………………………30
Annex-8: Table: Training of managers, signing of MOU and existence of quality
certification; RSM/………………………………………………...........31
Annex-9: Table: Amount of fund made available RSM/PC……………………………...32
Annex-10: Table: Availability and Utilization of funds (in Rs.) byRSM/PC…………….33
Annex-11: Table: Return of revolving fund, repair and maintenance and capacity to operate independently by the RSM/PC……………………………………….34
Annex-12: Table: Production and profit by theRSM/PC…………………………………35
Annex13: Table: Return of revolving fund, repair and maintenance and capacity to operate independently by the RSM/PC…………………………………………36
Annex-14: Table: Nodal Agency………………………………………………………….37
Annex-15: Table: Implementing Agency ………………………………………………...38
Annex-16: Table: Institutional arrangement by the PRIs…………………………………39
Annex-17: Table: Village Water and Sanitation Committee……………………………...40
Annex-18: Table: Social Profile of selected Households....................................................41
Annex-19: Table: Educational Profile of selected Households ..........................................42 Annex-20: Table: Financial Profile of selected Households...............................................43 Annex-21:Table: Occupational Profile of members of selected Households.....................44 Annex-22: Table: Type of Residential Accommodation .....................................................45 Annex-23: Table: Toilets and source of water (Other than drinking) .......46
Evaluation study on Total Sanitation Campaign Page 3
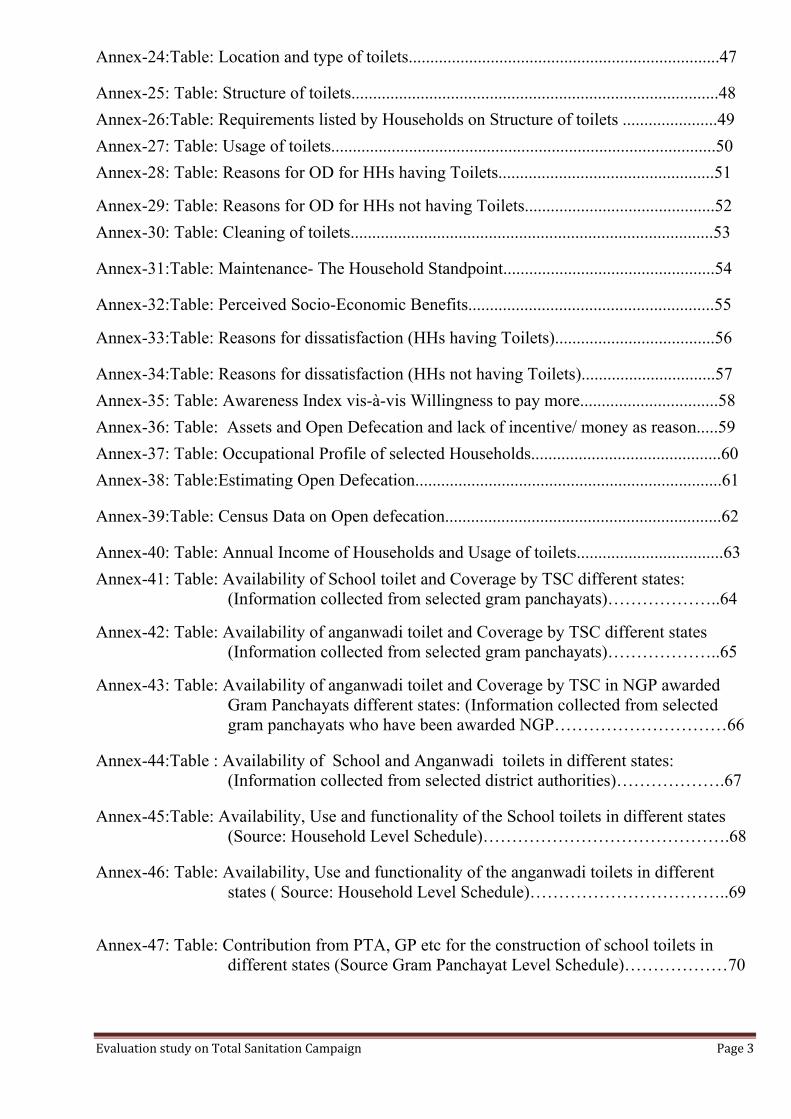
Annex-24:Table: Location and type of toilets........................................................................47
Annex-25: Table: Structure of toilets.....................................................................................48 Annex-26:Table: Requirements listed by Households on Structure of toilets ......................49 Annex-27: Table: Usage of toilets.........................................................................................50 Annex-28: Table: Reasons for OD for HHs having Toilets..................................................51
Annex-29: Table: Reasons for OD for HHs not having Toilets............................................52 Annex-30: Table: Cleaning of toilets....................................................................................53
Annex-31:Table: Maintenance- The Household Standpoint.................................................54
Annex-32:Table: Perceived Socio-Economic Benefits.........................................................55
Annex-33:Table: Reasons for dissatisfaction (HHs having Toilets).....................................56
Annex-34:Table: Reasons for dissatisfaction (HHs not having Toilets)...............................57 Annex-35: Table: Awareness Index vis-à-vis Willingness to pay more................................58 Annex-36: Table: Assets and Open Defecation and lack of incentive/ money as reason.....59 Annex-37: Table: Occupational Profile of selected Households............................................60 Annex-38: Table:Estimating Open Defecation.......................................................................61
Annex-39:Table: Census Data on Open defecation................................................................62
Annex-40: Table: Annual Income of Households and Usage of toilets..................................63 Annex-41: Table: Availability of School toilet and Coverage by TSC different states:
(Information collected from selected gram panchayats)………………..64
Annex-42: Table: Availability of anganwadi toilet and Coverage by TSC different states (Information collected from selected gram panchayats)………………..65
Annex-43: Table: Availability of anganwadi toilet and Coverage by TSC in NGP awarded Gram Panchayats different states: (Information collected from selected gram panchayats who have been awarded NGP…………………………66
Annex-44:Table : Availability of School and Anganwadi toilets in different states: (Information collected from selected district authorities)……………….67
Annex-45:Table: Availability, Use and functionality of the School toilets in different states (Source: Household Level Schedule)…………………………………….68
Annex-46: Table: Availability, Use and functionality of the anganwadi toilets in different states ( Source: Household Level Schedule)……………………………..69
Annex-47: Table: Contribution from PTA, GP etc for the construction of school toilets in different states (Source Gram Panchayat Level Schedule)………………70

Evaluation study on Total Sanitation Campaign Page 4
Annex-48: Table : Coverage of school sanitation under different schemes in different states (Source Gram Panchayat Level Schedule)……………………………….71
Annex-49: Table : Construction of school and angawadis toilets in different states under TSC (inform collected from district authorities)………………………………72
Annex-50: Table -Physical Achievement - construction/functionality of CSCs/WSCs...........73
Annex-51: Table: Role played by PRIs/NGOs in Maintenance of Community Sanitary Complex/ Women Sanitary Complex under TSC......................................74
Annex-52: Table: Availability of CSC/WSC in the GPs and their maintenance ....................75
Annex-53: Table: Availability of CSC/WSC in the village and their Uses.............................76
Annex-54: Table: Provision of user Charges collection..........................................................77
Annex-55:Table : Recruit of and roles assigned to the Motivators at the
Gram Panchayat level……………………………………………………78
Annex-56: Table: Awareness of TSC among the households.................................................79
Annex-57: Table: Effectiveness of IEC Activities..................................................................80
Annex-58: Table: Solid & Liquid Waste Management successful in implementing the proper garbage disposal and processing norms and replicating the model in the districts.......................................................................................................81
Annex-59: Table: Mechanism for proper disposal of solid and liquid Waste Management used by Households............................................................................................82
Annex-60: Table. Households’ response on maintenance and participation with regard to disposal of Solid and Liquid Waste............................................................83
Annex-61: Table: State wise details of the implementing agencies at the Gram Panchayat Level………………………………………………………………………84
Annex-62: Table : State wise details of the implementing agencies at the Gram Panchayat Level in NGP awarded GPs……………………………………………….85
Annex-63: Table: Table showing whether the gram panchayats have been assigned any role and are providing supports………………………………………………..86
Annex-64: Table: Support from PR…………………………………………………………..87
Annex-65: Table: Role played by the Gram Panchayats in NGP awarded GPs and non NGP awarded GP………………………………………………………………88
Annex-66: Table: Average population of the Gram Panchayats who received different amount of the money.............................................................................................89
Annex-67: Table: Amount of Award money received by the Gram Panchayats in different states………………………………………………………………………90

Evaluation study on Total Sanitation Campaign Page 5
Annex-68:Table : Utilization of award money by the Gram Panchayats in
different states……………………………………………………………..91
Annex-69: Table: Status of the NGP awarded Gram Panchayats in the selected state……….92
Annex-70: Table: Hygienic Behaviour, morbidity and awareness............................................93 Annex-71: Table: Reduced Medical Expenses due to TSC.......................................................94
Annex-72: Table: Share of cost in construction of Latrines by each Beneficiary
(in percent)..................................................................................................95

Evaluation study on Total Sanitation Campaign Page 6
Annex-1
List of selected States and Districts
Name of the State
Name of the District
Name of the State
Name of the District
Name of the State
Name of the District
Name of the State
Name of the District
ANDHRA PRADESH
ANANTAPUR
MAHARASHTRA
AHMEDNAGAR
HARYANA
BHIWANI
SIKKIM
SOUTH SIKKIM
EAST GODAVARI
BHANDARA
GURGAON
WEST SIKKIM
KHAMMAM
HINGOLI
JIND
TAMIL NADU
CUDDALORE
MAHBUBNAGAR
NAGPUR
KURUKSHETRA
KARUR
NELLORE
OSMANABAD
MEWAT
PERAMBALUR
SRIKAKULAM
RATNAGIRI
ROHTAK
SIVAGANGA
WARANGAL
THANE
YAMUNANAGAR
TIRUNELVELI
ASSAM
BARPETA
ORISSA
BARGARH
JHARKHAND
DEOGHAR
TIRUVARUR
DHEMAJI
DHENKANAL
DUMKA
VILLUPURAM
JORHAT
JAGATSINGHAPUR
GODDA
UTTAR PRADESH
AGRA
KARBI ANGLONG
KENDRAPARA
JAMTARA
BALLIA
KARIMGANJ
BOLANGIR
PALAMU
BARABANKI
NAGAON
PURI
RAMGARH
BASTI
NALBARI
SUNDARGARH
SERAIKELA KHARSAWAN
CHANDAULI
BIHAR
ARARIA
PUNJAB
BARNALA
KARNATAKA
CHIKKABALLAPUR
GONDA
BHOJPUR
FEROZEPUR
BELGAUM
KANPUR DEHAT
JAMUI
HOSHIARPUR
CHAMARAJANAGAR
WEST BENGAL
BARDHAMAN
MADHUBANI
JALANDHAR
DHARWAD
DAKSHIN DINAJPUR
PASHCHIM CHAMPARAN
MOGA
HAVERI
HOWRAH
PURNIA
PATIALA
MANDYA
MIDNAPUR EAST
SHEOHAR
TARN TARAN
SHIMOGA
MURSHIDABAD
GUJARAT
ANAND
RAJASTHAN
ALWAR
KERALA
ERNAKULAM
NORTH 24 PARAGANAS
BHAVNAGAR
BHARATPUR
KANNUR
SOUTH 24 PARAGANAS
JUNAGADH
CHITTORGARH
KOTTAYAM
MANIPUR IMPHAL EAST
MAHESANA
HANUMANGARH
MALAPPURAM
THOUBAL
PATAN
JHALAWAR
PALAKKAD
MEGHALAYA WEST GARO HILLS
SURAT
NAGAUR
THIRUVANANTHAPURAM
WEST KHASI HILLS
VADODARA
SIROHI
WAYANAD
UTTARAKHAND ALMORA
MADHAYA PRADESH
ASHOKNAGAR
HARIDWAR
CHHATARPUR
PAURI(GARHWAL)
GUNA
TEHRI GARHWAL
KHANDWA(EAST NIMAR)
PANNA
SAGAR
SHIVPURI

Evaluation study on Total Sanitation Campaign Page 7
Annex-2
Table: Involvement of Village Water Sanitation Committees in TSC Sl. No.
State
Total No. of selected
GPs have Village Level Water Sanitation Committees
Village Water Sanitation Committees involved:
District
Gram Panchayats
GPs takes issues related to TSC in each Gram Sabha meeting
Community participation and decision making in all campaign activities
Arranging community contributions
Procuring construction material from RSMs and Community Latrine complexes
In financial aspects of TSC which includes: Opening and Managing Bank accounts for depositing
Collection of funds for sanitation works and managing/ financing of O&M on a sustainable basis
1 2 3 4 5 6 7 8 9 10 11
1 Andhra Prad. 7 70 56 0 1 9 1 33 46
2 Assam 7 67 61 8 0 2 0 60 54 3 Bihar 7 70 37 4 8 17 7 0 37 4 Gujarat 7 70 68 3 1 26 2 63 48 5 Haryana 7 70 26 1 0 9 5 13 22 6 Jharkhand 6 60 48 0 1 26 9 7 39 7 Karnataka 7 70 61 0 0 15 9 9 60 8 Kerala 7 70 61 1 1 8 1 1 57
9 Madhya Prad. 7 70 64 39 0 16 2 19 64
10
Maharashtra 7 70 70 1 3 36 16 62 64
11 Orissa 7 70 29 5 0 4 0 15 26 12 Punjab 7 70 15 3 0 4 1 4 3 13 Rajasthan 7 70 70 0 0 2 0 0 63 14 Sikkim 2 20 19 4 0 4 2 16 18 15
Tamil Nadu 7 70 46 2 0 27 5 7 33
16
Uttar Pradesh 7 70 1 0 0 1 0 0 1
17
West Bengal 7 70 9 0 0 2 4 2 8
18 Manipur 2 20 11 0 0 2 1 6 10 19 Meghalaya 2 20 20 0 0 8 19 20 20 20
Uttarakhand 4 40 15 8 0 1 1 4 13
Total 121 1207 787 79 15 219 85 341 686
(%) [65.20] [10.04] [01.91] [27.83] [10.80] [43.33] [87.17]
Evaluation study on Total Sanitation Campaign Page 8
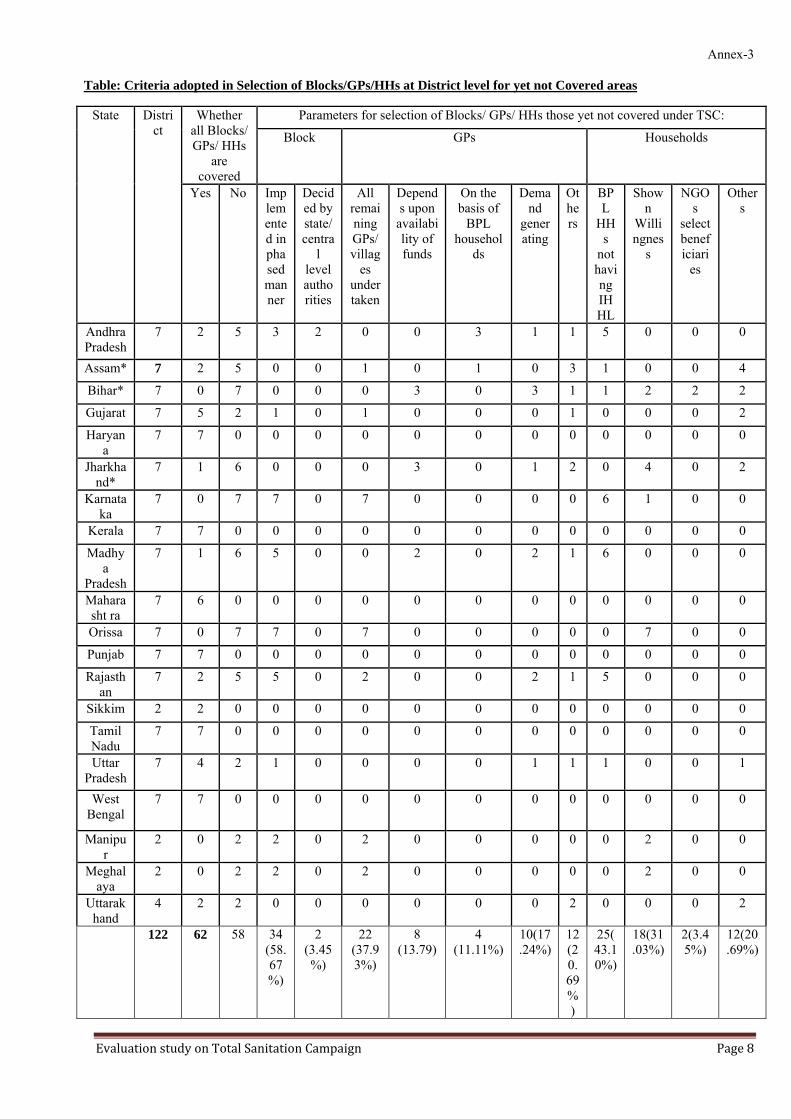
Annex-3
Table: Criteria adopted in Selection of Blocks/GPs/HHs at District level for yet not Covered areas
State District
Whether all Blocks/ GPs/ HHs
are covered
Parameters for selection of Blocks/ GPs/ HHs those yet not covered under TSC:
Block GPs Households
Yes No Implemented in phased manner
Decided by state/ centra
l level authorities
All remaining GPs/ villag
es undertaken
Depends upon
availability of funds
On the basis of
BPL househol
ds
Demand
generating
Others
BPL
HHs
not having IHHL
Shown
Willingnes
s
NGOs
select beneficiari
es
Others
Andhra Pradesh
7 2 5 3 2 0 0 3 1 1 5 0 0 0
Assam* 7 2 5 0 0 1 0 1 0 3 1 0 0 4
Bihar* 7 0 7 0 0 0 3 0 3 1 1 2 2 2
Gujarat 7 5 2 1 0 1 0 0 0 1 0 0 0 2
Haryana
7 7 0 0 0 0 0 0 0 0 0 0 0 0
Jharkhand*
7 1 6 0 0 0 3 0 1 2 0 4 0 2
Karnataka
7 0 7 7 0 7 0 0 0 0 6 1 0 0
Kerala 7 7 0 0 0 0 0 0 0 0 0 0 0 0
Madhya
Pradesh
7 1 6 5 0 0 2 0 2 1 6 0 0 0
Maharasht ra
7 6 0 0 0 0 0 0 0 0 0 0 0 0
Orissa 7 0 7 7 0 7 0 0 0 0 0 7 0 0
Punjab 7 7 0 0 0 0 0 0 0 0 0 0 0 0
Rajasthan
7 2 5 5 0 2 0 0 2 1 5 0 0 0
Sikkim 2 2 0 0 0 0 0 0 0 0 0 0 0 0
Tamil Nadu
7 7 0 0 0 0 0 0 0 0 0 0 0 0
Uttar Pradesh
7 4 2 1 0 0 0 0 1 1 1 0 0 1
West Bengal
7 7 0 0 0 0 0 0 0 0 0 0 0 0
Manipur
2 0 2 2 0 2 0 0 0 0 0 2 0 0
Meghalaya
2 0 2 2 0 2 0 0 0 0 0 2 0 0
Uttarakhand
4 2 2 0 0 0 0 0 0 2 0 0 0 2
122 62 58 34 (58.67%)
2 (3.45%)
22 (37.93%)
8 (13.79)
4 (11.11%)
10(17.24%)
12(20.69%)
25(43.10%)
18(31.03%)
2(3.45%)
12(20.69%)

Evaluation study on Total Sanitation Campaign Page 9
Annex-4
Maharashtra
ORGANISATIONAL CHART OF IMPLEMENTATION OF TSC IN THE DISTRICT
Gujarat
Education committee of
GP
Co-operative Society
Mahila Mandal
Health committee of
GP
Other CBOs
Village level NGOs
Woman SHGs Bhajani Mandal
Gram Panchayat
Yuvak Mandal VWSC of GP
Village level CBOs Community Based
Organisation
Beneficiary
Gram Panchayat
VWSC Village Water & Sanitation Committee
Samwad Sahayyak Gram Sevak
Anganwadi Worker M.P.W.
Multipurpose Worker
GRAMSABHA Women Gramsabha
PadaGramsabha
Village Level
BDO, Extn. Officer (VP) Ext. Officer (Health)
Block Committee (PS) Panchayat Samiti
Block Level
Dy. CEO (Jalswarajya) District Working Committee (TSC)
DWSC (ZP) District Water Sanitation Committee
District Level

Evaluation study on Total Sanitation Campaign Page 10
Gujrat
ORGANISATIONAL CHART OF IMPLEMENTATION OF TSC IN THE STATE The roles & responsibilities of various stakeholders and implementing agencies are shown in an Organogram given hereunder:
Uttarakhand
Ex-officio Members PS(RD), PS(PRI), Secretaries (WS), (Education),(Health), (Inf. & Tourism), (W&C dev) (GOI.rep.) (MD. GSRDC) ……………………………… COM rd. COM Wick COM helath, COM education, COM punch, UNICEF, CE&AS (WS), DIR Pri.. Ed. MD.GSRDC. ……………………………………… District panchayat Body, DDO, Dir DRDA, Dist. Inf Off, CDHO, Dist. ED Off, EE(ws) Ngo, ICDSO, Soc. Wel. Off. TSC Apo..
……………………………………
Taluka Punch body,
TDO, Mamlatdar,
POICDS, HO (health), DEE(ws), Ext.-Edu-Soc. Wel.-AE.
……………………………………..
Gram Punch. Body
Sarpanch, Three members, School head teacher, Ang. Worker, Chairman-Milk. Co-of-SHG, Puch. Secretary, Ngo.
Apex Authority (Policy, Guidance,
Review, Evaluation,
Modification)
State Sanitation Mission (Governing council)
Chair: Chief Secretary
NGOs & C.B.Os (Facilitation in
implementation)
C.C.D.U (Project Coordinator)
Project Communication &
Capacity Development Unit
Dist. Sanitation Committee
Project Implementation Chair:DDO
Implementation :DRDA (District Panchayat)
G.S.R.D.C. (Supportorg.) Implementation support to DRDA
Implementation Authority To Follow
instruction of central and state
Govt. Co.ordination of State
Departments, Guidance and
Review District.
State Sanitation Committee (Implementation and
Monitoring) Chair: Secretary (R.D.)
Village Sanitation Committee (Implementation) Chair : Sarpanch
(Gram Panchayat)
Taluka Sanitation Committee Taluka level Implementation & Monitoring of village activities
Chair:TDO (Taluka Panchayat)
NOTE: District Panchayat, Taluka Panchayat & Gram Panchayat will act as the governing body for programme implementation. Separate Bank Accounts at District, Taluka, Gram Panchayat level will be opened and operated for expenditure on project.

Evaluation study on Total Sanitation Campaign Page 11
Uttarakhand
Implementation Framework of TSC
Legends: FC: Finance Controller, JD: Joint Director, PO (C&A) Project Officer
(Contracts & Accounts)
DPMUs-13 Nos. Project Managers
Manager (Accounts) Consultants, DEO, Guard
Social Development
Unit JD (SD)
CDS DEO
M & E Unit Add. Dir.
MIS Asst. Prog.
DEO
Environment Unit
JD (Env.) Env. Specialist
Engineering Unit
JD(Eng) EC WQM Specialist
DEO
HRD Unit JD (HRD) WDS
DEO
Finance & Admn. Unit FC PO (C&A) MA
Asst. Accountant
DEO
Sanitation & Hygiene Unit JD
H&HS
CCDU State Coordinator - 1 PS-1, Steno-1, DEO-1 & Driver-1, Runner-4, Security
Guard-4
PMU Director
Vice Chairman Secretary, Drinking Water
Chairman Chief Secretary

Evaluation study on Total Sanitation Campaign Page 12
Jharkhand Organisational Chart for Implementation of TSC
User Groups
VWSC’sUser
Groups User Groups
Panchayat Coordinators
Village Motivators
Panchayat
User Groups
User Groups
User Groups
VWSC’s
Panchayat
State Level
Training arm of DWSD (Being strengthened)
Visvesvaraya Sanitation and Water Academy
State Water&
Sanitation Mission
Block Level
DWSC
• Headed by Block Development Officer & Junior Engineer being member Secretary.
• Responsible for Implementation & Monitoring
• Headed by Dy. Commissioner & Ex. Engineer being member Secretary
• Responsible for implementation & Monitoring
District Level
Paid output linked
honorarium for promotion & sanitation & constitution of
User Groups
Programme Management Unit
Cluster of Panchayat for taking up Social Mobilization & Programme Implementation through NGOs
• Equipped with District Coordinator & Data Entry Operator with support from TSC & Accountant on deputation form DWSD.
• District level core group to support DWSC & ensure coordination & monitoring.
BWSC Block Coordinator
District Support Unit
Training

Evaluation study on Total Sanitation Campaign Page 13
HARYANA
Organisational Chart of the Implementation of TSC at the State Level
Financial Commissioner & Principal Secretary to Govt.
Haryana, Development & Panchayats
Department
Gram Panchayats (Motivation/ Volunteers/
ASHA/AWW/other stakeholders
State Project Coordinator
Research Officer-1 Investigator-2 Assistants-2
Monitoring & Evaluation Cell
Joint / Special Secretary Development & Panchayats
Deputy Commissioner/ Addl. Commissioner-
cum-CEO DRDA

Evaluation study on Total Sanitation Campaign Page 14
MEGHALAYA
Organisational Chart of the Implementation of TSC in the state
R
E
P
O
R
T
I
N
G
F
E
E
D
B
A
C
K
SHG / NGOs
VILLAGE LEVEL SANITATION COMMITTEE HEADED BY VILLAGE HEADMAN
BLOCK LEVEL SANITATION COMMITTEE HEADED BY B.D.O.
DISTRICT WATER & SANITATION MISSION CHAIRMAN: DEPUTY COMMISSIONER
M.S.: SE PHE/EE PHE
THE COMMISSIONER & SECRETARY PHE DEPTT. GOVT. OF MEGHALAYA

Evaluation study on Total Sanitation Campaign Page 15
Sikkim
Organisational Chart of the Implementation Framework of TSC in the State
HEAD OFFICE
DISTRICT DEVELOPMENT OFFICERS (04)
UNDER SECRETARY (SANITATION)
DEPUTY SECRETARY (SANITATION)
ADDL. CHIEF ENGINEER RMDD
CHIEF ENGINEER RMDD
SECRETARY RMDD
GRAM PANCHAYAT REPRESENTATIVES
BLOCK DEVELOPMENT OFFICERS OF 27 BLOCKS
DISTRICT LEVEL

Evaluation study on Total Sanitation Campaign Page 16
Kerala
Organisational set up for TSC implementation
Government of India
State level Nodal AgencyKerala Sampoorna Swuchithuva Mission
State’s Share of TSC funds, Admn: Control
District Project Offices in all the 14 districts (District Coordinator and support staff)
Block Panchayats; IEC Activities, Coordination
Village Extension officer (Implementing Officer)
Beneficiaries of TSC
Grama Panchayat Committee Baseline Survey, IHHLs, School and Anganwadi toilets, CSC/WSC
Gramasabha Beneficiary Selection, IEC activities
Ward Sanitation Samathy Supervision of implementation
FUNDSFUNDS
FundsFunds
3. State Level Nodal AgencyAnd its linkages

Evaluation study on Total Sanitation Campaign Page 17
UTTAR PRADESH
Organisational Chart of the Implementation Framework of TSC in the state
Principal Secretary
Gram Panchayat
ADO (P)
ADPRO
District Panchayat Raj Officer (DPRO)
Dy. Director/ Nodal Officer (TSC)
Divisional Dy. Director
Director Director
Divisional Dy. Director
Dy. Director/ Nodal Officer (TSC)
District Panchayat Raj Officer (DPRO)
ADPRO
ADO (P)
Gram Panchayat

Evaluation study on Total Sanitation Campaign Page 18
BIHAR
ORGANISATIONAL CHART OF IMPLEMENTATION OF TSC IN THE STATE
STATE LEVEL
DISTRICT LEVEL
State Level Executive Committee State level Apex Committee (Governing Body)
BIHAR STATE WATER & SANITATION MISSION
PHED: Nodal Department
VWSC
BWSC
DWSC GOVERNING BODY
DWSM

Evaluation study on Total Sanitation Campaign Page 19
Odisha
Organisational Chart of Implementation Framework of TSC
Consultant / Institution Capacity Building
Consultant / Institution Communication
Support Staff DEO-2, MPA-3
Consultant / Institution Monitoring
Addl. Member Secretary, OSWSM, Cum Director, CCDU
State Advisory Committee
KRC
Secretary R.D. Department
Member Secretary, OSWSM
Chief Secretary Chairperson OSWSM
(Governing body of OSWSM)

Evaluation study on Total Sanitation Campaign Page 20
TAMILNADU
Organisational Chart of the Implementation Framework of TSC in the state
DIRECTOR (HEAD OF THE DEPARTMENT)
SUPERINTENDENT WITH A ASSISTANT (SECTION)
ASSISTANT DIRECTOR
ADDITIONAL DIRECTOR (STATE COORDINATOR)

Evaluation study on Total Sanitation Campaign Page 21
STATE WATER AND SANITATION MISSION
ANDHRA PRADESH
Organisational Chart of the Implementation Framework of TSC in the state
DISTRICT SUPPORT UNIT
HABITATION LEVEL WATER AND SANITATION COMMITTEE
HABITATION LEVEL WATER AND SANITATION GROUP
GP LEVEL WATER AND SANITATION COMMITTEE
MANDAL LEVEL WATER AND SANITATION COMMITTEE
DISTRICT WATER AND SANITATION COMMITTEE
DISTRICT WATER AND SANITATION MISSION
COMMUNICATION & CAPACITY DEVELOPMENT UNIT
PROJECT MONITORING UNIT

Evaluation study on Total Sanitation Campaign Page 22
ASSAM
ORGANISATIONAL CHART OF IMPLEMENTATION OF TSC
STATE LEVEL
STATE WATER SANITATION MISSION (Apex Body at State Level)
Chaired by: Chief Secretary, Govt. of Assam (Implementing Agency: PHE Department)
GRAM PANCHAYAT LEVEL WATER AND SANITATION COMMITTEE (GWSC) (for Gram Panchayat level within General/PRI Area)
Chaired by : President of respective G.P.
GRAM PANCHAYAT LEVEL
ANCHALIK PANCHAYAT (BLOCK) WATER AND SANITATION COMMITTEE (APWSC) (for Blocks of General/PRI Area)
Chaired by : President, Anchalik Panchayat of the Block concerned.
BLOCK LEVEL
DISTRICT WATER AND SANITATION COMMITTEE (DWSC) Chaired by : Deputy Commissioner of the district concerned
District Level
STATE LEVEL EXECUTIVE COMMITTEE (SLEC)Chaired by: Secretary, PHE Deptt., ASSAM
Members from: Panchayat & R.D. Deptt.
Health Services, Social Welfare, Elementary Education
DISTRICT WATER SANITATION MISSION (For districts of General/PRI Area)
Chaired by : President, Zilla Parishad, district concerned.

Evaluation study on Total Sanitation Campaign Page 23
MANIPUR
ORGANISATIONAL CHART OF IMPLEMENTATION OF TSC
STATE LEVEL
MANIPUR STATE LEVEL WATER AND SANITARY MISSION (MSWSM)
Chaired by: Chief Secretary/Additional Chief Secretary Nodal Secretary: Commissioner/ Secretary (PHE)
STATE LEVEL EXECUTIVE COMMITTEE Chaired by: Commissioner/ Secretary (PHE)
Members from: Health Deptt, RD & PR, Education Deptt., Social Welfare Deptt. Etc.

Evaluation study on Total Sanitation Campaign Page 24
Institutional Set up of TSC in West Bengal
State Water & Sanitation Cell Nodal Deptt: Panchayat and Rural
Development Department
Zila Parishad District Administration Sub-Divisional Officer (SDO)
NGO
Panchayat Samiti
Gram Sansad
Deputy Magistrate
Block Development Officer
Cluster Organisation (Rural Sanitary Mart)
Village Based Youth Clubs/Sankirtan Group/
Motivator
Households

Evaluation study on Total Sanitation Campaign Page 25
Flow of funds from centre to grass root level: RAJASTHAN
CENTRE
BLOCK: BWSC
GRAM PANCHAYAT/NGO
BENEFICIARY
DISTRICT: DWSC
STATE

Evaluation study on Total Sanitation Campaign Page 26
Flow of funds from centre to grass root level: Uttarakhand
Village Education Committee Beneficiary
District Education Officer to School Toilet
District Programme Officer to Anganwadi Toilet
GP
DPMU
PMU
StateCentre

Evaluation study on Total Sanitation Campaign Page 27
Water Supply and Sanitation Department: Maharashtra
Flow of Funds for TSC Project
Gram Panchayat
Zilla Parishad
State Government (CCDU)
(from 2009 onwards)
Central Government

Evaluation study on Total Sanitation Campaign Page 28
Annex-5
Table: Availability and functionality of RSM/PC
States No. of RSM opened
No. of RSM functional
No. of PC opened
No. of PC fundtional
Total number of RSM opened in the selected districts
Total number of RSM functional in the selected districts
Total number of PC opened in the selected districts
Total number of PC functional in the selected districts
Pecentage of Selected Gram Pachyats reported availability of RSM/PC
Pecentage of Selected Households reported availability of RSM/PC
Andhra Pradesh
418 NIL 23 NIL 18 15 NIL NIL 1% .6%
Assam 58 58 122 122 8 3 6 1 2% .1%
Bihar 380 380 689 689 1 1 160 92 93% 99.9%
Gujarat 405 NA NIL NIL 74 3 NIL NIL 4% 3.4%
Haryana 85 15 85 15 12 2 2 2 14% 14.4%
Jharkhand 224 224 490 490 4 1 184 144 100% 100.0%
Karnataka 208 198 16 10 31 9 2 NIL 17% 13.9%
Kerala 61 49 24 17 29 10 5 2 3% 4.3%
Madhya Pradesh
354 NA 28 NA 24 5 2 NIL 1% 4.3%
Maharashtra 1435 719 48 NA 158 114 19 1 59% 15.8% Orissa 274 274 712 712 NIL NIL 99 83 86% 95.6% Punjab 7 NA NA NA NIL NIL NIL NIL 1% .0% Rajasthan 177 NA 32 NA 61 1 18 1% .4% Sikkim NIL NIL NIL NIL NIL NIL NIL NIL 0% 1.0%
Tamilnadu 1543 154 NA NA 51 15 13 9 6% 1.9%
Uttar Pradesh
243 168 74 NA 33 13 3 3 14% 27.6%
West Bengal
338 NA 338 NA 114 113 221 221 100% 100.0%
Manipur NIL NIL 11 5 NIL NIL 7 6 20% 95.0%
Meghalaya 36 23 NIL NIL NIL NIL NIL NIL 0% .0%
Uttarakhand 24 24 1 1 NIL NIL NIL NIL 0% .0%
Total 6270 2286 2693 2061 618 305 741 564 29% 31.60%

Evaluation study on Total Sanitation Campaign Page 29
Annex- 6
Table: Operation and maintenance of RSM/PC
States Operation and maintenance of RSM Operation and maintenance of PC No Information
SHG NGO Panchayat Govt. Others No Information
SHG NGO Women's Organsiation
Panchayat Govt. Others
Andhra Pradesh
100% 100%
Assam 50% 50% 17% 17% 50% 17%
Bihar 93% 7% 7% 79% 7% 7%
Gujarat 17% 42% 17% 17% 8% 100%
Haryana 50% 50% 50% 50%
Jharkhand 100% 86% 14%
Karnataka 13% 75% 13% 100%
Kerala 17% 67% 17% 100%
Madhya Pradesh
75% 25%
Maharashtra 8% 83% 8% 100%
Orissa 100% 14% 71% 14%
Punjab
Rajasthan 100%
Sikkim
Tamilnadu 100% 14% 86%
Uttar Pradesh
80% 20% 60% 20% 20%
West Bengal
100% 7% 93%
Manipur 100% 100%
Meghalaya 100% 100%
Uttarakhand
Total 39.5% 9.7% 29.8% 13.7% 3.2% 4.0% 27.2% 3.9% 60.2% 1.0% 1.0% 1.0% 5.8%

Evaluation study on Total Sanitation Campaign Page 30
Annex- 7
Table: Coverage by RSM/PC
States
Coverage of RSM and PC Loacation of RSM/PC (from the selected household)
Number of Villages covered by a RSM
Number of Villages covered by a PC
Information not available
Within 2 Km
2-5 KMs
5-10 KMs
Above 10 Kms
Mean Maximum Minimum Mean Maximum Minimum Andhra Pradesh 23 29 16 . . . 50% 25% 25% 0% 0%
Assam 69 160 20 71 160 12 100% 0% 0% 0% 0%
Bihar 25 25 25 19 95 4 0% 57% 33% 9% 0%
Gujarat 24 131 1 . . . 21% 0% 0% 53% 26%
Haryana 23 25 21 23 25 21 1% 9% 1% 21% 68%
Jharkhand . . . 50 137 4 0% 71% 21% 6% 1%
Karnataka 47 85 6 73 85 60 2% 0% 0% 29% 69%
Kerala 3 8 1 . . . 33% 0% 43% 20% 3%
Madhya Pradesh 42 86 18 . . . 0% 0% 33% 33% 33%
Maharashtra 63 142 1 . . . 0% 7% 2% 21% 70%
Orissa . . . 20 100 3 0% 76% 17% 3% 3%
Punjab . . . . . . 0% 0% 0% 0% 0%
Rajasthan 6 6 6 . . . 100% 0% 0% 0% 0%
Sikkim . . . . . . 100% 0% 0% 0% 0%
Tamilnadu 78 237 4 88 195 4 54% 38% 0% 0% 8%
Uttar Pradesh 96 206 25 19 20 18 1% 0% 1% 16% 83%
West Bengal 135 490 6 133 490 6 0% 15% 17% 35% 33%
Manipur . . . 14 25 5 0% 21% 8% 24% 47%
Meghalaya 80 80 80 . . . 0% 0% 0% 0% 0%
Uttarakhand . . . . . . 0% 0% 0% 0% 0%
Total 65 490 1 54 490 3 1% 44% 19% 15% 21%

Evaluation study on Total Sanitation Campaign Page 31
Annex-8
Table: Training of managers, signing of MOU and existence of quality certification
States
Managers have got training from the implementing agen (% of RSMs)
MOU was signed with the District Implementing Authority (% of RSMs)
Existence of quality certification process for the materials (% of RSMs)
Andhra Pradesh 50 50% 50%
Assam 0 14% 0%
Bihar 100 100% 93%
Gujarat 33 42% 42%
Haryana 50 100% 50%
Jharkhand 100 100% 93%
Karnataka 100 75% 0%
Kerala 67 67% 33%
Madhya Pradesh 25 100% 0%
Maharashtra 17 83% 33%
Orissa 29 14% 7%
Punjab 0 0% 0%
Rajasthan 100 100% 0%
Sikkim 0 0% 0%
Tamilnadu 57 43% 0%
Uttar Pradesh 100 20% 40%
West Bengal 93 36% 0%
Manipur 25 50% 0%
Meghalaya 0 0% 100%
Uttarakhand 0 0% 0%
Total 61 59% 34%

Evaluation study on Total Sanitation Campaign Page 32
Annex-9
Table: Amount of fund made available to RSM/PC
States
Total Amount ( in Rs.) of funds made available to the RSM
Total Amount (in Rs. of funds made available to the PC
Mean Maximum Minimum Standard Deviation Mean Maximum Minimum
Standard Deviation
Andhra Pradesh 102500 130000 75000 38891 . . . .
Assam 108333 200000 25000 87797 186500 330000 25000 153295
Bihar 373500 373500 373500 . 309396 815000 67600 238557
Gujarat 465407 2760320 28000 941202 . . . .
Haryana 568602 587204 550000 26307 443602 587204 300000 203084
Jharkhand . . . . 335689 1250000 61150 302130
Karnataka 90625 175000 50000 58962 . . . .
Kerala 259400 700000 147000 246306 . . . .
Madhya Pradesh . . . . . . . .
Maharashtra 214157 478150 10750 117477 . . . .
Orissa . . . . 88636 250000 15000 71871
Punjab . . . . . . . .
Rajasthan . . . . . . . .
Sikkim . . . . . . . .
Tamilnadu 193381 350000 100000 88008 247500 500000 100000 139059
Uttar Pradesh 334000 410000 300000 47223 300000 300000 300000
West Bengal 216350 426000 27000 106396 57830 57830 57830 .
Manipur . . . . 200000 300000 150000 70711
Meghalaya . . . . . . . .
Uttarakhand . . . . . . . .
All India 256614 2760320 10750 360563 251542 1250000 15000 221365

Evaluation study on Total Sanitation Campaign Page 33
Annex-10
Table: Availability and Utilization of funds (in Rs.) by the Rural Sanitary Marts and Production Centers
States
RSM PC Total fund
Fund used for the cosntruction of shed
Fund used for training of Masons, carpenters, technicians
Revolving fund
Any other utilisation of funds
Total fund
Fund used for the cosntruction of shed
Fund utilised for machinary and equipments
Fund used for training of Masons, carpenters, technicians
Revolving fund
Any other utilisation of funds
Mean Mean Mean Mean Mean Mean Mean Mean Mean Mean Mean Andhra Pradesh 102500 25000 65000 . . . . . . . .
Assam 108333 107350 10000 21000 26650 186500 140000 40900 . 68400 .
Bihar 373500 20000 . . . 309396 83429 174496 15667 71667 128000
Gujarat 465407 . 80000 1420160 114276 . . . . . .
Haryana 568602 175070 35339 193725 258000 443602 175070 18500 35339 193725 135500
Jharkhand . . . . . 335689 43208 59519 5286 110556 239000
Karnataka 90625 100000 . 60500 40500 . . . . . .
KERALA 259400 . 240000 173250 88000 . . . . . .
Madhya Pradesh . . . . . . . . . . .
Maharashtra 214157 . . 166222 156043 . . . . . .
Orissa . . . . . 88636 109167 61349 15750 . 181400
Punjab . . . . . . . . . . .
Rajasthan . . . . . . . . . . .
Sikkim . . . . . . . . . . .
Tamilnadu 193381 25000 23125 112234 130000 247500 68333 55000 58000 410500 102833
Uttar Pradesh 334000 250748 10000 47250 83500 300000 250000 . . 50000 .
West Bengal 216350 86439 22335 98588 62947 57830 . 50800 7030 . .
Manipur . . . . . 200000 70000 24713 . 45750 8000
Meghalaya . . . . . . . . . . .
Uttarakhand . . . . . . . . . . .
All India 256614 115490 43050 186131 103141 251542 89261 80874 19522 141070 140606

Evaluation study on Total Sanitation Campaign Page 34
Annex- 11
Table: Return of revolving fund, repair and maintenance and capacity to operate independently by the RSM/PC
State Revolving fund has not been returned by the RSM
Revolving fund has not been returned by the PC
Can operate independently without any govt. grant
Repair and Maintenance Services after construction
Andhra Pradesh
0% 0% 0% 100%
Assam 25% 50% 100% 0%
Bihar 0% 43% 29% 0% Gujarat 60% 0% 29% 0% Haryana 50% 50% 0% 50% Jharkhand 0% 10% 31% 0% Karnataka 100% 0% 0% 25% Kerala 67% 0% 0% 0% Madhya Pradesh 0% 0% 0% 25%
Maharashtra 100% 0% 0% 8%
Orissa 0% 100% 0% 0% Punjab 0% 0% 0% 0% Rajasthan 0% 0% 100% 0% Sikkim 0% 0% 0% 0% Tamilnadu 86% 57% 50% 71% Uttar Pradesh 100% 40% 0% 40%
West Bengal 86% 0% 25% 57% Manipur 0% 25% 0% 0% Meghalaya 0% 0% 0% 0% Uttarakhand 0% 0% 0% 0% Total 42% 24% 22% 17%

Evaluation study on Total Sanitation Campaign Page 35
Annex-12
Table: Production and profit by the RSM/PC
States Avg. No. of toilets manufactured in 2004 by a PC
Average profit (%) earned by a PC by manufacturing toilets in 2004
Avg. No. of toilets manufactured in 2005 by a PC
Average profit (% ) earned by a PC by manufacturing toilets in 2005
Avg. No. of toilets manufactured in 2006 by a PC
Average profit (% ) earned by a PC by manufacturing toilets in 2006
Avg. No. of toilets manufactured in 2007 by a PC
Average profit (% ) earned by a PC by manufacturing toilets in 2007
Avg. No. of toilets manufactured in 2008 by a PC
Average profit (% ) earned by a PC by manufacturing toilets in 2008
Andhra Pradesh . . . . . . . . . .
Assam . . . . . . . . . . Bihar 1500 25.00 2500 0.81 1011 14.29 868 7.39 744 3.85
Gujarat . . . . . . . . . . Haryana 1430 9.96 150 10.34 315 5.49 365 10.81 86 14.00 Jharkhand 300 25.00 300 12.50 503 15.42 970 11.45 935 5.26 Karnataka . . . . . . . . . .
KERALA . . . . . . . . . . Madhya Pradesh . . . . . . . . . .
Maharashtra . . . . . . . . . .
Orissa 500 6.38 777 6.40 368 11.09 287 9.40 219 7.81
Punjab . . . . . . . . . .
Rajasthan . . . . . . . . . .
Sikkim . . . . . . . . . .
Tamilnadu 1180 8.81 1601 8.70 2024 8.69 1336 8.40 1414 8.89
Uttar Pradesh 438 16.00 581 22.48 . . . . . .
West Bengal 2746 11.06 2425 11.28 2706 15.54 3990 12.23 1068 11.63
Manipur . . 400 0 350 1.43 245 2.10 183 1.40
Meghalaya . . . . . . . . . .
Uttarakhand . . . . . . . . Total 1889 12.67 1647 10.64 1366 12.69 1509 9.44 721 6.95

Evaluation study on Total Sanitation Campaign Page 36
Annex-13
Table: Return of revolving fund, repair and maintenance and capacity to operate independently by the RSM/PC
State
Revolving fund has been returned by the RSM
Revolving fund has been returned by the PC
Can operate independently without any govt. grant
Repair and Maintenance Services after construction
Andhra Pradesh 100.0% .0% .0% 100.0%
Assam .0% .0% 100.0% .0%
Bihar .0% 50% 28.6% .0%
Gujarat 20.0% .0% 28.6% .0%
Haryana 50.0% 50.0% .0% 50.0%
Jharkhand .0% 100% 30.8% .0%
Karnataka .0% .0% .0% 25.0%
KERALA 16.7% .0% .0% .0%
Madhya Pradesh .0% .0% .0% 25.0%
Maharashtra .0% .0% .0% 8.3%
Orissa .0% .0% .0% .0%
Punjab .0% .0% .0% .0%
Rajasthan .0% .0% 100.0% .0%
Sikkim .0% .0% .0% .0%
Tamilnadu 14.3% 28.6% 50.0% 71.4%
Uttar Pradesh .0% .0% .0% 40.0%
West Bengal .0% .0% 25.0% 57.1%
Manipur .0% 75.0% .0% .0%
Meghalaya .0% .0% .0% .0%
Uttarakhand .0% .0% .0% .0%
Total 5.8% 22.2% 22.0% 16.9

Evaluation study on Total Sanitation Campaign Page 37
Annex- 14
Table: Nodal Agency
State Nodal Agency
Distri ct Rural Devel
opme nt Agency
BDO/ Taluka
Panchay at
Direc tor Pan
chay ati Raj
Distri ct
Water and
Sanita tion
Depar tment
Wat er and Sani
tation Miss ion
Pro ject Man agem ent
Unit
Rural Water Suppl y and Sanita
tion
State Samp oorna Swich ithuva
Arogy a Miss ion
Public Health Engin eering Depar tment
(PHED)
Zilla Pari sad
Others
Andhra Pradesh [00.00] [00.00] [00.00] [00.00] [00.00] [00.00] [98.57] [00.00] [00.00] [00.00] [00.00] Assam [00.00] [00.00] [00.00] [00.00] [00.00] [00.00] [00.00] [00.00] [94.03] [00.00] [05.97] Bihar [00.00] [00.00] [00.00] [00.00] [00.00] [00.00] [00.00] [00.00] [97.14] [00.00] [02.86] Gujarat [100.00] [00.00] [00.00] [00.00] [00.00] [00.00] [00.00] [00.00] [00.00] [00.00] [00.00] Haryana [57.14] [00.00] [42.86] [00.00] [00.00] [00.00] [00.00] [00.00] [00.00] [00.00] [00.00] Jharkhand [00.00] [00.00] [00.00] [91.67] [00.00] [00.00] [00.00] [00.00] [08.33] [00.00] [00.00] Karnataka [00.00] [100.00] [00.00] [00.00] [00.00] [00.00] [00.00] [00.00] [00.00] [00.00] [00.00] Kerala [00.00] [00.00] [00.00] [00.00] [00.00] [00.00] [00.00] [100.00] [00.00] [00.00] [00.00] Madhya Pradesh [00.00] [00.00] [00.00] [00.00] [00.00] [00.00] [00.00] [00.00] [00.00] [100.00] [00.00] Maharashtra [00.00] [00.00] [00.00] [00.00] [00.00] [00.00] [00.00] [00.00] [00.00] [100.00] [00.00] Orissa [00.00] [00.00] [00.00] [00.00] [100.00] [00.00] [00.00] [00.00] [00.00] [00.00] [00.00] Punjab [00.00] [00.00] [00.00] [07.14] [15.71] [00.00] [75.71] [00.00] [00.00] [00.00] [00.00] Rajasthan [00.00] [00.00] [00.00] [30.00] [00.00] [00.00] [00.00] [00.00] [00.00] [00.00] [70.00] Sikkim [95.00] [00.00] [00.00] [00.00] [00.00] [00.00] [00.00] [00.00] [00.00] [05.00] [00.00] Tamil Nadu [100.00] [00.00] [00.00] [00.00] [00.00] [00.00] [00.00] [00.00] [00.00] [00.00] [00.00] Uttar Pradesh [05.71] [01.43] [92.86] [00.00] [00.00] [00.00] [00.00] [00.00] [00.00] [00.00] [00.00] West Bengal [00.00] [87.14] [00.00] [00.00] [00.00] [00.00] [00.00] [00.00] [00.00] [00.00] [11.43] Manipur [00.00] [00.00] [00.00] [00.00] [00.00] [00.00] [00.00] [00.00] [100.00] [00.00] [00.00] Meghalaya [00.00] [00.00] [00.00] [00.00] [00.00] [00.00] [00.00] [00.00] [100.00] [00.00] [00.00] Uttarakhand [22.50] [00.00] [00.00] [00.00] [00.00] [77.50] [00.00] [00.00] [00.00] [00.00] [00.00] Total [17.56] [10.94] [07.87] [06.71] [06.71] [02.57] [10.11] [05.80] [14.58] [11.68] [05.22]

Evaluation study on Total Sanitation Campaign Page 38
Annex-15
Table: Implementing Agency
State
Implementing Agency
Gram Pan cha yat
Distr ict Proj ect Man age ment Unit
Distri ct Rural Devel opme nt Agenc y(DRDA) NGOs
Self Help Gro ups (SHGs)
Rural Water Suppl y and Sanita tion (RSWW)
Bloc k Deve lopm ent Offi ce
Rur al San itary Mar t Others
1 2 3 4 5 6 7 8 9 10
Andhra Pradesh [01.43] [00.00] [00.00] [00.00] [00.00] [94.29] [01.43] [01.43] [00.00] Assam [00.00] [00.00] [00.00] [00.00] [00.00] [00.00] [00.00] [00.00] [100.00] Bihar [02.86] [00.00] [00.00] [84.29] [01.43] [00.00] [00.00] [00.00] [11.43] Gujarat [100.00] [00.00] [00.00] [00.00] [00.00] [00.00] [00.00] [00.00] [00.00] Haryana [15.71] [41.43] [00.00] [00.00] [00.00] [00.00] [40.00] [00.00] [02.86] Jharkhand [00.00] [00.00] [00.00] [98.33] [00.00] [00.00] [00.00] [00.00] [01.67] Karnataka [100.00] [00.00] [00.00] [00.00] [00.00] [00.00] [00.00] [00.00] [00.00] Kerala [100.00] [00.00] [00.00] [00.00] [00.00] [00.00] [00.00] [00.00] [00.00] Madhya Pradesh [100.00] [00.00] [00.00] [00.00] [00.00] [00.00] [00.00] [00.00] [00.00]
Maharashtra [100.00] [00.00] [00.00] [00.00] [00.00] [00.00] [00.00] [00.00] [00.00] Orissa [15.71] [00.00] [00.00] [51.43] [11.43] [04.29] [00.00] [00.00] [17.14] Punjab [00.00] [00.00] [00.00] [00.00] [00.00] [98.57] [00.00] [00.00] [00.00] Rajasthan [01.43] [00.00] [00.00] [00.00] [00.00] [28.57] [00.00] [00.00] [70.00] Sikkim [95.00] [00.00] [00.00] [00.00] [00.00] [00.00] [00.00] [00.00] [05.00] Tamil Nadu [00.00] [00.00] [00.00] [00.00] [00.00] [00.00] [100.00] [00.00] [00.00]
Uttar Pradesh [100.00] [00.00] [00.00] [00.00] [00.00] [00.00] [00.00] [00.00] [00.00]
West Bengal [00.00] [00.00] [00.00] [00.00] [00.00] [00.00] [00.00] [98.57] [00.00] Manipur [05.00] [00.00] [00.00] [85.00] [00.00] [00.00] [00.00] [00.00] [10.00] Meghalaya [00.00] [00.00] [00.00] [00.00] [00.00] [00.00] [00.00] [00.00] [100.00] Uttarakhand [25.00] [75.00] [00.00] [00.00] [00.00] [00.00] [00.00] [00.00] [00.00] Total [39.44] [04.89] [00.00] [14.17] [00.75] [13.09] [08.20] [05.80] [13.42]
Evaluation study on Total Sanitation Campaign Page 39
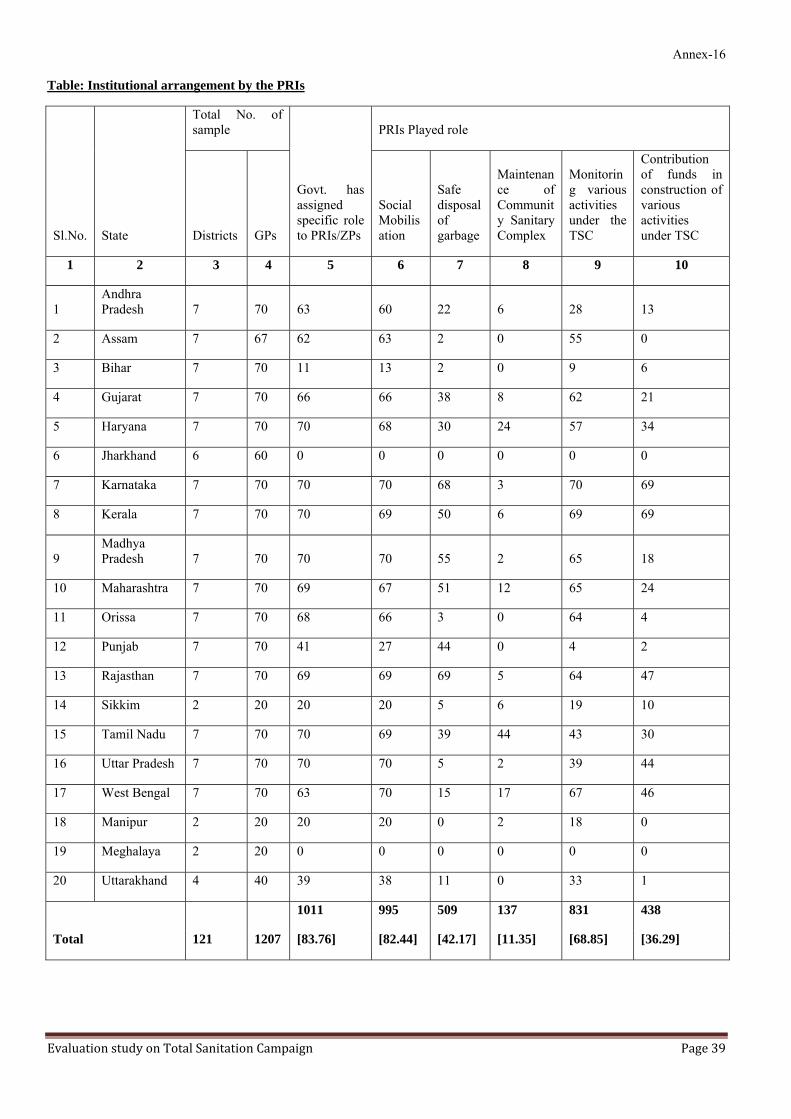
Annex-16
Table: Institutional arrangement by the PRIs
Sl.No. State
Total No. of sample
Govt. has assigned specific role to PRIs/ZPs
PRIs Played role
Districts GPs
Social Mobilisation
Safe disposal of garbage
Maintenance of Community Sanitary Complex
Monitoring various activities under the TSC
Contribution of funds in construction of various activities under TSC
1 2 3 4 5 6 7 8 9 10
1 Andhra Pradesh 7 70 63 60 22 6 28 13
2 Assam 7 67 62 63 2 0 55 0
3 Bihar 7 70 11 13 2 0 9 6
4 Gujarat 7 70 66 66 38 8 62 21
5 Haryana 7 70 70 68 30 24 57 34
6 Jharkhand 6 60 0 0 0 0 0 0
7 Karnataka 7 70 70 70 68 3 70 69
8 Kerala 7 70 70 69 50 6 69 69
9 Madhya Pradesh 7 70 70 70 55 2 65 18
10 Maharashtra 7 70 69 67 51 12 65 24
11 Orissa 7 70 68 66 3 0 64 4
12 Punjab 7 70 41 27 44 0 4 2
13 Rajasthan 7 70 69 69 69 5 64 47
14 Sikkim 2 20 20 20 5 6 19 10
15 Tamil Nadu 7 70 70 69 39 44 43 30
16 Uttar Pradesh 7 70 70 70 5 2 39 44
17 West Bengal 7 70 63 70 15 17 67 46
18 Manipur 2 20 20 20 0 2 18 0
19 Meghalaya 2 20 0 0 0 0 0 0
20 Uttarakhand 4 40 39 38 11 0 33 1
Total 121 1207
1011 995 509 137 831 438
[83.76] [82.44] [42.17] [11.35] [68.85] [36.29]

Evaluation study on Total Sanitation Campaign Page 40
Annex-17
Table: Village Water and Sanitation Committee
State Total no.
of sample GPs
GPs have
Village Level Water Sanitat
ion Commi
ttees
Village Water Sanitation Committees involved
GPs takes issues
related to TSC in each Gram Sabha meetin
g
Community
participation
and decisio
n makin
g
Arranging
community
contributions
Opening and
Managing
Bank accounts for
depositing
Procuring
construction material for RSMs
and CSC
Collection of funds throug
h a tariff
system for
O&M
Managing and
Financing of O&M
Empowering women in the
sanitation
related decisio
ns
Awareness and IEC
campaigns
Andhra Pradesh 70 56 0 1 9 33 1 45 1 0 0
Assam 67 61 8 0 2 60 0 54 0 0 0
Bihar 70 37 4 8 17 0 7 25 12 0 0
Gujarat 70 68 3 1 26 63 2 26 22 0 0
Haryana 70 26 1 0 9 13 5 22 0 0 0
Jharkhand 60 48 0 1 26 7 9 30 9 0 0
Karnataka 70 61 0 0 15 9 9 60 0 0 0
Kerala 70 61 1 1 8 1 1 52 5 0 0
Madhya Pradesh 70 64 39 0 16 19 2 63 1 0 0
Maharashtra 70 70 1 3 36 62 16 64 0 0 0
Orissa 70 29 5 0 4 15 0 26 0 0 0
Punjab 70 15 3 0 4 4 1 3 0 0 0
Rajasthan 70 70 0 0 2 0 0 63 0 0 0
Sikkim 20 19 4 0 4 16 2 18 0 0 0
Tamil Nadu 70 46 2 0 27 7 5 31 2 0 0
Uttar Pradesh 70 1 0 0 1 0 0 1 0 0 0
West Bengal 70 9 0 0 2 2 4 8 0 0 0
Manipur 20 11 0 0 2 6 1 10 0 0 0
Meghalaya 20 20 0 0 8 20 19 20 0 0 0
Uttarakhand 40 15 8 0 1 4 1 13 0 0 0
Total 1207
787 79 15 219 341 85 634 52 0 0
[65.20] [06.55] [01.24] [18.14] [28.25] [07.04] [52.53] [04.31] [00.00] [00.00]

Evaluation study on Total Sanitation Campaign Page 41
Annex-18
Table: Social Profile of selected Households
Sl. No.
State
Beneficiaries
Social category Family type Av. No of Family Members SC ST O B C Others Joint Nuclear
1 2 3 4 5 6 7 8 9 10 1 Andhra Pradesh 700 153 90 342 114 79 614 4
87.71% 2 Assam 689 76 154 140 319 227 460 5
66.76% 3 Bihar 700 180 0 358 162 228 472 5
67.43% 4 Gujarat 700 95 88 365 152 275 425 5
60.71% 5 Haryana 700 364 2 229 104 223 473 5
67.57% 6 Jharkhand 700 102 139 403 56 233 467 5
66.71% 7 Karnataka 700 122 30 16 528 165 534 5
76.29% 8 Kerala 700 136 7 425 132 246 453 4
64.71%9 Madhya Pradesh 700 269 148 222 61 124 576 4
82.29% 10 Maharashtra 700 116 47 362 175 199 501 5
71.57%11 Orissa 700 112 75 419 94 99 601 5
85 86%12 Punjab 30 27 0 3 0 14 16 6
53.33% 13 Rajasthan 700 310 79 254 57 4 696 5
99.43% 14 Sikkim 200 12 98 66 24 39 161 5
80.50% 15 Tamil Nadu 700 162 1 524 13 163 537 4
76.71% 16 Uttar Pradesh 700 389 3 227 81 105 595 5
85.00% 17 West Bengal 700 308 41 41 308 129 570 5
81 43%18 Manipur 200 0 3 62 135 27 173 6
86.50% 19 Meghalaya 200 1 191 8 0 28 172 6
86 00%20 Uttarakhand 400 140 3 59 198 104 293 5
73 25% Total 11519 3074 1199 4525 2713 2711 8789 5
Coefficient of variation across states 81.89 217.20 54.07 92.65 47.62 14.68 12.10
Source: Household Level Data. Coefficient of Variation based on percentage values.

Evaluation study on Total Sanitation Campaign Page 42
Annex-19
Table: Educational Profile of selected Households
Sl. No. State
Number of family members
Educational Qualification
Illiterate Primary Upper- Primary
High- School
Higher- Secondary & Above
Unschooled literates
1 Andhra Pradesh 2632 1040 512 385 387 294 9 39.5% 77.3% 77.3% 77.3% 77.3% 77.3%
2 Assam 3543 823 841 599 877 166 7 23.2% 23.7% 16.9% 24.8% 4.7% 0.2%
3 Bihar 3510 967 1201 580 360 188 118 27.6% 34.2% 16.5% 10.3% 5.4% 3.4%
4 Gujarat 3526 574 1181 809 560 402 0 16.3% 33.5% 22.9% 15.9% 11.4% 0.0%
5 Haryana 3567 1458 960 579 348 200 22 40.9% 26.9% 16.2% 9.8% 5.6% 0.6%
6 Jharkhand 3705 1105 1197 625 366 205 130 29.8% 32.3% 16.9% 9.9% 5.5% 3.5%
7 Karnataka 3168 881 407 510 765 491 111 27.8% 12.9% 16.1% 24.2% 15.5% 3.5%
8 Kerala 3148 605 835 616 672 340 79 19.2% 26.5% 19.6% 21.4% 10.8% 2.5%
9 Madhya Pradesh 3069 1088 1157 672 129 16 7 35.5% 37.7% 21.9% 4.2% 0.5% 0.2%
10 Maharashtra 3596 538 1125 605 472 852 4 15.0% 31.3% 16.8% 13.1% 23.7% 0.1%
11 Orissa 3687 709 1150 513 942 366 6 19.2% 31.2% 13.9% 25.6% 9.9% 0.2%
12 Punjab 168 53 45 20 17 8 25 31.6% 26.8% 11.9% 10.1% 4.8% 14.9%
13 Rajasthan 3182 1764 667 421 182 124 24 55.4% 21.0% 13.2% 5.7% 3.9% 0.8%
14 Sikkim 912 166 296 188 123 73 40 18.2% 32.5% 20.6% 13.5% 8.0% 4.4%
15 Tamil Nadu 2842 745 595 484 495 520 3 26.2% 20.9% 17.0% 17.4% 18.3% 0.1%
16 Uttar Pradesh 3721 2016 681 549 222 244 9 54.2% 18.3% 14.8% 6.0% 6.6% 0.2%
17 West Bengal 3195 775 1006 624 457 138 157 24.3% 31.5% 19.5% 14.3% 4.3% 4.9%
18 Manipur 1109 217 248 108 361 156 19 19.6% 22.4% 9.7% 32.6% 14.1% 1.7%
19 Meghalaya 1115 254 428 141 222 67 3 22.8% 38.4% 12.7% 19.9% 6.0% 0.3%
20 Uttarakhand 2154 1028 374 353 178 162 4 47.7% 17.4% 16.4% 8.3% 7.5% 0.2%
Total 55549 16806 14906 9381 8135 5012 777 30.3% 26.8% 16.9% 14.6% 9.0% 1.4%
Coefficient of Variation across states 40.30 26.83 19.77 52.32 62.25 245.05
Evaluation study on Total Sanitation Campaign Page 43
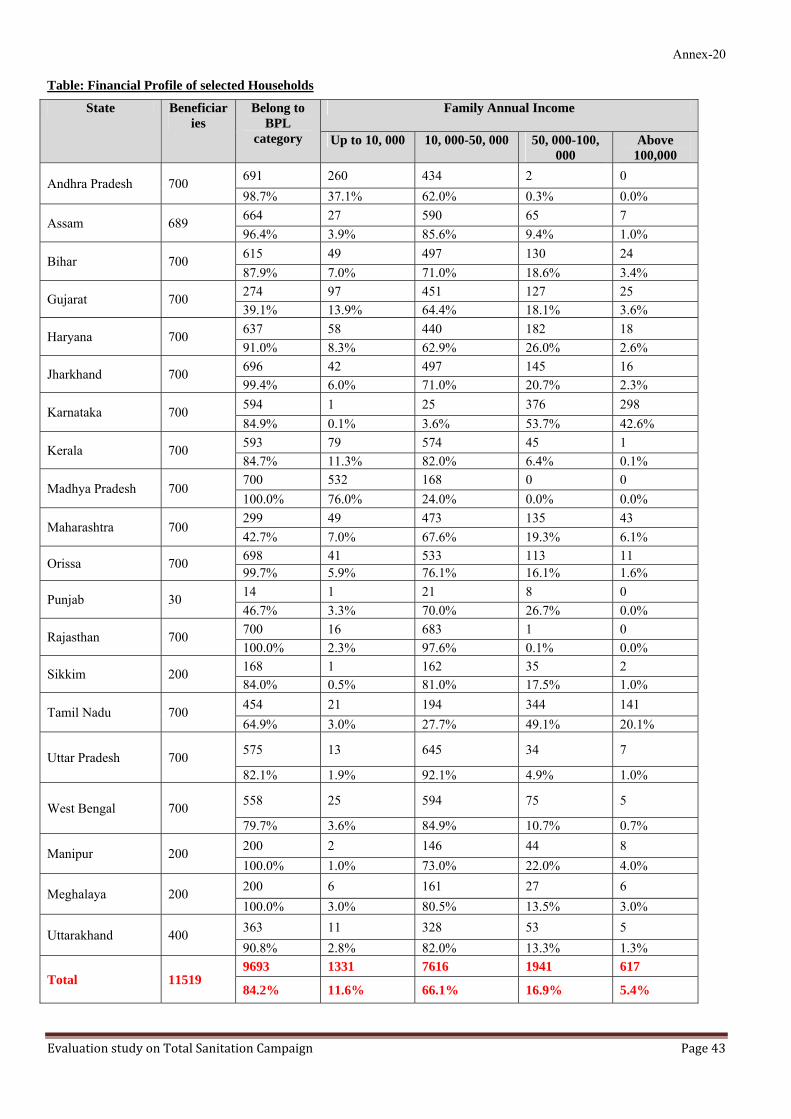
Annex-20
Table: Financial Profile of selected Households
State Beneficiaries
Belong to BPL
category
Family Annual Income
Up to 10, 000 10, 000-50, 000 50, 000-100, 000
Above 100,000
Andhra Pradesh 700 691 260 434 2 0 98.7% 37.1% 62.0% 0.3% 0.0%
Assam 689 664 27 590 65 7 96.4% 3.9% 85.6% 9.4% 1.0%
Bihar 700 615 49 497 130 24 87.9% 7.0% 71.0% 18.6% 3.4%
Gujarat 700 274 97 451 127 25 39.1% 13.9% 64.4% 18.1% 3.6%
Haryana 700 637 58 440 182 18 91.0% 8.3% 62.9% 26.0% 2.6%
Jharkhand 700 696 42 497 145 16 99.4% 6.0% 71.0% 20.7% 2.3%
Karnataka 700 594 1 25 376 298 84.9% 0.1% 3.6% 53.7% 42.6%
Kerala 700 593 79 574 45 1 84.7% 11.3% 82.0% 6.4% 0.1%
Madhya Pradesh 700 700 532 168 0 0 100.0% 76.0% 24.0% 0.0% 0.0%
Maharashtra 700 299 49 473 135 43 42.7% 7.0% 67.6% 19.3% 6.1%
Orissa 700 698 41 533 113 11 99.7% 5.9% 76.1% 16.1% 1.6%
Punjab 30 14 1 21 8 0 46.7% 3.3% 70.0% 26.7% 0.0%
Rajasthan 700 700 16 683 1 0 100.0% 2.3% 97.6% 0.1% 0.0%
Sikkim 200 168 1 162 35 2 84.0% 0.5% 81.0% 17.5% 1.0%
Tamil Nadu 700 454 21 194 344 141 64.9% 3.0% 27.7% 49.1% 20.1%
Uttar Pradesh 700 575 13 645 34 7
82.1% 1.9% 92.1% 4.9% 1.0%
West Bengal 700 558 25 594 75 5
79.7% 3.6% 84.9% 10.7% 0.7%
Manipur 200 200 2 146 44 8 100.0% 1.0% 73.0% 22.0% 4.0%
Meghalaya 200 200 6 161 27 6 100.0% 3.0% 80.5% 13.5% 3.0%
Uttarakhand 400 363 11 328 53 5 90.8% 2.8% 82.0% 13.3% 1.3%
Total 11519 9693 1331 7616 1941 617
84.2% 11.6% 66.1% 16.9% 5.4%

Evaluation study on Total Sanitation Campaign Page 44
Annex-21
Table: Occupational Profile of members of selected Households
Sl.No. Occupation
Unemployed retired/ ex-service/ pensioners
House-wife
student/ minor
salaried/ job earners
Agri-culture
Petty business others Total
%of working pop
1 2 3 4 5 6 7 8 9 10 11
1 Andhra Pradesh
333 99 697 938 377 112 76 2632 12.7% 3.8% 26.5% 35.6% 14.3% 4.3% 2.9% 57.1%
2 Assam 285 195 363 615 338 164 1583 3543 8% 5.5% 10.2% 17.4% 9.5% 4.6% 44.7% 58.9%
3 Bihar 163 522 1197 1108 195 138 187 3510 4.6% 14.9% 34.1% 31.6% 5.6% 3.9% 5.3% 46.4%
4 Gujarat 183 430 1173 1331 337 54 18 3526 5.2% 12.2% 33.3% 37.7% 9.6% 1.5% 0.5% 49.3%
5 Haryana 327 372 1391 1010 221 123 123 3567 9.2% 10.4% 39% 28.3% 6.2% 3.4% 3.4% 41.4%
6 Jharkhand 163 587 1341 993 251 134 236 3705 4.4% 15.8% 36.2% 26.8v 6.8% 3.6% 6.4% 43.6%
7 Karnataka 315 782 879 664 412 80 36 3168 9.9% 24.7% 27.7% 21v 13% 2.5% 1.1% 37.6%
8 Kerala 553 442 872 1157 29 53 42 3148 17.6% 14% 27.7% 36.8% 0.9% 1.7% 1.3% 40.7%
9 Madhya Pradesh
1537 0 0 1169 327 32 4 3069 50.1% 0 0% 38.1% 10.7% 1% 0.1% 49.9%
10 Maharashtra 284 491 1175 924 604 87 31 3596 7.9% 13.7% 32.7% 25.7% 16.8% 2.4% 0.9% 45.8%
11 Orissa 65 149 453 173 46 164 59 1109 5.9% 13.4% 40.8% 15.6% 4.1% 14.8% 5.3% 39.9%
12 Punjab 132 33 411 399 103 13 24 1115 11.8% 3% 36.9% 35.8% 9.2% 1.2% 2.2% 48.3%
13 Rajasthan 491 613 886 983 269 189 256 3687 13.3% 16.6% 24% 26.7% 7.3% 5.1% 6.9% 46%
14 Sikkim 6 28 67 46 2 13 6 168 3.6% 16.7% 39.9% 27.4% 1.2% 7.7% 3.6% 39.9%
15 Tamil Nadu 24 118 1133 1518 187 58 144 3182 0.8% 3.7% 35.6% 47.7% 5.9% 1.8% 4.5% 59.9%
16 Uttar Pradesh 39 68 310 110 338 21 26 912 4.3% 7.5% 34% 12.1% 37.1% 2.3% 2.9% 53.5%
17 West Bengal 559 186 620 1145 222 80 30 2842 19.7% 6.5% 21.8% 40.3% 7.8% 2.8% 1.1% 52%
18 Manipur 80 633 1462 1023 242 46 235 3721 2.1% 17% 39.3% 27.5% 6.5% 1.2% 6.3% 41.5%
19 Meghalaya 80 193 759 570 81 34 437 2154 3.7% 9% 35.2% 26.5% 3.8% 1.6% 20.3% 49.8%
20 Uttarakhand 376 576 785 1062 144 140 112 3195 11.8% 18% 24.6% 33.2% 4.5% 4.4% 3.5v 45%
Total 5995 6517 15974 16938 4725 1735 3665 55549 10.8% 11.7% 28.8% 30.5% 8.5% 3.1% 6.6% 47.1%
Coefficient of Variation 98.54 53.82 35.84 29.13 91.14 100.73 152.29 13.84 Source: Household Level Data. Figures in the Parenthesis are percentages of the total number of households. Others includes non-reported cases where as % of working population have been calculated excluding non-reported cases.

Evaluation study on Total Sanitation Campaign Page 45
Annex-22 Table: Type of Residential Accommodation
S.No. State Houses with Type Houses with Ownership
Beneficiaries Pucca Semi Pucca Kachha Others Own Rented1 2 3 4 5 6 7 8 9
1 Andhra Pradesh 700 471 141 84 4 678 21
67.3% 20.1% 12.0% 0.6% 96.9% 3.0%
2 Assam 689 91 66 532 0 685 2 13.2% 9.6% 77.2% 0.0% 99.4% 0.3%
3 Bihar 700 124 245 331 0 700 0 17.7% 35.0% 47.3% 0.0% 100.0% 0.0%
4 Gujarat 700 446 137 117 0 695 5 63.7% 19.6% 16.7% 0.0% 99.3% 0.7%
5 Haryana 700 583 81 36 0 699 0 83.3% 11.6% 5.1% 0.0% 99.9% 0.0%
6 Jharkhand 700 97 131 472 0 700 0 13.9% 18.7% 67.4% 0.0% 100.0% 0.0%
7 Karnataka 700 283 377 40 0 684 16 40.4% 53.9% 5.7% 0.0% 97.7% 2.3%
8 Kerala 700 497 166 37 0 695 5 71.0% 23.7% 5.3% 0.0% 99.3% 0.7%
9 Madhya Pradesh 700 3 121 576 0 698 2
0.4% 17.3% 82.3% 0.0% 99.7% 0.3%
10 Maharashtra 700 340 148 211 1 695 5 48.6% 21.1% 30.1% 0.1% 99.3% 0.7%
11 Orissa 700 237 155 308 0 700 0 33.9% 22.1% 44.0% 0.0% 100.0% 0.0%
12 Punjab 30 30 0 0 0 30 0 100.0% 0.0% 0.0% 0.0% 100.0% 0.0%
13 Rajasthan 700 295 176 229 0 695 5 42.1% 25.1% 32.7% 0.0% 99.3% 0.7%
14 Sikkim 200 28 152 20 0 198 2 14.0% 76.0% 10.0% 0.0% 99.0% 1.0%
15 Tamil Nadu 700 243 314 143 0 682 18 34.7% 44.9% 20.4% 0.0% 97.4% 2.6%
16 Uttar Pradesh 700 318 148 233 1 699 1
45.4% 21.1% 33.3% 0.1% 99.9% 0.1%
17 West Bengal 700 21 122 552 3 696 4 3.0% 17.4% 78.9% 0.4% 99.4% 0.6%
18 Manipur 200 5 64 131 0 200 0 2.5% 32.0% 65.5% 0.0% 100.0% 0.0%
19 Meghalaya 200 9 61 130 0 200 0 4.5% 30.5% 65.0% 0.0% 100.0% 0.0%
20 Uttarakhand 400 142 190 67 1 400 0 35.5% 47.5% 16.8% 0.3% 100.0% 0.0%
Total 11519 4263 2995 4249 10 11429 86 37.0% 26.0% 36.9% 0.1% 99.2% 0.8%
Coefficient of Variation across 78.19 66.61 76.07 165.04 0.93 115.10Source: Household Level Data. Coefficient of Variation based on percentage values.

Evaluation study on Total Sanitation Campaign Page 46
Annex-23 Table: Toilets and source of water (Other than Drinking)
State
Houses wherein Toilet facility available
Main source of water in the house Tap as a source of water where toilet facility is available
Where source of water is Tap, Water pipes connected to HH latrines Tap Hand
Pump Well Others
1 2 3 4 5 6 7 8 9
1 Andhra Pradesh 363 464 154 45 36 239 2251.9% 66.3% 22.0% 6.4% 5.1% 9.2%
2 Assam 684 14 471 132 69 14 099.3% 2.0% 68.4% 19.2% 10.0% 0.0%
3 Bihar 700 1 645 52 2 1 0100.0% 0.1% 92.1% 7.4% 0.3% 0.0%
4 Gujarat 470 474 34 68 124 355 9667.1% 67.7% 4.9% 9.7% 17.7% 27.0%
5 Haryana 662 535 69 23 73 508 4994.6% 76.4% 9.9% 3.3% 10.4% 9.6%
6 Jharkhand 700 3 559 128 10 3 0100.0% 0.4% 79.9% 18.3% 1.4% 0.0%
7 Karnataka 419 684 3 13 0 404 759.9% 97.7% 0.4% 1.9% 0.0% 1.7%
8 Kerala 699 277 12 373 38 276 2199.9% 39.6% 1.7% 53.3% 5.4% 7.6%
9 Madhya Pradesh 700 10 640 50 0 10 0100.0% 1.4% 91.4% 7.1% 0.0% 0.0%
10 Maharashtra 476 282 91 146 181 216 4668.0% 40.3% 13.0% 20.9% 25.9% 21.3%
11 Orissa 693 98 508 87 7 97 2599.0% 14.0% 72.6% 12.4% 1.0% 25.8%
12 Punjab 30 28 1 0 1 28 16100.0% 93.3% 3.3% 0.0% 3.3% 57.1%
13 Rajasthan 700 275 207 107 111 275 12100.0% 39.3% 29.6% 15.3% 15.9% 4.4%
14 Sikkim 200 199 1 0 0 199 73100.0% 99.5% 0.5% 0.0% 0.0% 36.7%
15 Tamil Nadu 313 637 23 17 23 276 4544.7% 91.0% 3.3% 2.4% 3.3% 16.3%
16 Uttar Pradesh 699 4 670 26 0 4 099.9% 0.6% 95.7% 3.7% 0.0% 0.0%
17 West Bengal 694 43 504 14 138 43 099.1% 6.1% 72.0% 2.0% 19.7% 0.0%
18 Manipur 200 30 0 1 169 30 0100.0% 15.0% 0.0% 0.5% 84.5% 0.0%
19 Meghalaya 200 34 19 26 121 34 0100.0% 17.0% 9.5% 13.0% 60.5% 0.0%
20 Uttarakhand 400 133 129 3 130 133 4100.0% 33.3% 32.3% 0.8% 32.5% 3.0%
Total 10002 4225 4740 1311 1233 3145 41686.8% 36.7% 41.2% 11.4% 10.7% 13.2%
Coefficient of 21.75 100.34 89.17 107.71 207.46 117.54Source: Household Level Data. Coefficient of Variation based on percentage values.

Evaluation study on Total Sanitation Campaign Page 47
Annex-24
Table: Location and type of toilets
State
HHs where in Toilet facility available
Location of Toilets Latrine Type
Inside Outside Front Back Inside and
Outside and
Bucket toilet
Single pit
Double pit
1 2 3 4 5 6 7 8 9 10 11Andhra Pradesh 363 62 300 90 269 42 250 52 263 42
17.1% 82.6% 24.8% 74.1% 11.6% 68.9% 14.3% 72.5% 11.6%
Assam 684 494 189 10 673 2 181 8 669 372.2% 27.6% 1.5% 98.4% 0.3% 26.5% 1.2% 97.8% 0.4%
Bihar 700 234 466 87 613 13 392 4 696 033.4% 66.6% 12.4% 87.6% 1.9% 56.0% 0.6% 99.4% 0.0%
Gujarat 470 36 434 129 341 13 318 0 433 377.7% 92.3% 27.4% 72.6% 2.8% 67.7% 0.0% 92.1% 7.9%
Haryana 662 459 200 584 75 437 53 9 507 13669.3% 30.2% 88.2% 11.3% 66.0% 8.0% 1.4% 76.6% 20.5%
Jharkhand 700 200 500 225 475 64 339 0 270 43028.6% 71.4% 32.1% 67.9% 9.1% 48.4% 0.0% 38.6% 61.4%
Karnataka 419 92 326 76 342 15 265 3 413 022.0% 77.8% 18.1% 81.6% 3.6% 63.2% 0.7% 98.6% 0.0%
Kerala 699 69 630 57 639 16 589 1 591 1079.9% 90.1% 8.2% 91.4% 2.3% 84.3% 0.1% 84.5% 15.3%
Madhya Pradesh 700 71 629 248 452 13 394 0 700 0
10.1% 89.9% 35.4% 64.6% 1.9% 56.3% 0.0% 100.0% 0.0%
Maharashtra 476 82 394 115 361 23 302 0 371 10517.2% 82.8% 24.2% 75.8% 4.8% 63.4% 0.0% 77.9% 22.1%
Orissa 693 32 661 58 635 8 611 113 556 244.6% 95.4% 8.4% 91.6% 1.2% 88.2% 16.3% 80.2% 3.5%
Punjab 30 15 14 16 13 12 10 0 14 1550.0% 46.7% 53.3% 43.3% 40.0% 33.3% 0.0% 46.7% 50.0%
Rajasthan 700 570 130 548 152 450 32 0 700 081.4% 18.6% 78.3% 21.7% 64.3% 4.6% 0.0% 100.0% 0.0%
Sikkim 200 9 191 82 118 6 115 3 197 04.5% 95.5% 41.0% 59.0% 3.0% 57.5% 1.5% 98.5% 0.0%
Tamil Nadu 313 40 273 66 247 17 224 40 192 8112.8% 87.2% 21.1% 78.9% 5.4% 71.6% 12.8% 61.3% 25.9%
Uttar Pradesh 699 133 567 392 307 55 229 4 696 0
19.0% 81.1% 56.1% 43.9% 7.9% 32.8% 0.6% 99.6% 0.0%
West Bengal 694 70 629 270 429 30 389 4 678 1610.1% 90.6% 38.9% 61.8% 4.3% 56.1% 0.6% 97.7% 2.3%
Manipur 200 1 199 21 179 178 198 2 00.5% 99.5% 10.5% 89.5% 0.0% 89.0% 99.0% 1.0% 0.0%
Meghalaya 200 3 197 33 167 164 1 198 11.5% 98.5% 16.5% 83.5% 0.0% 82.0% 0.5% 99.0% 0.5%
Uttarakhand 400 33 362 254 146 17 129 5 395 08.3% 90.5% 63.5% 36.5% 4.3% 32.3% 1.3% 98.8% 0.0%
Total 10002 2705 7291 3361 6633 1233 5164 445 8541 99727.0% 72.9% 33.6% 66.3% 12.3% 51.6% 4.4% 85.4% 10.0%

Evaluation study on Total Sanitation Campaign Page 48
Annex-25 Table: Structure of toilets
S.No. States
Toilet is covered and has roof
Toilet is covered but does not have roof
% of HH reporting inconvenience due lack of roof
Has a roof but not covered
Neither covered nor has a roof
% of HH reporting inconvenience due lack of roof and side walls
Drainage Provision available (% is that of total HHs)
1 2 3 4 5 6 7 8 9
1 Andhra Pradesh
276 62 80.6% 3 16 100.0% 18477.3% 17.4% 0.8% 4.5% 26.3%
2 Assam 499 145 99.3% 1 29 87.0% 2374.0% 21.5% 0.1% 4.3% 3.3%
3 Bihar 197 378 99.5% 1 124 100.0% 2128.1% 54.0% 0.1% 17.7% 3.0%
4 Gujarat 446 13 90.9% 5 3 100.0% 27695.50% 2.80% 1.10% 0.60% 39.43%
5 Haryana 449 74 84.3% 92 41 92.3% 52868.4% 11.3% 14.0% 6.3% 75.4%
6 Jharkhand 183 475 100.0% 40 97.4% 3326.2% 68.1% 0.0% 5.7% 4.7%
7 Karnataka 410 5 80.0% 3 66.7% 41398.10% 1.20% 0.00% 0.70% 59.00%
8 Kerala 638 35 100.0% 7 16 100.0% 191.7% 5.0% 1.0% 2.3% 0.1%
9 Madhya Pradesh
313 117 100.0% 10 260 100.0% 444.7% 16.7% 1.4% 37.1% 0.6%
10 Maharashtra 430 12 100.0% 5 24 100.0% 33191.3% 2.5% 1.1% 5.1% 47.3%
11 Orissa 187 47 100.0% 23 436 100.0% 527.0% 6.8% 3.3% 62.9% 0.7%
12 Punjab 22 3 100.0% 2 2 100.0% 2975.9% 10.3% 6.9% 6.9% 96.7%
13 Rajasthan 277 212 100.0% 210 98.6% 17139.6% 30.3% 0.0% 30.0% 24.4%
14 Sikkim 197 - 2 - 3699.0% 0.0% 1.0% 0.0% 18.0%
15 Tamil Nadu 271 26 92.0% 2 7 85.7% 30888.6% 8.5% 0.7% 2.3% 44.0%
16 Uttar Pradesh
336 17 88.2% 189 156 99.3% 66248.1% 2.4% 27.1% 22.3% 94.6%
17 West Bengal 84 34 97.0% 2 561 99.1% 10812.3% 5.0% 0.3% 82.4% 15.4%
18 Manipur 166 4 100.0% 16 14 100.0% 083.0% 2.0% 8.0% 7.0% 0.0%
19 Meghalaya 187 1 100.0% 2 9 100.0% 094.0% 0.5% 1.0% 4.5% 0.0%
20 Uttarakhand 286 10 80.0% 62 40 97.4% 38471.9% 2.5% 15.6% 10.1% 96.0%
Total 5854 1670 97.9% 424 1991 99.0% 351758.9% 16.8% 4.3% 20.0% 30.5%
Coefficient of Variation across states
47.85 108.71 7.99 164.99 110.69 8.42 114.68
Source: Household Level Data. Coefficient of Variation based on percentage values. HHs with incomplete/inconsistent information ignored.
Evaluation study on Total Sanitation Campaign Page 49
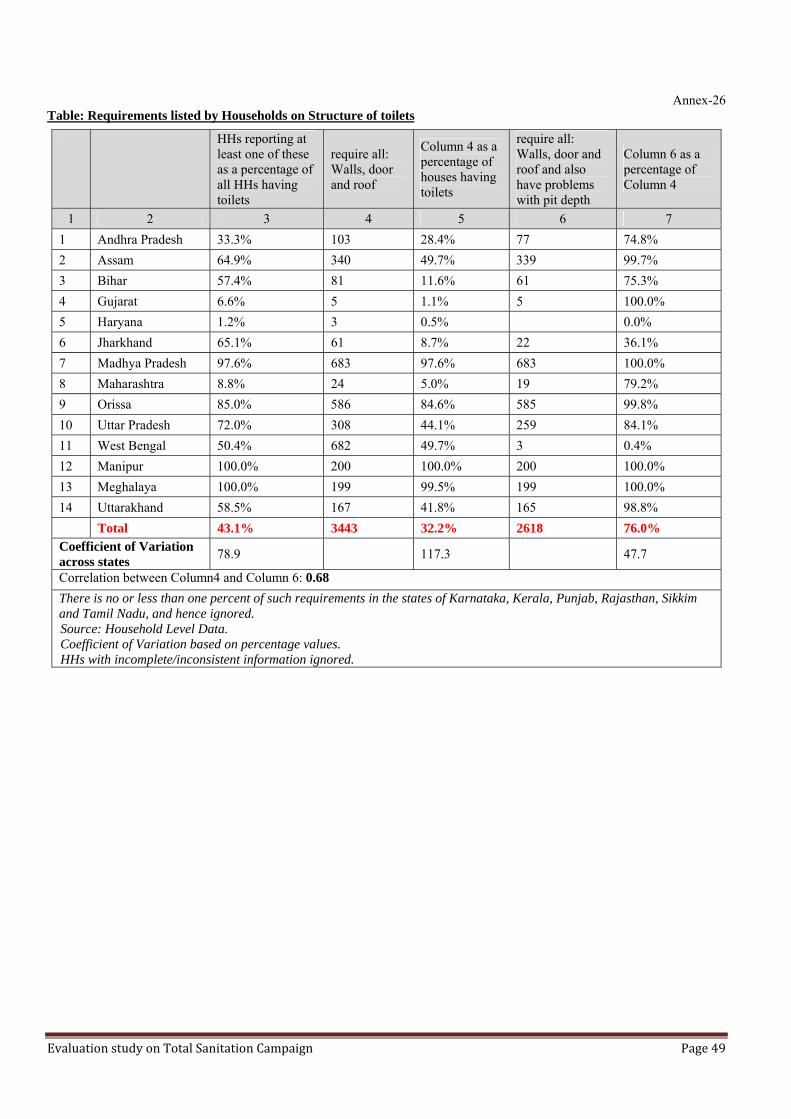
Annex-26 Table: Requirements listed by Households on Structure of toilets
HHs reporting at least one of these as a percentage of all HHs having toilets
require all: Walls, door and roof
Column 4 as a percentage of houses having toilets
require all: Walls, door and roof and also have problems with pit depth
Column 6 as a percentage of Column 4
1 2 3 4 5 6 7 1 Andhra Pradesh 33.3% 103 28.4% 77 74.8% 2 Assam 64.9% 340 49.7% 339 99.7% 3 Bihar 57.4% 81 11.6% 61 75.3% 4 Gujarat 6.6% 5 1.1% 5 100.0% 5 Haryana 1.2% 3 0.5% 0.0% 6 Jharkhand 65.1% 61 8.7% 22 36.1% 7 Madhya Pradesh 97.6% 683 97.6% 683 100.0% 8 Maharashtra 8.8% 24 5.0% 19 79.2% 9 Orissa 85.0% 586 84.6% 585 99.8% 10 Uttar Pradesh 72.0% 308 44.1% 259 84.1% 11 West Bengal 50.4% 682 49.7% 3 0.4% 12 Manipur 100.0% 200 100.0% 200 100.0% 13 Meghalaya 100.0% 199 99.5% 199 100.0% 14 Uttarakhand 58.5% 167 41.8% 165 98.8% Total 43.1% 3443 32.2% 2618 76.0% Coefficient of Variation across states 78.9 117.3 47.7
Correlation between Column4 and Column 6: 0.68 There is no or less than one percent of such requirements in the states of Karnataka, Kerala, Punjab, Rajasthan, Sikkim and Tamil Nadu, and hence ignored. Source: Household Level Data. Coefficient of Variation based on percentage values. HHs with incomplete/inconsistent information ignored.

Evaluation study on Total Sanitation Campaign Page 50
Annex-27
Table: Usage of toilets
Sl. No. State
HHs where in Toilet facility available
expressed unwillingness to use in spite of toilet availability
Toilet not being used daily in spite of availability
% of HHs where men are not using toilets in spite of availability
% of HHs where women are not using toilets in spite of availability
% of HHs where children are not using toilets in spite of availability
Additional toilet requirement for HHs already having toilets
1 2 3 4 5 6 7 8 9
1 Andhra Pradesh 363 7.8% 8.9% 7.8% 4.3% 7.3% 3.0%
2 Assam 684 0.4% 2.4% 0.8% 0.0% 9.9% 16.5% 3 Bihar 700 11.6% 44.4% 45.4% 22.1% 34.8% 37.3% 4 Gujarat 470 3.8% 5.5% 4.5% 4.1% 5.6% 2.6% 5 Haryana 662 10.2% 16.5% 14.6% 6.4% 8.9% 4.7% 6 Jharkhand 700 7.9% 48.0% 50.0% 27.7% 35.8% 19.3% 7 Karnataka 419 0.5% 0.2% 0.0% 0.0% 0.2% 3.6% 8 Kerala 699 0.6% 0.3% 0.5% 0.3% 0.7% 5.7%
9 Madhya Pradesh 700 33.5% 33.6% 21.6% 21.4% 22.6% 2.0%
10 Maharashtra 476 3.4% 4.2% 3.5% 3.4% 4.4% 6.7% 11 Orissa 693 32.6% 34.2% 34.4% 28.3% 28.9% 27.1% 12 Punjab 30 3.4% 10.7% 3.4% 3.4% 0.0% 0.0% 13 Rajasthan 700 28.6% 28.3% 27.5% 25.6% 25.1% 0.0% 14 Sikkim 200 0.5% 0.0% 0.0% 0.5% 0.0% 0.0% 15 Tamil Nadu 313 13.8% 12.5% 13.2% 3.2% 6.9% 0.3%
16 Uttar Pradesh 699 42.2% 45.8% 43.1% 22.0% 16.1% 5.3%
17 West Bengal 694 1.0% 1.8% 0.1% 0.3% 0.7% 13.3%
18 Manipur 200 0.5% 0.5% 0.5% 0.0% 0.7% 38.0% 19 Meghalaya 200 3.5% 3.0% 3.6% 3.5% 2.8% 29.0% 20 Uttarakhand 400 14.0% 17.4% 15.0% 7.3% 6.4% 5.0% Total 10002 13.5% 19.8% 18.4% 11.6% 14.5% 11.4% Coefficient of Variation across states 95.49 85.22 91.25 91.24 82.83 110.84
Source: Household Level Data. Coefficient of Variation based on percentage values. HHs with incomplete/inconsistent information ignored.
Evaluation study on Total Sanitation Campaign Page 51
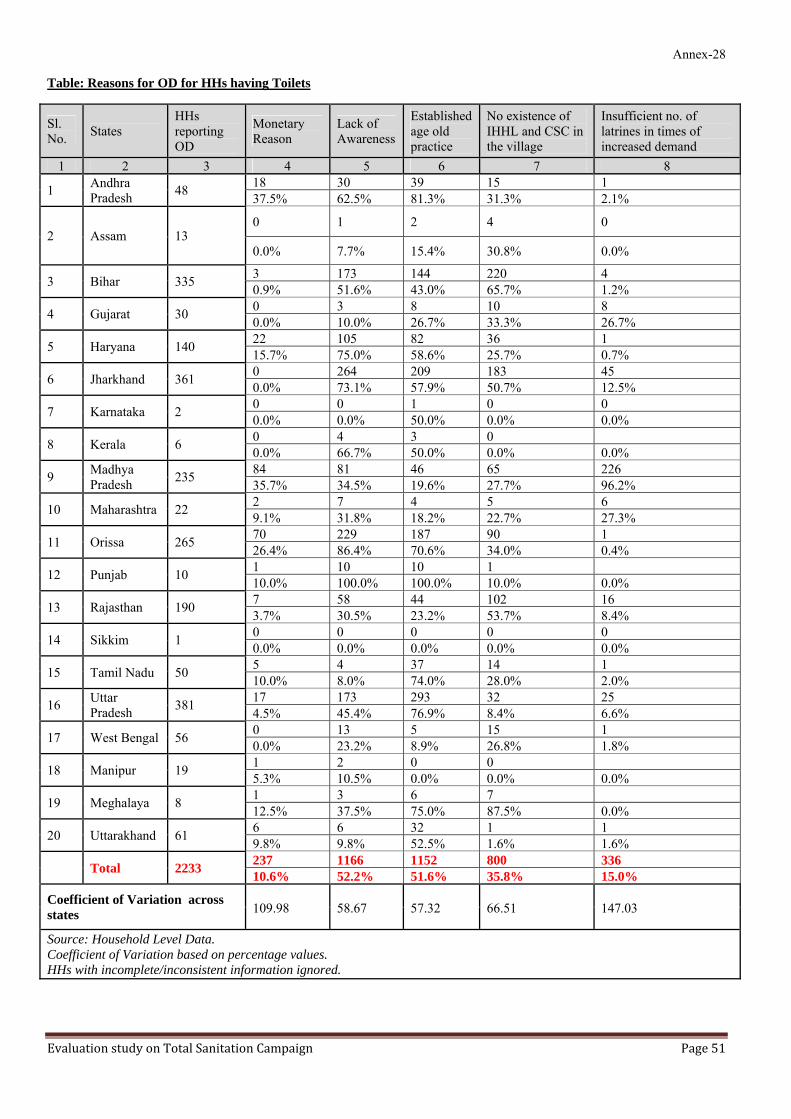
Annex-28
Table: Reasons for OD for HHs having Toilets
Sl. No. States
HHs reporting OD
Monetary Reason
Lack of Awareness
Established age old practice
No existence of IHHL and CSC in the village
Insufficient no. of latrines in times of increased demand
1 2 3 4 5 6 7 8
1 Andhra Pradesh 48 18 30 39 15 1
37.5% 62.5% 81.3% 31.3% 2.1%
2 Assam 13 0 1 2 4 0
0.0% 7.7% 15.4% 30.8% 0.0%
3 Bihar 335 3 173 144 220 4 0.9% 51.6% 43.0% 65.7% 1.2%
4 Gujarat 30 0 3 8 10 8 0.0% 10.0% 26.7% 33.3% 26.7%
5 Haryana 140 22 105 82 36 1 15.7% 75.0% 58.6% 25.7% 0.7%
6 Jharkhand 361 0 264 209 183 45 0.0% 73.1% 57.9% 50.7% 12.5%
7 Karnataka 2 0 0 1 0 0 0.0% 0.0% 50.0% 0.0% 0.0%
8 Kerala 6 0 4 3 0 0.0% 66.7% 50.0% 0.0% 0.0%
9 Madhya Pradesh 235 84 81 46 65 226
35.7% 34.5% 19.6% 27.7% 96.2%
10 Maharashtra 22 2 7 4 5 6 9.1% 31.8% 18.2% 22.7% 27.3%
11 Orissa 265 70 229 187 90 1 26.4% 86.4% 70.6% 34.0% 0.4%
12 Punjab 10 1 10 10 1 10.0% 100.0% 100.0% 10.0% 0.0%
13 Rajasthan 190 7 58 44 102 16 3.7% 30.5% 23.2% 53.7% 8.4%
14 Sikkim 1 0 0 0 0 0 0.0% 0.0% 0.0% 0.0% 0.0%
15 Tamil Nadu 50 5 4 37 14 1 10.0% 8.0% 74.0% 28.0% 2.0%
16 Uttar Pradesh 381 17 173 293 32 25
4.5% 45.4% 76.9% 8.4% 6.6%
17 West Bengal 56 0 13 5 15 1 0.0% 23.2% 8.9% 26.8% 1.8%
18 Manipur 19 1 2 0 0 5.3% 10.5% 0.0% 0.0% 0.0%
19 Meghalaya 8 1 3 6 7 12.5% 37.5% 75.0% 87.5% 0.0%
20 Uttarakhand 61 6 6 32 1 1 9.8% 9.8% 52.5% 1.6% 1.6%
Total 2233 237 1166 1152 800 336 10.6% 52.2% 51.6% 35.8% 15.0%
Coefficient of Variation across states 109.98 58.67 57.32 66.51 147.03
Source: Household Level Data. Coefficient of Variation based on percentage values. HHs with incomplete/inconsistent information ignored.

Evaluation study on Total Sanitation Campaign Page 52
Annex-29
Table: Reasons for OD for HHs not having Toilets
Sl.No. States HHs reporting OD
Monetary Reason
Lack of Awareness
Established age old practice
No existence of IHHL and CSC in the village
1 2 3 4 5 6 7
1 Andhra Pradesh 330
262 227 142 280 79.4% 68.8% 43.0% 84.8%
2 Assam 3 0 0 3 0.0% 0.0% 0.0% 100.0%
3 Gujarat 208 158 96 111 128 76.0% 46.2% 53.4% 61.5%
4 Haryana 37 23 30 33 29 62.2% 81.1% 89.2% 78.4%
5 Karnataka 279 273 30 15 225 97.8% 10.8% 5.4% 80.6%
6 Maharashtra 160 131 46 62 149 81.9% 28.8% 38.8% 93.1%
7 Orissa 7 2 4 4 7 28.6% 57.1% 57.1% 100.0%
8 Tamil Nadu 381 145 42 148 233 38.1% 11.0% 38.8% 61.2%
Total 1406 994 475 515 1055 70.70% 33.80% 36.60% 75.00%
Coefficient of Variation across states
46.54 88.30 77.95 20.44
Source: Household Level Data. Coefficient of Variation based on percentage values. HHs with incomplete/inconsistent information ignored. Since only one such case from WB, ignored.

Evaluation study on Total Sanitation Campaign Page 53
Annex-30
Table: Cleaning of toilets
S.No. State
Houses wherein Toilet facility available
Cleaning latrine/bathroom Whether water supply is adequate for flushing
Percentage of HHs who have adequate water for flushing Daily Weekly Monthly Rarely Not since not Irregula Yes No
1 2 3 4 5 6 7 8 9 10 11 12
1 Andhra Pradesh 363 157 158 32 0 1 0 234 121
45.1% 45.4% 9.2% 0.0% 0.3% 0.0% 33.43% 17.29% 66.1%
2 Assam 684 155 504 14 2 0 0 577 97 23.0% 74.7% 2.1% 0.3% 0.0% 0.0% 83.74% 14.08% 85.6%
3 Bihar 700 76 198 144 40 113 101 0 700 11.3% 29.5% 21.4% 6.0% 16.8% 15.0% 0.00% 100.00% 0.0%
4 Gujarat 470 258 209 20 0 0 0 478 7 53.0% 42.9% 4.1% 0.0% 0.0% 0.0% 68.29% 01.00% 98.9%
5 Haryana 662 528 105 6 7 2 0 544 107 81.5% 16.2% 0.9% 1.1% 0.3% 0.0% 77.71% 15.29% 84.2%
6 Jharkhand 700 60 229 113 8 36 150 1 699 10.1% 38.4% 19.0% 1.3% 6.0% 25.2% 0.14% 99.86% 0.1%
7 Karnataka 419 129 288 4 0 0 0 413 0 30.6% 68.4% 1.0% 0.0% 0.0% 0.0% 59.00% 00.00% 100.0%
8 Kerala 699 667 29 0 2 0 1 677 22 95.4% 4.1% 0.0% 0.3% 0.0% 0.1% 96.71% 03.14% 96.9%
9 Madhya Pradesh 700 155 308 2 1 234 0 29 514
22.1% 44.0% 0.3% 0.1% 33.4% 0.0% 4.14% 73.43% 5.3%
10 Maharashtra 476 316 160 3 1 0 0 466 12 65.8% 33.3% 0.6% 0.2% 0.0% 0.0% 66.57% 01.71% 97.6%
11 Orissa 693 401 128 17 7 0 0 206 348 72.5% 23.1% 3.1% 1.3% 0.0% 0.0% 29.43% 49.71% 37.2%
12 Punjab 30 29 0 0 0 0 0 28 1 100.0% 0.0% 0.0% 0.0% 0.0% 0.0% 93.33% 03.33% 96.6%
13 Rajasthan 700 297 204 8 14 165 12 107 470 42.4% 29.1% 1.1% 2.0% 23.6% 1.7% 15.29% 67.14% 18.5%
14 Sikkim 200 66 102 0 28 0 4 47 152 33.0% 51.0% 0.0% 14.0% 0.0% 2.0% 23.50% 76.00% 23.6%
15 Tamil Nadu 313 276 17 3 1 0 0 290 12 92.9% 5.7% 1.0% 0.3% 0.0% 0.0% 41.43% 01.71% 96.0%
16 Uttar Pradesh 699 4 598 8 51 29 7 679 6
0.6% 85.8% 1.1% 7.3% 4.2% 1.0% 97.00% 00.86% 99.1%
17 West Bengal 694 86 537 32 16 1 18 100 589 12.5% 77.8% 4.6% 2.3% 0.1% 2.6% 14.29% 84.14% 14.6%
18 Manipur 200 148 50 1 1 0 0 16 184 74.0% 25.0% 0.5% 0.5% 0.0% 0.0% 8.00% 92.00% 8.0%
19 Meghalaya 200 143 53 0 0 1 0 5 191 72.6% 26.9% 0.0% 0.0% 0.5% 0.0% 2.50% 95.50% 2.6%
20 Uttarakhand 400 2 378 3 17 0 0 391 7 0.5% 94.5% 0.8% 4.3% 0.0% 0.0% 97.75% 01.75% 98.2%
Total 10002 3953 4255 410 196 582 293 5288 4239 40.8% 43.9% 4.2% 2.0% 6.0% 3.0% 45.91% 36.80% 55.3%
Coefficient of Variation across 80.90 62.40 145.70 175.07 155.12 211.01 80.82 102.40 75.29Source: Household Level Data. Coefficient of Variation based on percentage values. HHs with incomplete/inconsistent information ignored

Evaluation study on Total Sanitation Campaign Page 54
Annex-31
Table: Maintenance- The Household Standpoint
S.No. State
trained manpower available
In absence of trained manpower way of keeping latrine
Toilets available Self Maintenance
not required
Searching trained manpower to reinstall toilet
Toilet damaged Others
1 2 3 4 5 6 7 8 9
1 Andhra Pradesh
363 19 300 5 4 0 1951.86% 5.2% 91.5% 1.5% 1.2% 0.0% 5.8%
2 Assam 684 29 628 2 1 0 5 99.27% 4.2% 98.7% 0.3% 0.2% 0.0% 0.8%
3 Bihar 700 0 508 37 0 90 65 100.00% 0.0% 72.6% 5.3% 0.0% 12.9% 9.3%
4 Gujarat 470 99 341 9 0 0 0 67.14% 21.1% 97.4% 2.6% 0.0% 0.0% 0.0%
5 Haryana 662 244 395 7 0 0 4 94.57% 36.9% 97.3% 1.7% 0.0% 0.0% 1.0%
6 Jharkhand 700 1 385 112 0 40 162 100.00% 0.1% 55.1% 16.0% 0.0% 5.7% 23.2%
7 Karnataka 419 419 59.86% 100.0%
8 Kerala 699 696 0 1 0 0 0 99.86% 99.6% 0.0% 100.0% 0.0% 0.0% 0.0%
9 Madhya Pradesh
700 465 0 0 0 78 0 100.00% 66.4% 0.0% 0.0% 0.0% 100.0% 0.0%
10 Maharashtra 476 122 332 3 1 4 4 68.00% 25.6% 96.5% 0.9% 0.3% 1.2% 1.2%
11 Orissa 693 537 11 0 0 0 0 99.00% 77.5% 100.0% 0.0% 0.0% 0.0% 0.0%
12 Punjab 30 16 13 0 0 0 0 100.00% 53.3% 100.0% 0.0% 0.0% 0.0% 0.0%
13 Rajasthan 700 115 421 7 0 35 1 100.00% 16.4% 90.7% 1.5% 0.0% 7.5% 0.2%
14 Sikkim 200 5 117 0 12 0 61 100.00% 2.5% 61.6% 0.0% 6.3% 0.0% 32.1%
15 Tamil Nadu 313 2 298 0 0 0 0 44.71% 0.6% 100.0% 0.0% 0.0% 0.0% 0.0%
16 Uttar Pradesh
699 683 99.86% 97.7%
17 West Bengal 694 85 543 4 50 0 3 99.14% 12.2% 90.5% 0.7% 8.3% 0.0% 0.5%
18 Manipur 200 14 186 0 0 0 0 100.00% 7.0% 100.0% 0.0% 0.0% 0.0% 0.0%
19 Meghalaya 200 2 191 0 0 0 0 100.00% 1.0% 100.0% 0.0% 0.0% 0.0% 0.0%
20 Uttarakhand 400 395 2 0 0 0 0 100.00% 98.8% 100.0% 0.0% 0.0% 0.0% 0.0%
Total 10002 3950 4671 187 68 247 324 86.83% 39.5% 85.0% 3.4% 1.2% 4.5% 5.9%
Coefficient of Variation across states 99.08 38.05 689.90 197.40 521.33 153.10 Source: Household Level Data. Coefficient of Variation based on percentage values. HHs with incomplete/inconsistent information ignored.

Evaluation study on Total Sanitation Campaign Page 55
Annex-32
Table: Perceived Socio-Economic Benefits
Sl. No.
HHs having toilets
Time to go for employment
More time available for income generating activities
Reduced medical expenses due to
Improved general wellbeing
women feel more secure with the construction of household and CS
1 2 3 4 5 6 7 8
1 Andhra Pradesh 363 258 252 282 292 350
71.1% 69.4% 77.7% 80.4% 96.4%
2 Assam 684 178 180 145 620 622 26.0% 26.3% 21.2% 90.6% 90.9%
3 Bihar 700 65 242 445 664 691 9.3% 34.6% 63.6% 94.9% 98.7%
4 Gujarat 470 258 385 427 444 470 54.9% 81.9% 90.9% 94.5% 100.0%
5 Haryana 662 396 406 513 594 655 59.8% 61.3% 77.5% 89.7% 98.9%
6 Jharkhand 700 124 245 393 646 697 17.7% 35.0% 56.1% 92.3% 99.6%
7 Karnataka 419 416 416 415 416 415 99.3% 99.3% 99.0% 99.3% 99.0%
8 Kerala 699 75 94 461 689 680 10.7% 13.4% 66.0% 98.6% 97.3%
9 Madhya Pradesh 700 446 446 446 446 700
63.7% 63.7% 63.7% 63.7% 100.0%
10 Maharashtra 476 336 424 460 468 476 70.6% 89.1% 96.6% 98.3% 100.0%
11 Orissa 693 526 527 547 546 549 75.9% 76.0% 78.9% 78.8% 79.2%
12 Punjab 30 13 13 9 19 30 43.3% 43.3% 30.0% 63.3% 100.0%
13 Rajasthan 700 690 690 689 689 700 98.6% 98.6% 98.4% 98.4% 100.0%
14 Sikkim 200 178 127 184 198 192 89.0% 63.5% 92.0% 99.0% 96.0%
15 Tamil Nadu 313 286 290 141 284 300 91.4% 92.7% 45.0% 90.7% 95.8%
16 Uttar Pradesh 699 234 441 563 460 575 33.5% 63.1% 80.5% 65.8% 82.3%
17 West Bengal 694 571 439 615 626 677 82.3% 63.3% 88.6% 90.2% 97.6%
18 Manipur 200 199 199 200 200 200 99.5% 99.5% 100.0% 100.0% 100.0%
19 Meghalaya 200 196 196 196 196 196 98.0% 98.0% 98.0% 98.0% 98.0%
20 Uttarakhand 400 78 349 389 303 395 19.5% 87.3% 97.3% 75.8% 98.8%
Total 10002 5523 6361 7520 8800 9570 55.2% 63.6% 75.2% 88.0% 95.7%
Coefficient of Variation across 57.96 41.38 31.29 14.12 6.08 Source: Household Level Data. Coefficient of Variation based on percentage values. Only those HHs that have toilets HHs with incomplete/inconsistent information ignored

Evaluation study on Total Sanitation Campaign Page 56
Annex-33
Table: Reasons for dissatisfaction (HHs having Toilets)
Sl. No. State
Reported dissatisfaction
Lack of funding
Lack of incentives**
Inadequate awareness campaign
Against cultural practice
Malpractices/favoritism
Community Latrines not available
Construction Related Problems@
coverage problem*
Lack of monitoring
No maintenance/ renovation of old toilets#
1 2 3 4 5 6 7 8 9 10 11 12 13
1 Andhra Pradesh 79 59 66 74 25 30 0 0 0 0 3
74.7% 83.5% 93.7% 31.6% 38.0% 0.0% 0.0% 0.0% 0.0% 3.8%
2 Assam 83 1 2 4 0 3 14 0 2 1.2% 2.4% 4.8% 0.0% 0.0% 0.0% 3.6% 16.9% 0.0% 2.4%
3 Bihar 680 481 431 549 56 179 0 85 1 65 170 70.7% 63.4% 80.7% 8.2% 26.3% 0.0% 12.5% 0.1% 9.6% 25.0%
4 Gujarat 292 18 268 26 1 3 25 25 9 0 132 6.2% 91.8% 8.9% 0.3% 1.0% 8.6% 8.6% 3.1% 0.0% 45.2%
5 Haryana 455 323 352 309 16 105 0 3 10 0 6 71.0% 77.4% 67.9% 3.5% 23.1% 0.0% 0.7% 2.2% 0.0% 1.3%
6 Jharkhand 687 290 539 558 99 200 0 32 0 113 166 42.2% 78.5% 81.2% 14.4% 29.1% 0.0% 4.7% 0.0% 16.4% 24.2%
7 Karnataka 240 235 239 98 1 1 0 0 0 0 0 97.9% 99.6% 40.8% 0.4% 0.4% 0.0% 0.0% 0.0% 0.0% 0.0%
8 Kerala 13 7 11 1 0 0 1 0 0 53.8% 84.6% 0.0% 7.7% 0.0% 0.0% 0.0% 7.7% 0.0% 0.0%
9 Madhya Pradesh 443 438 443 438 3 1 0 0 0 0 239
98.9% 100.0% 98.9% 0.7% 0.2% 0.0% 0.0% 0.0% 0.0% 54.0%
10 Maharashtra 216 34 200 36 3 0 16 0 119
15.7% 92.6% 16.7% 0.0% 0.0% 1.4% 0.0% 7.4% 0.0% 55.1%
11 Orissa 402 2 388 124 56 0 7 0 0 363 0.5% 96.5% 30.8% 13.9% 0.0% 0.0% 1.7% 0.0% 0.0% 90.3%
12 Punjab 29 18 17 29 1 3 0 0 1 0 0 62.1% 58.6% 100.0% 3.4% 10.3% 0.0% 0.0% 3.4% 0.0% 0.0%
13 Rajasthan 651 129 646 137 3 0 0 0 0 3 19.8% 99.2% 21.0% 0.5% 0.0% 0.0% 0.0% 0.0% 0.0% 0.5%
14 Sikkim 18 1 4 14 1 1 0 0 0 0 2 5.6% 22.2% 77.8% 5.6% 5.6% 0.0% 0.0% 0.0% 0.0% 11.1%
15 Tamil Nadu 111 86 87 45 2 1 0 1 1 0 0
77.5% 78.4% 40.5% 1.8% 0.9% 0.0% 0.9% 0.9% 0.0% 0.0%
16 Uttar Pradesh 668 586 581 68 53 0 14 0 3 391
0.0% 87.7% 87.0% 10.2% 7.9% 0.0% 2.1% 0.0% 0.4% 58.5%
17 West Bengal 263 1 149 240 4 3 0 16 0 1 20
0.4% 56.7% 91.3% 1.5% 1.1% 0.0% 6.1% 0.0% 0.4% 7.6%
18 Manipur 82 82 0 0 0 0 82 0.0% 100.0% 0.0% 0.0% 0.0% 0.0% 0.0% 0.0% 0.0% 100.0%
19 Meghalaya 76 76 1 0 0 0 0 8 0.0% 100.0% 0.0% 1.3% 0.0% 0.0% 0.0% 0.0% 0.0% 10.5%
20 Uttarakhand 399 1 398 147 3 20 0 43 0 0 386
0.3% 99.7% 36.8% 0.8% 5.0% 0.0% 10.8% 0.0% 0.0% 96.7%
5887 2124 4430 3409 341 600 28 186 53 182 1616 36.1% 75.3% 57.9% 5.8% 10.2% 0.5% 3.2% 0.9% 3.1% 27.5%
Coefficient of Variation 102.2 34.0 64.8 133.2 115.5 386.4 122.9 469.7 133.5 127.2 Only based on cases where satisfaction=no, toilet=yes *All BPL families not covered/ only BPL families covered @ Durability, Height, water logging etc #(including non-provision of maintenance grant) ** Includes additional cases where ‘inadequate incentive’ has been cited as a reason in ‘other reason for dissatisfaction’. HHs with incomplete/inconsistent information ignored.

Evaluation study on Total Sanitation Campaign Page 57
Annex-34 Table: Reasons for dissatisfaction (HHs not having Toilets)
Sl. No. States Reported dissatisfaction
Lack of funding
Lack of incentive**
Inadequate awareness campaign
Against cultural practices
Malpractices/ favoritism
Construction Related Problems@
coverage problems*
No maintenance/renovation of old toilets #
1 2 3 4 5 6 7 8 9 10 12
1 Andhra Pradesh 290
263 269 262 79 89 0 0 23 90.7% 92.8% 90.3% 27.2% 30.7% 0.0% 0.0% 7.9%
2 Gujarat 150 47 141 57 3 7 4 27 31.3% 94.0% 38.0% 2.0% 0.0% 4.7% 2.7% 18.0%
3 Haryana 30 21 23 27 9 5 0 0 2 70.0% 76.7% 90.0% 30.0% 16.7% 0.0% 0.0% 6.7%
4 Karnataka 252 246 248 146 6 3 0 0 0 97.6% 98.4% 57.9% 2.4% 1.2% 0.0% 0.0% 0.0%
5 Maharashtra 150 55 142 50 2 1 11 11 60 36.7% 94.7% 33.3% 1.3% 0.7% 7.3% 7.3% 40.0%
6 Orissa 7 1 7 1 1 0 0 6 14.3% 100.0% 14.3% 14.3% 0.0% 0.0% 0.0% 85.7%
7 Tamil Nadu 317 259 274 118 24 4 0 2 81.7% 86.4% 37.2% 7.6% 0.0% 1.3% 0.0% 0.6%
Total 1196 892 1104 661 124 98 22 15 120 74.6% 92.3% 55.3% 10.4% 8.2% 1.8% 1.3% 10.0%
Coefficient of Variation 43.72 8.05 52.88 116.86 147.36 163.24 213.67 310.08 Only based on cases where satisfaction=no, toilet=no *All BPL families not covered/ only BPL families covered @ Durability, Height, water logging etc #(including non-provision of maintenance grant) ** Includes additional cases where ‘inadequate incentive’ has been cited as a reason in ‘other reason for dissatisfaction’. HHs with incomplete/inconsistent information ignored.

Evaluation study on Total Sanitation Campaign Page 58
Annex-35 Table: Awareness Index vis-à-vis Willingness to pay more
Awareness index vis-à-vis Willingness to pay
Awareness Index=0 Awareness Index=1 Awareness Index=3
% of Hhs with index=0
% of HHs agreeable to pay more for improvement
% of Hhs with index=1
% of HHs agreeable to pay more for improvement
% of Hhs with index=2
% of HHs agreeable to pay more for improvement
1 2 3 4 5 6 7 8 1 Andhra Pradesh 7.7% 86.5% 22.1% 71.7% 70.2% 57.9% 2 Assam 1.2% 75.0% 13.7% 24.5% 85.1% 78.2% 3 Bihar 25.7% 0.0% 24.1% 2.4% 50.1% 7.4% 4 Gujarat 1.6% 0.0% 98.4% 40.3% 5 Haryana 1.6% 36.4% 36.9% 60.2% 61.5% 51.2% 6 Jharkhand 38.9% 0.7% 24.0% 3.0% 37.1% 12.0% 7 Karnataka 7.1% 83.7% 14.9% 82.5% 78.0% 94.4% 8 Kerala 0.1% 0.0% 3.2% 9.1% 96.7% 9.9% 9 Madhya Pradesh 22.9% 15.0% 77.1% 50.7% 10 Maharashtra 0.8% 100.0% 99.2% 54.0% 11 Orissa 16.2% 74.3% 83.8% 89.6% 12 Punjab 6.7% 0.0% 33.3% 40.0% 60.0% 72.2% 13 Rajasthan 7.6% 1.9% 92.4% 1.7% 14 Sikkim 12.2% 62.5% 87.8% 76.9% 15 Tamil Nadu 7.9% 54.5% 92.1% 51.2% 16 Uttar Pradesh 0.1% 0.0% 1.7% 25.0% 98.1% 29.3% 17 West Bengal 0.4% 100.0% 8.1% 83.9% 91.4% 82.7% 18 Manipur 6.0% 83.3% 94.0% 98.4% 19 Meghalaya 8.0% 100.0% 92.0% 98.4% 20 Uttarakhand 1.8% 85.7% 98.2% 63.6% Total 5.7% 15.6% 14.2% 40.5% 80.1% 52.2% Coefficient of variation across states 175.72 277.04 75.93 88.73 21.66 58.43
Correlation between awareness index and the willingness to pay (across states)
-38.4% -16.5% 25.2%
Source: Household Level Data. Coefficient of Variation based on percentage values. HHs with incomplete/inconsistent information ignored.

Evaluation study on Total Sanitation Campaign Page 59
Annex-36 Table: Assets and Open Defecation and lack of incentive/ money as reason
Practices OD and own a TV
Lack of money as a reason for dissatisfaction when the HH owns a TV and practices OD
Lack of incentive as a reason for dissatisfaction when the HH owns a TV and practices OD
Practice OD and own a Cell Phone
Lack of money as a reason for dissatisfaction when the HH owns a Cell Phone and practices OD
Lack of incentive as a reason for dissatisfaction when the HH owns a Cell Phone and practices OD
1 2 3 4 5 6 7
Andhra Pradesh 41.0% 71.6% 74.8% 0.0% Assam 25.0% 0.0% 0.0% 12.5% 0.0% 0.0% Bihar 24.8% 55.4% 60.2% 35.2% 71.2% 46.6% Gujarat 39.5% 17.0% 44.7% 11.8% 17.9% 35.7% Haryana 43.5% 53.2% 66.2% 0.0% Jharkhand 32.7% 42.4% 82.2% 40.2% 41.4% 73.8% Karnataka 41.6% 88.9% 90.6% 1.8% 100.0% 100.0% Kerala 66.7% 0.0% 0.0% 0.0%
Madhya Pradesh 2.6% 100.0% 100.0% 0.0% Maharashtra 36.8% 53.7% 67.2% 18.7% 26.5% 41.2% Orissa 28.7% 2.6% 6.4% 16.9% 0.0% 8.7% Punjab 90.0% 11.1% 0.0% 0.0% Rajasthan 3.2% 33.3% 83.3% 0.0% Sikkim 100.0% 0.0% 0.0% 100.0% 0.0% 0.0% Tamil Nadu 90.3% 65.8% 69.9% 0.0% Uttar Pradesh 8.9% 0.0% 79.4% 17.6% 0.0% 94.0% West Bengal 10.5% 0.0% 66.7% 0.0% Manipur 26.3% 0.0% 0.0% 63.2% 0.0% 0.0% Meghalaya 25.0% 0.0% 0.0% 12.5% 0.0% 0.0% Uttarakhand 16.4% 0.0% 100.0% 24.6% 0.0% 100.0% Total 34.8% 53.0% 66.1% 13.0% 34.4% 57.6% Coefficient of variation across states 82.0 63.8 58.6 197.3 97.2 71.5 Source: Household Level Data. Coefficient of Variation based on percentage values. HHs with incomplete/inconsistent information ignored.
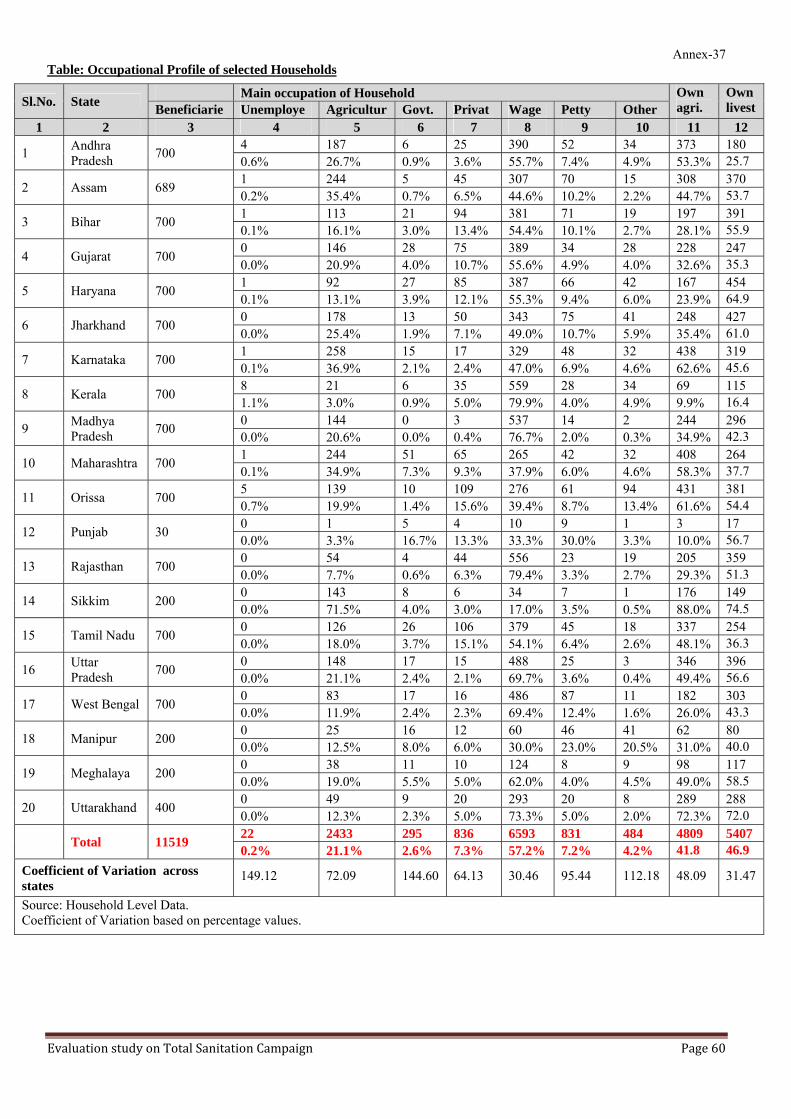
Evaluation study on Total Sanitation Campaign Page 60
Annex-37 Table: Occupational Profile of selected Households
Sl.No. State Main occupation of Household Own
agri. Own livestBeneficiarie Unemploye Agricultur Govt. Privat Wage Petty Other
1 2 3 4 5 6 7 8 9 10 11 12
1 Andhra Pradesh 700 4 187 6 25 390 52 34 373 180
0.6% 26.7% 0.9% 3.6% 55.7% 7.4% 4.9% 53.3% 25.7
2 Assam 689 1 244 5 45 307 70 15 308 370 0.2% 35.4% 0.7% 6.5% 44.6% 10.2% 2.2% 44.7% 53.7
3 Bihar 700 1 113 21 94 381 71 19 197 391 0.1% 16.1% 3.0% 13.4% 54.4% 10.1% 2.7% 28.1% 55.9
4 Gujarat 700 0 146 28 75 389 34 28 228 247 0.0% 20.9% 4.0% 10.7% 55.6% 4.9% 4.0% 32.6% 35.3
5 Haryana 700 1 92 27 85 387 66 42 167 454 0.1% 13.1% 3.9% 12.1% 55.3% 9.4% 6.0% 23.9% 64.9
6 Jharkhand 700 0 178 13 50 343 75 41 248 427 0.0% 25.4% 1.9% 7.1% 49.0% 10.7% 5.9% 35.4% 61.0
7 Karnataka 700 1 258 15 17 329 48 32 438 319 0.1% 36.9% 2.1% 2.4% 47.0% 6.9% 4.6% 62.6% 45.6
8 Kerala 700 8 21 6 35 559 28 34 69 115 1.1% 3.0% 0.9% 5.0% 79.9% 4.0% 4.9% 9.9% 16.4
9 Madhya Pradesh 700 0 144 0 3 537 14 2 244 296
0.0% 20.6% 0.0% 0.4% 76.7% 2.0% 0.3% 34.9% 42.3
10 Maharashtra 700 1 244 51 65 265 42 32 408 264 0.1% 34.9% 7.3% 9.3% 37.9% 6.0% 4.6% 58.3% 37.7
11 Orissa 700 5 139 10 109 276 61 94 431 381 0.7% 19.9% 1.4% 15.6% 39.4% 8.7% 13.4% 61.6% 54.4
12 Punjab 30 0 1 5 4 10 9 1 3 17 0.0% 3.3% 16.7% 13.3% 33.3% 30.0% 3.3% 10.0% 56.7
13 Rajasthan 700 0 54 4 44 556 23 19 205 359 0.0% 7.7% 0.6% 6.3% 79.4% 3.3% 2.7% 29.3% 51.3
14 Sikkim 200 0 143 8 6 34 7 1 176 149 0.0% 71.5% 4.0% 3.0% 17.0% 3.5% 0.5% 88.0% 74.5
15 Tamil Nadu 700 0 126 26 106 379 45 18 337 254 0.0% 18.0% 3.7% 15.1% 54.1% 6.4% 2.6% 48.1% 36.3
16 Uttar Pradesh 700 0 148 17 15 488 25 3 346 396
0.0% 21.1% 2.4% 2.1% 69.7% 3.6% 0.4% 49.4% 56.6
17 West Bengal 700 0 83 17 16 486 87 11 182 303 0.0% 11.9% 2.4% 2.3% 69.4% 12.4% 1.6% 26.0% 43.3
18 Manipur 200 0 25 16 12 60 46 41 62 80 0.0% 12.5% 8.0% 6.0% 30.0% 23.0% 20.5% 31.0% 40.0
19 Meghalaya 200 0 38 11 10 124 8 9 98 117 0.0% 19.0% 5.5% 5.0% 62.0% 4.0% 4.5% 49.0% 58.5
20 Uttarakhand 400 0 49 9 20 293 20 8 289 288 0.0% 12.3% 2.3% 5.0% 73.3% 5.0% 2.0% 72.3% 72.0
Total 11519 22 2433 295 836 6593 831 484 4809 5407 0.2% 21.1% 2.6% 7.3% 57.2% 7.2% 4.2% 41.8 46.9
Coefficient of Variation across states
149.12 72.09 144.60 64.13 30.46 95.44 112.18 48.09 31.47
Source: Household Level Data. Coefficient of Variation based on percentage values.

Evaluation study on Total Sanitation Campaign Page 61
Annex-38
Table: Estimating Open Defecation
Sl. No. States
Percentage of HHS resorting to OD out of all households canvassed
Percentage of HHs resorting to OD out of households having toilets
Percentage of HHs resorting to OD out of households not having toilets but where there are existence of CWS/ WSC in the village
Census 2011 figure on HHs with no Toilets
OD Estimates for Rural India
Components of OD
OD in spite of having toilets
OD since no IHHL/CWS /WSC
1 2 3 4 5 6 7 8 9
A. Households selected randomly 1 Andhra Pradesh 54.5% 13.2% 100.0% 67.8 72.06 4.26 67.80
2 Gujarat 34.4% 6.4% 94.1% 67 65.17 2.11 63.06
3 Karnataka 40.2% 0.5% 99.6% 71.6 71.48 0.14 71.34
4 Maharashtra 26.4% 4.6% 74.8% 62 48.11 1.76 46.36
5 Tamil Nadu 61.6% 16.0% 98.4% 76.8 79.32 3.71 75.61
B. Only households having toilets selected
1 Assam 2.3% 1.9% 100.0% 40.4 41.53 1.13 40.40
2 Bihar 47.9% 47.9% 100.0% 82.4 90.82 8.42 82.40
3 Haryana 24.9% 21.1% 97.1% 43.9 54.47 11.86 42.61
4 Jharkhand 51.6% 51.6% 100.0% 92.4 96.32 3.92 92.40
5 Kerala 0.9% 0.9% 100.0% 6.8 7.60 0.80 6.80
6 Madhya Pradesh 33.6% 33.6% 100.0% 86.9 91.30 4.40 86.90
7 Odisha 38.9% 38.2% 100.0% 85.9 91.29 5.39 85.90
8 Punjab 33.3% 33.3% 100.0% 29.6 53.07 23.47 29.60
9 Rajasthan 27.1% 27.1% 100.0% 80.4 85.72 5.32 80.40
10 Sikkim 0.5% 0.5% 100.0% 15.9 16.32 0.42 15.90
11 Uttar Pradesh 54.5% 54.5% 100.0% 78.2 90.08 11.88 78.20
12 West Bengal 8.2% 8.1% 100.0% 53.3 57.07 3.77 53.30
13 Manipur 9.5% 9.5% 100.0% 14 22.17 8.17 14.00
14 Meghalaya 4.0% 4.0% 100.0% 46.1 48.26 2.16 46.10
15 Uttarakhand 15.3% 15.3% 100.0% 45.9 54.15 8.25 45.90
Total 31.7% 22.3% 94.9% 69.3%* 72.63* 6.85 65.78
Source: Household Level Data. HHs not having toilets and not practicing OD and not having CWS/ WSC in the villages have been included in HHs practicing OD.

Evaluation study on Total Sanitation Campaign Page 62
Table: Census Data on Open defecation Annex-39
Sl. No.
States Percentage of Rural
Households
having toilets as per 1991
Census
Percentage of Rural
Households
having toilets as per 2001
Census
Percentage of Rural
Households
having toilets as per 2011
Census
Decadal
decrease in the
% of Rural HHs not
having toilets 91-01
Decadal
decrease in the
% of Rural HHs not
having toilets 01-11
Increase in the
decadal decrease
rate (Rural)
Decadal decrease in the number
of Rural HHs not having
toilets 91-01 (in
Thousands)
Decadal decrease in the number
of Rural HHs not having
toilets 01-11 (in
Thousands)
Additional number of rural toilets added in
the 2nd decade (in thousands)
1 2 3 4 5 6 7 8 9 10 11
1 Andhra Pr. 6.61 18.10 32.20 11.49 14.10 2.61 1610 2293 683
2 Arunachal Pr. 42.62 47.30 52.70 4.68 5.40 0.72 14 25 11
3 Assam 30.53 59.60 59.60 29.07 0.00 -29.07 1499 688 -811
4 Bihar +Jharkhand 4.96 12.21 15.43 7.25 3.22 -4.03 1403 1325 -78
6 Goa 29.99 48.20 70.90 18.21 22.70 4.49 28 21 -8
7 Gujarat 11.16 21.70 33.00 10.54 11.30 0.76 742 955 213
8 Haryana 6.53 28.70 56.10 22.17 27.40 5.23 579 960 380
9 Himachal Pr. 6.42 27.70 66.60 21.28 38.90 17.62 248 569 321
11 Karnataka 6.85 17.40 28.40 10.55 11.00 0.45 783 1072 289
12 Kerala 44.07 81.30 93.20 37.23 11.90 -25.33 2241 -201 -2442
13 MadhyaPr.+ Chattisgarh 3.64 7.82 13.50 4.18 5.68 1.50 569 1195 626
15 Maharashtra 6.64 18.20 38.00 11.56 19.80 8.24 1404 2945 1542
16 Manipur 33.02 77.50 86.00 44.48 8.50 -35.98 156 59 -97
17 Meghalaya 18.13 40.10 53.90 21.97 13.80 -8.17 84 95 11
18 Mizoram 58.37 79.70 84.60 21.33 4.90 -16.43 27 25 -1
19 Nagaland 26.86 64.60 69.20 37.74 4.60 -33.14 125 26 -99 20 Odisha 3.58 7.70 14.10 4.12 6.40 2.28 337 626 289
21 Punjab 15.79 40.90 70.40 25.11 29.50 4.39 763 1199 436
22 Rajasthan 6.65 14.60 19.60 7.95 5.00 -2.95 668 815 147
23 Sikkim 30.20 59.40 84.10 29.20 24.70 -4.50 33 23 -10
24 Tamil Nadu 7.17 14.40 23.20 7.23 8.80 1.57 587 1027 440
25 Tripura 62.43 77.90 81.50 15.47 3.60 -11.87 146 75 -71
26 Uttar Pr. + Uttaranchal 6.44 19.88 23.49 13.44 3.61 -9.84 3166 1982 -1184
28 West Bengal 12.31 26.90 46.70 14.59 19.80 5.21 1907 3403 1497
29 A&N Islands 26.32 42.30 60.20 15.98 17.90 1.92 10 15 5
India 9.48 21.90 30.70 12.42 8.80 -3.62 19698 21241 1543
Source: Census, 1991, 2001, and 2011.

Evaluation study on Total Sanitation Campaign Page 63
Annex-40
Table: Annual Income of Households and Usage of toilets
Estimated Mean Annual Income 1 2 3 4*
Toilet Facility Yes Yes No Open defecation No Yes Yes Total 30523 26596 36228 Total (Minus Karnataka) 23723 29974 26165 Andhra Pradesh 19100 16915 16368 Assam 27845 27692 25000 Bihar 33077 29388 Gujarat 31788 18500 27716 Haryana 33064 36786 23939 Jharkhand 32965 30803 Karnataka 58942 60000 58244 Kerala 25080 24167 Madhya Pradesh 10806 7809 Maharashtra 33565 24091 29688 Manipur 34254 30526 Meghalaya 30599 20000 Odisha 32280 26458 30000 Punjab 32750 35500 Rajasthan 24568 24658 Sikkim 31472 25000 Tamil Nadu 52288 51100 45945 Uttar Pradesh 26867 26535 Uttarakhand 29288 31083 West Bengal 28250 27411 25000 *It may be recalled that in our sample the number of HHs not having toilets in states like WB, Odisha, Uttar Pradesh Assam and Haryana, where only households having toilets have been selected, is very few. However whatever data was available, have been shown here.

Evaluation study on Total Sanitation Campaign Page 64
Annex-41
Table : Availability of School toilet and Coverage by TSC different states: (Information collected from selected gram panchayats)
States Selected Gram Panchayats Selected NGP awarded Gram Panchyats
Number of Schools without toilets
Number of schools in the Gram Panchayat
Number of schools covered under TSC
Percentage of Schools Covered by TSC
Number of Schools without toilets
Number of schools in the Gram Panchayat
Number of schools covered under TSC
Percentage of Schools Covered by TSC
Andhra Pradesh
20 (9.6%) 208 178 86 1 24 23 96
Assam 321 (27%) 1187 444 37 . 30 30 100
Bihar 8 (24.8%) 475 184 39 . 91 52 57
Gujarat 6 (4.0%) 151 40 26 1 27 9 33
Haryana 2 (1.6%) 128 28 22 . 25 7 28
Jharkand 54 (12.2%) 444 289 65 3 86 59 69
Karnataka 33 (6.6%) 497 199 40 . 45 14 31
Kerala 1 (0.13%) 768 159 21 . 340 78 23
Madhya Pradesh
42 (16.7%) 251 99 39 . 18 8 44
Maharashtra 1 (0.6%) 167 121 72 . 35 22 63
Orissa 40 (5.9%) 683 551 81 . 93 92 99
Punjab 4 (3.2%) 125 33 26 . 5 0 0
Rajasthan 6 (1.5%) 405 119 29 . 102 37 36
Sikkim 0(0.0%) 107 71 66 . 78 53 68
Tamilnadu 3 (1.7%) 176 130 74 . 33 25 76
Uttar Pradesh 2 (9.6%) 208 124 60 . 34 28 82
West Bengal 66 (5.0%) 1326 866 65 6 573 460 80
Manipur 50 (37.9%) 132 21 16 . . . 0
Meghalaya 9 (19.6% 46 20 43 . 7 3 43
Uttarakhand 1 (1.3%) 78 5 6 . 22 0 0
Total (of the selected gram Panchayat)
779(10.30%) 7562 3681 49 11(0.66%) 1668 1000 60

Evaluation study on Total Sanitation Campaign Page 65
Annex-42
Table : Availability of anganwadi toilet and Coverage by TSC different states: (Information collected from selected gram panchayats)
States Percentage of Gram Panchayats reported anganwadis without toilet
Govt. Building Private Buildign
Number of Anganwadi
Number of Anganwadi ding covered under TSC
Percentage of Anganwadi covered under TSC
Number of Anganwadi in Pvt. building
Number of Anganwadi in Pvt. building covered under TSC
Percentage of Anganwadi covered under TSC
Andhra Pradesh
54.3% 24 24 100 14 14 100
Assam 65.7% 592 287 48 231 3 1
Bihar 77.1% 14 5 36 485 106 22
Gujarat
14.3% 372 72 19 51 4 8
Haryana 38.6% 85 18 21 35 5 14
Jharkand 55.0% 90 74 82 297 89 30
Karnataka 60.0% 230 230 100 2 2 100
Kerala 4.3% 1180 234 20 791 0 0
Madhya Pradesh
45.7% 86 10 12 54 0 0
Maharashtra 15.7% 144 100 69 19 8 42
Orissa 54.3% 166 143 86 68 13 19
Punjab 62.9% 104 0 0 11 1 9
Rajasthan 32.9% 164 63 38 136 8 6
Sikkim 15.0% 88 48 55 6 1 17
Tamilnadu 2.9% 106 106 100 13 0 0
Uttar Pradesh
10.0% 159 66 42 23 0 0
West Bengal
32.9% 630 439 70 915 381 42
Manipur 100.0% 43 2 5 320 0 0
Meghalaya 25.0% 14 8 57 0 0 0
Uttarakhand 12.5% 74 2 3 24 1 4
Total (of the selected gram Panchayat)
38.4% 4365 1931 44 3495 636 18

Evaluation study on Total Sanitation Campaign Page 66
Annex-43
Table: Availability of anganwadi toilet and Coverage by TSC in NGP awarded Gram Panchayats different states: (Information collected from selected gram panchayats who have been awarded NGP)
States Information about NGP awarded Gram Panchayats Govt. Building Private Building Number of Anganwadi
Number of Anganwadi covered under TSC
Percentage of Anganwadis covered under TSC
Number of Anganwadi in Pvt. building
Number of Anganwadi covered under TSC
Percentage of Anganwadis covered under TSC
Andhra Pradesh
5 5 100 2 2 100
Assam 16 16 100 4 0 0
Bihar 1 2 200 71 49 69
Gujarat 34 12 35 4 0 0
Haryana 14 4 29 4 2 50
Jharkand 10 10 100 37 25 68
Karnataka 24 24 100 0 0 0
Kerala 520 58 11 282 0 0
Madhya Pradesh
4 0 0 9 0 0
Maharashtra 29 15 52 2 0 0
Orissa 28 28 100 14 5 36
Punjab 6 0 0 0 0
Rajasthan 44 21 48 31 4 13
Sikkim 65 41 63 4 1 25
Tamilnadu 22 23 105 1 0 0
Uttar Pradesh 38 14 37 4 0 0
West Bengal 233 183 79 418 284 68
Manipur . . . . . .
Meghalaya 1 0 0 0 0 0
Uttarakhand 9 0 0 10 0 0
Total (of the selected NGP awarded gram Panchayat)
1103 456 41 897 372
41

Evaluation study on Total Sanitation Campaign Page 67
Annex- 44
Table : Availability of School and Anganwadi toilets in different states: (Information collected from selected district authorities)
States Percentage of schools without toilets
Percentage of schools where there is no separate toilets for girls (of the schools having toilet facility)
Percentage of Angawadis without toilet
Andhra Pradesh 13.6 3.6 40.8
Assam 38.7 39.8 51.5
Bihar 44.2 38.8 43.1
Gujarat 0.0 7.1 17.7
Haryana 0.7 3.3 27.5
Jharkand 35.7 51.7 91.4
Karnataka 12.8 0.0 23.3
Kerala 0.0 0.0 0.7
Madhya Pradesh 26.4 36.9 47.4
Maharashtra 0.3 12.1 8.7
Orissa 15.9 28.5 44.8
Punjab 5.2 0.0 55.4
Rajasthan 1.5 10.4 36.7
Sikkim 0.0 47.1 27.0
Tamilnadu 0.6 17.1 17.9
Uttar Pradesh 10.6 18.3 52.6
West Bengal 4.0 15.7 53.1
Manipur 68.9 47.8 93.2
Meghalaya 49.7 5.7 82.9
Uttarakhand 9.4 24.1 0.94
Total 13.9 16.63 37.27

Evaluation study on Total Sanitation Campaign Page 68
Annex-45
Table: Availability, Use and functionality of the School toilets in different states (Source: Household Level Schedule)
States
Percentage of Households reported availability of toilets in the village school
Percentage of Households who reported separate toilets for girls (in case school toilet is available)
Percentage of Households who reported children are allowed to use the toilets (in case school toilet is available)
Percentage of Households who reported toilets remain functional throughout the year (in case school toilet is available)
Yes No Generally
Andhra Pradesh
94.00 75 78 75 15 8
Assam 83.00 97 99 99 0 0 Bihar 86.00 98 89 3 94 1 Gujarat 100.00 100 100 100 0 0 Haryana 100.00 92 94 95 3 0 Jharkand 78.00 98 77 4 80 5 Karnataka 100.00 100 100 99 0 0 Kerala 100.00 100 100 100 0 0 Madhya Pradesh
90.00 38 100 100 11 0
Maharashtra 100.00 100 100 98 0 1
Orissa 100.00 80 100 100 0 0 Punjab 100.00 97 100 100 0 0 Rajasthan 100.00 100 100 100 0 0 Sikkim 100.00 100 100 99 1 0 Tamilnadu 92.00 83 91 82 16 0
Uttar Pradesh
100.00 97 98 98 2 0
West Bengal
95.00 84 99 84 11 4
Manipur 19.00 52 100 100 0 0 Meghalaya 90.00 72 100 100 0 0
Uttarakhand 100.00 76 100 100 0 0
Total 94.75 88.54 95.72 85.40 12.76 1.06

Evaluation study on Total Sanitation Campaign Page 69
Annex-46
Table: Availability, Use and functionality of the anganwadi toilets in different states ( Source: Household Level Schedule)
States Percentage of Households reported availablility of toilets in the village anganwadis
Percentage of Households who reported separate toilets for girls(in case anganwadi toilet is available)
Percentage of Households who reported children are allowed to use the toilets. (in case school anganwadi toilet is available)
Percentage of Households who reported toilets remain functional throughout the year (in case school anganwadi toilet is available) Yes (%) No (%) Generally
(%)
1 2 3 4 5 6 7
Andhra Pradesh 45 24 51 54 34 2.8
Assam 58 26 99 99 0 0.2
Bihar 24 70 99 5 93 1.8
Gujarat 97 4 99 99 0 0.0
Haryana 77 42 97 95 3 0.0
Jharkand 26 16 94 7 79 8.7
Karnataka 100 100 100 100 0 0.0
Kerala 99 0 100 99 0 0.0
Madhya Pradesh 53 0 100 100 89 0.0
Maharashtra 95 1 98 98 1 0.0
Orissa 74 0 98 97 2 0.0
Punjab 67 100 100 100 0 0.0
Rajasthan 98 1 100 99 2 0.0
Sikkim 95 55 100 58 41 0.5
Tamilnadu 83 2 88 75 20 0.0
Uttar Pradesh 59 0 95 95 2 0.2
West Bengal 65 63 98 65 29 4.8
Manipur 14 0 100 100 0 0
Meghalaya 65 0 100 100 0 0
Total 69.01 22.02 95.90 87.84 14.36 0.67
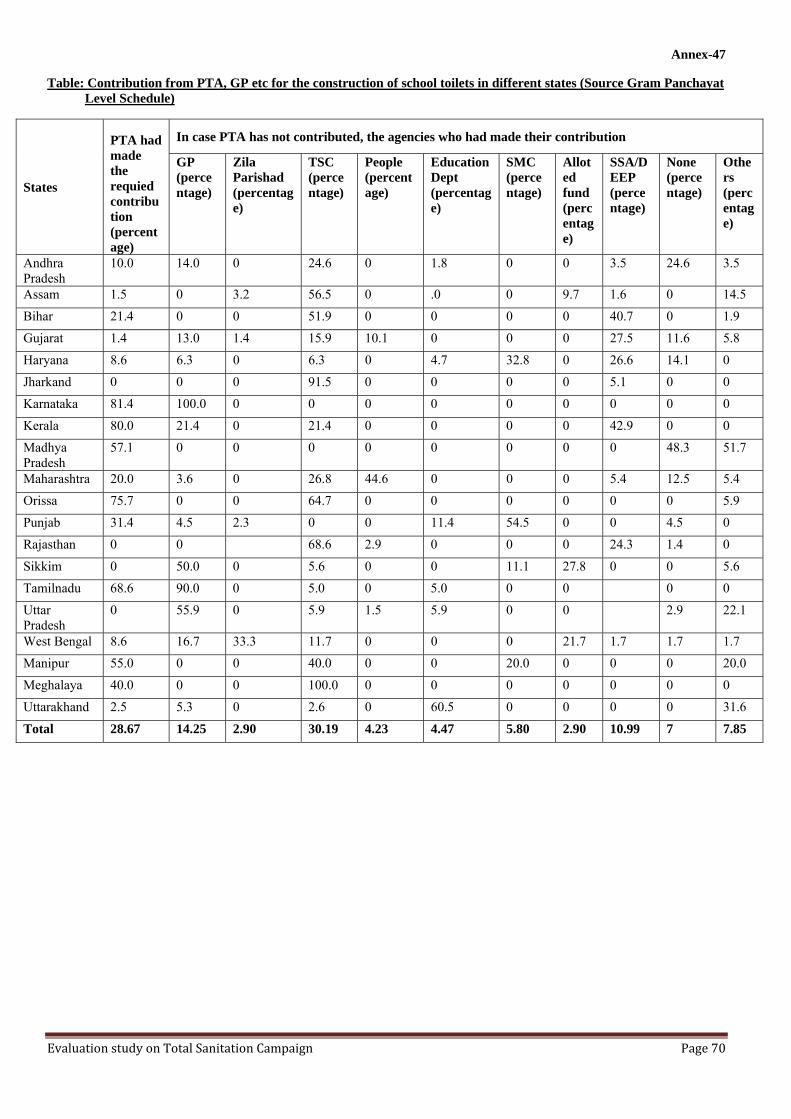
Evaluation study on Total Sanitation Campaign Page 70
Annex-47
Table: Contribution from PTA, GP etc for the construction of school toilets in different states (Source Gram Panchayat Level Schedule)
States
PTA had made the requied contribution (percentage)
In case PTA has not contributed, the agencies who had made their contribution
GP (percentage)
Zila Parishad (percentage)
TSC (percentage)
People (percentage)
Education Dept (percentage)
SMC (percentage)
Alloted fund (percentage)
SSA/DEEP (percentage)
None (percentage)
Others (percentage)
Andhra Pradesh
10.0 14.0 0 24.6 0 1.8 0 0 3.5 24.6 3.5
Assam 1.5 0 3.2 56.5 0 .0 0 9.7 1.6 0 14.5
Bihar 21.4 0 0 51.9 0 0 0 0 40.7 0 1.9
Gujarat 1.4 13.0 1.4 15.9 10.1 0 0 0 27.5 11.6 5.8
Haryana 8.6 6.3 0 6.3 0 4.7 32.8 0 26.6 14.1 0
Jharkand 0 0 0 91.5 0 0 0 0 5.1 0 0
Karnataka 81.4 100.0 0 0 0 0 0 0 0 0 0
Kerala 80.0 21.4 0 21.4 0 0 0 0 42.9 0 0
Madhya Pradesh
57.1 0 0 0 0 0 0 0 0 48.3 51.7
Maharashtra 20.0 3.6 0 26.8 44.6 0 0 0 5.4 12.5 5.4
Orissa 75.7 0 0 64.7 0 0 0 0 0 0 5.9
Punjab 31.4 4.5 2.3 0 0 11.4 54.5 0 0 4.5 0
Rajasthan 0 0 68.6 2.9 0 0 0 24.3 1.4 0
Sikkim 0 50.0 0 5.6 0 0 11.1 27.8 0 0 5.6
Tamilnadu 68.6 90.0 0 5.0 0 5.0 0 0 0 0
Uttar Pradesh
0 55.9 0 5.9 1.5 5.9 0 0 2.9 22.1
West Bengal 8.6 16.7 33.3 11.7 0 0 0 21.7 1.7 1.7 1.7
Manipur 55.0 0 0 40.0 0 0 20.0 0 0 0 20.0
Meghalaya 40.0 0 0 100.0 0 0 0 0 0 0 0
Uttarakhand 2.5 5.3 0 2.6 0 60.5 0 0 0 0 31.6
Total 28.67 14.25 2.90 30.19 4.23 4.47 5.80 2.90 10.99 7 7.85

Evaluation study on Total Sanitation Campaign Page 71
Annex-48
Table : Coverage of school sanitation under different schemes in different states (Source Gram Panchayat Level Schedule)
States
Schemes under which toilets are being constructed in schools SSA (Percentage)
RSVY (Percentage)
TSC (Percentage)
DPEP (Percentage)
PTA (Percentage)
School Management (Percentage)
Others (Percentage)
Andhra Pradesh 2.9 0 85.7 0 0 0 0
Assam 1.5 0 59.7 10.4 0 0 0
Bihar 31.4 0 10.0 0 0 0 0
Gujarat 50.0 0 27.1 2.9 0 0 4.3
Haryana 54.3 0 31.4 1.4 0 0 0
Jharkand 6.7 0 15.0 0 0 0 0
Karnataka 18.6 0 12.9 1.4 0 0 0
Kerala 21.4 0 5.7 0 4.3 1.4 0
Madhya Pradesh
20.0 0 41.4 0 0 0 7.1%
Maharashtra 7.1 0 67.1 0 0 0 4.3%
Orissa 0 0 61.4 0 0 0 0
Punjab 41.4 1.4 8.6 1.4 0 1.4 4.3
Rajasthan 10.0 0 24.3 1.4 0 0 0
Sikkim 10.0 0 50.0 0 0 0 5.0
Tamilnadu 1.4 0 92.9 0 0 0 0
Uttar Pradesh 1.4 0 14.3 11.4 0 0 2.9
West Bengal 5.7 0 47.1 0 0 0 0
Manipur 15.0 0 10.0 0 0 20.0 5.0
Meghalaya 10.0 0 50.0 0 0 0 5.0
Uttarakhand 50.0 5.0 2.5 15.0 0 0 5.0
Total 18.1 0.2 36.7 2.2 0.2 0.5 1.8

Evaluation study on Total Sanitation Campaign Page 72
Annex- 49
Table: Construction of school and angawadis toilets in different states under TSC (inform collected from district authorities)
States Financial Year
Construction of School toilet (No.)
Construction of Anganwadi toilet (No.)
States Construction of School toilet (No.)
Construction of Anganwadi toilet (No.)
States Construction of School toilet (No.)
Construction of Anganwadi toilet (No.)
Andhra Pradesh
2001-05 4049.00 .00 Orissa 1838.00 27.00 Madhya Pradesh
1901.00 101.00
2006 4507.00 .00 767.00 105.00 1219.00 120.00
2007 3760.00 440.00 2451.00 975.00 712.00 78.00
2008 9337.00 142.00 4507.00 1200.00 1348.00 330.00
2009 6607.00 768.00 3227.00 1640.00 4665.00 899.00
Assam 2001-05 15.00 .00 Punjab 81.00 .00 Maharashtra
2478.00 678.00
2006 .00 .00 21.00 .00 3629.00 1411.00
2007 45.00 .00 1.00 .00 4811.00 3492.00
2008 184.00 49.00 .00 4.00 4102.00 3356.00
2009 1969.00 592.00 533.00 .00 2559.00 1462.00
Bihar 2001-05 28.00 .00 Rajasthan
627.00 6.00 Meghalaya .00 .00
2006 22.00 .00 612.00 14.00 .00 .00
2007 1339.00 .00 2373.00 239.00 .00 .00
2008 2540.00 30.00 3975.00 309.00 100.00 40.00
2009 1948.00 39.00 981.00 576.00 186.00 55.00
Gujarat
2001-05 900.00 .00 Sikkim 66.00 43.00 Uttarakhand
20.00 .00
2006 2206.00 1863.00 536.00 78.00 88.00 1.00
2007 2228.00 2148.00 20.00 31.00 86.00 3.00
2008 600.00 2047.00 28.00 47.00 82.00 8.00
2009 172.00 437.00 119.00 40.00 167.00 5.00
Haryana 2001-05 594.00 .00 Tamilnadu
3339.00 3174.00 KERALA 366.00 6.00
2006 74.00 .00 1594.00 1151.00 311.00 300.00
2007 343.00 541.00 1108.00 266.00 186.00 262.00
2008 1217.00 1423.00 667.00 528.00 322.00 559.00
2009 72.00 47.00 1192.00 1148.00 378.00 422.00
Jharkand 2001-05 475.00 1.00 Uttar Pradesh
2439.00 .00 Manipur .00 .00
2006 634.00 .00 2896.00 10.00 .00 .00
2007 1280.00 12.00 2851.00 455.00 23.00 .00
2008 1639.00 413.00 2283.00 870.00 78.00 .00
2009 2692.00 69.00 7989.00 3564.00 27.00 42.00
Karnataka
2001-05 4269.00 234.00 West Bengal
7668.00 .00 2006 2547.00 2137.00 1295.00 .00 2007 1659.00 2492.00 4424.00 2148.00 2008 2164.00 1164.00 5777.00 4825.00 2009 74.00 229.00 7976.00 496.00

Evaluation study on Total Sanitation Campaign Page 73
Annex-50
Table -Physical Achievement - construction/functionality of CSCs/WSCs
SL.No. State/District Name BLS based targets
achievement(upto march 2009 )
% achievement till March 2009
Functional CSCs/WSCs till March 2009
% of toilets found functional out of total constructed
achievement(upto march 2012)*
% achievement upto March 2012
1 ANDHRA PRADESH 575 895 156 na - 957 166
2 ASSAM 211 1 0 1 100 39 18 3 BIHAR 2362 565 24 na - 727 31 4 GUJARAT 1671 1589 95 na - 1764 106 5 HARYANA 1335 977 73 924 95 1255 94 6 JHARKHAND 1203 80 7 80 100 209 17 7 KARNATAKA 1305 527 40 486 92 818 63 8 KERALA 1090 719 66 599 83 960 88
9 MADHYA PRADESH 1602 588 37 na - 975 61
10 MAHARASHTRA 8210 2923 36 2923 100 5669 69 11 MANIPUR 386 41 11 41 100 294 76 12 MEGHALAYA 290 58 20 37 64 149 51 13 ORISSA 818 17 2 17 100 105 13 14 PUNJAB 411 63 15 56 89 66 16 15 RAJASTHAN 1544 336 22 85 25 484 31 16 SIKKIM 789 913 116 913 100 913 116 17 TAMIL NADU 1438 1543 107 504 33 1552 108 18 UTTAR PRADESH 2366 2300 97 1341 58 2379 101 19 UTTARAKHAND 470 53 11 53 100 86 18 20 WEST BENGAL 1140 511 45 na - 986 86 Total 29216 14699 50 8089 55 20387 70
*Figures taken from official website of M/o DWSS

Evaluation study on Total Sanitation Campaign Page 74
Annex-51
Table: Role played by PRIs/NGOs in Maintenance of Community Sanitary Complex/ Women Sanitary Complex under TSC
Sl. No.
State No.
of sample districts
Whether PRIs/NGOs played Role in Maintenance of Community Sanitary Complex/ Women Sanitary Complex at district level
PRIs NGOs
1 2 3 4 5
1 Andhra Pradesh 7 3 1
2 Gujarat 7 6 0
3 Haryana 7 5 1
4 Jharkhand 7 0 2
5 Karnataka 7 7 2
6 Kerala 7 7 0
7 Madhya Pradesh 7 4 0
8 Maharashtra 7 4 0
9 Manipur 2 1 0
10 Meghalaya 2 0* 1
11 Orissa 7 1 1
12 Punjab 7 1 0
13 Rajasthan 7 4 1
14 Sikkim 2 2 0
15 Tamil Nadu 7 5 1
16 Uttar Pradesh 7 3 0
17 Uttarakhand 4 2 0
18 West Bengal 7 5 3
Total 108 60 [55.56] 13 [12.04]
Note: In Assam and Bihar, no participation of PRIs as well as NGOs was reported by the State, District, Block and GP level authorities.
*As per the observations during the field visits, PRI/GP concept is nonexistent in Meghalaya.

Evaluation study on Total Sanitation Campaign Page 75
Annex-52
Table: Availability of CSC/WSC in the GPs and their maintenance
Percentage in col 5 calculated wrt col 4.
Note: As per the observations during the field visits, PRI/GP concept is nonexistent in Meghalaya. Information has been collected from the selected villages.
@No CSCs/WSCs reported in Assam, Bihar, Jharkhand and Meghalaya
*Schedules of 10 GPs of Ramgarh District were not canvassed since this district carved out of undivided Hazaribag district only in 2007 and information for reference period for this study was not available.
**Component of Community Sanitation under TSC has not been addressed in Punjab.
Sl. No.
State No. of Sample GPs
No. of GPs in which CSC/WSC available
No. of GPs where separate latrines and bath rooms constructed for male/ female
No. of CSC/ WSC in the GP
CSC maintain in the GPs by
GPs SHG members
Users Others
1 Andhra Pradesh 70 5 3[60.00] 9 3 0 0 0
2 Assam 67 0@ 0 0 0 0 0 0
3 Bihar 70 0@ 0 0 0 0 0 0
4 Gujarat 70 13 4[30.77] 21 7 0 5 1
5 Haryana 70 17 12[70.59] 24 14 1 0 0
6 Jharkhand 60* 0@ 0 0 0 0 0 0
7 Karnataka 70 9 9[100.00] 13 8 0 0 1
8 Kerala 70 4 4 [100.00] 6 1 0 3 0
9 Madhya Pradesh 70 3 3[100.00] 3 3 0 0 0
10 Maharashtra 70 33 8[24.24] 200 12 0 21 0
11 Orissa 70 2 2[100.00] 3 0 0 0 2
12 Punjab** 70 0 0 0 0 0 0 0
13 Rajasthan 70 8 6 [75.00] 9 4 1 0 0
14 Sikkim 20 8 6 [75.00] 11 2 0 5 0
15 Tamil Nadu 70 68 50[73.53] 74 20 43 0 0
16 Uttar Pradesh 70 3 2[66.67] 4 1 0 0 1
17 West Bengal 70 28 24[85.71] 59 9 0 7 11
18 Manipur 20 7 6 [85.71] 8 3 0 0 3
19 Meghalaya 20 0@ 0[ - ] 0 0 0 0 0
20 Uttarakhand 40 3 1 [33.33] 52 1 0 1 1
Total 1207 211 140[66.35] 496 88 45 42 20

Evaluation study on Total Sanitation Campaign Page 76
Annex- 53
Table: Availability of CSC/WSC in the village and their Uses
Sl. No.
State Total No. of Households (only for those GPs which reported existence of community toilets)
No. of Households saying CSC/ WSC located in the village
CSC/WSC used by:
HH family members
Other Villagers
SC / ST Class
1 2 3 4 5 6 7
1 Andhra Pradesh 50 20 7 10 9
2 Gujarat 130 130 13 111 48
3 Haryana 170 155 12 117 57
4 Karnataka 90 79 1 68 10
5 Kerala 40 4 0 0 0
6 Madhya Pradesh 30 20 0 10 0
7 Maharashtra 330 297 59 273 112
8 Orissa 20 10 0 10 10
9 Rajasthan 80 80 0 78 0
10 Sikkim 80 64 0 64 43
11 Tamil Nadu 680 369 25 177 16
12 Uttar Pradesh 30 60 3 27 12
13 West Bengal 280 170 4 149 42
14 Manipur 70 50 50 50 50
15 Uttarakhand 30 7 0 0 0
Total 2110 1515[71.8] 174[11.49] 1144[75.5] 409[26.99]

Evaluation study on Total Sanitation Campaign Page 77
Annex-54
Table: Provision of user Charges collection
Sl. No.
State No. of GPs reporting existence of CSC/ WSC
No. of GPs reporting collecting of user charges
1 2 3 4
1 Andhra Pradesh 5 0
2 Gujarat 13 2 [15.38]
3 Haryana 17 0
4 Karnataka 9 1 [11.11]
5 Kerala 4 0
6 Madhya Pradesh 3 0
7 Maharashtra 33 0
8 Orissa 2 1[50]
9 Rajasthan an 8 3 [37.5]
10 Sikkim 8 1[12.5]
11 Tamil Nadu 68 16 [23.53]
12 Uttar Pradesh 3 0
13 West Bengal 28 6 [21.43]
14 Manipur 7 2 [28.57]
15 Uttarakhand 3 1[33.33]
Total 211 33 [15.64]
Since no CSC/WSC have been reported in the selected GPs in Assam, Bihar, Jharkhand, Punjab & Meghalaya, these states have been removed in the above Table
1. Figures in parenthesis indicate percentages wrt col 3
2. Since no CSC/WSC have been reported in the selected GPs in Assam, Bihar, Jharkhand, Punjab & Meghalaya, these states have been removed in the above Table

Evaluation study on Total Sanitation Campaign Page 78
Table : Recruit of and roles assigned to the Motivators at the Gram Panchayat level Annex-55
States Percentage of GPs where
motivators have been
recruited
Role Assigned to the Motivators Collect Information
and propagate awarness about
sanitation, water purification, hygiene and construction of
latrines.
Swachhata doot/block level
coordinator motivate people
for construction of latrine or safe
disposal of garbage
Contact people
individually to construct
latrines
Formation of Nigran
i Commi
ttee
Spot verificatio
n and support of
TSC insentive
distribution
Preparation of list
of demand for
household toilets
Stressing importance of avoiding
open defecation
To facilitate
in the household
latrine constructi
on
People are
engaged
throguh
slogans
Others
Andhra Pradesh 12% 20% 60% 20%
Assam Nil
Bihar 99% 5% 49% 7% 15% 24%
Gujarat 54% 14% 14% 50% 7% 14%
Haryana 49% 59% 4% 22% 4% 4% 7%
Jharkhand 100% 6% 6% 6% 17% 67%
Karnataka 54% 16% 74% 11%
Kerala 64% 29% 29% 29% 14%
Madhya Pradesh
9% 50% 25% 25%
Maharashtra 74% 20% 10% 70%
Orissa 23% 25% 50% 25%
Punjab Nil
Rajasthan 99% 95% 5%
Sikkim NIl
Tamil Nadu 100% 100%
Uttar Pradesh 29% 8% 83% 8%
West Bengal 44% 80% 20%
Manipur 6% 100%
Meghalaya Nil
Uttrakhand 36% 79% 7% 7% 7%
All India 46% 26% 11% 45% 0.3% 0.3% 2% 1% 4% 1% 10%

Evaluation study on Total Sanitation Campaign Page 79
Annex-56
Table : Awareness of TSC among the households
States Awareness of TSC
Source of Awareness Self Ward
(Son/Daughter)
Grffiti Radio/TV
News Paper
Meeting
NGO/SHG
Others Private Entreprenue
r
Sarpanch
Anganwadi Worker
Andhra Pradesh
76.1% 16.1% 2.0% .1% 1.0% .7% 37.9% 3.1% 14.1% .0% 1.9% .0%
Assam 98.7% 65.9% 7.7% .0% 7.0% .0% 2.5% 12.8% 1.9% .0% .0% .0%
Bihar 54.6% 6.6% 10.1% .0% 10.3% 1.0% 8.0% 56.9% 7.1% .0% .0% .0%
gujarat 91.4% 1.9% .1% .0% 2.1% .6% 66.6% 2.9% 10.4% .0% 4.4% 2.4%
Haryana 97.0% 7.0% 1.6% .9% 4.1% .3% 9.7% 7.0% 6.6% .0% 58.0% 3.3%
Jharkand 43.0% 8.9% 3.1% .0% 8.7% .3% 5.7% 72.6% .7% .0% .0% .0%
Karnataka 83.1% 32.0% 6.4% .1% .0% .4% 44.1% .0% .3% .0% .0% .0%
KERALA 99.9% 20.3% .7% .6% 14.9% 1.6% 24.9% 35.6% 1.3% .0% .1% .0%
Madhya Pradesh
100.0% 8.7% 4.7% .0% .0% .0% 10.4% 12.7% .7% .0% 62.7% .0%
Maharashtra
93.9% .9% .4% .0% .0% .1% 61.6% 4.4% 23.7% .0% 2.6% .1%
Orissa 100.0% 2.6% 1.1% .1% .3% .1% 22.1% 68.7% 3.0% 1.6% .3% .0%
Punjab 90.0% .0% .0% .0% 3.3% .0% 10.0% .0% .0% .0% 76.7% .0%
Rajasthan 100.0% 2.9% .0% .0% .0% .0% .0% 4.3% .3% .1% 92.4% .0%
Sikkim 100.0% 14.0% 1.5% 15.0% 27.0% .0% 7.5% 3.5% 17.0% .0% 14.5% .0%
Tamilnadu 92.6% 14.3% 21.9% .0% 3.9% .9% .0% 15.9% 34.9% .0% .0% .0%
Uttar Pradesh
98.6% .4% .0% 4.9% .0% .6% 86.0% .3% 6.4% .0% 1.4% .0%
West Bengal
98.7% 1.9% 1.7% .1% 1.4% .3% 21.0% 63.0% 8.7% .0% .7% .0%
Manipur 100.0% .5% .0% .0% .0% .0% 15.5% 81.5% 2.5% .0% .0% .0%
Meghalaya 100.0% 1.0% 1.5% .0% .0% .0% 44.0% .0% 53.5% .0% .0% .0%
Uttarakhand 99.2% 1.5% .0% .0% .0% 3.0% 93.0% .0% 2.3% .0% .0% .0%
All India 89.10% 11.80% 3.80% 0.70% 3.70% 0.50% 28.80% 23.30% 8.60% 0.10% 14.10% 0.40%

Evaluation study on Total Sanitation Campaign Page 80
Annex-57
Table: Effectiveness of IEC Activities
States Effectiveness of IEC Activities
Good Could be better Poor Andhra Pradesh 18% 28% 54%
Assam 6% 88% 5%
Bihar 1% 24% 75%
gujarat 45% 50% 5%
Haryana 16% 58% 26%
Jharkand 1% 39% 60%
Karnataka 16% 65% 19%
KERALA 96% 4% 0%
Madhya Pradesh 5% 39% 55%
Maharashtra 65% 25% 11%
Orissa 14% 59% 27%
Punjab 0% 34% 66%
Rajasthan 4% 9% 88%
Sikkim 45% 49% 6%
Tamilnadu 10% 60% 29%
Uttar Pradesh 0% 53% 46%
West Bengal 33% 64% 3%
Manipur 1% 70% 30%
Meghalaya 0% 94% 7%
Uttarakhand 5% 86% 9%
All India 21% 47% 32%
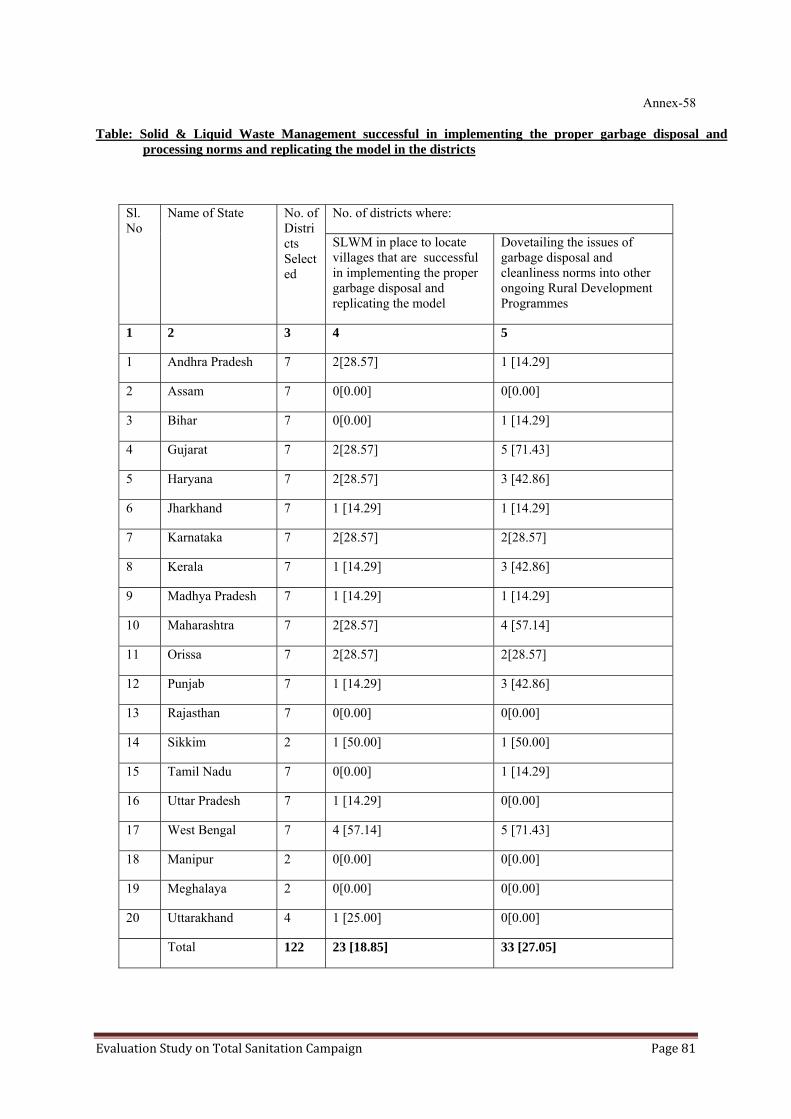
Evaluation Study on Total Sanitation Campaign Page 81
Annex-58
Table: Solid & Liquid Waste Management successful in implementing the proper garbage disposal and processing norms and replicating the model in the districts
Sl. No
Name of State No. of Districts Selected
No. of districts where:
SLWM in place to locate villages that are successful in implementing the proper garbage disposal and replicating the model
Dovetailing the issues of garbage disposal and cleanliness norms into other ongoing Rural Development Programmes
1 2 3 4 5
1 Andhra Pradesh 7 2[28.57] 1 [14.29]
2 Assam 7 0[0.00] 0[0.00]
3 Bihar 7 0[0.00] 1 [14.29]
4 Gujarat 7 2[28.57] 5 [71.43]
5 Haryana 7 2[28.57] 3 [42.86]
6 Jharkhand 7 1 [14.29] 1 [14.29]
7 Karnataka 7 2[28.57] 2[28.57]
8 Kerala 7 1 [14.29] 3 [42.86]
9 Madhya Pradesh 7 1 [14.29] 1 [14.29]
10 Maharashtra 7 2[28.57] 4 [57.14]
11 Orissa 7 2[28.57] 2[28.57]
12 Punjab 7 1 [14.29] 3 [42.86]
13 Rajasthan 7 0[0.00] 0[0.00]
14 Sikkim 2 1 [50.00] 1 [50.00]
15 Tamil Nadu 7 0[0.00] 1 [14.29]
16 Uttar Pradesh 7 1 [14.29] 0[0.00]
17 West Bengal 7 4 [57.14] 5 [71.43]
18 Manipur 2 0[0.00] 0[0.00]
19 Meghalaya 2 0[0.00] 0[0.00]
20 Uttarakhand 4 1 [25.00] 0[0.00]
Total 122 23 [18.85] 33 [27.05]

Evaluation Study on Total Sanitation Campaign Page 82
Annex-59
Table: Mechanism for proper disposal of solid and liquid Waste Management used by Households
State
Districts
Total no. of HHs/ Beneficiaries
No. of Households use Mechanism for proper disposal of solid and liquid waste:
No. of House holds saying drains & sewers cleaned regularly
No. of House holds take help of manual scavengers to dispose off the night soil
Common Compost Pit
Drainage Soakage Channels/ pits for hh gray water runoff
Reuse of waste water
Vermi-composting
Andhra Pradesh
7 700 124[17.71] 157[22.43] 156[22.29] 54[07.71] 31[04.43] 189[27.00] 40[05.71]
Assam 7 689 0[0.0] 0[0.0] 0 [0.0] 0[0.0] 0[0.0] 52[07.55] 1[0.15]
Bihar 7 700 0[0.0] 0[0.0] 0[0.0] 0[0.0] 0[0.0] 2[0.29] 0[0.0]
Gujarat 7 700 57[08.14] 265[37.86] 549[78.43] 7[01.00] 6[00.86] 255 36.43] 0[0.0]
Haryana 7 700 19 [02.71] 489 [69.86] 25[03.57] 39 [05.57] 437[62.43] 397[56.71] 12[01.71]
Jharkhand 7 700 0[0.0] 11[01.57] 21[03.00] 0[0.0] 1[0.14] 7[01.00] 0[0.0]
Karnataka 7 700 1[0.14] 224[32.00] 250[35.71] 1[0.14] 1[0.14] 182[26.00] 3[0.43]
Kerala 7 700 1[0.14] 18[02.57] 496[70.86] 0[0.0] 2[0.29] 524[74.86] 10[01.43]
Madhya Pradesh
7 700 0[0.0]] 0[0.0]] 0[0.0]] 0[0.0]] 0[0.0]] 0[0.0]] 0[0.0]]
Maharashtra 7 700 140[20.00] 470[67.14] 397[56.71] 6[0.86] 3[0.43] 461[65.86] 0[0.0]
Orissa 7 700 0[0.0] 0[0.0] 0[0.0] 0[0.0] 0[0.0] 0[0.0] 0[0.0]
Punjab 1 30 0[0.0] 28 [93.33] 0[0.0] 0[0.0] 29[96.67] 7[23.33] 2[06.67]
Rajasthan 7 700 0[0.0] 0[0.0] 0[0.0] 0[0.0] 0[0.0] 0[0.0] 0[0.0]
Sikkim 2 200 1[0.50] 3[01.50] 0[0.0] 0[0.0] 3[01.50] 79[39.50] 0[0.0]
Tamil Nadu 7 700 64[09.14] 409[58.43] 517[73.86] 129[18.43] 48[06.86] 599[85.57] 6[0.86]
Uttar Pradesh
7 700 0[0.0] 0[0.0] 0[0.0] 0[0.0] 0[0.0] 0[0.0] 0[0.0]
West Bengal 7 700 1[0.14] 35[05.00] 31[04.43] 0[0.0] 7[01.00] 130[18.57] 1[0.14]
Manipur 2 200 0[0.0] 0[0.0] 0[0.0] 0[0.0] 0[0.0] 0[0.0] 0[0.0]
Meghalaya 2 200 0[0.0] 0[0.0] 0[0.0] 0[0.0] 0[0.0] 0[0.0] 0[0.0]
Uttarakhand 4 400 0[0.0] 0[0.0] 0[0.0] 0[0.0] 0[0.0] 7[01.75] 2[0.50]
Total 116
11519
408 [3.54] 2109 [18.31]
2442 [21.20]
236[02.05] 568[04.93] 2891[25.10]
77[0.67]

Evaluation Study on Total Sanitation Campaign Page 83
Annex-60
Table. Households’ response on maintenance and participation with regard to disposal of Solid and Liquid Waste
Sl No
State
Districts
Total no. of HHs/ Beneficiaries
No. of households saying sewers, garbage pits maintenance look after by
NO. of households /Ben. participate in village cleaning up
GP Sweepers
Self None Others
12 13 14 15 16 17
1 Andhra Pradesh
7 700 545[77.86]
40[05.71]
31[04.43] 23[03.29 20[02.86] 99[14.14]
2 Assam 7 689 4[0.58] 4[0.58] 186[27.00] 66[09.58] 412[59.80] 24[03.48]
3 Bihar 7 700 0[0.0] 0[0.0] 0[0.0] 0[0.0] 0[0.0] 16[02.29]
4 Gujarat 7 700 641[91.57]
8[01.14] 3[0.43] 48[06.86] 0[0.0] 529[75.57]
5 Haryana 7 700 7[01.00] 679[97.0] 13[01.86] 0[0.0] 1[0.14] 119[17.00]
6 Jharkhand 7 700 0[0.0] 0[0.0] 0[0.0] 0[0.0] 1[0.14] 16[02.29]
7 Karnataka 7 700 687[98.14]
5[0.71] 4[0.57] 0[0.0] 0[0.0] 42[06.00]
8 Kerala 7 700 0[0.0] 1[0.14] 526[75.14] 2[0.29] 0[0.0] 119[17.00]
9 Madhya Pradesh
7 700 80[11.43]
0[0.0] 620[88.57] 0[0.0] 0[0.0] 21[03.00]
10 Maharashtra 7 700 593[84.71]
9[01.29] 97[13.86] 0[0.0] 1[0.14] 594[84.86]
11 Orissa 7 700 0[0.0] 1[0.14] 0[0.0] 0[0.0] 0[0.0] 0[0.0]
12 Punjab 1 30 0[0.0] 30[100.0] 0[0.0] 0[0.0] 0[0.0] 3[10.00]
13 Rajasthan 7 700 1[0.14] 1[0.14] 695[99.29] 3[0.43] 0[0.0] 113[16.14]
14 Sikkim 2 200 0[0.0] 1[0.00] 195[97.50] 0[0.0] 0[0.0] 70[35.00]
15 Tamil Nadu 7 700 0[0.0] 0[0.0] 688[98.29] 0[0.0] 1[0.14] 325[46.43]
16 Uttar Pradesh 7 700 0[0.0] 89[12.71]
0[0.0] 608[86.86] 0[0.0] 1[0.14]
17 West Bengal 7 700 0[0.0] 4[0.57] 585[83.57] 0[0.0] 1[0.14] 142[20.29]
18 Manipur 2 200 0[0.0] 0[0.0] 0[0.0] 0[0.0] 0[0.0] 0[0.0]
19 Meghalaya 2 200 0[0.0] 0[0.0] 0[0.0] 0[0.0] 0[0.0] 0[0.0]
20 Uttarakhand 4 400 9[02.25] 0[0.0] 0[0.0] 377[94.25] 2[0.50] 1[0.25]
Total 116 11519 2567[22.28]
872[07.57]
3643[31.63]
1127[09.78]
439[03.81] 2234[19.39]

Evaluation Study on Total Sanitation Campaign Page 84
Annex-61
Table: State wise details of the implementing agencies at the Gram Panchayat Level
STATES
Number of Gram Panchayats opined about the implementing agency
Gram Panchayat
District Project Management Unit
District Rural Development Agency (DRDA) NGOs
Self Help Groups(SHGs)
Rural Water Supply and Sanitation(RWSS)
Block Development Office
Rural Sanitary Mart Others
Count Count Count Count Count Count Count Count Count Andhra Pradesh
1 66 1 1
Assam 67
Bihar 2 59 1 8
gujarat 70
Haryana 11 29 28 2
Jharkand 59 1
Karnataka 70
KERALA 70
Madhya Pradesh
70
Maharashtra 70
Orissa 11 36 8 3 12
Punjab 69
Rajasthan 1 20 49
Sikkim 19 1
Tamilnadu 70
Uttar Pradesh
70
West Bengal 69
Manipur 1 17 2
Meghalaya 20
Uttarakhand 10 30
All India 476 (39.53%)
59 (4.9%)
171 (14.21%)
9 (0.75%)
158 (13.09%)
99 (8.2%)
70 (5.8%)
162 (13.42%)

Evaluation Study on Total Sanitation Campaign Page 85
Annex-62
Table : State wise details of the implementing agencies at the Gram Panchayat Level in NGP awarded GPs.
States
Number of selected Gram Panchayats awarded with NGP opined about the implementing agency
Gram Panchayat
District Project Management Unit
District Rural Development Agency(DRDA) NGOs
Self Help Groups(SHGs)
Rural Water Supply and Sanitation (RWSS)
Block Development Office
Rural Sanitary Mart Others
Andhra Pradesh
15 1
Assam 2 Bihar 9 1 gujarat 16 Haryana 2 3 9 Jharkand 8 1 Karnataka 8 KERALA 31 Madhya Pradesh
6
Maharashtra 16 Orissa 1 7 1 1 Punjab 5 Rajasthan 1 4 12 Sikkim 14 1 Tamilnadu 16 Uttar Pradesh
11
West Bengal
33
Manipur Meghalaya 3 Uttarakhand 2 6 All India 108
(43.9%)
9 (3.6%)
0(%) 24(9.7%)
2(0.8%) 24(9.7%)
25(10.1%) 34(13.8%) 20 (8.1%)

Evaluation Study on Total Sanitation Campaign Page 86
Annex-63
Table : Table showing whether the gram panchayats have been assigned any role and are providing supports
States
Percentage of GPs who have reported that Govt has assinged specific roles to them
Percenage of the selected households who reported support form the Gram Panchayat
All GP Only NGP Awarded GP All GP Only NGP Awarded GP
Andhra Pradesh 90.0% 93.8% 62.4% 83.7%
Assam 92.5% 100.0% 85.6% NA
Bihar 15.7% 30.0% 4.6% 2.2%
gujarat 94.3% 93.8% 88.3% 97.9%
Haryana 100.0% 100.0% 86.0% 84.0%
Jharkand .0% .0% .0% .0%
Karnataka 100.0% 100.0% 57.6% 83.8%
KERALA 100.0% 100.0% 99.9% 100.0%
Madhya Pradesh 100.0% 100.0% 100.0% 100.0%
Maharashtra 98.6% 100.0% 92.6% 100.0%
Orissa 97.1% 100.0% 94.3% 100.0%
Punjab 58.6% 80.0% 86.7% 60.0%
Rajasthan 98.6% 94.1% 100.0% 100.0%
Sikkim 100.0% 100.0% 100.0% 100.0%
Tamilnadu 100.0% 100.0% 59.4% 79.9%
Uttar Pradesh 100.0% 100.0% 99.4% 100.0%
West Bengal 90.0% 91.2% 90.6% 99.7%
Manipur 100.0% .0% 100.0% NA
Meghalaya .0% .0% .0% .0%
Uttarakhand 97.5% 87.5% 97.5% NA
All India 83.8% 89.1% 75.1% 86.4%

Evaluation Study on Total Sanitation Campaign Page 87
Annex-64
Table: Support from PRI
States
PRI Support
If latrine is installed assistence from the Gram Panchayat
In All Gram Panchayta
In NGP awarded Gram Panchayats
In All Gram Panchayta
In NGP awarded Gram Panchayats
Andhra Pradesh 62.4% 83.7% 36.1% 51.6%
Assam 85.6% .0% 6.6% .0%
Bihar 4.6% 2.2% 2.9% .0%
gujarat 88.3% 97.9% 74.5% 74.0%
Haryana 86.0% 84.0% 48.0% 57.3%
Jharkand .0% .0% .0% .0%
Karnataka 57.6% 83.8% 41.3% 35.4%
KERALA 99.9% 100.0% 99.0% 99.0%
Madhya Pradesh 100.0% 100.0% 95.7% 87.5%
Maharashtra 92.6% 100.0% 56.1% 61.5%
Orissa 94.3% 100.0% 11.8% 11.0%
Punjab 86.7% 60.0% 13.3% 10.0%
Rajasthan 100.0% 100.0% 99.0% 99.3%
Sikkim 100.0% 100.0% 49.5% 33.1%
Tamilnadu 59.4% 79.9% 24.6% 28.9%
Uttar Pradesh 99.4% 100.0% 98.4% 100.0%
West Bengal 90.6% 99.7% 22.0% 24.4%
Manipur 100.0% .0% 5.0% .0%
Meghalaya .0% .0% .0% .0%
Uttarakhand 97.5% .0% 90.0% .0%
All India 75.1% 86.40% 48.3% 53.90%

Evaluation Study on Total Sanitation Campaign Page 88
Annex- 65
Table : Role played by the Gram Panchayats in NGP awarded GPs and non NGP awarded GP
Aspect Percentage of NGP awarded gram panchayats opined “yes”
Percentage of Non NGP awarded gram panchayats opined “yes”
The Gram Panchayat has played role in social mobilization
90.3 79.9
The Gram Panchayat has played role in safe disposal of garbage
54.3 38.8
The Gram Panchayat has played role in the maintenance of community sanitary complex
19.4 9.2
The Gram Panchayat is monitoring various activities of TSC
80.2 65.2
The Gram Panchayats have contributed funds in the construction of IHHL
54.7 30.3
Village Level Water and Sanitation Committee have been formed
74.1 63
Motivators have been recruited at the village level 55.9 43
Mechanism has been devised for grievance redressal
34.4 23.2
There is RSM/PC 33.2 28.3
Change in hygienic behaviour of community people is apparent
95.1 78.7
There has been a remarkable decrease in open defecation in the Panchayat
88.3 51.5

Evaluation Study on Total Sanitation Campaign Page 89
Annex- 66
Population Criteria for awarding Nirmal Gram Puraskar Population as per Census 2001
Less than 1000 1000 to 1999 2000 to 4999 5000 to 9999 10000 and above
Incentieve amount (Rs. in lakh)
0.5 1.0 2.0 4.0 5.0
Table : Average population of the Gram Panchayats who received different amount of the money
Award Money
(in Lakh Rs.)
Mean Population of the GP
.10 1128.00
.50 1002.16
.75 1219.50
.85 3031.14
.87 2201.33
1.00 1818.48
1.50 2245.25
1.92 2823.00
2.00 3913.06
2.35 865.00
2.50 14812.00
4.00 9788.27
5.00 22630.90

Evaluation Study on Total Sanitation Campaign Page 90
Annex-67
Table : Amount of Award money received by the Gram Panchayats in different states.
Statewise number of Gram Panchayats having received different amounts of the NGP Award money in Lakh Rs. →
0.1 0.5 0.75 0.85 0.87 1 1.5 1.92 2 2.35 2.5 4 5
States ↓ Andhra Pradesh
* 8 * * * 1 * * 3 * * * *
gujarat * 6 * * * 4 * * 3 * * 1 * Haryana 1 1 2 * * 3 * * 2 * * * * Karnataka * * * * * 1 * * 3 * * 1 * KERALA * * * * * * * * * * * * 29 Madhya Pradesh
* 3 * * * 3 * * * * * * *
Maharashtra * 3 * * * 8 * * * * * 1 2 Orissa * * * * * * * * 2 * * 2 * Punjab * 1 * * * * * * 1 1 * * * Rajasthan * * * * * * * * 12 * * 1 * Sikkim * * * 7 3 * 4 1 * * * * * Tamilnadu * 2 * * * 6 * * 2 * * 1 * Uttar Pradesh * * * * * 5 * * 4 * * * * West Bengal * * * * * * * * * * 1 4 2* Meghalaya * 2 * * * * * * * * * * * Uttarakhand * 5 * * * * * * 2 * * * *
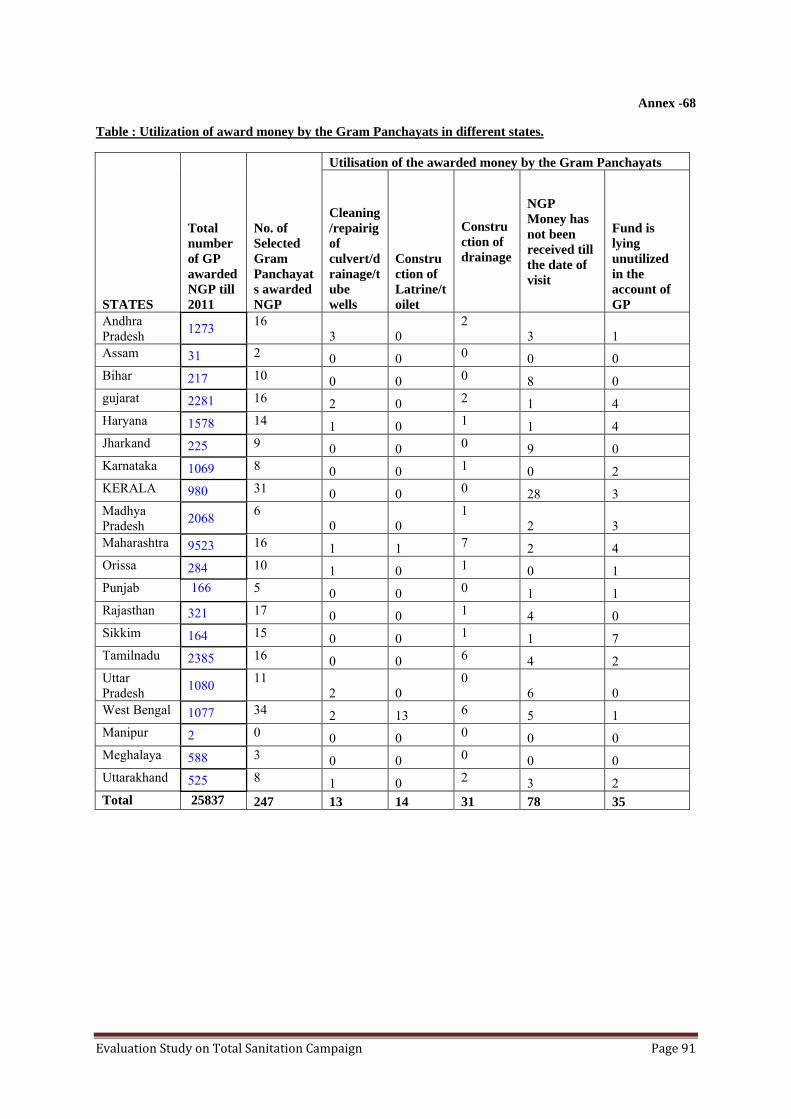
Evaluation Study on Total Sanitation Campaign Page 91
Annex -68
Table : Utilization of award money by the Gram Panchayats in different states.
STATES
Total number of GP awarded NGP till 2011
No. of Selected Gram Panchayats awarded NGP
Utilisation of the awarded money by the Gram Panchayats
Cleaning/repairig of culvert/drainage/tube wells
Construction of Latrine/toilet
Construction of drainage
NGP Money has not been received till the date of visit
Fund is lying unutilized in the account of GP
Andhra Pradesh 1273 16
3 0 2
3 1 Assam 31 2 0 0 0 0 0 Bihar 217 10 0 0 0 8 0 gujarat 2281 16 2 0 2 1 4 Haryana 1578 14 1 0 1 1 4 Jharkand 225 9 0 0 0 9 0 Karnataka 1069 8 0 0 1 0 2 KERALA 980 31 0 0 0 28 3 Madhya Pradesh 2068 6
0 0 1
2 3 Maharashtra 9523 16 1 1 7 2 4 Orissa 284 10 1 0 1 0 1 Punjab 166 5 0 0 0 1 1 Rajasthan 321 17 0 0 1 4 0 Sikkim 164 15 0 0 1 1 7 Tamilnadu 2385 16 0 0 6 4 2 Uttar Pradesh 1080 11
2 0 0
6 0 West Bengal 1077 34 2 13 6 5 1 Manipur 2 0 0 0 0 0 0 Meghalaya 588 3 0 0 0 0 0 Uttarakhand 525 8 1 0 2 3 2 Total 25837 247 13 14 31 78 35

Evaluation Study on Total Sanitation Campaign Page 92
Annex-69
Table: Status of the NGP awarded Gram Panchayats in the selected states.
States
Percentage of Households reported OD by any of their member
Percentage of Househods reported non-availablility of toilet
Percentage of housholds who are willing to pay for the improved sanitary faicilities
percentage of schools without toilet
Percentae of Gram Panchayats reported existence of anganwadi without toilet
Andhra Pradesh 17.7% 13.5% 64.5% 4.2 37.5%
Assam .0% .0% .0% 0.0 .0%
Bihar 43.8% .0% 4.5% 0.0 20.0%
Gujarat 9.2% 13.4% 22.5% 3.7 6.3%
Haryana 18.9% 8.5% 48.1% 0.0 28.6%
Jharkand 37.1% .0% 11.2% 3.5 11.1%
Karnataka .0% 1.3% 96.3% 0.0 37.5%
KERALA .7% .3% 10.5% 0.0 6.5%
Madhya Pradesh 3.8% .0% 72.5% 0.0 33.3%
Maharashtra 9.9% 17.6% 26.8% 0.0 12.5%
Orissa 28.0% .0% 92.0% 0.0 40.0%
Punjab 30.0% .0% 40.0% 0.0 20.0%
Rajasthan 10.4% .0% 5.6% 0.0 29.4%
Sikkim .7% .0% 70.9% 0.0 6.7%
Tamil Nadu 26.4% 11.1% 24.3% 0.0 .0%
Uttar Pradesh 39.8% .0% 39.1% 0.0 .0%
West Bengal 4.7% .0% 76.3% 1.0 20.6%
Manipur .0% .0% .0% NA .0%
Meghalaya .0% .0% 100.0% 0.0 .0%
Uttarakhand .0% .0% .0% 0.0 12.5%
All India 13.8% 4.1% 43.3% 0.65% 17%
Note: In Andhra Pradesh, Gujarat, Karnataka, Maharashtra and Tamil Nadu households have been selected randomly while in rest of the states households have been selected from the list of the households having toilet facility.

Evaluation Study on Total Sanitation Campaign Page 93
Annex-70 Table: Hygienic Behaviour, morbidity and awareness
State
Toilet facility is available in the house
Wash hand with soap before and after the food
Average number of times family member fall ill in 2006
Average number of times family member fall ill in 2007
Average number of times family member fall ill in 2008 Effectiveness of IEC Activities
Aware of water-borne diseases
Good Could be better Poor
Andhra Pradesh 51.9% 52.6% .09 .09 .08 18.0% 27.7% 54.3% 81.1%
Assam 99.6% 83.5% .04 .04 .04 6.4% 88.4% 5.2% 89.1%
Bihar 100.0% 11.6% 1.10 1.18 .86 1.1% 23.6% 75.3% 70.2%
Gujarat 67.1% 82.6% .01 .01 .01 45.3% 49.6% 5.1% 99.3%
Haryana 95.1% 68.3% .47 .44 .49 15.6% 58.4% 26.0% 63.3%
Jharkhand 100.0% 3.9% 1.09 1.04 .78 1.4% 38.7% 59.9% 55.5%
Karnataka 59.9% .6% 3.17 2.34 1.90 16.0% 65.1% 18.9% 88.3%
Kerala 99.9% 10.9% .01 .02 .02 95.5% 4.3% .1% 99.0%
Madhya Pradesh 100.0% 8.9% .03 .15 .13 5.3% 39.4% 55.3% 77.1%
Maharashtra 68.0% 94.3% .06 .03 .03 64.7% 24.6% 10.7% 98.5%
Orissa 99.0% 6.9% 1.93 1.61 1.35 13.6% 59.2% 27.2% 83.7%
Punjab 100.0% 90.0% .23 .07 .03 .0% 34.5% 65.5% 63.3%
Rajasthan 100.0% 51.7% .00 .00 .00 3.7% 8.7% 87.6% 93.4%
Sikkim 100.0% 71.5% .02 .06 .03 45.4% 49.0% 5.6% 86.9%
Tamilnadu 44.7% 23.0% .02 .01 .01 10.3% 60.4% 29.3% 91.3%
Uttar Pradesh 100.0% 16.1% .06 .18 .20 .3% 53.4% 46.3% 99.9%
West Bengal 99.9% 33.1% .01 .02 .01 32.6% 64.5% 2.9% 95.1%
Manipur 100.0% 9.5% 1.72 1.39 1.16 .5% 69.5% 30.0% 94.0%
Meghalaya 100.0% 3.5% .96 .80 .57 .0% 93.5% 6.5% 92.0%
Uttarakhand 100.0% 11.8% .02 .02 .03 5.0% 86.1% 8.8% 100.0%
Total 86.8% 35.3% 0.54 0.48 0.39 20.8% 46.8% 31.8% 85.6%

Evaluation Study on Total Sanitation Campaign Page 94
Annex-71
Table: Reduced Medical Expenses due to TSC
States
Improved Sanitary conditions due to TSC has enabled to reduce medical expenses
Andhra Pradesh 45.0%
Assam 21.0%
Bihar 63.6%
gujarat 72.1%
Haryana 75.0%
Jharkand 56.1%
Karnataka 86.7%
KERALA 66.0%
Madhya Pradesh 63.7%
Maharashtra 88.3%
Orissa 78.1%
Punjab 30.0%
Rajasthan 98.4%
Sikkim 92.0%
Tamilnadu 20.3%
Uttar Pradesh 80.6%
West Bengal 88.3%
Manipur 100.0%
Meghalaya 98.0%
Uttarakhand 97.3%
All India 69..4%

Evaluation Study on Total Sanitation Campaign Page 95
Annex-72
Table: Share of cost in construction of Latrines by each Beneficiary (in percent)
S.No. State HH TSC GP NGO GP/NGO Total 1 Andhra Pradesh 57.02 42.17 0.80 0.00 0.02 100 2 Assam 13.43 86.57 0.00 0.00 0.00 100 3 Bihar 16.39 83.59 0.00 0.01 0.01 100 4 Gujarat 48.64 10.88 40.48 0.00 0.00 100 5 Haryana 79.15 19.10 0.00 1.46 0.29 100 6 Jharkhand 13.60 86.40 0.00 0.00 0.00 100 7 Karnataka 91.65 7.15 0.98 0.00 0.22 100 8 Kerala 76.03 14.39 9.59 0.00 0.00 100 9 Madhya Pradesh 29.53 70.47 0.00 0.00 0.00 100 10 Maharashtra 82.20 14.17 3.63 0.00 0.00 100 11 Orissa 56.86 40.02 0.00 3.12 0.00 100 12 Punjab 92.26 7.74 0.00 0.00 0.00 100 13 Rajasthan 55.46 44.54 0.00 0.00 0.00 100 14 Sikkim 74.60 25.40 0.00 0.00 0.00 100 15 Tamil Nadu 93.71 6.29 0.00 0.00 0.00 100 16 Uttar Pradesh 36.24 63.76 0.00 0.00 0.00 100 17 West Bengal 71.02 23.51 1.93 3.39 0.15 100 18 Manipur 44.47 55.53 0.00 0.00 0.00 100 19 Meghalaya 57.22 42.78 0.00 0.00 0.00 100 20 Uttarakhand 20.18 79.81 0.00 0.00 0.00 100 21 Total 48.52 48.74 2.53 0.18 0.02 100


