33

Irrigation Industry Association of British Columbia Turf and Landscape Irrigation Scheduling
1 of 32
TTUURRFF AANNDD LLAANNDDSSCCAAPPEE IIRRRRIIGGAATTIIOONN SSCCHHEEDDUULLIINNGG
Prepared and Published by
Irrigation Industry Association of British Columbia (IIABC)
In Association with
Irrigation Association (IA)
Editor
Ted W. van der Gulik, P.Eng.
Third Edition
November 2004

Irrigation Industry Association of British Columbia Turf and Landscape Irrigation Scheduling
2 of 32
TABLE OF CONTENTS
INTRODUCTION............................................................................................................6
PART 1 BASE IRRIGATION SCHEDULE ..............................................................7
1.1 LANDSCAPE WATER REQUIREMENT ................................................................................................................ 7
Species Factor (Ks) ....................................................................................................................................................... 8 Density Factor (Kd)....................................................................................................................................................... 8 Microclimate Factor (Kmc) ............................................................................................................................................ 9
1.2 TURF WATER REQUIREMENT.............................................................................................................................. 9
Management Factor (Km) .............................................................................................................................................. 9
1.3 SOIL PROPERTIES .................................................................................................................................................... 10
Soil Texture and Structure ............................................................................................................................................ 10 Soil Infiltration Rate ..................................................................................................................................................... 10
Deep Percolation.............................................................................................................................................. 11
Runoff ............................................................................................................................................................... 11
Available Water Storage Capacity (AWSC)................................................................................................................. 11 Field Capacity .................................................................................................................................................. 12
Permanent Wilting Point .................................................................................................................................. 12
Rooting Depth (RD) ..................................................................................................................................................... 12 Soil Water Storage (SWS) ............................................................................................................................................ 12 Availability Coefficient (AC) ....................................................................................................................................... 13 Maximum Soil Water Deficit (MSWD)........................................................................................................................ 13
1.4 IRRIGATION SYSTEM PARAMETERS ................................................................................................................. 15
Application Rate ........................................................................................................................................................... 15 Application Efficiency (Ae).......................................................................................................................................... 16 Irrigation Water Requirement (IR) ............................................................................................................................... 16 Operating Time (OT) .................................................................................................................................................... 16 Management Allowable Depletion ............................................................................................................................... 17
Irrigation Industry Association of British Columbia Turf and Landscape Irrigation Scheduling
3 of 32
1.5 SCHEDULING REQUIREMENTS ..........................................................................................................................18
Irrigation Days (ID) ...........................................................................................................................................18 Water Restrictions......................................................................................................................................................... 18 Total Run Time per Day (Td)........................................................................................................................................ 18 Maximum Runtime per Cycle (RC).............................................................................................................................. 19 Cycles per Day (C) ....................................................................................................................................................... 19
1.6 THE BASE IRRIGATION SCHEDULE.................................................................................................................... 20
PART 2 WATER BUDGET METHOD – USING DAILY CLIMATE DATA ........23
2.1 DAILY CLIMATE DATA ......................................................................................................................................... 23
Evapotranspiration (ET) ............................................................................................................................................... 23
Effective Precipitation (EP) .......................................................................................................................................... 24
Using Farmwest Data to Determine Effective Precipitation......................................................................................... 24 Small Amounts of Precipitation........................................................................................................................ 24
Large Amounts of Precipitation ....................................................................................................................... 25
Collecting Climate Data and the Forecast..................................................................................................................... 25
2.2 SOIL MOISTURE RANGE....................................................................................................................................... 25
2.3 IRRIGATION SYSTEM ............................................................................................................................................ 26
2.4 THE WATER BUDGET IRRIGATION SCHEDULING METHOD ................................................................... 26
Water Budget Equation................................................................................................................................................. 27
2.5 DETEMINING IRRIGATION RUN TIME............................................................................................................. 28
2.6 WATER BUDGET SCHEDULING WORKSHEET............................................................................................... 30
APPENDIX A: EVAPOTRANSPIRATION RATES FOR TURF GRASS IN BC ......................................................... 31

Irrigation Industry Association of British Columbia Turf and Landscape Irrigation Scheduling
4 of 32
LIST OF FIGURES
Figure 1. Soil Texture Chart.......................................................................................................................... 10
Figure 2. Sample Intake Rate vs. Infiltration Rate........................................................................................ 11
Figure 3. Daily Withdrawals ......................................................................................................................... 14
Figure 4. Elements of Evapotranspiration..................................................................................................... 23
Figure 5. Rain Gauge .................................................................................................................................... 24
Figure 6. Water Balance................................................................................................................................ 26
Figure 7. Water Budget Worksheet............................................................................................................... 30

Irrigation Industry Association of British Columbia Turf and Landscape Irrigation Scheduling
5 of 32
LIST OF TABLES
Table 1. Species Factor (KS) for Different Plants ......................................................................................... 8
Table 2. Density Factor (KD) for Different Plants ........................................................................................ 8
Table 3. Microclimate Factor (Kmc) for Different Plants .............................................................................. 9
Table 4. Soil Properties ................................................................................................................................. 12
Table 5. Application Efficiency (Ae)............................................................................................................ 16
Table 6. Management Allowable Depletion ................................................................................................. 17

Irrigation Industry Association of British Columbia Turf and Landscape Irrigation Scheduling
6 of 32
Turf and Landscape Irrigation Scheduling
Irrigation Industry Association of British Columbia
Information from the Certified Landscape Irrigation Auditor Training Manual produced by the Irrigation Association has been used as a guide in the preparation of this document. Some parameters were changed and additional parameters added to provide guidance to landscape irrigators in British Columbia.
INTRODUCTION
Irrigation systems should be designed and operated to supply the turf and landscape water requirement while minimizing runoff and leaching. To ensure peak irrigation system performance the system design should take into account evapotranspiration, landscape coefficients, soil type and irrigation system efficiencies.
High frequency irrigation leads to increased surface evaporation and usually a higher rate of transpiration by the plants. The irrigation scheduling procedure outlined in this guide minimizes the frequency of irrigation but maximizes duration of application that is allowed by the soil and plants. It is better to have an irrigation schedule where irrigation occurs less frequently but fully utilizes water stored in the plants’ root zone.
Two types of scheduling procedures are provided.
Part 1 outlines a Base Irrigation Schedule using historical reference evapotranspiration data. The base schedule ensures that the system is designed and operated to match the plant and soil conditions present. The letter on the far right of the highlighted sections provide a reference to the Base Theoretical Irrigation Schedule Work sheet on section 1.6.
Part 2 describes a Water Budget Method that can be used to determine how much water to apply when it is time to irrigate. The water budget uses evapotranspiration data that is provided on a daily basis from www.farmwest.com. The Water Budget Method adjusts the amount of water applied for actual weather conditions as they occur. The water budget method explained in this guide changes the run time of the irrigation system but does not change the interval between irrigations. Another scheduling method would be to change the interval and leave the run time the same.
For irrigation scheduling you need to know:
• How much water the landscape is using.
• How much water can be stored in the soil holds and is readily available to the plant.
• The amount that rainfall is providing to the turf moisture deficit.
• How much water the irrigation system needs to put on at one time to cover the moisture deficit.
Note: This guide assumes that the irrigation system has been properly designed to match the location, soil type and plant water requirements and maintained in good operating condition.

Irrigation Industry Association of British Columbia Turf and Landscape Irrigation Scheduling
7 of 32
PART 1 BASE IRRIGATION SCHEDULE
1.1 LANDSCAPE WATER REQUIREMENT
The amount of water the landscape uses depends on the climate and the plant. Evapotranspiration (ET) is the term used to describe plant water use. Evapotranspiration is a measurement of the total amount of water evaporated from the soil and plant surfaces plus the amount of water transpired by the plant. Factors such as temperature, wind, solar radiation and latitude all determine the ET rate. ET can be obtained from various sources. The website www.farmwest.com reports daily ETO in BC for a well watered 10-15 cm grass reference crop. The data is collected daily but can be summarized for any time period. For more information on ETO from Farmwest see Section 2.1. Appendix A contains reference historical monthly ETO rates for turf grass in BC.
The landscape water use (ETL) can be calculated for a specific plant by using a reference evapotranspiration rate (ETO), and applying a landscape coefficient (KL) to convert the reported ETo to ETL. See equation 1.
ETL = KL x ETO Equation 1
Where: ETL = Evapotranspiration landscape, mm KL = Landscape coefficient ETO = Reference evapotranspiration for a grass reference crop, mm
Note: ETO and ETL can be determined for any time period that information is available for. ET can be reported daily, mm/day, or may also be found reported in mm/month.
ETL varies as a function of the mix of plant species used, the density of planting and the effects of a microclimate. These factors together parallel the crop coefficients that are used for agricultural crops. By evaluating each factor and assigning it a numeric value, an estimate can be made of the overall landscape coefficient (KL) as follows:
KL = Ks x Kd x Kmc Equation 2
Where: KL = Landscape coefficient KS = Species factor (Table 1) Kd = Density factor (Table 2) Kmc = Microclimate factor (Table 3)
Species Factor (Ks) E
Different plant species can vary considerably in their rates of evapotranspiration. Some species

Irrigation Industry Association of British Columbia Turf and Landscape Irrigation Scheduling
8 of 32
transpire large amounts of water, while others use relatively little.
Because there is such a wide range of water needs among different landscape plants, the water use is divided into three use groups: high, medium, and low, as shown in Table 1.
TABLE 1 SPECIES FACTOR (KS) FOR DIFFERENT PLANTS VEGETATION HIGH AVERAGE LOW Trees 0.9 0.50 0.2 Shrubs 0.7 0.50 0.2 Ground cover 0.9 0.50 0.2 Mixed 0.9 0.50 0.2 Turfgrass 0.8 0.75 0.6
Density Factor (Kd) E
Landscapes can also vary considerably in vegetation density. Newly planted and sparsely planted landscapes often have less leaf surface area than mature, dense landscape and typically would use less water. Even though individual plants in a sparsely planted landscape may lose more water for a given leaf area, the total water loss from a dense planting will likely be higher due to the greater total leaf surface area for the site. A density factor of some sort is needed in order to account for these differences in water loss. The density factor (Kd) is assigned a value between 0.5 and 1.3 within three groupings, as shown in Table 2.
TABLE 2 DENSITY FACTOR (KD) FOR DIFFERENT PLANTS VEGETATION HIGH AVERAGE LOW Trees 1.3 1.0 0.5 Shrubs 1.1 1.0 0.5 Ground cover 1.1 1.0 0.5 Mixed 1.3 1.1 0.6 Turf grass 1.0 1.0 1.0
Microclimate Factor (Kmc) E
Environmental conditions may also vary significantly within a single landscape. Structures and paved areas typical of urban landscapes can greatly affect these conditions.

Irrigation Industry Association of British Columbia Turf and Landscape Irrigation Scheduling
9 of 32
The microclimate factor (Kmc) is relatively easy to establish. An average microclimate condition is one in which buildings, pavement, slopes, shade and reflection do not influence the site, and
therefore Kmc = 1. A high microclimate condition is one in which the landscape is surrounded by heat absorbing surfaces, heat-reflecting surfaces or high wind conditions, so Kmc might equal 1.4 for a certain situation. A low microclimate is one in which plantings are shaded or protected from the wind, so Kmc equal 0.5 if plantings are very protected from the wind. Ranges are shown in Table 3.
TABLE 3 MICROCLIMATE FACTOR (Kmc) FOR DIFFERENT PLANTSVEGETATION HIGH AVERAGE LOW Trees 1.4 1.0 0.5 Shrubs 1.3 1.0 0.5 Ground cover 1.2 1.0 0.5 Mixed 1.4 1.0 0.5 Turf grass 1.2 1.0 0.8
1.2 TURF WATER MANAGEMENT
For turf areas a management factor may also be applied. The management factor does not apply to landscape plants. The management factor allows for an “allowable stress” or other additional considerations to be applied allowing greater water savings. When including a management factor the landscape water requirement (ETL) is adjusted by the management factor (Km) to determine the turf water requirement (ETTURF).
ETTURF = ETL x Km Equation 3
Where: ETTURF = Evapotranspiration turf, mm ETL = Landscape ET, mm Km = Management factor
Management Factor (Km) F
Unlike other landscape and agriculture crop species turf grass is very resilient. Turf grass is capable of appearing to be healthy even at lower water applications. Studies have shown that irrigation applications made at some fraction of the ETL can still produce acceptable quality turf. A management factor of 70% can be applied to turf grass for most B.C. conditions.

Irrigation Industry Association of British Columbia Turf and Landscape Irrigation Scheduling
10 of 32
Figure 1 Soil Texture Chart
1.3 SOIL PROPERTIES
Knowledge about the soil and landscape are important to ensure that water is applied when required by the plant at the rates and intervals that can be accepted by the soil and topography. The basic information required to assess soil conditions is given below.
Soil Texture and Structure H
Soil texture is a term used to describe the size of individual soil particles such as sand, silt, or clay. Soil texture class is a name given to a soil to describe the relative amounts of sand, silt, or clay in that particular soil. The class name may be sandy loam, loamy clay, silty clay loam, etc. See figure 1.
Soil texture has a major influence on the amount of water that can be stored in the soil against the pull of gravity. It also has a major influence on soil infiltration rate and the permeability of a soil, these terms are described in more detail later in this section.
Soil structure is the arrangement of soil particles and soil aggregates into recognizable particles or lumps. Aggregates occur in almost all soils, but their strength, size and shape varies between soil type. Soil structure can be described in many ways such as; granular, blocky, crumb, platy, massive or granular. The structure also influences the amount soil water holding capacity and the infiltration rate. Soil with poor structure at the surface will not allow water to infiltrate easily.
Soil Infiltration Rate I
The infiltration rate is a measure of how quickly water enters the soil. The irrigation system application rate cannot exceed the soil’s infiltration rate or ponding or runoff will occur. Infiltration rates vary with soil texture. Compacted soils, thick thatch, and slopes all cause low infiltration rates. Figure 2 illustrates how soil infiltration rates decline with time. While the irrigation system is running it is useful to physically observe and record the elapsed irrigation time at which runoff begins to occur at a site.
Figure 2 shows that for a precipitation rate (application rate) of 30 mm/hr the maximum irrigation time is 8 minutes for clay and 18 minutes for loamy sand.

Irrigation Industry Association of British Columbia Turf and Landscape Irrigation Scheduling
11 of 32
Deep Percolation
The percolation rate is the rate at which water drains through the soil. Deep percolation occurs when water drains below the root zone and is no longer useful to the plant. This is wasted water. Deep percolation can leach fertilizers and other chemicals from the root zone down into ground water. IN some situations most of the water losses in landscape irrigation occur through deep percolation.
Runoff
Runoff is water that is not absorbed by the soil or landscape when it is applied. Instead the water ponds or flows from the area. Runoff usually results when irrigation water is applied at rates greater than the soil infiltration rate.
Available Water Storage Capacity (AWSC) J
The soil’s available water storage capacity (AWSC) is the amount of moisture the soil can store between field capacity and permanent wilting point. The AWSC is related to the soil texture and the soil structure. Table 4 contains AWSC values for various soil types.
TABLE 4 SOIL PROPERTIES
Figure 2 Sample Intake Rate vs. Precipitation Rate

Irrigation Industry Association of British Columbia Turf and Landscape Irrigation Scheduling
12 of 32
INFILTRATION RATE SOIL TEXTURE
CLASS AWSC
(in. water/ in. soil)
AWSC (in. water/
ft. soil)
AWSC (mm water/
m soil) (in/hr) (mm/hr)
Clay 0.20 2.4 200 0.25 6.3 Silt loam 0.21 2.5 208 0.35 8.9 Clay loam 0.20 2.4 200 0.30 7.6 Loam 0.18 2.1 175 0.35 8.9 Fine sandy loam 0.14 1.7 142 0.40 10.1 Sandy loam 0.12 1.5 125 0.45 11.4 Loamy sand 0.10 1.2 100 0.65 16.5 Sand 0.08 1.0 83 0.75 19
Field Capacity
The water content of the soil where all free water has been drained form the soil through gravity. Sandy soils may drain within a few hours but fine textured soils such as clay may take a few days.
Permanent Wilting Point
This is the soil moisture content at which the plant will wilt and die. While there still may be water in the soil, the plant is not able to extract sufficient water from the soil to meet its needs.
Rooting Depth (RD) K
The plant’s active rooting depth (RD) is the soil depth from which the crop extracts most of its water needs for evaporation. It is determined by digging a soil pit to observe the actual rooting depth or using plant rooting depth information from other sources. A deeper rooting depth creates a larger reservoir of water for the plant to draw upon between irrigation.
Soil Water Storage (SWS) L
Soil water storage (SWS) is determined from the soil’s available water storage capacity (AWSC) and the plant’s active rooting depth (RD). Knowing the soil water storage allows the irrigator to determine how much water to apply at one time and how long to wait between irrigations. For example, the amount of water applied at one time on a sandy soil, which has a low soil AWSC, would be less than for a loam soil, which has a higher AWSC. This is assuming the plant’s rooting depth is the same for both soils. Applying more water to the soil than can be stored results in a loss of water to deep percolation and leaching of nutrients beyond the root zone.

Irrigation Industry Association of British Columbia Turf and Landscape Irrigation Scheduling
13 of 32
SWS = RD x AWSC Equation 4
Where: SWS = Soil water storage, mm RD = Rooting depth, m ASWC = Available water storage capacity, mm / m (Table 4)
Availability Coefficient (AC) M
Plants can only extract a portion of the soil water storage without being stressed. An availability coefficient (AC) is used to determine the portion of water stored in the soil that is readily available to the plant. The availability coefficient is expressed as a percentage and is applied to the SWS to determine the maximum amount of water that may be removed from the soil before irrigation is again required. This is known as the maximum soil water deficit.
The availability coefficient varies with plant species. For most landscape species an availability coefficient of 50%, represents a reasonable value that can be used.
Maximum Soil Water Deficit (MSWD) N
Maximum soil water deficit (MSWD) is the amount of water that can be stored in the soil that is readily available to the plant. It is the maximum amount of water that should be removed from the soil before irrigation is again required. The MSWD is also the maximum amount of water that can be applied at one time before the risk of deep percolation occurs. However, in some cases leaching of salts may be necessary and extra irrigation may be desired.
To encourage deep root growth for plants, a sprinkler irrigation system should be operated as infrequently as possible, irrigating just long enough to fill the soil water storage to full capacity. The maximum amount that can be applied will be equal to the MSWD, providing that the soil moisture level had dropped this amount prior to irrigation. However, for drip systems the soil moisture level is usually kept higher.
MSWD = SWS x AC Equation 5 Where:
MSWD = Maximum soil water deficit, mm SWS = Soil water storage, mm AC = Availability coefficient of the soil, %
In some situations the irrigator may wish to apply only a portion of the MSWD due to the soil type, irrigation system or other local conditions that may be present. The management allowable depletion (MAD) factor discussed in the irrigation section can be used to determine the percentage of the MSWD that the irrigator allows to be depleted at one time. For sprinkler systems the entire MSWD is usually depleted, but for drip systems it may be a portion of this amount.

Irrigation Industry Association of British Columbia Turf and Landscape Irrigation Scheduling
14 of 32
Figure 3 illustrates that water is removed from the soil incrementally and that when the MSWD has been removed, it is time to replace the amount withdrawn plus associated irrigation application
losses.
If a root zone extends through more than one layer of soil Equation 5 can be repeated for each layer of soil and totaled to determine the MSWD, as shown in example 1.
EXAMPLE 1: CALCULATING SWS AND MSWD IN A LAYERED SOIL PROFILE
TEXTURE LAYER THICKNESS AWSC SWS (m) (m) (mm/m) (mm)
Loam 0.0 to 0.2 0.2 175 35.0 Loamy sand 0.2 to 0.3 0.1 100 10.0
Fine sandy loam 0.3 to 0.6 0.3 142 42.6 Total 87.6
Total SWS for a 0.6m (2-ft) soil profile and 0.6m (2-ft) root zone is 87.6mm If an availability coefficient of 50% is used for the plant type grown: MSWD = 87.6mm x 0.5 = 43.8mm
Figure 3 Daily Withdrawals

Irrigation Industry Association of British Columbia Turf and Landscape Irrigation Scheduling (2002) 15 of 32
1.4 IRRIGATION SYSTEM PARAMETERS
The following formulas can be used to determine operating parameters of the irrigation system.
Application Rate O
Application rate (AR) also known as precipitation rate, is a measure of the rate at which water is applied to an area by the irrigation system per unit of time. It is a critical factor in design because a sprinkler system can easily apply water at rates greater than the soil’s ability to absorb water (infiltration rate), which leads to runoff. The application rate is used to determine how long the irrigation system should run to replace the moisture removed from the soil by the plant between irrigations.
The application rate for a sprinkler irrigation system can be calculated using equation 6. The application rate for a drip irrigation system is calculated using equation 7. The drip system must cover the entire area such as a landscaped bed where the emitter spacing is such that the entire area is irrigated.
Sprinkler Systems
AR = 227 x Q Equation 6 S1 x S2
Where: AR = Application rate, mm/hr Q = Sprinkler flow rate, gpm S1 = Sprinkler spacing along lateral, m S2 = Lateral spacing, m 227 = factor used to convert gpm and spacing in m to application in mm/hr
Drip / Trickle Systems
AR = Q Equation 7 S1 x S2
Where: AR = Application rate, mm/hr Q = Emitter flow rate, litres per hour (lph) S1 = Emitter spacing along line, m S2 = Line spacing, m

Irrigation Industry Association of British Columbia Turf and Landscape Irrigation Scheduling (2002) 16 of 32
Application Efficiency (Ae) P
The application efficiency (Ae) takes into account irrigation system losses due to evaporation and wind drift. When conducting an irrigation audit the distribution uniformity (DU) can replace the application efficiency, as the net amount applied is captured in the catch cans. The application efficiency of various irrigation systems is shown in Table 5.
TABLE 5 APPLICATION EFFICIENCY (Ae) IRRIGATION SYSTEM Ae Drip 0.9 Trickle 0.9 Rotor sprinkler 0.7 Microjet 0.85 Sprinkler 0.75
Irrigation Water Requirement (IR) Q
The irrigation water requirement (IR) is determined by dividing the landscape water requirement by the application efficiency (Ae).
IR = ETL Equation 8 Ae
Where: IR = Irrigation water requirement, mm ETL = Evapotranspiration landscape, mm Ae = Application efficiency, % (Table 5)
Operating Time (OT) R
The landscape water requirement and the application rate determine the maximum length of time the system should operate for each irrigation event.
OT = ETL x 60 Equation 9 AR
Where: OT = Operating Time, minutes ETL = Evapotranspiration landscape, mm AR = Application rate, mm/hr

Irrigation Industry Association of British Columbia Turf and Landscape Irrigation Scheduling (2002) 17 of 32
Management Allowable Depletion S
Management allowable depletion (MAD) is a term often used to determine the soil moisture level at which irrigation is scheduled to begin. It is a subjective decision used by the irrigator taking into consideration the irrigation system and soil type. The MAD factor adjusts the MSWD to determine how much of the soil moisture can be removed before irrigation is again required. It therefore also determines the maximum amount of water that should be applied at one time.
Sprinkler systems usually are scheduled using the entire MSWD, except for heavier soils. Drip systems are usually operated to maintain a higher soil moisture level in the soil, therefore only a portion of the MSWD is removed. Table 6 can be used for guidance in selecting a MAD value. The adjusted MSWDMAD can be calculated using equation 10. It is used in Part 2 of this document.
MSWDMAD = MSWD x MAD Equation 10
Where: MSWDMAD = Maximum soil water deficit adjusted for MAD, mm MSWD = Maximum soil water deficit, mm MAD = Management allowable depletion, % (Table 6)
TABLE 6 MANAGEMENT ALLOWABLE DEPLETION SOIL TEXTURE CLASS Sprinkler Systems
% Drip Systems
% Clay 70 50 Silt loam 80 60 Clay loam 80 60 Loam 100 60 Fine sandy loam 100 70 Sandy loam 100 70 Loamy sand 100 80 Sand 100 80
EXAMPLE 2: SELECTING MANAGEMENT ALLOWABLE DEPLETION The soil and crop used in example 1 had a MSWD of 43.8 mm. The soils were predominantly loam to loamy sand. For a sprinkler irrigation system operating under these conditions the management allowable depletion would be 100%. Therefore the entire MSWD of 43.8 mm would be the amount of the water removed from the soil before irrigation is required.
For a drip system the management allowable depletion ranges from 60 – 80 % for these soils. An average of 70% can be used as the MAD for drip in this case. Therefore the amount of water to be removed from the soil between irrigations would be:
MSWDMAD = 43.8 mm x 0.7 = 30.7 mm.
The drip irrigation system would be managed so the maximum depletion would be only 30.7 mm.

Irrigation Industry Association of British Columbia Turf and Landscape Irrigation Scheduling (2002) 18 of 32
1.5 SCHEDULING REQUIREMENTS
The following equations are used to determine a base irrigation schedule using the information from the previous sections. An irrigation schedule provides the number of days that the irrigation system will run during a given period, the total run time per day, how long the irrigation system should run each time it is turned on (maximum runtime per cycle) and finally the number of cycles each day.
Irrigation Days (ID) T
Irrigation days (ID) are the number of days the irrigation system will operate during the reference period. If the reference period is one month (31 days) and the irrigation days works out to be 8 days the system will operate approximately every 4th day (31 ÷ 8) to meet the irrigation requirements.
ID = ETL Equation 11 MSWD x MAD
Where: ID = Irrigation days, days ETL = Evapotranspiration landscape, mm MSWD = Maximum soil water deficit, mm MAD = Management allowable depletion, % (Table 6)
Water Restrictions U
The worksheet allows space for the user to add information on any water restrictions that may be in effect. The calculated irrigation schedule must accommodate water restrictions that specify the number of days per week or hours per day that an irrigation system is allowed to operate. If the calculated schedule does not fit into the time specified by water restrictions then modifications to the schedule must be made.
Total Run Time per Day (Td) V
Total run time per day (Td) is the amount of time on each irrigation day that the irrigation system will operate during that 24 hour period.
Td = OT Equation 12 ID
Where: Td = Total runtime per day, minutes/day OT = Operating time, minutes ID = Irrigation days, days
Irrigation Industry Association of British Columbia Turf and Landscape Irrigation Scheduling (2002) 19 of 32
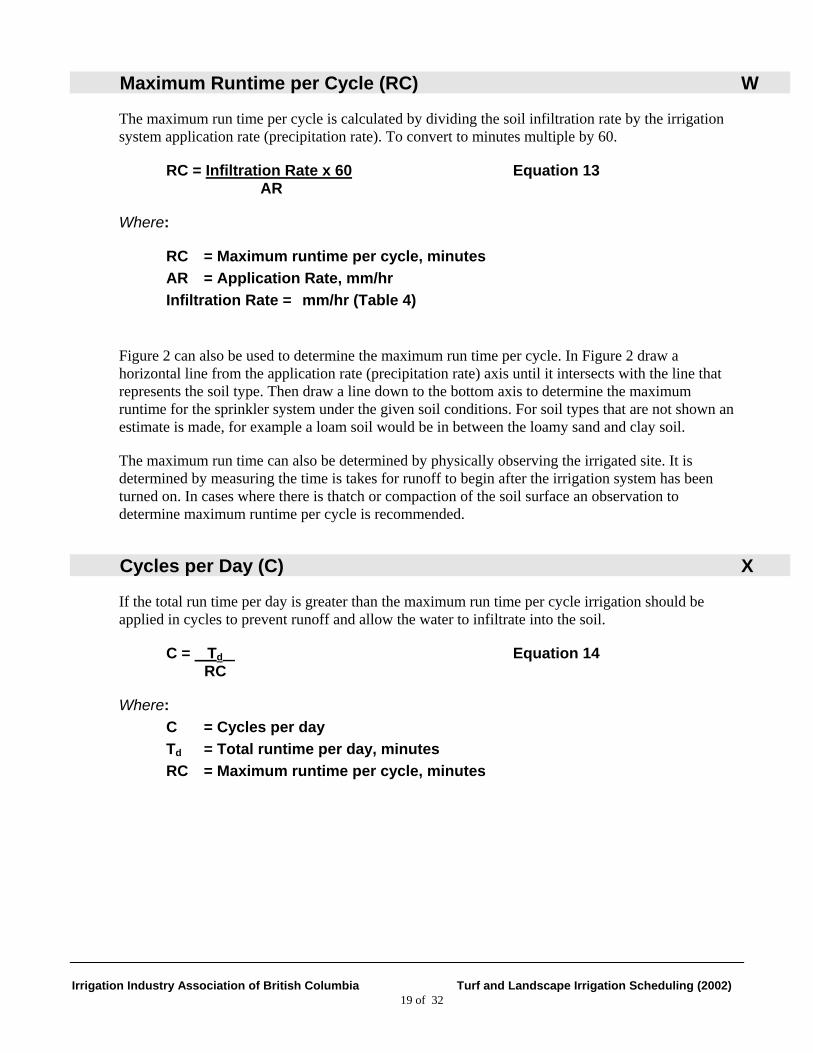
Maximum Runtime per Cycle (RC) W
The maximum run time per cycle is calculated by dividing the soil infiltration rate by the irrigation system application rate (precipitation rate). To convert to minutes multiple by 60.
RC = Infiltration Rate x 60 Equation 13 AR
Where:
RC = Maximum runtime per cycle, minutes AR = Application Rate, mm/hr Infiltration Rate = mm/hr (Table 4)
Figure 2 can also be used to determine the maximum run time per cycle. In Figure 2 draw a horizontal line from the application rate (precipitation rate) axis until it intersects with the line that represents the soil type. Then draw a line down to the bottom axis to determine the maximum runtime for the sprinkler system under the given soil conditions. For soil types that are not shown an estimate is made, for example a loam soil would be in between the loamy sand and clay soil.
The maximum run time can also be determined by physically observing the irrigated site. It is determined by measuring the time is takes for runoff to begin after the irrigation system has been turned on. In cases where there is thatch or compaction of the soil surface an observation to determine maximum runtime per cycle is recommended.
Cycles per Day (C) X
If the total run time per day is greater than the maximum run time per cycle irrigation should be applied in cycles to prevent runoff and allow the water to infiltrate into the soil.
C = Td Equation 14 RC
Where: C = Cycles per day Td = Total runtime per day, minutes RC = Maximum runtime per cycle, minutes

Irrigation Industry Association of British Columbia Turf and Landscape Irrigation Scheduling (2002) 20 of 32
1.6 THE BASE IRRIGATION SCHEDULE
The worksheet in this section provides a methodology for calculating a base irrigation schedule for landscape systems. An example of a base irrigation schedule is given on the following page.
The letters in the left column of the Base Theoretical Irrigation Schedule Worksheet reference the earlier sections where the background and calculation of these parameters is discussed.
Section 1.1 of the worksheet calculates the landscape water requirement. The parameters for this are:
• reference evapotranspiration • a landscape coefficient to convert the reference ETo to an ETL value for the specific plant • management factor Section 1.2 determines the soil water parameters. The parameters are:
• soil type - soil infiltration rate - available water storage capacity
• plant information - rooting depth - availability coefficient
• soil water storage capacity • maximum soil water deficit Section 1.3 calculates the water that must be delivered by the irrigation system, the rate at which the water is applied and the corresponding operating time required. The parameters used for this are:
• application rate of the irrigation system • irrigation system efficiency • landscape water requirement • operating time • management allowable depletion Section1.4 develops a base irrigation schedule using the soil and landscape information. The parameters used are:
• number of days irrigation must be operated within the desired reference period • total runtime per day • maximum runtime per irrigation cycle • number of cycles per day The water budget method described in Part 2 of this guide can be used to fine tune this schedule for actual weather conditions as they happen.

Irrigation Industry Association of British Columbia Turf and Landscape Irrigation Scheduling (2002) 21 of 32
Example 3: Calculating a base theoretical irrigation schedule
A loamy sand field near Vancouver has turf with a rooting depth of 20cm (0.2m). The field is located in a windy, south facing area. The field has a rotor sprinkler irrigation system that has an application rate of 16 mm/hr. A weekly schedule is to be developed for the month of July.
Item Source or Calculation Value Units 1.1 Landscape Water Requirement A. Plant Material Landscape Plan turf B. Reference Month Judgment July C. Reference Period Judgment (1 week) 7 days D. ETo (reference period) *Appendix A =102 mm/31 x 7 23 mm / week E. Landscape Coefficient (KL) Ks x Kd x Kmc = 0.75 x 1.0 x 1.2 0.9 F. Management Factor (turf only) Km = 0.7 0.7 G. Landscape Water Requirement (ETL) ETo x KL x Km = 23 x 0.9 x 0.7 14.5 mm /week 1.2 Soil Properties H. Root Zone Soil Type Site Inspection Loamy sand I. Soil Infiltration Rate Table 4 16.5 mm / hr J. Available Water Storage Capacity (AWSC) Table 4 100 mm / m K. Rooting Depth (RD) Site Inspection 0.2 m L. Soil Water Storage (SWS) SWS = AWSC x RD = 100 x 0.2 20 mm M. Availability Coefficient (AC) Judgement 0.5 N. Maximum Soil Water Deficit (MSWD) MSWD = SWS x AC = 20 x 0.5 10 mm 1.3 Irrigation System System Type (Rotor Sprinkler) O. Application Rate (AR) Calculation 16 mm / hr P. Application Efficiency (Ae) Table 5 0.7 Q. Irrigation Water Requirement (IR) IR = ETL / Ae = 14.5 / 0.7 21 mm /week R. Operating Time (0T) OT = IR x 60 / AR = 20.3 x 60 /16 78 min / week S. Management Allowable Depletion (MAD) Table 6 1.0 1.4 Scheduling Requirements T. Irrigation Days (ID) ID = ETL/(MSWDxMAD)
= 14.5 / (10 x 1.0) = 1.45 **2 days/week
U. Water Restrictions Water Purveyor Tuesdays and Fridays V. Total Runtime per Day (Td) Td = OT / ID = 78 / 2 39 min. / day W. Maximum Runtime per Cycle (RC) RC = (Infiltration Rate / AR) x 60
= (16. 5 mm/hr / 16 mm)x 60 = 60 60 minutes
X. Cycles per Day (C) C = Td /RC = 38 / 60 1 Cycle/day
* The reference period that the ETO is available for is monthly. In this example a schedule for a week in July is being determined. Therefore the reference ETO is converted to a weekly ET. The monthly ETO is divided by the number of days in the month (31), then multiplying by the number of days in a week (7). ** The number of irrigation days calculated for this week is 1.45. Numbers must always be rounded up to

Irrigation Industry Association of British Columbia Turf and Landscape Irrigation Scheduling (2002) 22 of 32
reduce plant stress. In this case, the number of irrigation days per period will therefore be 2.
Base Theoretical Irrigation Schedule Worksheet
Item Source or Calculation Value Unit or Function 1.1 Landscape Water Requirement
A. Plant Material Landscape Plan Classification
B. Reference Month Judgment Month
C. Reference Period Judgment irrigation period - days
D. ETo (reference period) Appendix A mm per period
E. Landscape Coefficient (KL) Ks x Kd x Kmc . plant multiplier
F. Management Factor (turf only) Km site multiplier
G. Landscape Water Requirement (ETL) ETL = ETo x KL x Km mm per period
1.2 Soil Properties
H. Root Zone Soil Type Site Inspection soil texture
I. Soil Infiltration Rate Table 4 mm per hour
J. Available Water Storage Capacity (AWSC) Table 4 mm per m of soil
K. Rooting Depth (RD) Site Inspection M
L. Soil Water Storage (SWS) SWS = AWSC x RD Mm
M. Availability Coefficient (AC) Judgement Expressed as a decimal
N. Maximum Soil Water Deficit (MSWD) MSWD = SWS x AC Mm
1.3 Irrigation System System Type ( )
O. Application Rate (AR) Calculation mm per hr
P. Application Efficiency (Ae) Table 5 expressed as a decimal
Q. Irrigation Water Requirement (IR) IR = ETL / Ae mm per period
R. Operating Time (OT) OT = IR x 60 / AR minutes per period
S. Management Allowable Depletion (MAD) Table 6 expressed as a decimal
1.4 Scheduling Requirements
T. Irrigation Days (ID) ID = ETL/ (MSWD x MAD) days in a period
U. Water Restrictions Water Purveyor days or hours per period
V. Total Runtime per Day (Td) Td = OT / ID minutes per day
W. Maximum Runtime per Cycle (RC) RC = (Infiltration Rate / AR) x 60 Minutes
X. Cycles per Day (C) C = Td /RC repeats to avoid runoff

Irrigation Industry Association of British Columbia Turf and Landscape Irrigation Scheduling (2002) 23 of 32
Figure 4 Elements of Evapotranspiration
PART 2 WATER BUDGET METHOD – USING DAILY CLIMATE DATA
The water budget method uses daily climate data from www.farmwest.com and the soil and plant information from Part 1 of this guide to prepare a water budget that can be updated daily. This method changes the runtime of the irrigation system but does not alter the irrigation interval. Adjusting the runtime to match climate conditions allows the irrigator to make efficient use of water while providing the plants with the moisture they require.
2.1 DAILY CLIMATE DATA
The climate data required to use the water budget method, evapotranspiration and effective precipitation, are both available at www.farmwest.com.
Evapotranspiration (ET)
Evapotranspiration (ET) can be either measured or calculated. ET can be measured using evaporation pans or atmometers (evaporimeters). The reference ETO on Farmwest is calculated using a modified Penman Monteith equation, which is the standard method recommended by the UN Food and Agriculture Organization. The ETO is calculated for a well watered 10-15 cm grass reference crop.
Calculated evapotranspiration depends on a number of factors including temperature, solar radiation, vapour pressure, and wind speed. For most of the climate stations reported on Farmwest only temperature data is available daily. ET can be calculated using only temperature data but on very windy days or cloudy days the ‘daily’ calculated ET value may over or under estimated the actual ET. However, it is known that over a longer time period (i.e. week) the temperature calculated ET values average out to be close to the actual ET.
To get the landscape evapotranspiration (ETL) used in the water budget, ETO is multiplied by a landscape coefficient, KL. ETL and KL are determined using equations in section 1.1. For turf a management factor (Km) may also be applied.

Irrigation Industry Association of British Columbia Turf and Landscape Irrigation Scheduling (2002) 24 of 32
Figure 5 Rain Gauge
Effective Precipitation (EP)
Although Farmwest reports precipitation, rainfall patterns can be much more varied over a region than ET. Having an on-site rain gauge will improve the accuracy of the water budget, and using a soil moisture monitoring device will also keep the water budget on track.
Effective Precipitation (EP) is the amount of precipitation that is actually added and stored in the soil. During drier periods less than 5mm of rainfall would not be considered effective, as the precipitation would most likely evaporate from the surface before soaking into the ground. For extended periods of cool wet weather all rainfall over a couple of mm may be considered effective. Farmwest reports effective precipitation as 75% of rainfall over 5mm.
Also if rainfall intensity is greater than the soil infiltration rate precipitation will be lost to runoff and will not be stored in the root zone.
Using Farmwest Data to Determine Effective Precipitation
Small Amounts of Precipitation
Dry Periods
During extended warm dry periods rainfall less than 5mm may not add any moisture to the soil reservoir as most of it is evaporated before entering the soil. Therefore, if rainfall is less than 5mm Farmwest does not enter a value for effective precipitation. In addition, only 75% of the rainfall over 5mm is considered effective precipitation.
The equation used on Farmwest is:
EP = (RAIN - 5) x 0.75 Equation 14
Where: EP = Effective precipitation, mm RAIN = Measured rainfall, mm
During dry periods no changes need made to the EP data on Farmwest.
Wet Periods
During prolonged cool wet periods more of the rainfall that falls as daily showers can be considered

Irrigation Industry Association of British Columbia Turf and Landscape Irrigation Scheduling (2002) 25 of 32
to be effective. This is because the soil and air temperatures are cooler and humidity is higher allowing the rainfall to soak into the soil before it evaporates. The judgment whether or not rainfall is effective would have to be made after a number of days. Soil moisture monitoring could be helpful in determining how much of the rainfall is effective.
The effective precipitation shown on Farmwest is always calculated using equation 13. During cool wet periods the effective precipitation calculated may be low resulting in a calculated higher moisture deficit than what actually exists. Soil moisture monitoring should be done under these conditions to ensure that irrigation is only applied when necessary.
Large Amounts of Precipitation
Very large rainfall events may apply more moisture than the soil’s available water storage capacity.
The effective amount of rainfall recorded on Farmwest may now be much higher than what is being stored in the field. A portion of the precipitation may be lost due to deep percolation or runoff. If using the water budget method, the budget must be restarted after the wet period has ended with the soil moisture level being at field capacity.
Collecting Climate Data and the Forecast
The climate data does not necessarily need to be collected daily. On Farmwest it is also possible to get a summary for the previous week, year or any time period. The time interval that is best for collecting the information depends on the type of system in use and the weather. If the weather is cloudy and cool there will be little change in the ET from day to day. However, if it is hot and dry and it has been a few days since the last irrigation, checking the ET and the forecast daily would be prudent. The 5-day forecast on Farmwest is a useful tool for determining how often to monitor the data and when the next irrigation should take place.
2.2 SOIL MOISTURE RANGE
Proper and effective irrigation scheduling keeps the plant’s soil moisture in an acceptable range. The water budget method operates within this moisture range. The soil water storage (SWS), maximum soil water deficit (MSWD) and management allowable depletion (MAD) parameters are required to determine an acceptable range for each site. Section 1.3 and 1.4 contains the information and calculations required to determine these parameters.
The maximum soil moisture level of the soil moisture range is the SWS determined for the plant and soil conditions present. The minimum soil moisture level of the range is determined by subtracting the MSWDMAD from the SWS as shown in Equation 15.
Minimum soil moisture level = SWS - MSWDMAD Equation 15 Where:
MSWDMAD = Maximum soil water deficit adjusted for MAD, mm

Irrigation Industry Association of British Columbia Turf and Landscape Irrigation Scheduling (2002) 26 of 32
Figure 6 Water Balance
SWS = Soil water storage, mm
2.3 IRRIGATION SYSTEM
The irrigation system application rate is determined using equations in section 1.4. The irrigation depth (IRR) is used in the water budget method. It is the amount of water the system applies at one time to bring the soil moisture level back to field capacity. The maximum moisture deficit allowed when scheduling would be equal to the MSWD. This amount can be adjusted by a management allowable depletion (MAD) if desired. The water budget scheduling method determines the irrigation depth that must be applied during each irrigation (see section 2.5). Applying more water than the moisture deficit will cause losses due to percolation or runoff. The irrigation depth can be calculated using equation 16 if the run time is known.
The irrigation depth calculated using equation 16 should be less than or equal to the irrigation depth calculated in equation 18 during the same time period. If it is higher the irrigation time is too long.
IRR = AR x T x Ae Equation 16
Where: IRR = Irrigation depth, mm AR = Application rate, mm/hr T = Irrigation time, hr Ae = Application efficiency, Table 5
2.4 THE WATER BUDGET IRRIGATION SCHEDULING METHOD
The water budget method uses ET data obtained from Farmwest to schedule irrigation by either changing the irrigation interval or the irrigation duration depending upon what works best with the irrigation system. For turf systems that have a set irrigation interval, changing the duration would work best.
The water budget, illustrated in figure 7, can be used to determine the amount of moisture removed from the soil since the last irrigation and how much water needs to be applied during the current irrigation. The method given here determines how long to run the irrigation system.
Water Budget Equation
CSWC = PSWC + IRR + EP – ETL – DP Equation 17

Irrigation Industry Association of British Columbia Turf and Landscape Irrigation Scheduling (2002) 27 of 32
(DP = 0 – see note) Where:
CSWC = Current soil water content (today), mm PSWC = Previous soil water content (yesterday), mm IRR = Irrigation since yesterday, mm EP = Effective precipitation since yesterday, mm ETL = Landscape evapotranspiration, mm DP = Deep percolation, water lost beyond the root zone, mm
Deep percolation is assumed to be zero if good irrigation management practices are followed.
The landscape evapotranspiration is calculated in the worksheet. If a management factor, Km, is applied to turf it is included in the calculation for ETL. If the management factor is not used or if a schedule for plants other than turf is being calculated, only multiply ETO by KL.
The previous soil water storage (PSWS) is always equal to the current soil water storage (CSWS) of the previous day.
The CSWS may never exceed the soil water storage capacity (SWS) of the soil. If the water budget calculates a CSWS higher than the SWS the value for SWS is entered into the spreadsheet for the CSWS.
It is also important to monitor soil moisture periodically to ensure the water budget is staying on track see BCMAFF Factsheet 577-100-2: Irrigation Scheduling with Tensiometers for more information on soil moisture monitoring.
A blank water budget worksheet can be found in Section 2.6.
2.5 DETERMINING IRRIGATION RUN TIME
Irrigation run time is based on the amount of moisture that has been removed from the soil during the past irrigation interval. The irrigation depth (IRR) applied must equal the amount of moisture removed and is
Figure 7 Water Budget Worksheet
SWS: 25 mm (CSWS cannot exceed this amount) MSWDMAD: 10 mm Soil Moisture Range: 25 mm to 15 mm
Date
Previous soil water storage
+
Effective precip.
+
Net irrigation
-
Landscape coefficient x management
x
ETO
=
Plant water use
=
Current soil water storage
PSWS + EP + IRR - KL x Km x ETO = ETL = CSWS
June 14 20 + 0 + 0 - 0.9 x 0.7 x 10 = 6.3 = 13.7 June 15 13.7 + + - x = =

Irrigation Industry Association of British Columbia Turf and Landscape Irrigation Scheduling (2002) 28 of 32
determined from the worksheet using equation 18. The irrigation system needs to operate only long enough to replace the moisture lost from the soil between irrigations. The irrigation run time (T) can be determined from equation 19.
IRR = SWS – CSWS Equation 18 T = IRR Equation 19 Ae x AR
Where: IRR = Irrigation Depth, mm SWS = Soil water storage, mm CSWC = Current soil water content, mm T = Irrigation run time, hr AR = Application rate, mm/hr Ae = Application efficiency, Table 5

Irrigation Industry Association of British Columbia Turf and Landscape Irrigation Scheduling (2002) 29 of 32
Example 4: Water Budget Method A loamy sand field near Vancouver has turf with a rooting depth of 20 cm (0.2m). The field is located in a windy south facing area. The field has a sprinkler irrigation system that applies 16 mm/hour (0.63 in/hr.) The application efficiency is 70% (Table 5). The irrigation interval is every 3rd day. The last irrigation was July 15th (Eqn. 18:IRR = SWS – CSWSJuly 14th = 20mm – 10mm) The next irrigation is scheduled for July 18th.
How much water should be applied at the next irrigation? How long should the irrigation system run?
Evapotranspiration / Precipitation Effective precipitation and ETO are taken from www.farmwest.com. The daily ET values are shown in the table below. The effective precipitation on July 16th was 3 mm.
Plant Water Requirement For this site the microclimate factor would be high, 1.2 (see Table 3). All other conditions are average. A management factor is applied to the turf.
Equation 2 KL = (Kmc x Kd x Ks) = 1.2 x 1.0 x 0.75 = 0.9
Turf management factor: Km = 0.7
Soil Water Storage From Table 4: Loamy sand soil will store 100 mm water / m soil, AC = 50% From Table 6: MAD = 100%
Equation 4 SWS = ASWC x RD = 100 mm/m x 0.2 m = 20 mm
Equation 5 MSWD = SWS x AC = 20 mm x 0.5 = 10 mm
Equation 10 MSWDMAD = MSWD x MAD = 10 mm x 1.0 = 10 mm
SWS: __20___ mm (the CSWS cannot exceed this amount) MSWDMAD: __10___ mm Soil Moisture Range: ___20___mm to ____10____ mm
Date
Previous soil-water storage
+
Effective precip.
+
Net irrigation
-
Landscape coefficient x management
x
ETO
=
Plant water use
=
Current soil water storage
PSWS + EP + IRR - KL x Km x ETO = ETL = CSWS
July 15 10.0 + - + 10.0 - 0.9 x 0.7 x 6.8 = 4.3 = 15.7
July 16 15.7 + 3 + - - 0.9 x 0.7 x 3.6 = 2.3 = 16.4
July 17 16.4 + - + - - 0.9 x 0.7 x 5.4 = 3.4 = 13.0
July 18 13.0 + - + 7.0 - 0.9 x 0.7 x 4.3 = 2.7 = 17.3
Use the current water storage for the 17th to calculate the irrigation time for the 18th.
Equation 18 Irrigation depth IRR = SWS – CSWS = 20.0 mm – 13.0 mm = 7.0 mm
Equation 19 Time T = IRR = 7.0 mm = 0.62 hr = 37 minutes Ae x AR 0.7 x 16 mm/hr
The irrigation system should be run for 37 minutes to replace the 7.0 mm of moisture loss.

Irrigation Industry Association of British Columbia Turf and Landscape Irrigation Scheduling (2002)
30 of 32
2.6 WATER BUDGET SCHEDULING WORKSHEET
SWS: mm (the CSWS cannot exceed this amount)
MSWDMAD: mm
Soil Moisture Range: mm to mm
Date Previous soil-water storage + Effective
precipitation +Net
irrigation - Crop
coefficient x ETO = Crop
water use =Current soil
water storage PSWS + EP + IRR - KL x Km x ETO = ETL = CSWS
+ + - x = = + + - x = = + + - x = = + + - x = = + + - x = =
+ + - x = = + + - x = = + + - x = = + + - x = = + + - x = =
+ + - x = = + + - x = =
+ + - x = = + + - x = = + + - x = = + + - x = = + + - x = =
+ + - x = = + + - x = =

Irrigation Industry Association of British Columbia Turf and Landscape Irrigation Scheduling (2004)
31 of 32
APPENDIX A: EVAPOTRANSPIRATION RATES FOR TURF GRASS IN BC
Reference ET0 Annual May June July August Sept-Oct Location in. mm in. mm in. mm in. mm in. mm in. mm Abbotsford 13 330 2 51 2 51 4 102 4 102 1 25 Agassiz 7 178 1 25 1 25 2 51 2 51 1 25 Alexis Creek 14 356 2 51 2 51 4 102 4 102 2 51 Armstrong 17 432 2.5 64 2.5 64 5 127 5 127 2 51 Ashcroft 30 762 4.5 114 4.5 114 9 229 9 229 3 76 Aspen Grove 17 432 2.5 64 2.5 64 5 127 5 127 2 51 Barriere 17 432 2.5 64 2.5 64 5 127 5 127 2 51 Campbell River 13 330 2 51 2 51 4 102 4 102 1 25 Canal Flats 19 483 3 76 3 76 6 152 6 152 1 25 Castlegar 26 660 4 102 4 102 8 203 8 203 2 51 Cawston 30 762 4.5 114 4.5 114 9 229 9 229 3 76 Chase 20 508 3 76 3 76 6 152 6 152 2 51 Cherryville 18 457 2.5 64 2.5 64 5.5 140 5.5 140 2 51 Chilliwack 7 178 1 25 1 25 2 51 2 51 1 25 Clinton 20 508 3 76 3 76 6 152 6 152 2 51 Cloverdale 11 279 1.5 38 1.5 38 3 76 3 76 2 51 Comox 15 381 2 51 2 51 4.5 114 4.5 114 2 51 Creston 20 508 3 76 3 76 6 152 6 152 2 51 Douglas Lake 20 508 3 76 3 76 6 152 6 152 2 51 Duncan 11 279 1.5 38 1.5 38 3 76 3 76 2 51 Ellison 21 533 3 76 3.5 89 6.5 165 6 152 2 51 Fort Fraser 11 279 1.5 38 1.5 38 3 76 3 76 2 51 Fort Steele 14 356 2 51 2 51 4 102 4 102 2 51 Golden 14 356 2 51 2 51 4 102 4 102 2 51 Grand Forks 14 356 2 51 2 51 4 102 4 102 2 51 Grandview Flats 23 584 3.5 89 3.5 89 7 178 6.5 165 2.5 64 Grasmere 18 457 2.5 64 2.5 64 5.5 140 5.5 140 2 51 Grindrod 11 279 1.5 38 1.5 38 3.5 89 3 76 1.5 38 Hazelton 4.5 114 0.5 13 0.5 13 1.5 38 1.5 38 0.5 13 Hixon 10 254 1.5 38 1.5 38 3 76 3 76 1 25 Hope 13 330 2 51 2 51 4 102 4 102 1 25 Invermere 22 559 3 76 3.5 89 7 178 6.5 165 2 51 Kamloops 27 686 4 102 4 102 8 203 8 203 3 76 Kelowna 24 610 3.5 89 3.5 89 7 178 7 178 3 76 Keremeos 27 686 4 102 4 102 8 203 8 203 3 76 Kimberley 23 584 3.5 89 3.5 89 7 178 6.5 165 2.5 64

Irrigation Industry Association of British Columbia Turf and Landscape Irrigation Scheduling (2004)
32 of 32
Reference ET0 Annual May June July August Sept-Oct Location in. mm in. mm in. mm in. mm In. mm in. mm Ladner 11 279 1.5 38 1.5 38 3 76 3 76 2 51 Langley 9 229 1.5 38 1.5 38 3 76 2.5 64 0.5 13 Lillooet 24 610 3.5 89 3.5 89 7 178 7 178 3 76 Lister 20 508 3 76 3 76 6 152 6 152 2 51 Lumby 20 508 3 76 3 76 6 152 6 152 2 51 Lytton 30 762 4.5 114 4.5 114 9 229 9 229 3 76 Malakwa 12 305 1.5 38 2 51 4 102 3.5 89 1 25 Merritt 26 660 3 76 4 102 8 203 8 203 3 76 Nanaimo 14 356 2 51 2 51 4 102 4 102 2 51 Notch Hill 18 457 2.5 64 3 76 5.5 140 5 127 2 51 Oliver 29 737 4 102 4.5 114 9 229 8.5 216 3 76 100 Mile House 21 533 3 76 3 76 6 152 6 152 3 76 Osoyoos 30 762 4.5 114 4.5 114 9 229 9 229 3 76 Oyster River 9 229 1.5 38 2 51 3 76 2.5 64 1 25 Parksville 14 356 2 51 2 51 4 102 4 102 2 51 Pitt Meadows 9 229 1.5 38 2 51 3 76 2.5 64 1 25 Port Alberni 15 381 2 51 2.5 64 5 127 4.5 114 1 25 Prince George 14 356 2 51 2 51 4 102 4 102 2 51 Princeton 22 559 3 76 4 102 6.5 165 6.5 165 2 51 Quesnel 12 305 1.5 38 2 51 4 102 3.5 89 1 25 Radium 16 406 2.5 64 3 76 5 127 4.5 114 1 25 Riske Creek 20 508 3 76 3.5 89 6 152 5.5 140 2 51 Saanichton 13 330 2 51 2 51 4 102 4 102 1 25 Salmon Arm 17 432 2.5 64 3 76 5 127 4.5 114 2 51 Smithers 12 305 1.5 38 2 51 4 102 3.5 89 1 25 Spillimacheen 18 457 2.5 64 3 76 5.5 140 5 127 2 51 Sumas 11 279 1.5 38 2 51 3.5 89 3 76 1 25 Summerland 24 610 3.5 89 3.5 89 7 178 7 178 3 76 Terrace 12 305 1.5 38 2 51 4 102 3.5 89 1 25 Vancouver 14 356 2 51 2 51 4 102 4 102 2 51 Vanderhoof 12 305 1.5 38 2 51 4 102 3.5 89 1 25 Vavenby 17 432 2.5 64 3 76 5 127 4.5 114 2 51 Vernon 20 508 3 76 3.5 89 6 152 5.5 140 2 51 Walhachin 25 635 3.5 89 4 102 7.5 191 7 178 3 76 Westwold 25 635 3.5 89 4 102 7.5 191 7 178 3 76 Williams Lake 18 457 2.5 64 3 76 5.5 140 5 127 2 51


