27
Gas Pipelines Palisades Replacements Evercore ISI Utility CEO Retreat January 12 – 13, 2017
Gas Pipelines Palisades Replacements
Evercore ISI Utility CEO Retreat
January 12 – 13, 2017

This presentation is made as of the date hereof and contains “forward-looking statements” as defined in Rule 3b-6 of the Securities
Exchange Act of 1934, Rule 175 of the Securities Act of 1933, and relevant legal decisions. The forward-looking statements are subject to
risks and uncertainties. All forward-looking statements should be considered in the context of the risk and other factors detailed from time
to time in CMS Energy’s and Consumers Energy’s Securities and Exchange Commission filings. Forward-looking statements should be
read in conjunction with “FORWARD-LOOKING STATEMENTS AND INFORMATION” and “RISK FACTORS” sections of CMS Energy’s
and Consumers Energy’s Form 10-K for the year ended December 31, 2015 and as updated in subsequent 10-Qs. CMS Energy’s and
Consumers Energy’s “FORWARD-LOOKING STATEMENTS AND INFORMATION” and “RISK FACTORS” sections are incorporated
herein by reference and discuss important factors that could cause CMS Energy’s and Consumers Energy’s results to differ materially from
those anticipated in such statements. CMS Energy and Consumers Energy undertake no obligation to update any of the information
presented herein to reflect facts, events or circumstances after the date hereof.
The presentation also includes non-GAAP measures when describing CMS Energy’s results of operations and financial performance. A
reconciliation of each of these measures to the most directly comparable GAAP measure is included in the appendix and posted on our
website at www.cmsenergy.com.
CMS Energy provides historical financial results on both a reported (GAAP) and adjusted (non-GAAP) basis and provides forward-looking
guidance on an adjusted basis. Adjustments could include items such as, discontinued operations, asset sales, impairments, restructuring
costs, regulatory items from prior years, or other items. Management views adjusted earnings as a key measure of the company’s present
operating financial performance and uses adjusted earnings for external communications with analysts and investors. Internally, the
company uses adjusted earnings to measure and assess performance. Because the company is not able to estimate the impact of specific
line items, which have the potential to significantly impact, favorably or unfavorably, the company’s reported earnings in future periods, the
company is not providing reported earnings guidance nor is it providing a reconciliation for the comparable future period earnings. The
adjusted earnings should be considered supplemental information to assist in fully understanding our business results, rather than as a
substitute for the reported earnings.
Investors and others should note that CMS Energy routinely posts important information on its website and considers the Investor Relations
section, www.cmsenergy.com/investor-relations, a channel of distribution.
1

2
2016 Year in Review . . . .
. . . . 13 years of consistent EPS growth.
A. Energy Law -- improves reliability, price competitiveness
B. Palisades PPA -- terminates in 2018; savings to customers
C. Tax reform -- lowers rates for customers; improves headroom
D. Raised ten-year capex $15.5 bil to $18 bil -- renewables and gas infrastructure
E. Consumers Energy Way – a culture of continuous improvement
F. Customer-centric model – self-funded with O&M cost reduction

New Energy Law . . . .
. . . . strengthens our plan AND benefits our customers.
Customer
What’s New?
Investor
What is the Impact?
• “ROA” Reform – subsidy addressed
• Increased energy efficiency & demand
response incentive
• RPS – 15% by end of 2021
• Improved Regulatory Process
• 10 month rate case
• Code of conduct
• Integrated Resources Plan (IRP)
• Price competitiveness
• Secure capacity
• Incentive outside
authorized ROE
• Additional rate base
opportunity
• Streamlined process
• Reliability planning
• Pre-approval of projects
3

4
Early Termination of Palisades PPA . . . .
100
150
200
250
300
350
400
450
2018 2019 2020 2021 2022
Cost (mils)
PPA Contract price-to-
Consumers
_ _ _ _ _
a Contract expires April 11, 2022. Amounts shown on the chart on annualized basis.
a
Customer
Savings
Key Points
. . . . is beneficial to customers AND investors.
Market
Replacement
Cost
$ • PPA to terminate in 2018 (vs 2022)
• Savings shared with owner, and our
customers (50/50)
• Contingent on MPSC approval
• Securitization of “termination
payment”
~$45 mil
per year
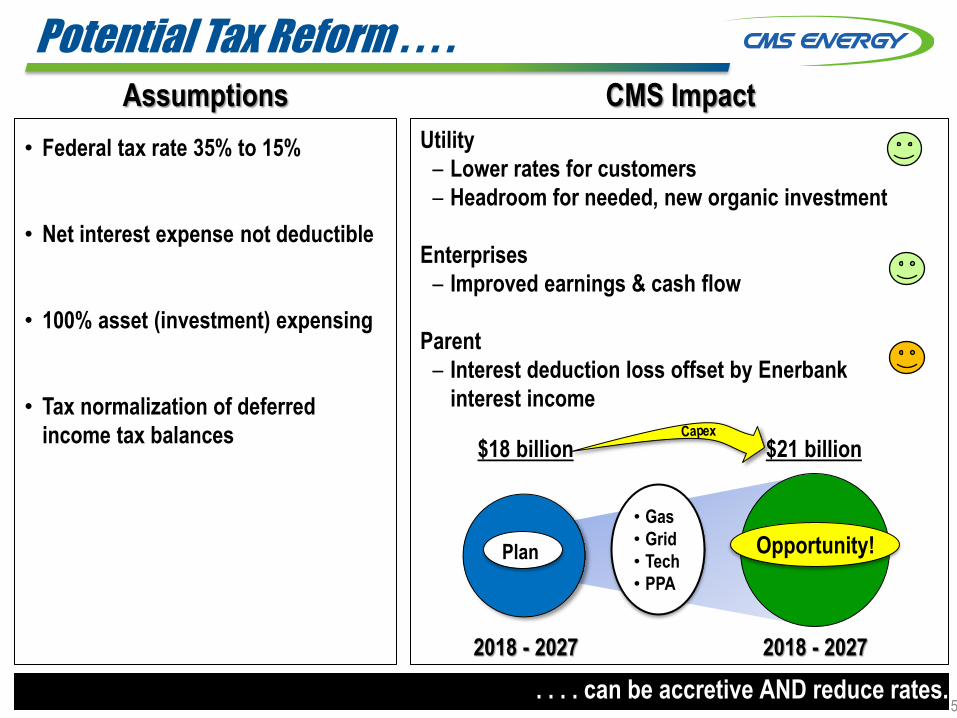
. . . . can be accretive AND reduce rates.
Potential Tax Reform . . . .
Assumptions CMS Impact
• Federal tax rate 35% to 15%
• Net interest expense not deductible
• 100% asset (investment) expensing
• Tax normalization of deferred
income tax balances
Utility
– Lower rates for customers
– Headroom for needed, new organic investment
Enterprises
– Improved earnings & cash flow
Parent
– Interest deduction loss offset by Enerbank
interest income
2018 - 2027
$18 billion $21 billion
2018 - 2027
Opportunity!
ex
Plan
• Gas
• Grid
• Tech
• PPA
5

6
Increasing Capital Investment by $1 billion . . . .
. . . . with even more opportunity ahead.
Environmental
New
Generation
Future
Opportunities
• More gas
infrastructure
• More renewables
• PPA replacement
2018 - 2027
$17 billion
2016 - 2025
$18 billion
Palisades
Replacement
Incremental Capex
• Gas main replacement
• Supply replacement
Electric
Infrastructure &
Maintenance
Gas
Infrastructure &
Maintenance
New
Generation
Electric
Distribution &
Reliability
Electric
Infrastructure &
Maintenance
Gas
Infrastructure &
Maintenance
Environmental
Electric
Distribution &
Reliability Gas
Additions
7
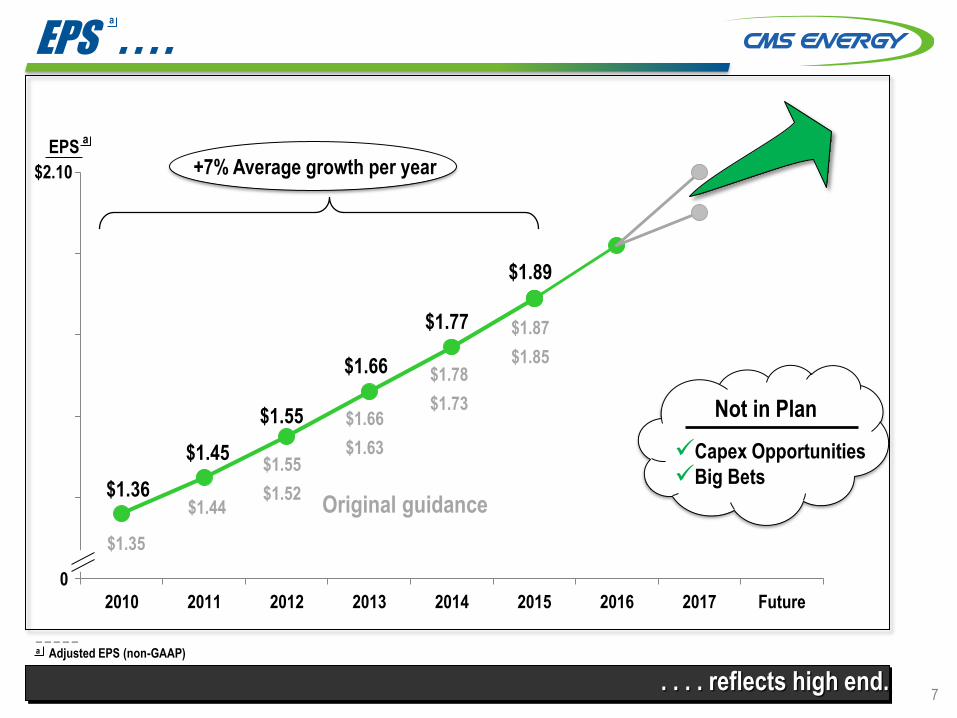
EPS . . . .
$1.36
$1.45
$1.55
2010 2011 2012 2013 2014 2015 2016 2017 Future
. . . . reflects high end.
_ _ _ _ _
a Adjusted EPS (non-GAAP)
$2.10
$1.66
EPS
0
$1.89
a
+7% Average growth per year
$1.77
$1.44
$1.55
$1.52
$1.66
$1.63
$1.78
$1.73
$1.35
Original guidance
Not in Plan
Capex Opportunities
Big Bets
a
$1.87
$1.85

The Consumers Energy Way . . . .
Safety: Every day is a safe day
Quality: We get it right the first time
Cost: We see and eliminate waste
Delivery: We get it done on time
CUSTOMER
FOCUS
ENABLED
EMPLOYEES
CONTINUOUS
IMPROVEMENT
STANDARDIZED
PROCESSES
BUSINESS
RESULTS
The CE Way Safety . Quality . Cost . Delivery
. . . . a culture of continuous improvement.
8

Simple, Perhaps Unique Model . . . .
Capital investment (reliability, costs, enviro mandates)
- O&M cost reductions
- Sales growth
- No “block” equity dilution & other
INVESTMENT SELF-FUNDED
Rate increase at or below inflation
2017+
Plan
6% - 8%
. . . . continues to drive sustainable growth, with upside opportunities.
2 - 3 pts
1
2
5 - 6 pts
<2%
9
Self Funding:
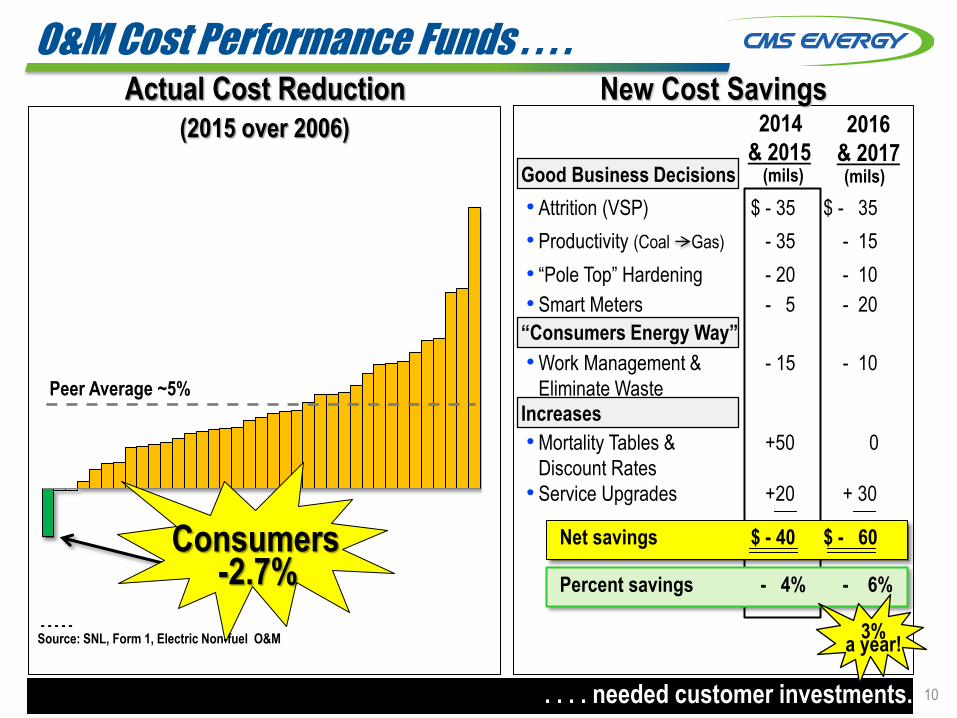
O&M Cost Performance Funds . . . . Actual Cost Reduction
Consumers
- - - - - Source: SNL, Form 1, Electric Non-fuel O&M
Peer Average ~5%
(2015 over 2006)
New Cost Savings
• Attrition (VSP) $ - 35 $ - 35
• Productivity (Coal Gas) - 35 - 15
• “Pole Top” Hardening - 20 - 10
• Smart Meters - 5 - 20
•Work Management &
Eliminate Waste
- 15 - 10
•Mortality Tables &
Discount Rates
+50 0
• Service Upgrades +20 + 30
Net savings $ - 40 $ - 60
Percent savings - 4% - 6%
2014
& 2015 2016
& 2017 (mils) (mils)
. . . . needed customer investments.
-2.7%
3% a year!
10
Good Business Decisions
“Consumers Energy Way”
Increases

Operating Cash Flow Funds . . . .
. . . . investments with no block equity.
(0.7)
(0.2)
0.4
0.9
1.4
1.9
2.4
2.9
2015 2016 2017 2018 2019 2020 2021
Amount
(bils)
$
Investment
Cash flow before dividend _ _ _ _ _
a Non-GAAP
NOLs & Credits $0.7 $0.9 $0.8 $0.7 $0.4 $0.3 $0.1
$2.5
Interest, working capital and taxes
$1.9
$2.8
$1.55
$2.2 $2.4
$2.7
Up $0.7 Billion
$2.1
Operating cash flow
Gross operating cash flowa up > $0.1 billion per year
11
Up
$0.8 billion
since 2009!
NOLs
avoid
need for
block
equity

Consistent Growth Through . . . .
2003 2004 2005 2006 2007 2008 2009 2010 2011 2012 2013 2014 2015 2016 2017
Recession
Governor (R) Governor (D)
Commission (D) Commission (R)
Recession
7% CAGR
Polar
vortex
Cold
Feb.
Mild
summer
Warm
winter
Hot
summer
Hot
summer Cold
winter
Cold
winter
Summer-
“less” Mild
summer Mild
summer
Commission (D)
Hurt
Help
EPS
_ _ _ _ _
a Adjusted EPS (non-GAAP)
a
Warm
winter
Hot
summer
Dividend
Weather
. . . . recessions, adverse weather, and leadership changes.
Whipple Joos Russell
Commission (I)
Poppe
Cold Feb.
Warm Dec.
Warm
Winter
12

Appendix
$1.00
$1.20
$1.40
$1.60
$1.80
$2.00
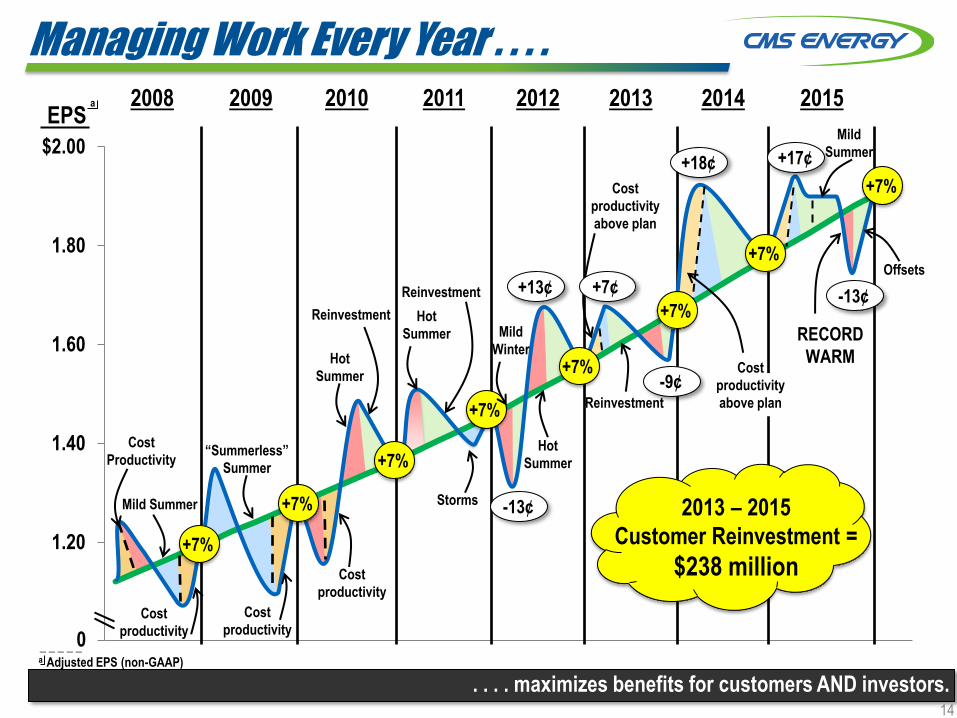
Managing Work Every Year . . . .
. . . . maximizes benefits for customers AND investors. 14
2008 2009 2010 2011 2012 2013 2014 2015
+7%
+7%
+7%
+7%
+7%
+7%
+7%
+7%
Offsets
RECORD
WARM
-13¢
+17¢ +18¢
-9¢
+13¢
-13¢
Mild
Summer
Cost
productivity
above plan
+7¢
Reinvestment
Hot
Summer
Mild
Winter
Hot
Summer
Storms
Hot
Summer
“Summerless”
Summer
Cost
Productivity
Cost
productivity
above plan
0
2013 – 2015
Customer Reinvestment =
$238 million
Cost
productivity
Cost
productivity
Reinvestment
Reinvestment
Mild Summer
Cost
productivity
EPS
_ _ _ _ _
a Adjusted EPS (non-GAAP)
a
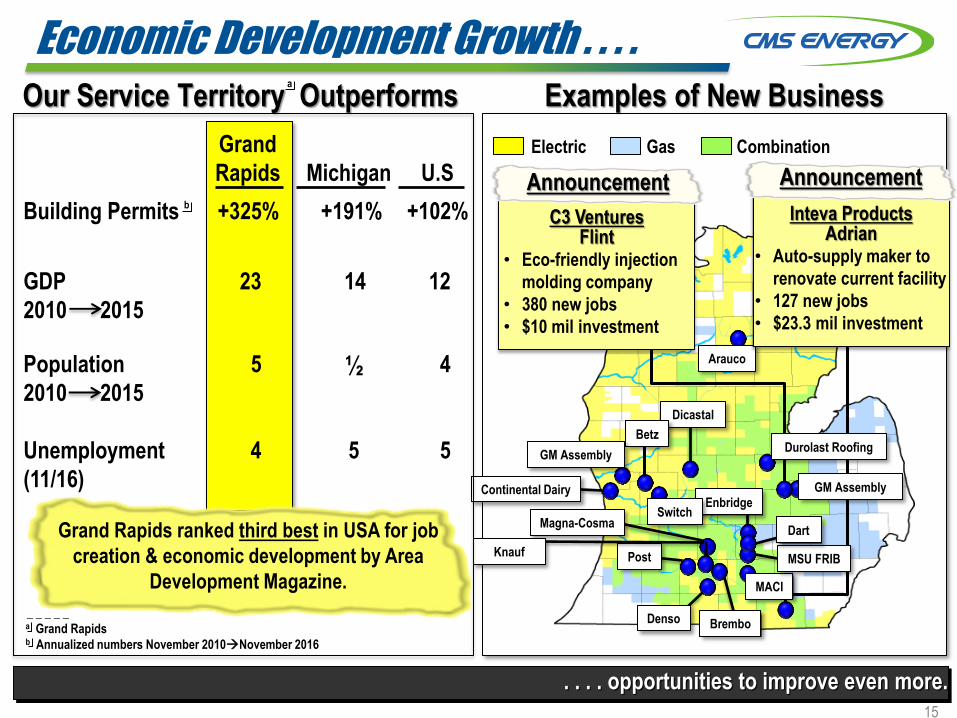
Economic Development Growth . . . .
Examples of New Business
Electric Gas Combination
Enbridge
Brembo Denso
Post
Magna-Cosma
Dicastal
Continental Dairy
Arauco
Betz
Knauf
. . . . opportunities to improve even more.
GM Assembly
Grand
Rapids
Michigan
U.S
Building Permits +325% +191% +102%
GDP
2010 2015
23 14 12
Population
2010 2015
5 ½ 4
Unemployment
(11/16)
4
5 5
b
_ _ _ _ _
a Grand Rapids b Annualized numbers November 2010November 2016
Our Service Territory Outperforms a
Switch
15
C3 Ventures Flint
• Eco-friendly injection
molding company
• 380 new jobs
• $10 mil investment
Durolast Roofing
MACI
MSU FRIB
Dart
Inteva Products Adrian
• Auto-supply maker to
renovate current facility
• 127 new jobs
• $23.3 mil investment
Announcement Announcement
GM Assembly
Grand Rapids ranked third best in USA for job
creation & economic development by Area
Development Magazine.
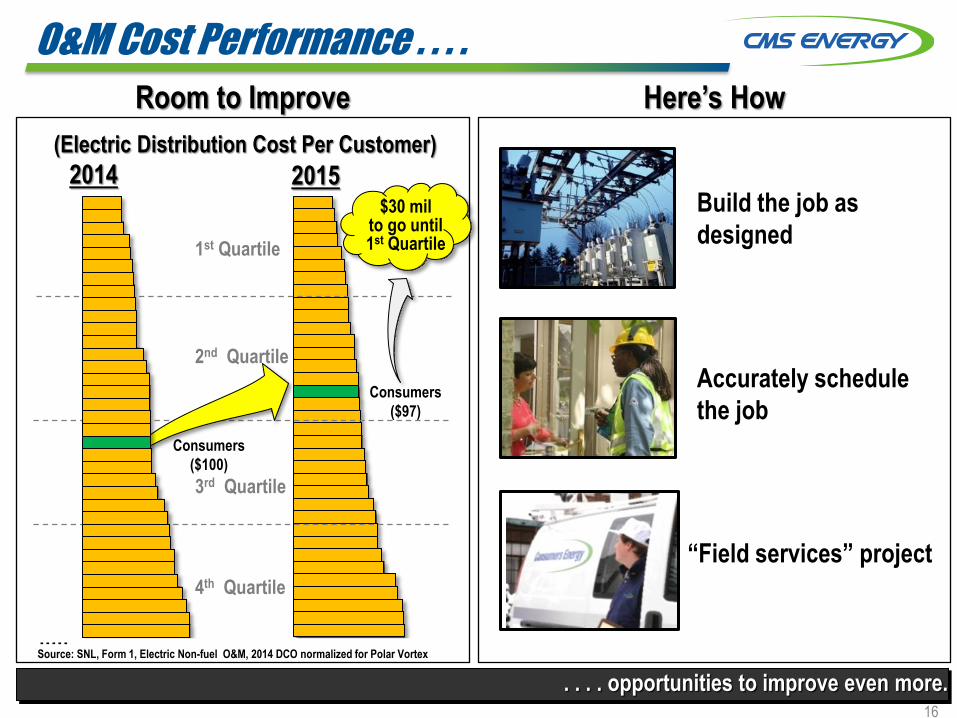
O&M Cost Performance . . . .
. . . . opportunities to improve even more.
(Electric Distribution Cost Per Customer)
2014 2015
1st Quartile
3rd Quartile
2nd Quartile
4th Quartile
Consumers
($97)
Room to Improve Here’s How
Build the job as
designed
Accurately schedule
the job
“Field services” project
- - - - - Source: SNL, Form 1, Electric Non-fuel O&M, 2014 DCO normalized for Polar Vortex
$30 mil to go until 1st Quartile
Consumers
($100)
16

“DIG” (750 MW) & Peakers (200 MW) . . . .
17 . . . . adding value.
0
10
20
30
40
50
60
70
80
2015 2016 2017
Pre-Tax Income (mils)
$12
$20
$35
Outage
pull-ahead
New
contracts
Future
Opportunities
Capacity ($/kw-mth) ≈ $1.00 ≈ $2.00 ≈ $3.00 $4.50 $7.50
Available:
• Energy • Capacity
0% 0% 0% 25%
0 0 10
$
+$20
+$40
Contracts
(layering in over time)
$75
$55
50% - 90%

18
Clean Power Plan . . . .
. . . . recently stayed by the Supreme Court.
10
11
12
13
14
15
16
17
18
19
20
2015 2016 2017 2018 2019 2020 2021 2022 2023 2024 2025 2026 2027 2028 2029 2030
Retire
950 MW
coal
Tons CO2
(mils)
0
Consumers Energy 2012 Emissions
State of Michigan Target
(Consumers Energy’s share)
Positioned well for compliance

Coal 41%
Gas 31%
Pumped Storage
11%
Renewables 3%
Oil 6% Nuclear
8%
Capacity Diversity . . . .
Coal <24%
Gas 34%
Pumped Storage
11%
Renewables 10%
Purchases 3%
Oil 10%
Nuclear 8%
. . . . evolving to cleaner generation and becoming more cost competitive. 19
Coal reduced
by over 40%!
2nd best in U.S.
2005
2016
• More Renewables; 15% by 2021
• Expanded Pumped Storage
• Clean Energy Resources
• Terminate nuclear PPA 2018
Future Capacity Mix
20
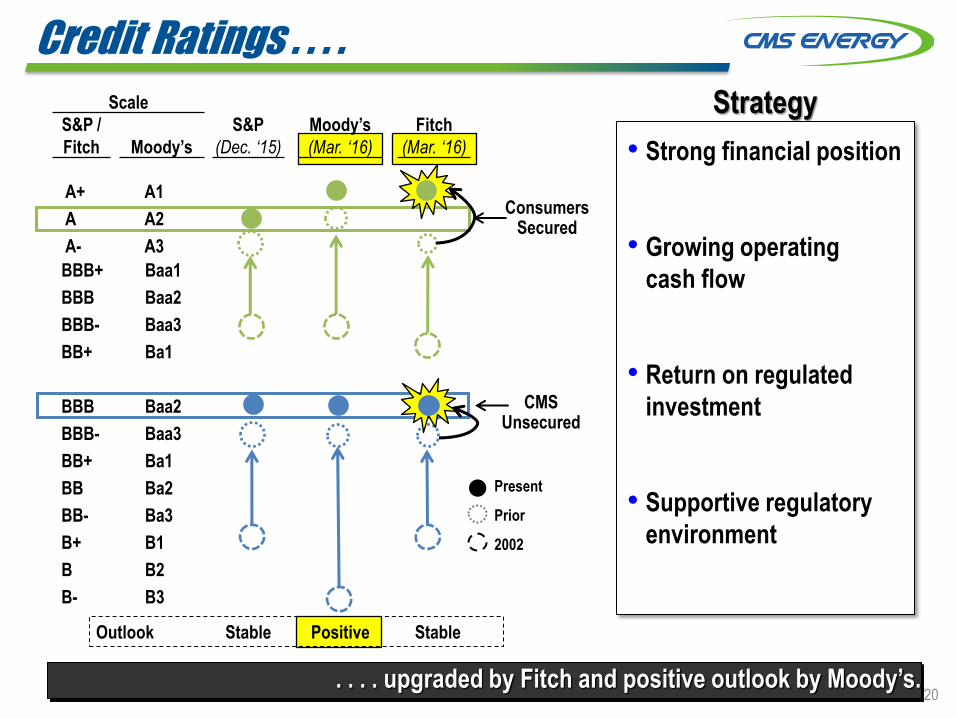
Credit Ratings . . . .
• Strong financial position
• Growing operating
cash flow
• Return on regulated
investment
• Supportive regulatory
environment
Strategy
Present
Prior
2002
Consumers Secured
CMS Unsecured
. . . . upgraded by Fitch and positive outlook by Moody’s.
Scale
S&P /
Fitch Moody’s
S&P
(Dec. ‘15)
Moody’s
(Mar. ‘16)
Fitch
(Mar. ‘16)
A+ A1
A A2
A- A3
BBB+ Baa1
BBB Baa2
BBB- Baa3
BB+ Ba1
BBB Baa2
BBB- Baa3
BB+ Ba1
BB Ba2
BB- Ba3
B+ B1
B B2
B- B3
Outlook Stable Positive Stable
GAAP Reconciliation

22
2003 2004 2005 2006 2007 2008 2009 2010 2011 2012 2013 2014 2015
Reported earnings (loss) per share - GAAP ($0.30) $0.64 ($0.44) ($0.41) ($1.02) $1.20 $0.91 $1.28 $1.58 $1.42 $1.66 $1.74 $1.89
Pretax items:
Electric and gas utility 0.32 (0.60) - - (0.06) 0.08 0.55 0.05 - 0.27 - - -
Tax impact (0.11) 0.21 - - (0.01) (0.03) (0.22) (0.02) - (0.10) - - -
Enterprises 0.93 0.97 0.06 (0.12) 1.67 (0.02) 0.14 (0.05) * (0.01) * 0.05 *
Tax impact (0.19) (0.35) (0.02) 0.10 (0.42) * (0.05) 0.02 (0.11) * (*) (0.02) (*)
Corporate interest and other 0.25 (0.06) 0.06 0.45 0.17 0.01 0.01 * - * * * *
Tax impact (0.09) 0.03 (0.02) (0.18) (0.49) (0.03) (*) (*) (0.01) (*) (*) (*) (*)
Discontinued operations (income) loss, net (0.16) 0.02 (0.07) (0.03) 0.40 (*) (0.08) 0.08 (0.01) (0.03) * (*) (*)
Asset impairment charges - - 2.80 1.07 0.93 - - - - - - - -
Tax impact - - (0.98) (0.31) (0.33) - - - - - - - -
Cumulative accounting changes 0.25 0.02 - - - - - - - - - - -
Tax impact (0.09) (0.01) - - - - - - - - - - -
Adjusted earnings per share, including MTM - non-GAAP $0.81 $0.87 $1.39 $0.57 $0.84 $1.21 (a) $1.26 $1.36 $1.45 $1.55 $1.66 $1.77 $1.89
Mark-to-market 0.04 (0.65) 0.80
Tax impact (0.01) 0.22 (0.29)
Adjusted earnings per share, excluding MTM - non-GAAP NA $0.90 $0.96 $1.08 NA NA NA NA NA NA NA NA NA
* Less than $0.01 per share.
(a) $1.25 excluding discontinued Exeter operations and accounting changes related to convertible debt and restricted stock.
CMS ENERGY CORPORATION
Earnings Per Share By Year GAAP Reconciliation
(Unaudited)

23
September 30 2016 2015 2016 2015
Electric Utility
Reported 0.69$ 0.60$ 1.42$ 1.24$
Downsizing Program 0.03 - 0.03 -
Tax Impact (0.01) - (0.01) -
Restructuring Costs and Other - - - -
Adjusted 0.71$ 0.60$ 1.44$ 1.24$
Gas Utility
Reported 0.01$ (0.02)$ 0.36$ 0.41$
Downsizing Program 0.01 - 0.01 -
Tax Impact (*) - (*) -
Restructuring Costs and Other - - - -
Adjusted 0.02$ (0.02)$ 0.37$ 0.41$
Enterprises
Reported 0.03$ 0.01$ 0.06$ 0.04$
Downsizing Program * - * -
Restructuring Costs and Other * * * *
Adjusted 0.03$ 0.01$ 0.06$ 0.04$
Corporate Interest and Other
Reported (0.06)$ (0.06)$ (0.14)$ (0.18)$
Restructuring Costs and Other * * * *
Adjusted (0.06)$ (0.06)$ (0.14)$ (0.18)$
Discontinued Operations
Reported $ * $ * $ (*) $ *
Discontinued Operations (Income) Loss (*) (*) * (*)
Adjusted -$ -$ -$ -$
Totals
Reported 0.67$ 0.53$ 1.70$ 1.51$
Discontinued Operations (Income) Loss (*) (*) * (*)
Downsizing Program 0.04 - 0.04 -
Tax Impact (0.01) - (0.01) -
Restructuring Costs and Other * * * *
Adjusted 0.70$ 0.53$ 1.73$ 1.51$
Average Common Shares Outstanding - Diluted (in millions) 279.2 276.9 278.8 276.3
* Less than $0.01 per share.
Three Months Ended Nine Months Ended
CMS ENERGY CORPORATION
Earnings Segment Results GAAP Reconciliation
(Unaudited)

24
2014 2015 2016 2017 2018 2019 2020 2021
Consumers Operating Income + Depreciation & Amortization 1,813$ 1,866$ 2,064$ 2,150$ 2,356$ 2,520$ 2,637$ 2,783$
Enterprises Project Cash Flows 20 20 38 54 52 52 54 55
Gross Operating Cash Flow 1,833$ 1,886$ 2,102$ 2,204$ 2,408$ 2,572$ 2,691$ 2,838$
(386) (246) (552) (554) (658) (722) (741) (788)
Net cash provided by operating activities 1,447$ 1,640$ 1,550$ 1,650$ 1,750$ 1,850$ 1,950$ 2,050$
CMS Energy
Reconciliation of Gross Operating Cash Flow to GAAP Operating Activities
(unaudited)(mils)
Other operating activities including taxes, interest payments and
working capital

INVESTOR INFORMATION
CMS Energy Corporation Phil McAndrews (517) 788-1464
Investor Relations Department Travis Uphaus (517) 768-3114
One Energy Plaza, Jackson, MI 49201 www.cmsenergy.com
CU
ST
OM
ERS
IN
VES
TO
RS
A
ND
January 2017
• 13 year track record
(7% EPS, OCF, and dividend growth)
• Capex -- $18 billion, 100% organic
• Self-funded -- No block equity
dilution! (10 years -- up from 5!)
• Best cost performance in sector
• Conservative sales planning
• $3+ billion capex opportunities
OUTPERFORMED FOR A DECADE:
NEXT DECADE EVEN BRIGHTER
OUR MODEL; OUR PLAN
The “Consumers Energy Way”
• Safety: every day is a safe day
• Quality: we get it right the first time
• Cost: we see and eliminate waste
• Delivery: we get it done on time
. . . . a culture of continuous improvement.
a
$1.00
$1.20
$1.40
$1.60
$1.80
$2.00
Managing Work Every Year . . . .
. . . . maximizes benefits for customers AND investors.
2008 2009 2010 2011 2012 2013 2014 2015
+7%
+7%
+7%
+7%
+7%
+7%
+7%
+7%
Offsets
RECORD
WARM
-13¢
+17¢+18¢
-9¢
+13¢
-13¢
Mild
Summer
Cost
productivity
above plan
+7¢
Reinvestment
Hot
Summer
Mild
Winter
Hot
Summer
Storms
Hot
Summer
“Summerless”
Summer
Cost
Productivity
Cost
productivity
above plan
0
2013 – 2015
Customer Reinvestment =
$238 million
Cost
productivity
Cost
productivity
Reinvestment
Reinvestment
Mild Summer
Cost
productivity
EPS
_ _ _ _ _a Adjusted EPS (non-GAAP)
a
CLean AND “Lean” Energy Portfolio . . . .
. . . . the Consumers Energy Way.
Sustainable Strategy Creates Headroom
A) Energy waste elimination/reduction– Energy efficiency
– Demand response
B) Fully utilize assets -- upgrades: – Ludington Pumped Storage:
1,900 MW to 2,300 MW!
– Gas Plants: Jackson, DIG, & Zeeland
C) Replace expensive PPAs– Renewables (cheap fuel)
– Peakers
D) “Lean” = lowest cost:
O&M, fuel, & capex
= highest quality:
customer-definedToday Future
O&M
O&M
Fuel Fuel
For: Palisades
replacement (saves $45
mil per year), and gas
infrastructure
Incentives
Rate base
Rate base
Powerful model
=
=
=
=
People, Planet, and Profit
CMS Energy: World Class Performance
Delivering Hometown Service

Adjusted EPS
Gross OCF
Dividend
CapEx
O&M Cost
$2.1 $2.8
2018 - 2027
Down 10%
$1.1 $0.9
~$0.9
• Fewer outages, reduce minutes
• Smart meters
• Better work management, 1st time quality
• Reduce coal and carbon
2006 2015 2018
(bils)
(bils)
Electric Distribution
Gas
Supply
Customer Benefits
Peers up 42%
Actual Plan Model
Int’l Sale
$1.0
+ $1.2
This placemat contains “forward-looking statements”; please refer to our SEC filings for information regarding the risks and uncertainties that could cause our results to differ materially. It also contains non-GAAP measures. Reconciliations to most directly comparable GAAP measures are found in the accompanying handout and on our website at www.cmsenergy.com
a
a
a Adjusted Non-GAAP
$1.77
$1.16
Down 10%
2017+ Plan
6% - 8% Capital investment
- O&M cost reductions
- Sales growth
- No “block” equity
dilution & other
INVESTMENT
(SELF-FUNDED)
Rate increase
New Cost Savings (mils) 2014 & 15 2016 & 17
Cost Reduction (2015 over 2006)
Peer Avg ~5%
Consumers
-2.7%!
-3%/ yr
- - - - - Source: SNL, Form 1, Electric Non-
fuel O&M
(1.0)(0.5)0.00.51.01.52.02.53.0
2015 2016 2017 2018 2019 2020 2021
Operating Cash Flow
Investment
$1.55
NOLs & Credits $0.7 $0.9 $0.8 $0.7 $0.4 $0.3 $0.1
$1.9 $2.2 $2.4 $2.5 $2.7 $2.8
a Amount
(bils)
Cash Flow Before Dividend
$2.1 OCF
Up >
$0.1 bil +
per
year!
$
0
$18 bil $21+ bil
Up $0.7!
+
$12 bil
2006 - 2015
• More gas infrastructure
• More renewables
• PPA replacement
Upside
Improving Service
Reducing Cost
Enhancing Productivity
Cleaner Energy
Opportunity!
Up
50%
$ 4.3
3.3
4.4
$12.0
$ 6.5
6.7
4.8
$18.0
Up 103%
27% 37%
Good Business Decisions
“Consumers Energy Way”
Increases
• Attrition (VSP) $ - 35 $ - 35
• Productivity (Coal to Gas) - 35 - 15
• “Pole Top” Hardening - 20 - 10
• Smart Meters - 5 - 20
• Work Management - 15 - 10
• Discount Rates Plus +50 0
• Service Upgrades +20 + 30
Net Savings $ - 40 $ - 60
Percent Savings - 4% - 6%
20¢ 36¢ 50¢
66¢ 84¢ 96¢ $1.02 $1.08 $0.81 $0.90 $0.96
$1.08
$0.84
$1.21 $1.26 $1.36 $1.45 $1.55 $1.66
2003 2004 2005 2006 2007 2008 2009 2010 2011 2012 2013 2014 2015 2016 Future
$1.89
2 - 3 pts
1
2
5 - 6 pts
< 2 %
+7%/ year
2018 - 2027
2017 Energy Law • ROA Reform – Subsidy addressed
• Increased EE incentive
• RPS – 15% by end of 2021
• Integrated Resources Plan
• Improve Regulatory Process
• Price competitiveness; secure capacity
• Incentive on top of authorized ROE
• Additional rate base opportunity
• Reliability planning; pre-approval of renewable projects
• Streamlined process
Investor Customer
-20
-10
0
10
20
2013 2014 2015 2016-30-20-10
0102030
2013 2014 2015 2016
Residential Bills Industrial Rates
National Avg Midwest Avg
% % Well below
U.S. average
Improving
rapidly
Self-funded (No block equity dilution)
+ $0.7
2016
2003 2010 2011 2012 2013 2014 2015 2016 2017 2018 2019 2020 2021


