Evidence-based Standards for Measuring Nurse Staffing and Performance Project # RC1 – 0621 – 06 Report for the Canadian Health Services Research Foundation December, 2003 Revised and Resubmitted, September, 2004 Prepared by Linda O’Brien-Pallas, RN, PhD Donna Thomson, RN, MBA Linda McGillis Hall, RN, PhD George Pink, PhD Mickey Kerr, PhD Sping Wang, PhD Xiaoqiang Li, PhD Raquel Meyer, RN, PhD Student
Transcript
Evidence-based Standards for Measuring Nurse Staffing and Performance Project # RC1 – 0621 – 06
Report for the
Canadian Health Services Research Foundation December, 2003
Revised and Resubmitted, September, 2004
Prepared by
Linda O’Brien-Pallas, RN, PhD
Donna Thomson, RN, MBA
Linda McGillis Hall, RN, PhD
George Pink, PhD
Mickey Kerr, PhD
Sping Wang, PhD
Xiaoqiang Li, PhD
Raquel Meyer, RN, PhD Student
Evidence-based Staffing i
Acknowledgements The investigators wish to thank the Canadian Health Services Research Foundation, the Ontario Hospital Association Change Foundation, the nursing effectiveness, utilization, and outcomes research unit of the faculty of nursing at the University of Toronto, and the contributing hospitals for the financial support that made this research project possible. The advisory committee members are acknowledged for their guidance in the development of the data collection tools and for their assistance in interpreting the results and their input on the feasibility of collecting significant data elements on an ongoing basis. Dr. Judith Shamian — Health Canada Kathleen MacMillan — Health Canada Jill Strachan — Canadian Institute for Health Information Barbara McGill and Nancy Savage — Atlantic Health Sciences Corporation Jane Moser — University Health Network David McNeil — Sudbury Regional Hospital Margaret Keatings — Hamilton Health Sciences Heather Sherrard — Ottawa Heart Institute Carol Wong — London Health Sciences Centre Lucille Auffrey — Canadian Nurses Association Sue Williams — Ontario Joint Provincial Nursing Committee Beverly Tedford — New Brunswick Department of Health and Wellness Sue Matthews — Ontario Ministry of Health and Long-Term Care Hospital and site co-ordinators and data collectors are recognized for their efforts to collect comprehensive and accurate data about their organization, patients, and nurses in order to support this project. Staff and patients at participating hospitals are thanked for their willingness to participate in this study by completing surveys. Health records departments are thanked for providing patient-specific diagnoses and outcomes. Hospitals and Site Co-ordinators: Sudbury Regional Hospital: Claire Gignac London Health Sciences Centre: Nancy Hilborn University Health Network: Elke Ruthig Hamilton Health Sciences: Bernice King Atlantic Health Sciences Corporation: Trevor Fotheringham Ottawa Heart Institute: Judith Sellick A special thank you is given to project co-ordinators Shirliana Bruce and Min Zhang and research assistant Irene Cheung.
Evidence-based Staffing ii
Key Implications for Decision Makers Variations in nursing productivity/utilization and staffing patterns are frequently observed between, as well as within, hospitals. Decision makers are challenged to maximize productivity/utilization and minimize staffing costs, while ensuring the quality of care. Recommendations from this study inform decision-making on these important issues within hospital cardiac and cardiovascular units.
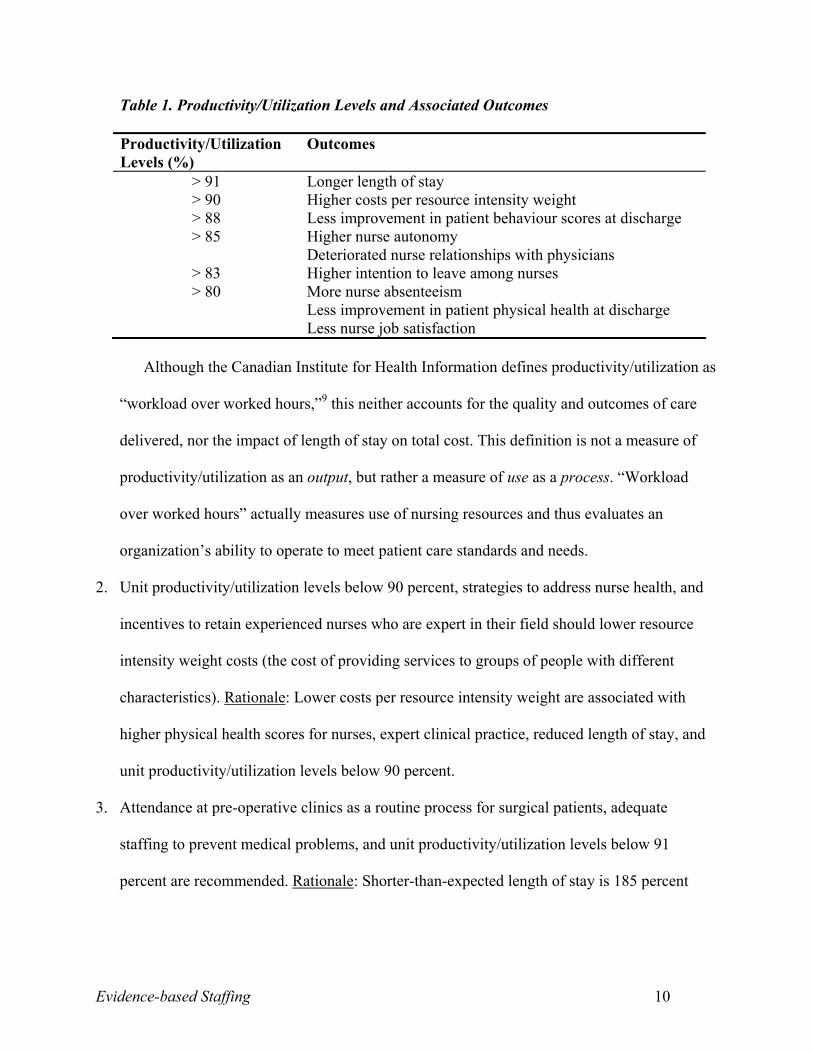
• Nursing unit productivity/utilization levels should target 85 percent, plus or minus five percent. Levels higher than this lead to higher costs, poorer patient care, and poorer nurse outcomes.
• Maximum productivity/utilization is 93 percent (because seven percent of the shift is
made up of paid, mandatory breaks). Units where nurses frequently work at or beyond maximum productivity/utilization must urgently reduce productivity/utilization and implement acceptable standards.
• Productivity/Utilization targets can be met by enhancing nurse autonomy, reducing
emotional exhaustion, and having enough staff to cope with rapidly changing patient conditions.
• Overall costs are reduced when experienced nurses are retained. Retention is more likely
when there is job security, when nurses can work to their full scope of practice, and when productivity/utilization levels are below 83 percent.
• Retention strategies must address the physical and mental health of nurses, balancing the
efforts and rewards associated with work, nurse autonomy, full scope of practice, managerial relationships, innovative work schedules, hiring more nurses into full-time permanent positions, and reasonable nurse-to-patient ratios based on targeted productivity/utilization standards. These will minimize the effect of persistently high job demands and reduce absenteeism and the use of overtime.
• Investment is needed for infrastructure to collect data that will monitor and improve care
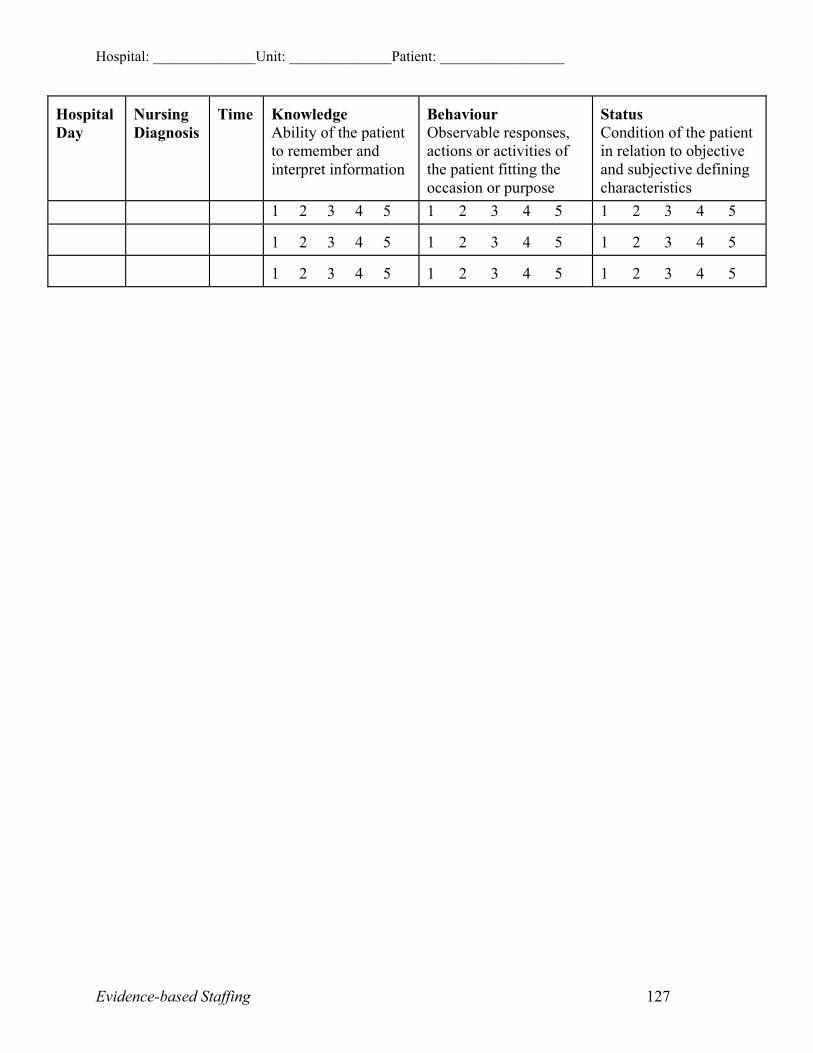
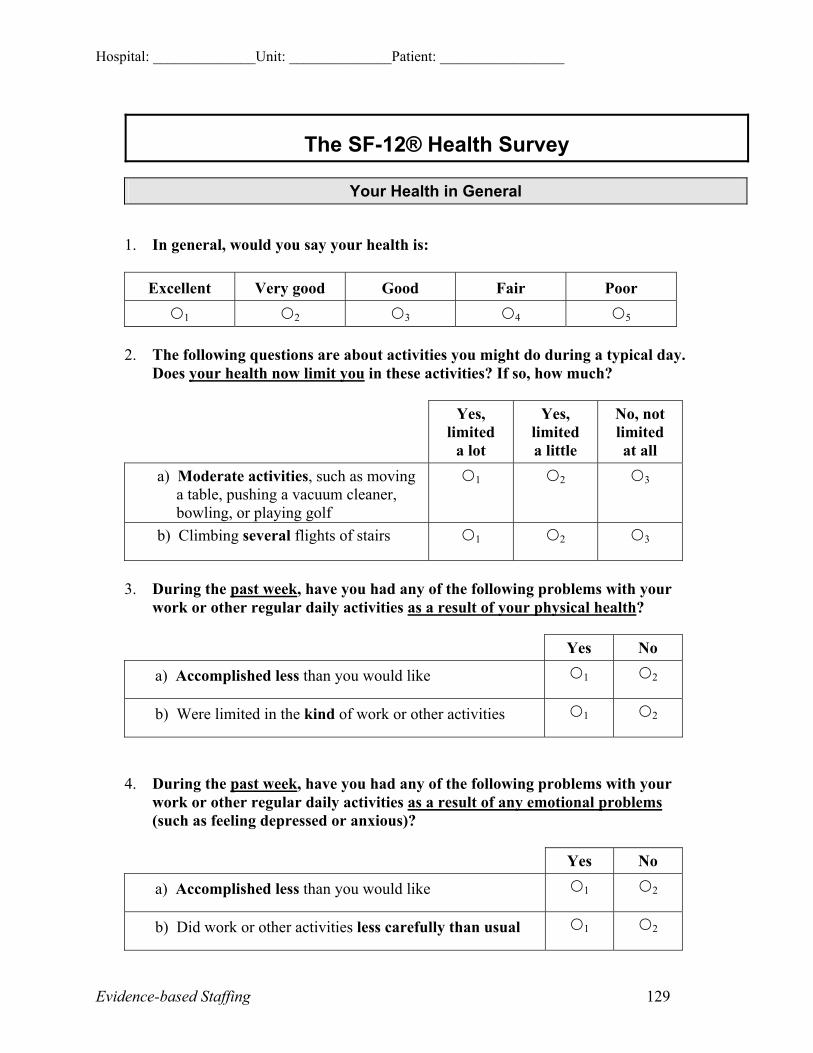
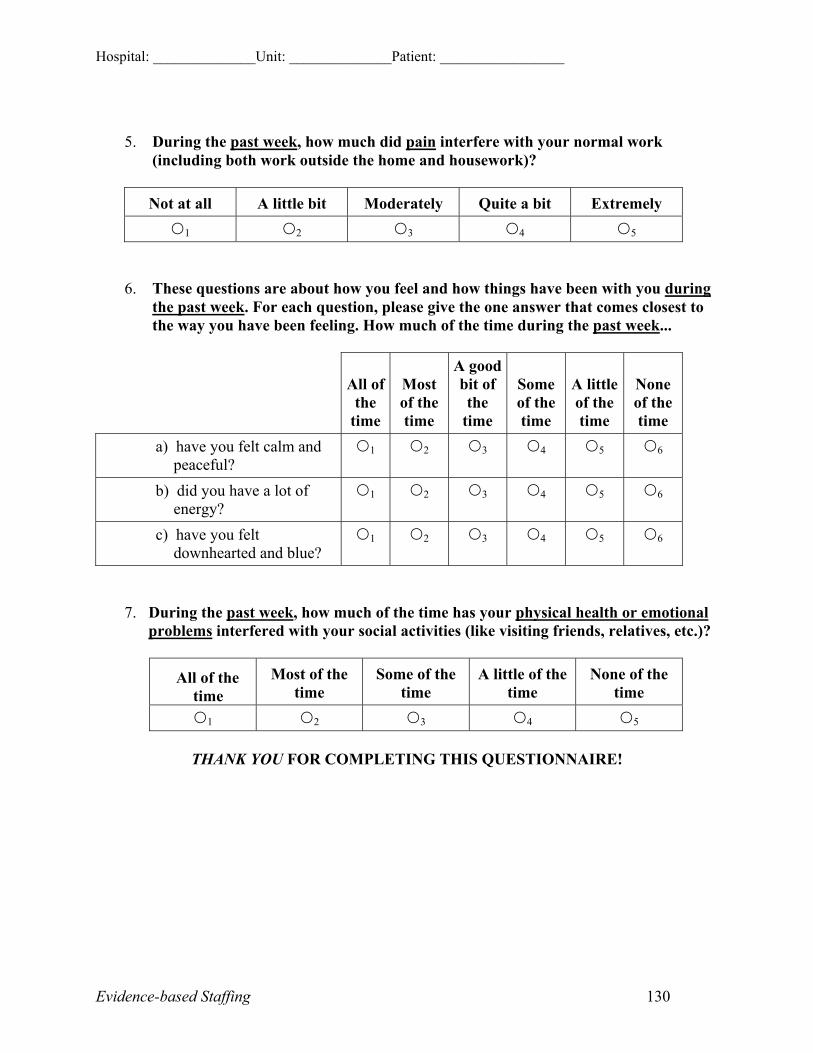
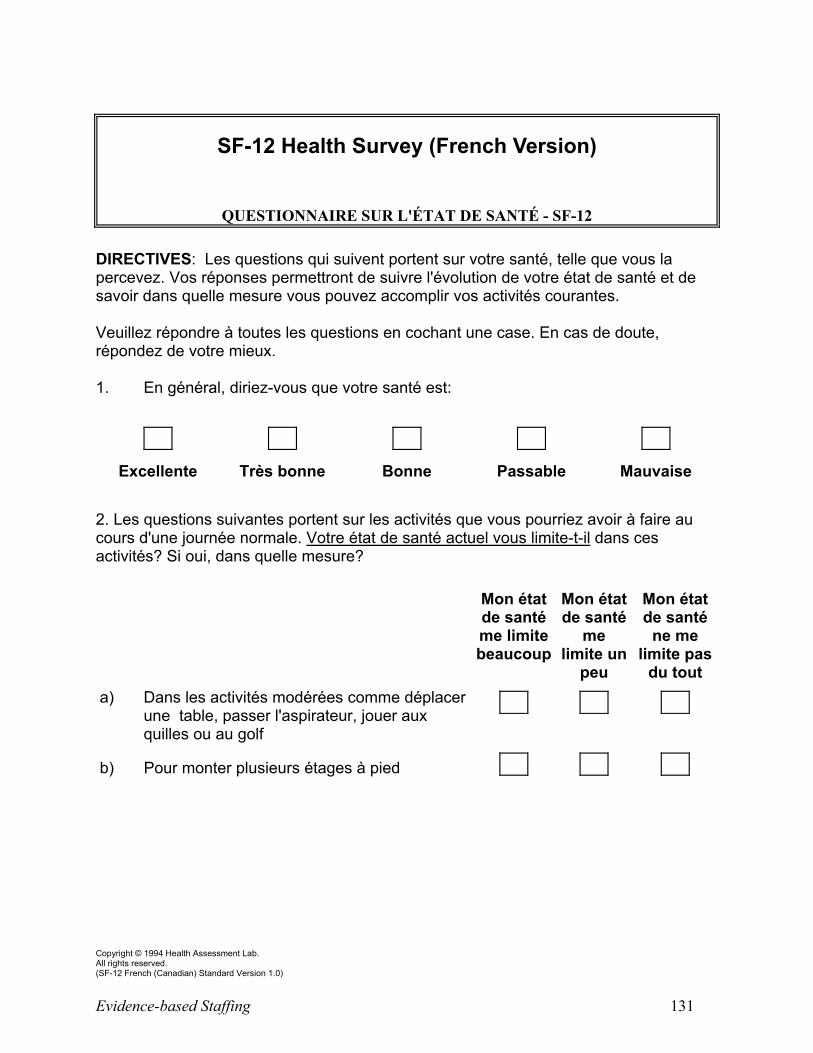
delivery processes and measurement of performance outcomes. Data that should be routinely captured, but are not yet, include valid workload measurement; environmental complexity; patient nursing diagnoses and OMAHA ratings of knowledge, behaviour, and status; nurse and patient SF-12 health status; nurse to patient ratios; and productivity/utilization.
Evidence-based Staffing iii
Executive Summary Policy makers and hospital administrators are seeking evidence to support nursing staffing
decisions that includes both the volume and mix of nurses required to provide efficient and effective
care. The principal objective of this study was to examine the interrelationships between variables
thought to influence patient, nurse, and system outcomes. The results provide quality, evidence-based
standards for adjusted ranges of nursing productivity/utilization and for staffing levels for patients
receiving cardiac and cardiovascular nursing care.
Although hospitals have little control over patient severity and complexity, organizations can
manage nurse characteristics, system characteristics and behaviours, and environmental factors that
influence patient, nurse, and system outcomes. Numerous findings provide important evidence to
guide policy and management decisions related to the deployment and use of nursing personnel.
These findings suggest that organizations can implement many strategies to improve the cost and
quality of care.
In the past, actions to minimize expenses have focused on reducing the cost of inputs, the
number of nurses, and the skill level. The findings of this study suggest that to actually reduce the
cost and improve the quality of patient care, organizations will benefit from 1) hiring experienced,
full-time, baccalaureate-prepared nurses; 2) staffing enough nurses to meet workload demands; and
3) creating work environments that foster nurses’ mental and physical health, safety, security, and
satisfaction. The evidence supports the need for a significant change in the way organizations view
costs and suggests that the emphasis on cost of inputs should shift to the cost of outputs and the
quality of care.
The study found nursing productivity/utilization should be kept at 85 percent, plus or minus
five percent. When rates rise above 80%, costs increase and quality of care decreases. Patient health
is more likely to be improved at discharge if productivity/utilization levels are below 80 percent and
Evidence-based Staffing iv
if patients are cared for by nurses who work less overtime. When productivity/utilization levels are
kept below 80 percent, nurses are more likely to be satisfied with their jobs and absenteeism is
reduced, and nurses are less likely to want to leave their jobs when productivity/utilization is less
than 83 percent.
Costs are lower when hospitals maintain productivity/utilization levels below 90% and
implement strategies to improve nurse health and incentives to retain experienced nurses. Autonomy
can be enhanced by balancing the number of patients assigned to each nurse and each nursing unit,
and emotional exhaustion is less likely when nurses are satisfied, mentally and physically healthy,
and feel that they receive appropriate rewards for their efforts. Nurses are more likely to be
physically healthy when there are good relationships with the physicians on the unit, and these
relationships tend to improve when nurses’ autonomy and decision-making abilities are respected.
Aggression- and violence-free workplaces are key to enabling nurses to do their nursing
interventions on time. There also needs to be enough nursing staff to deal with the rapidly changing
conditions in hospitalized patients, so that nurses have enough time to complete patient care.
Patient care is improved when units are staffed with degree-prepared nurses and when nurses
can work to their full scope of practice. This not only improves job satisfaction, but nurses are also
less likely to leave their jobs.
Patients’ health behaviour improves when nurses have a satisfying work environment, secure
employment, and when unit productivity/utilization does not exceed 88 percent. Enhanced nurse
autonomy, full-time employment, and fewer shift changes are shown to improve patients’ knowledge
about their conditions when they are discharged.
Evidence-based Staffing v
Table of Contents
Acknowledgements.......................................................................................................................... i
Key Implications for Decision Makers ........................................................................................... ii
Executive Summary ....................................................................................................................... iii
I. Context......................................................................................................................................... 7
II. Implications................................................................................................................................ 8
System Implications.................................................................................................................... 9
Research Question 1. ................................................................................................................ 21 Intermediate System Outputs..........................................................................................21 Patient Outcomes............................................................................................................22 Nurse Outcomes..............................................................................................................24 System Outcomes............................................................................................................27
Research Question 2. ................................................................................................................ 30
Research Question 3. ................................................................................................................ 30
Research Question 4. ................................................................................................................ 31
V. Additional Resources ............................................................................................................... 32
VI. Further Research..................................................................................................................... 32
VII. References ............................................................................................................................. 32
Evidence-based Staffing vi
Appendices
A. Annotated Bibliography...............................................................................................35
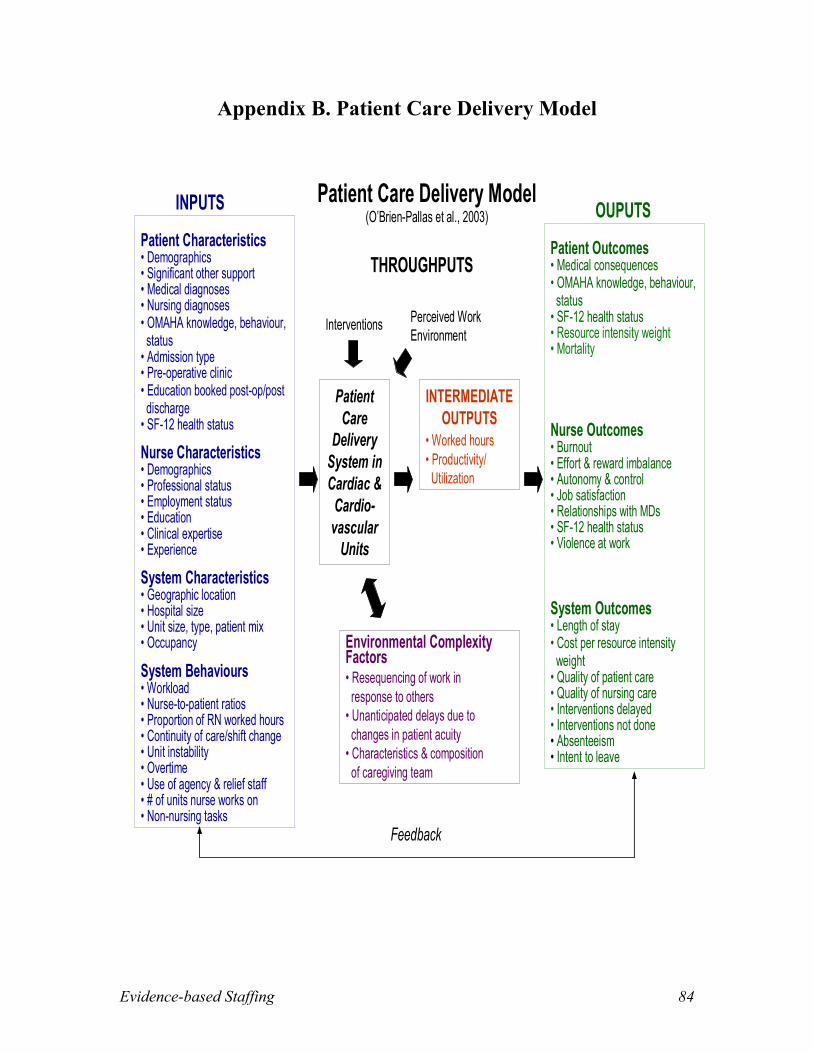
B. Patient Care Delivery Model.......................................................................................84
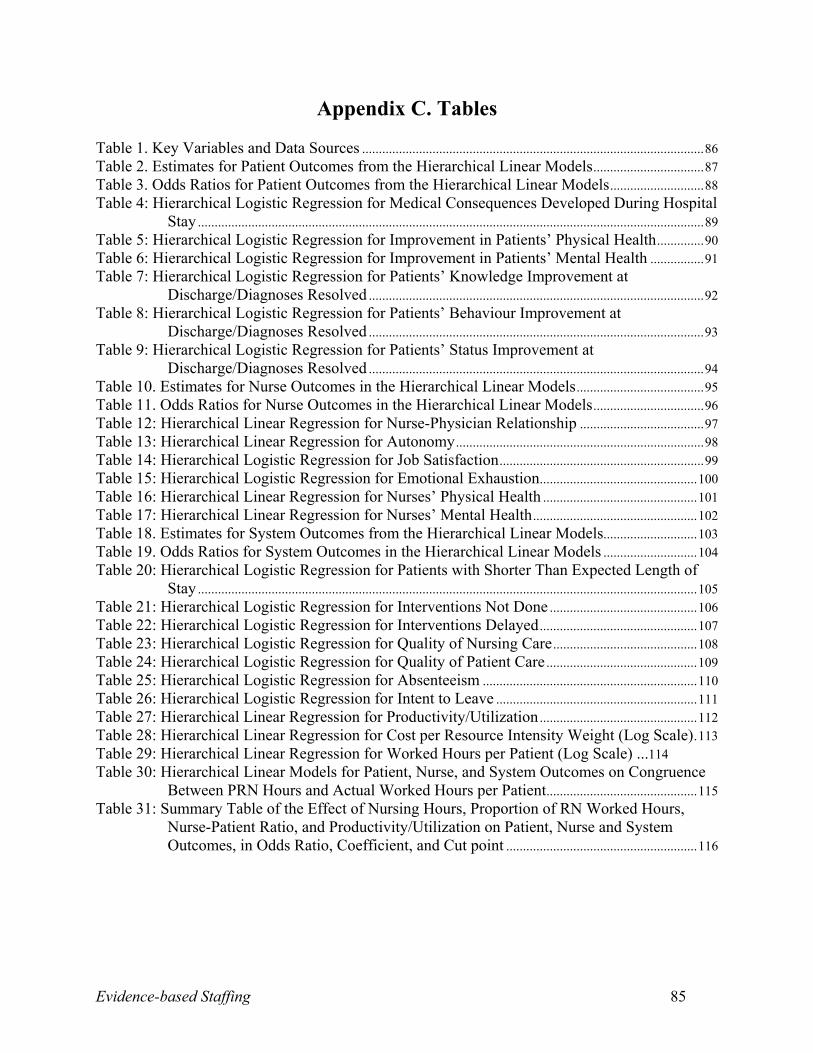
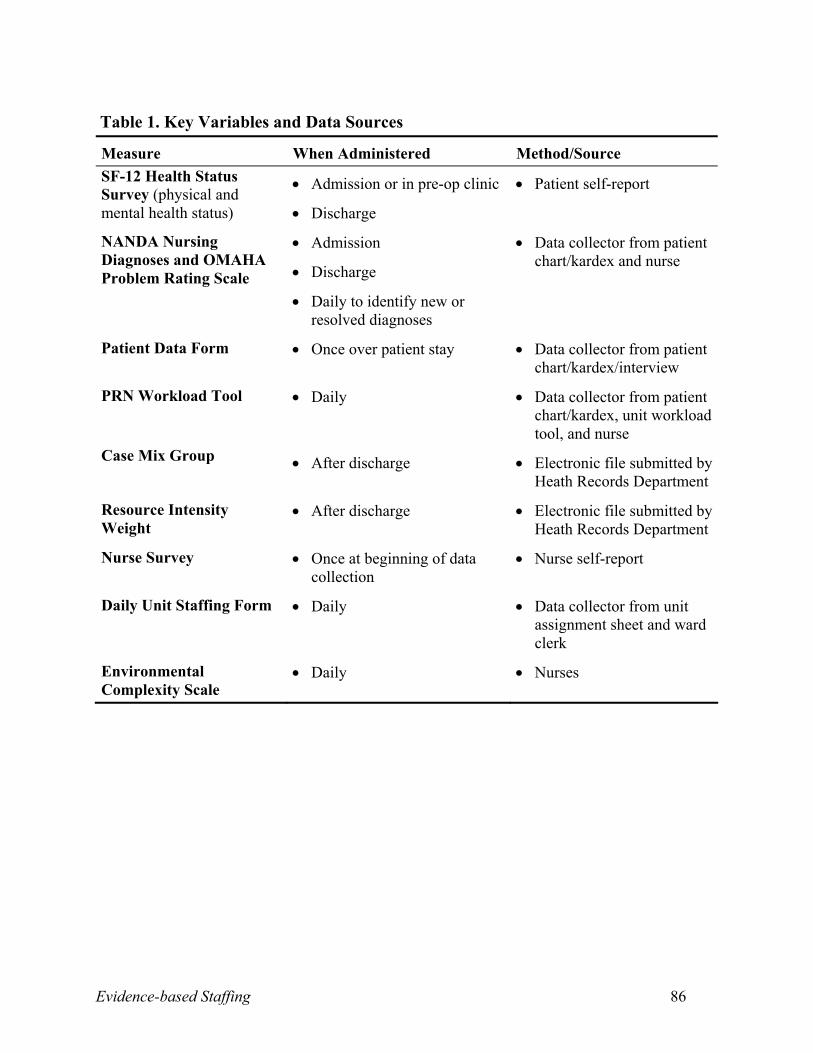
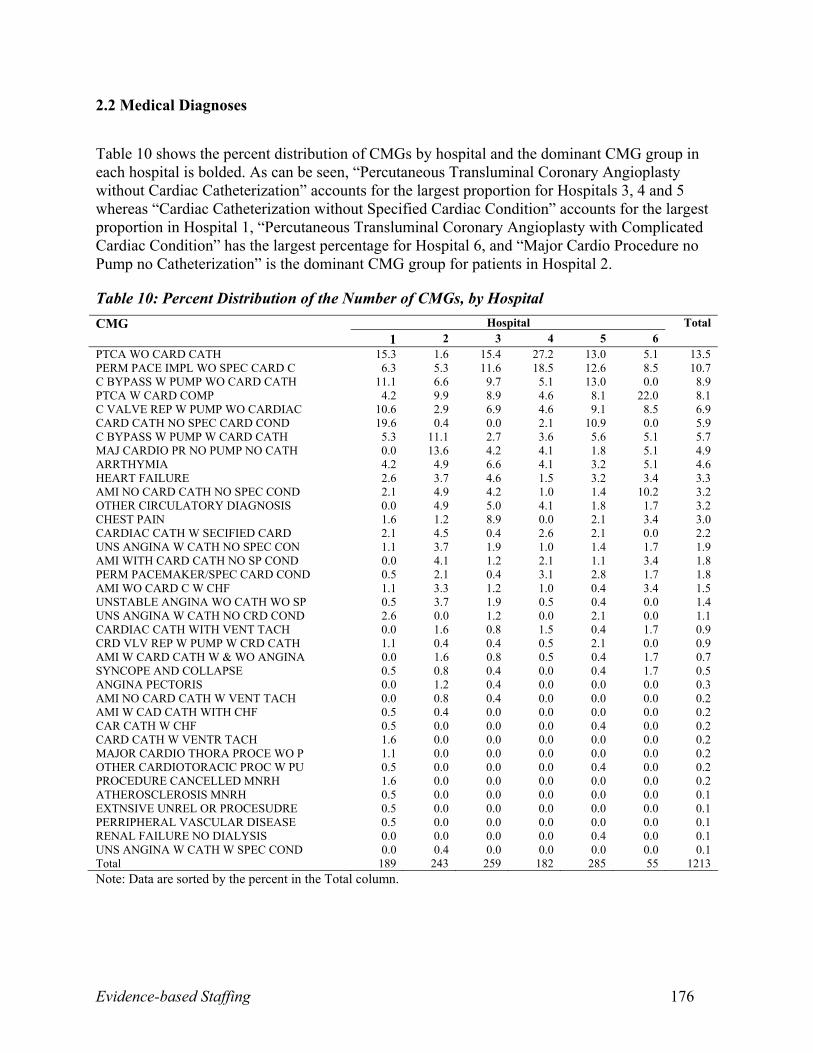
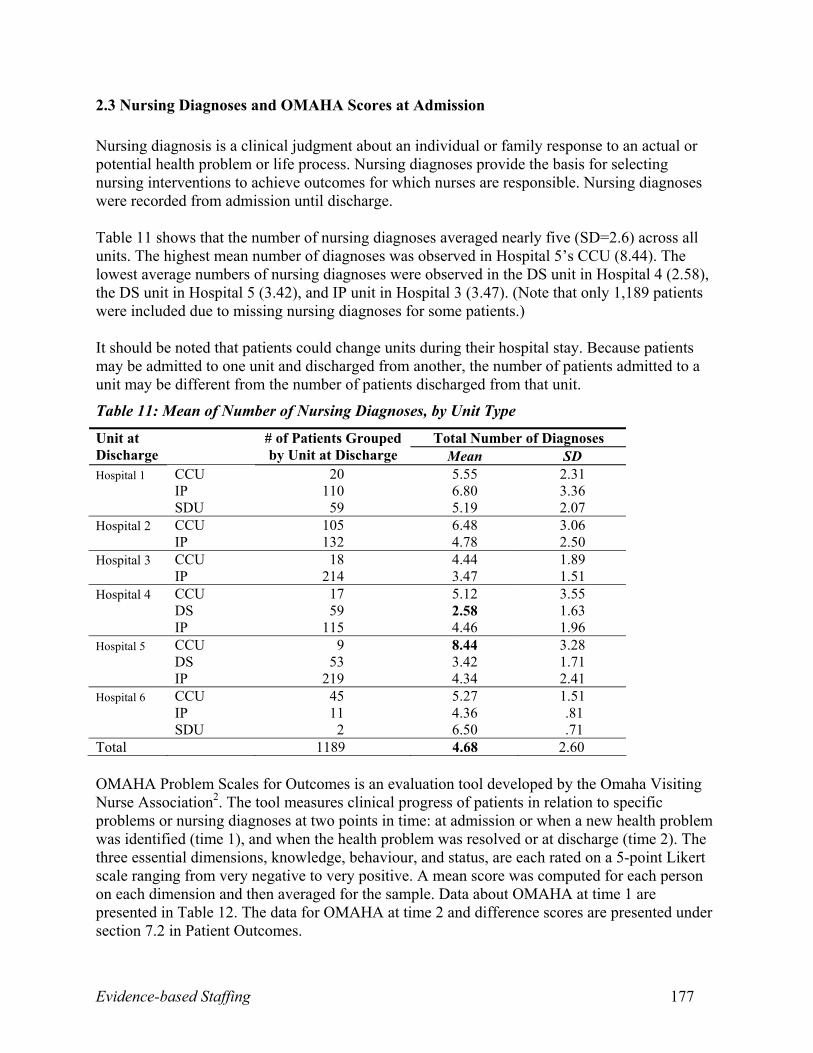
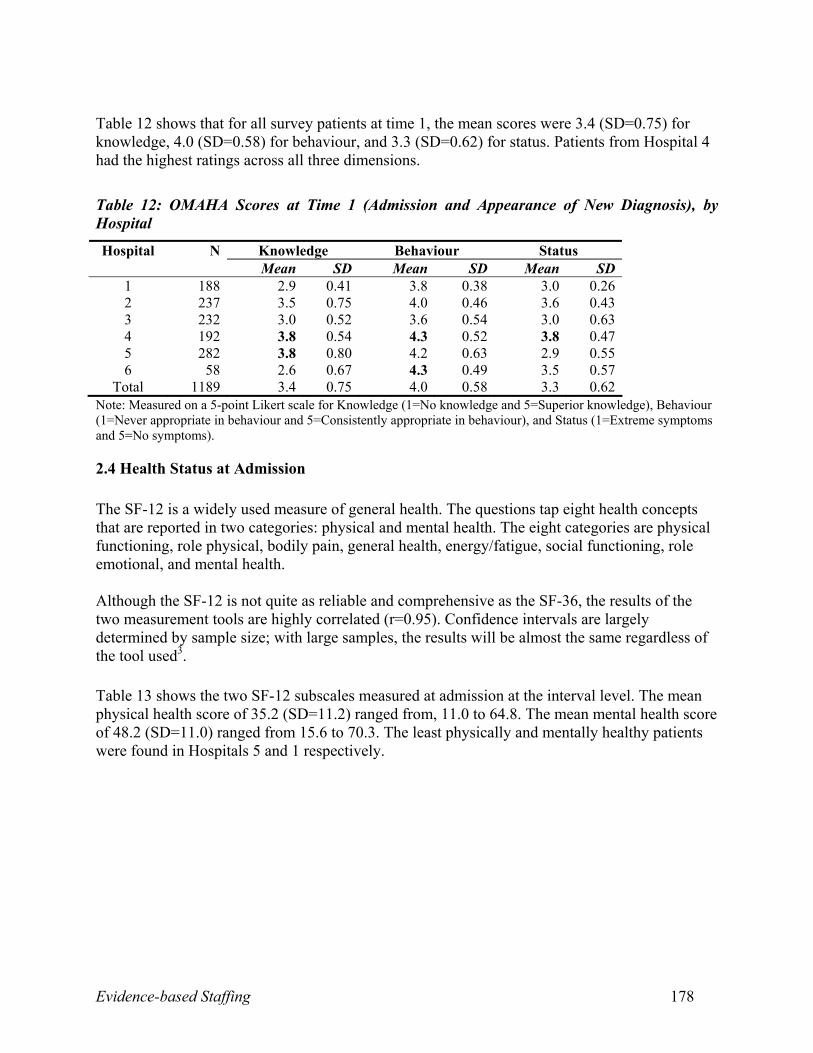
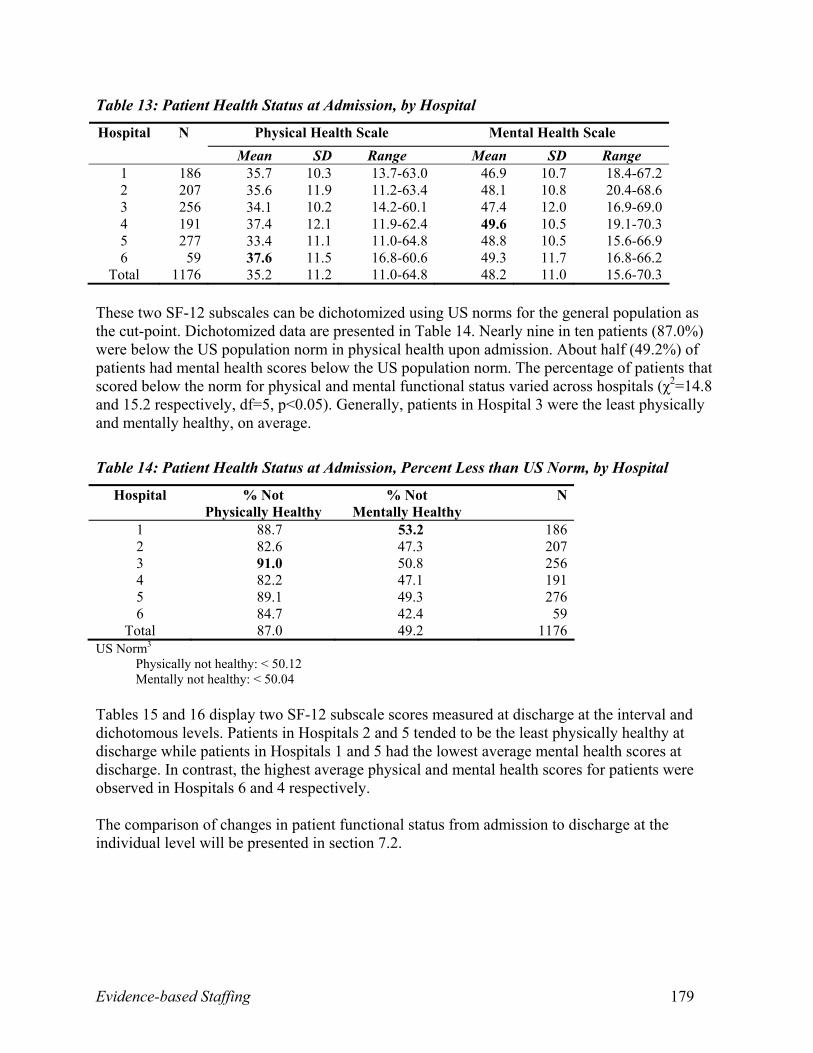
C. Tables.............................................................................................................................85
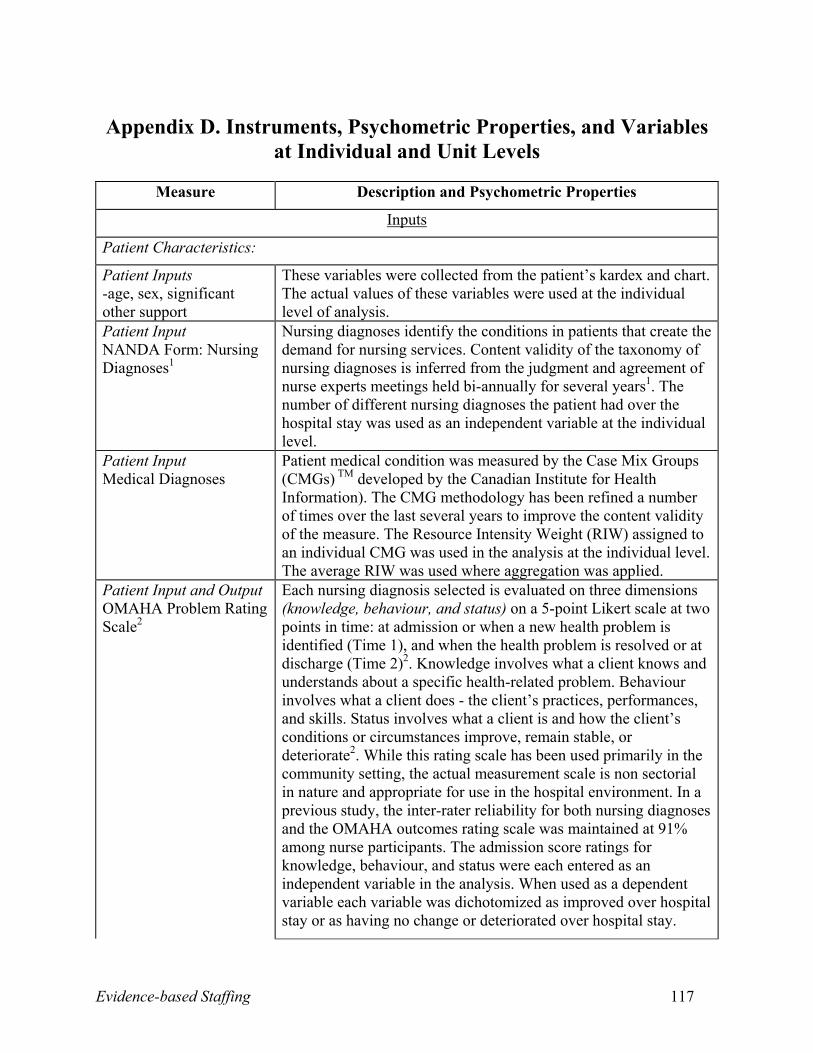
D. Instruments, Psychometric Properties, and Variables at Individual and Unit
(0.4 percent), and thrombosis (0.2 percent). Between admission and discharge, patients’ scores
for SF-12 physical health status improved (41.1 percent) nearly as often as they declined (44.9
percent). A similar pattern was noted for patients’ mental health status (42.3 percent improving
and 44.9 percent deteriorating). For physical and mental health status scores, 12.8 percent of
patients showed no change. Overall, general improvement of patients was evidenced through
mean changes in OMAHA knowledge (0.43), behaviour (0.25), and status (0.79) scores between
admission and discharge (or appearance and resolution of new nursing diagnoses).
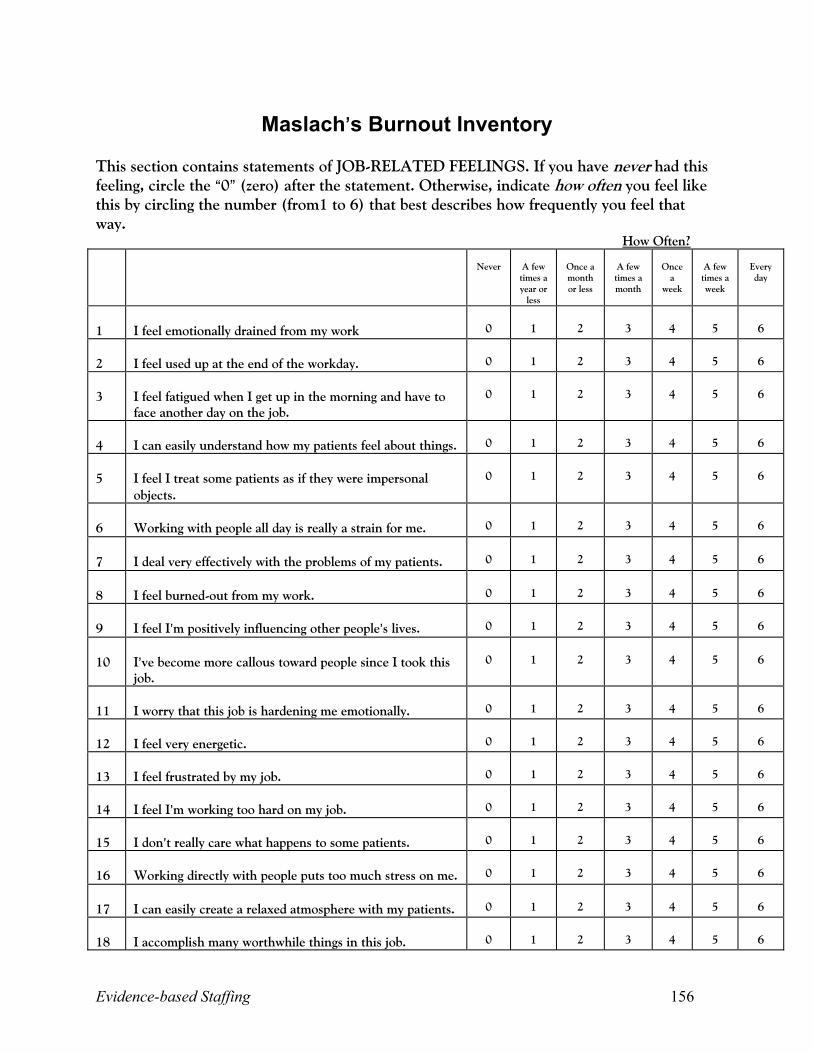
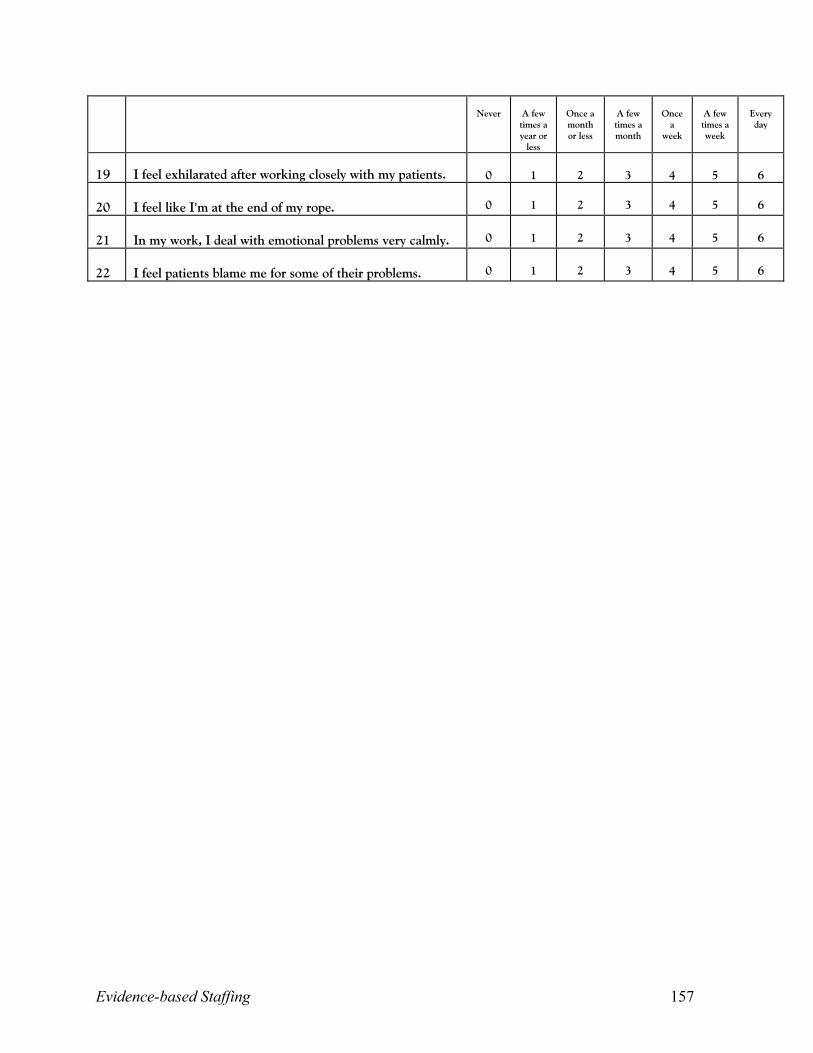
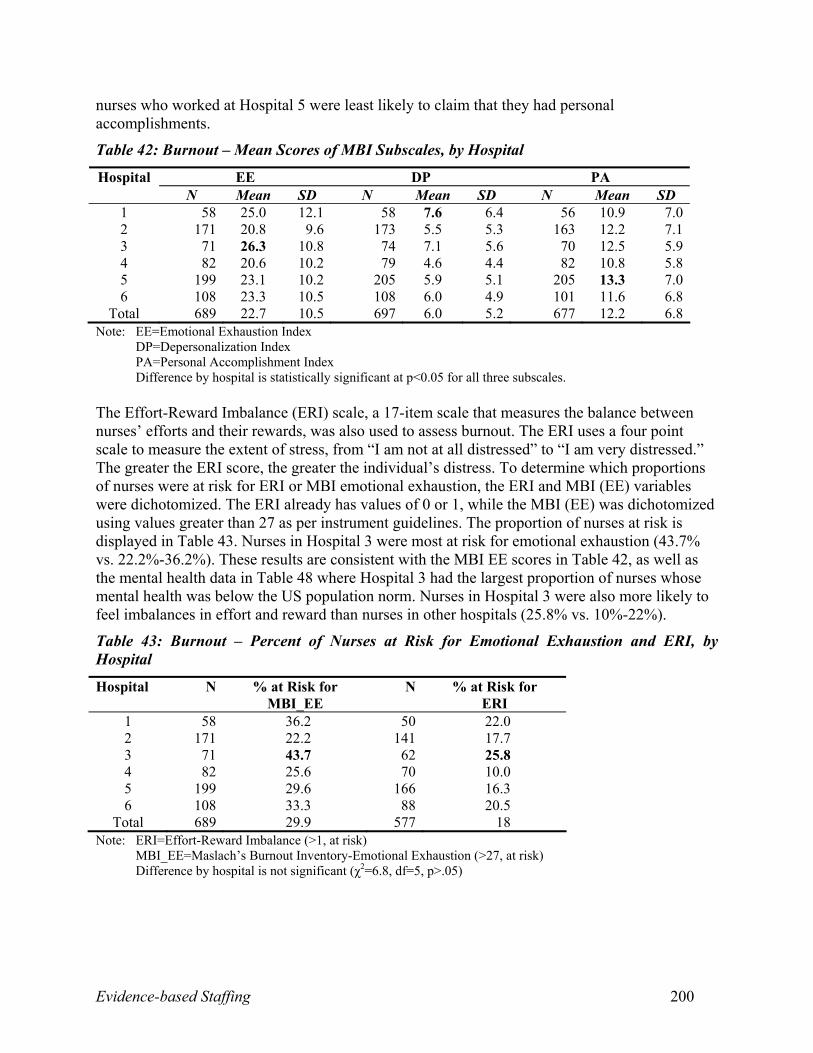
Nurse Outcomes: On average, nurses scored 22.7 for emotional exhaustion, six for
depersonalization, and 12.2 for personal accomplishment using Maslach’s Burnout Inventory.
Almost 30 percent of nurses were at risk for emotional burnout. Additionally, 18 percent of
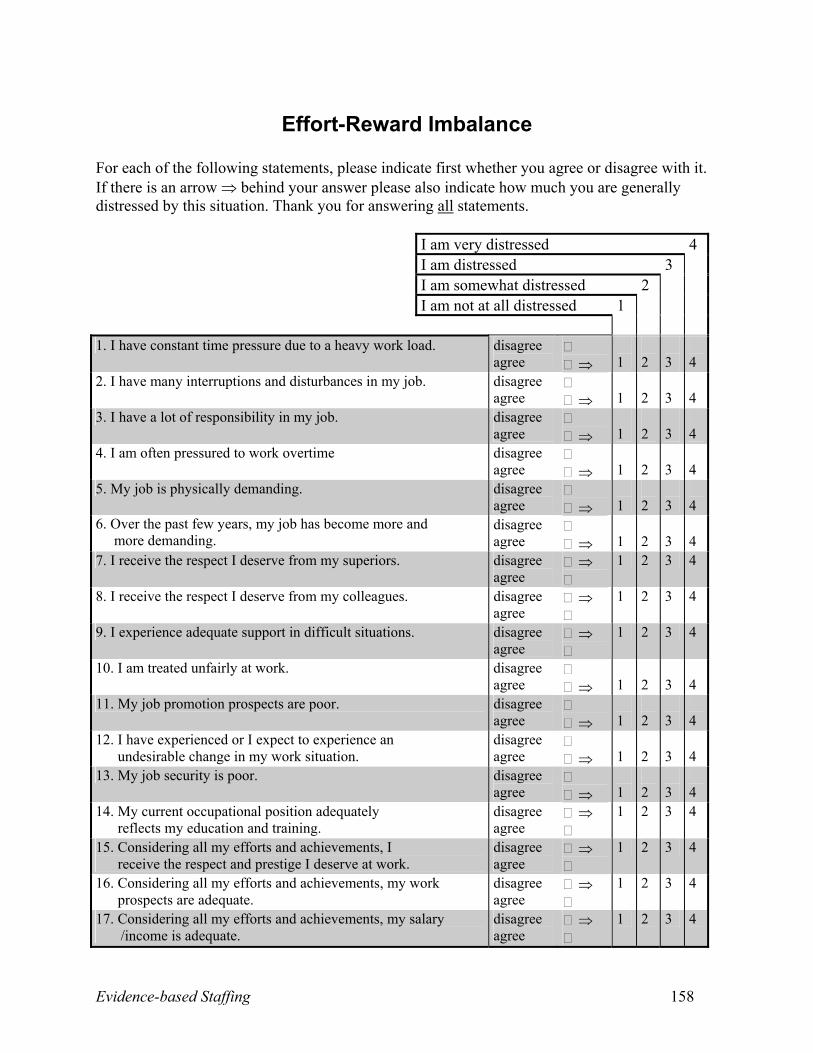
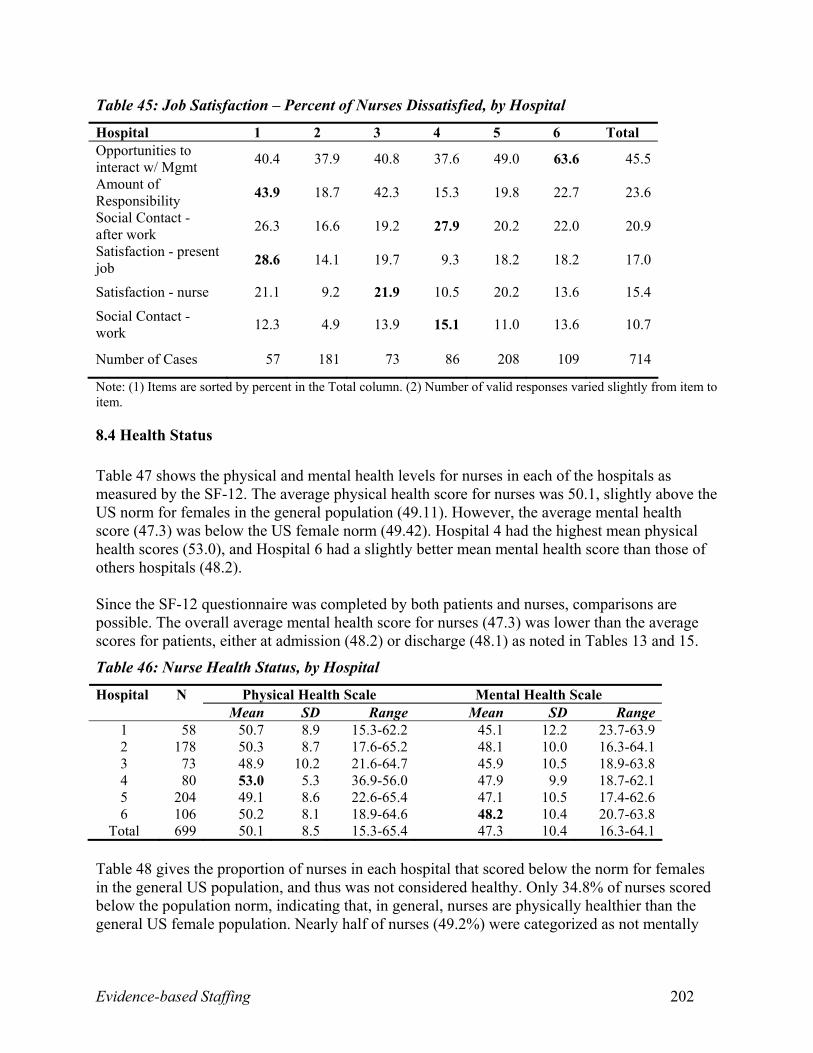
nurses said their work efforts exceeded work rewards. On average, 17.7 percent of nurses were
dissatisfied with work, primarily due to inadequate opportunities to interact with management
(45.5 percent).
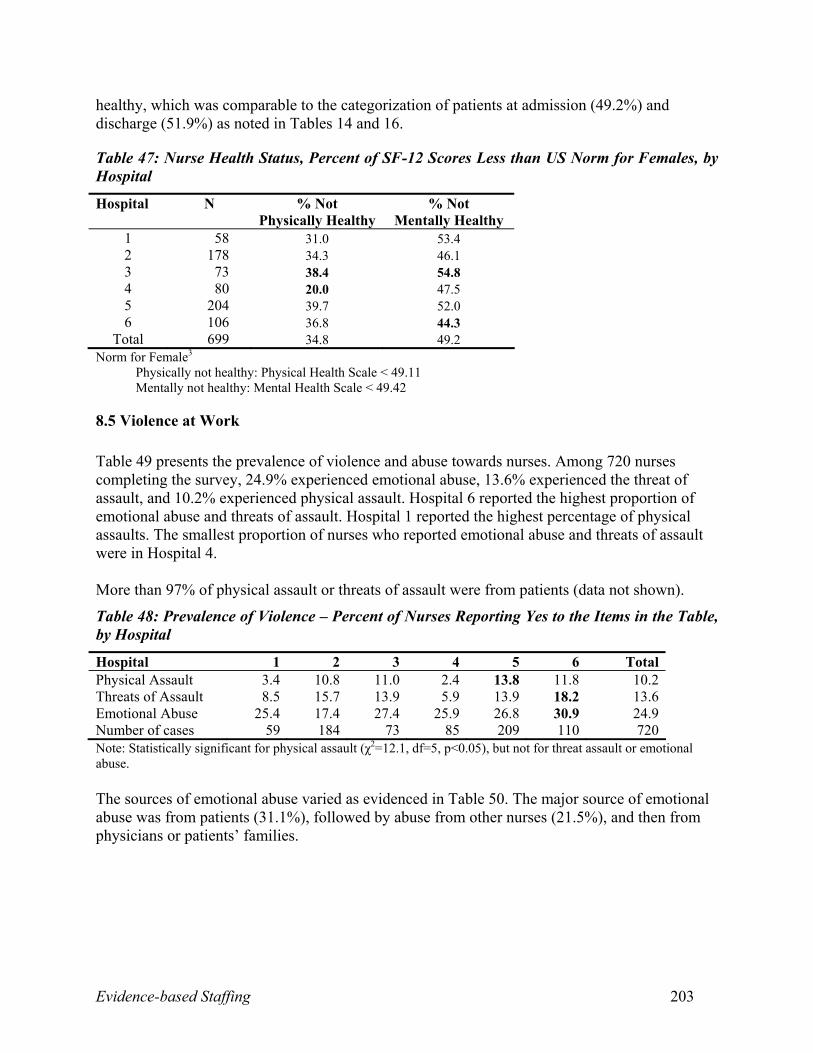
Of the nurse survey respondents, 34.8 percent and 49.2 percent scored below the
standardized American norms for physical and mental health, respectively. During the two weeks
preceding the survey, 32.4 percent of nurses changed their shift time more than once. During the
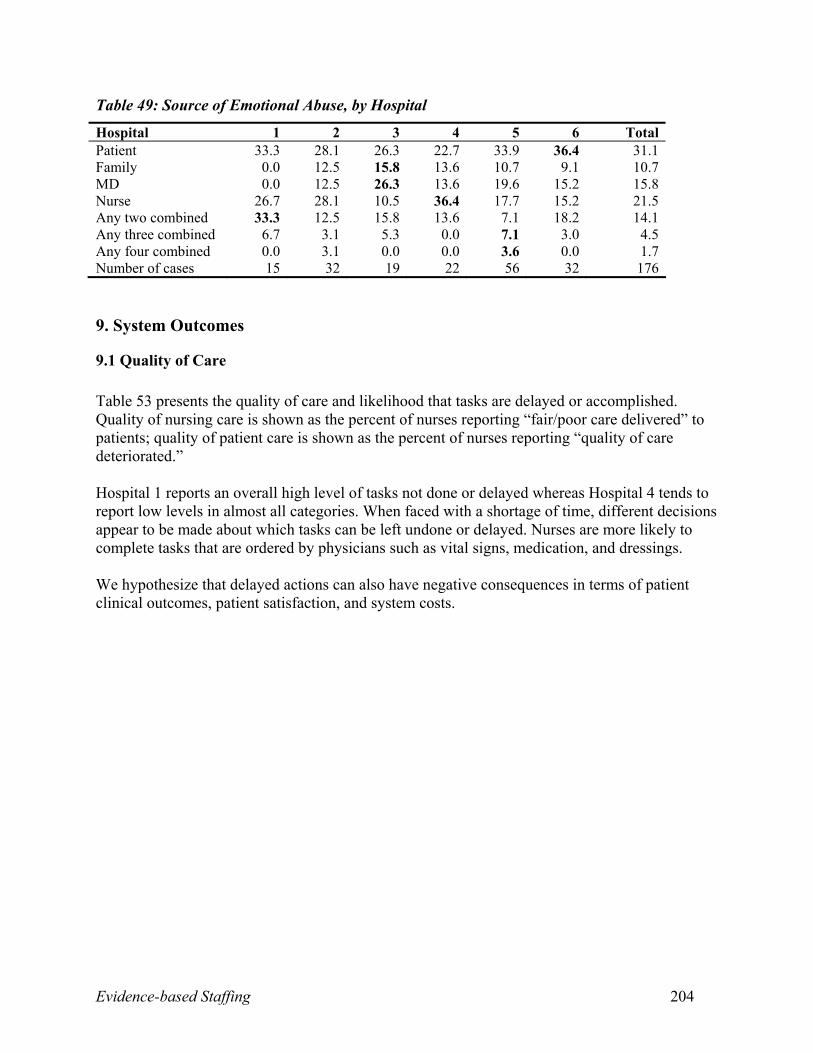
week preceding the survey, nurses experienced emotional abuse (24.9 percent), threat of assault
(13.6 percent), and physical assault (10.2 percent) while at work. The main sources of this
workplace abuse were patients (31.1 percent), other nurses (21.5 percent), physicians (15.8
percent), and families (10.7 percent).
Evidence-based Staffing 21
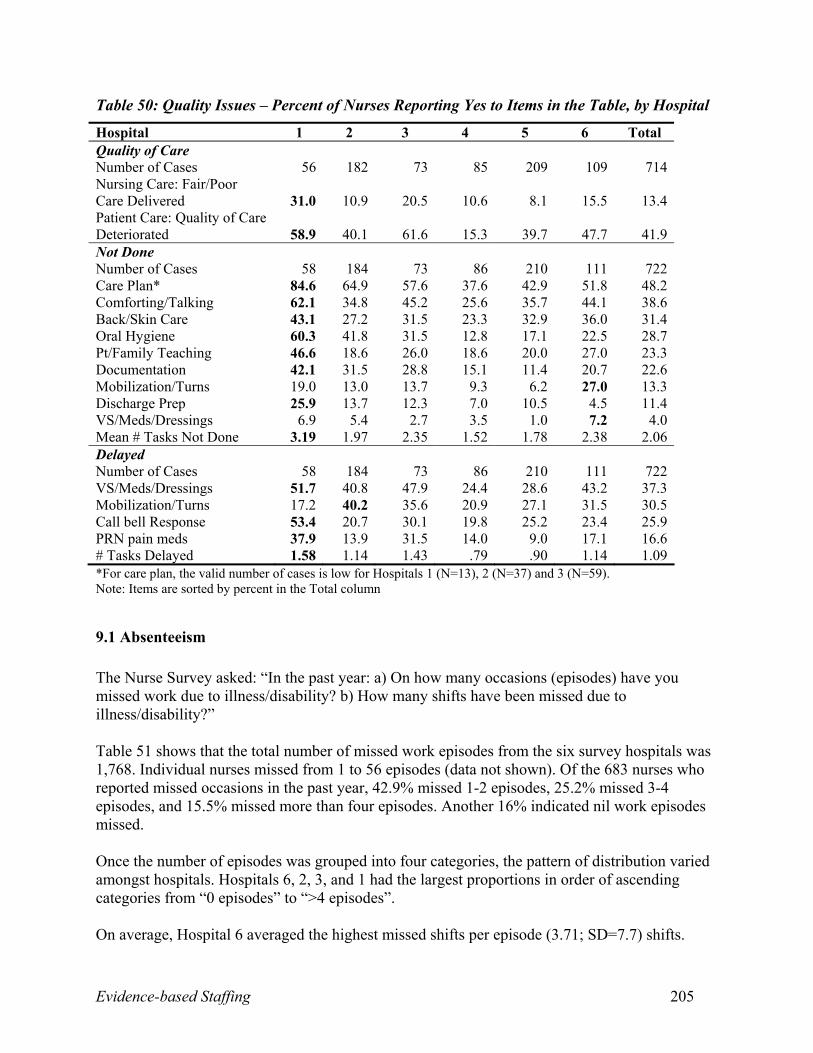
System Outcomes: Nurse ratings of quality of care and omission or delay of patient
interventions comprised the measures of quality of care. Of 714 responses, 13.4 percent of nurses
rated the nursing care quality on the last shift as fair/poor, while 41.9 percent said patient care
quality had deteriorated over the last year. When faced with insufficient time, nurses generally
omitted nursing (as opposed to physician-dependent) interventions. The most frequently omitted
interventions included care planning (48.2 percent), comforting/talking (38.6 percent), back/skin
care (31.4 percent), oral hygiene (28.7 percent), patient/family teaching (23.3 percent), and
documentation (22.6 percent). Delayed interventions included vital signs/medications/dressings
(37.3 percent), mobilization/turns (30.5 percent), call bell response (25.9 percent), and PRN pain
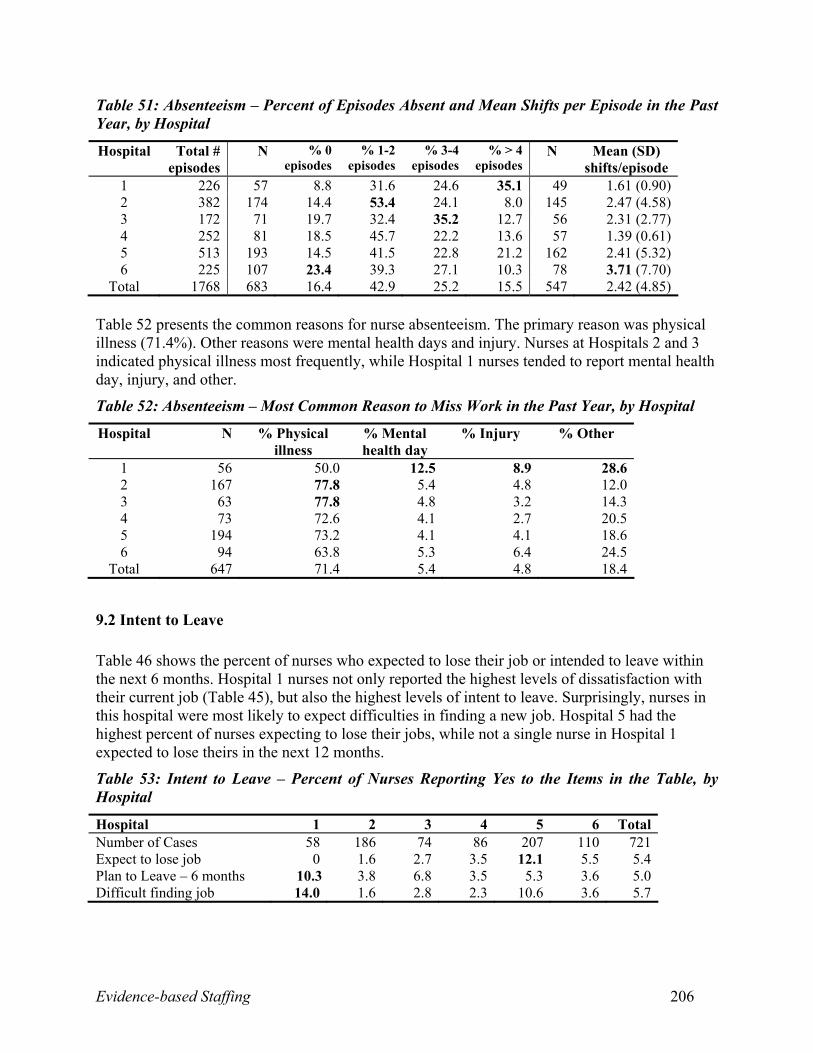
medications (16.6 percent). In total, nurses reported missing 1,768 work episodes in the last year,
with each episode averaging 2.42 shifts. Although 16.4 percent of nurses were never absent,
frequency of missed episodes ranged from one to two (42.9 percent), three to four (25.2 percent),
and greater than four (15.5 percent). Reasons for absenteeism were reported as physical health
(71.4 percent), mental health (5.4 percent), injury (4.8 percent), and other (18.4 percent).Almost
five percent of nurses planned to leave their job in the next year. Only 5.6 percent of nurses
expected to have difficulty in securing a new job if they wanted one.
Research Question 1. To what extent do patient, nurse, system characteristics and behaviours, and environmental
complexity measures explain variation in nursing worked hours and patient, nurse, and system
outcomes, such as length of stay?
Intermediate System Outputs
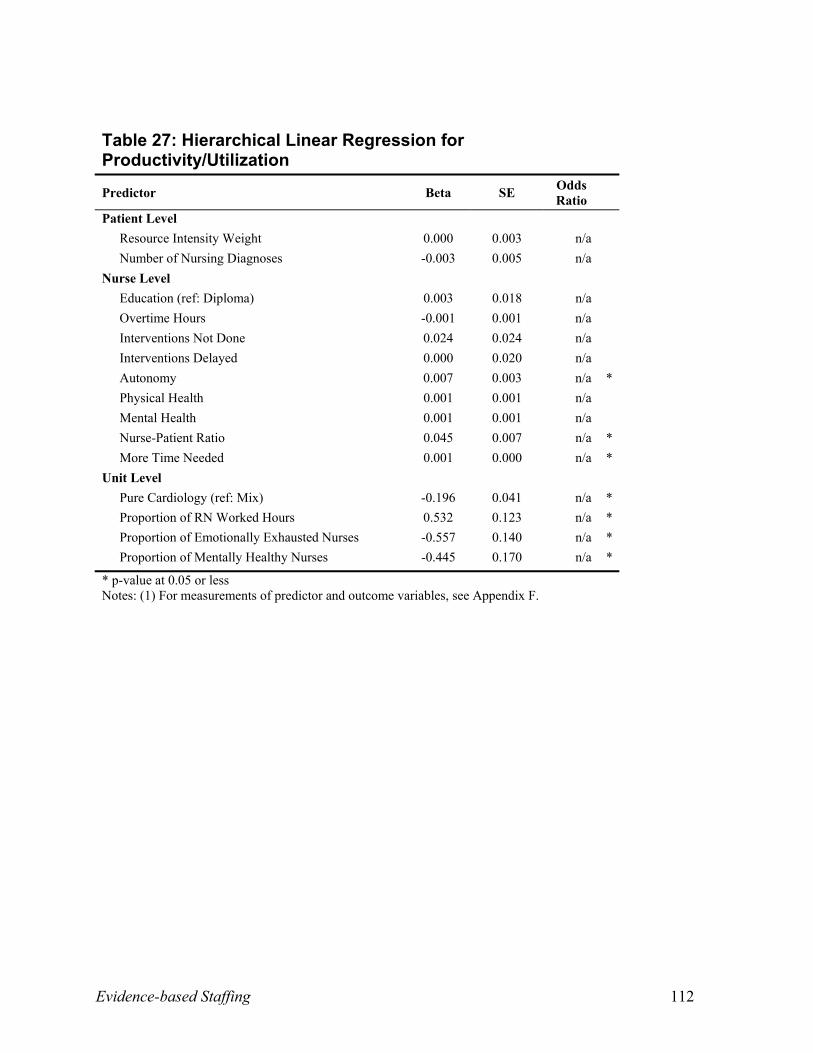
Unit productivity/utilization: As indicated earlier, at 93 percent productivity/utilization,
nurses are working at maximum capacity, and high rates of productivity/utilization on the unit
Evidence-based Staffing 22
directly influence patient outcomes. This analysis identifies the variables associated with higher
and lower productivity/utilization at the unit level. Higher productivity/utilization levels were
more likely when there were more nursing worked hours on the unit, higher nurse-to-patient
ratios, higher nurse autonomy, and when nurses required more time to complete the work as
specified by the patient care plan. Productivity/Utilization was more likely to be lower when
units were specialized (such as units that only service patients with cardiology conditions) and
where a higher proportion of nurses on the unit were emotionally exhausted or mentally healthy.
When nurses are emotionally exhausted they may not be able to work at the same level of
productivity/utilization than when they are not. Nurses who are mentally healthy may be inclined
to say no to unrealistic work expectations.
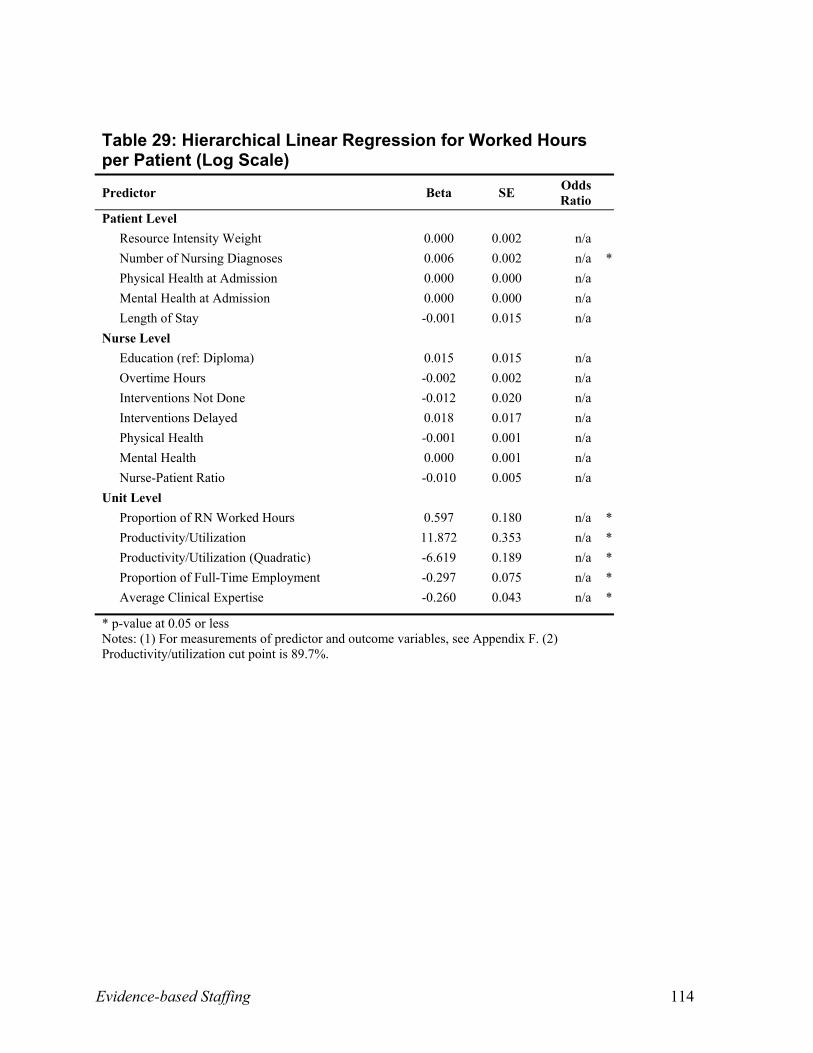
Actual Worked Hours per Patient: The actual worked hours per patient were likely to
increase with a higher proportion of nursing worked hours on the unit and when patients had
more nursing diagnoses. Increases in worked hours per patient were associated with increases in
unit productivity/utilization up to the cut-off point of 90 percent. Units with more clinical
expertise or with a higher proportion of full-time nurses were more likely to provide fewer hours
of patient care.
Patient Outcomes
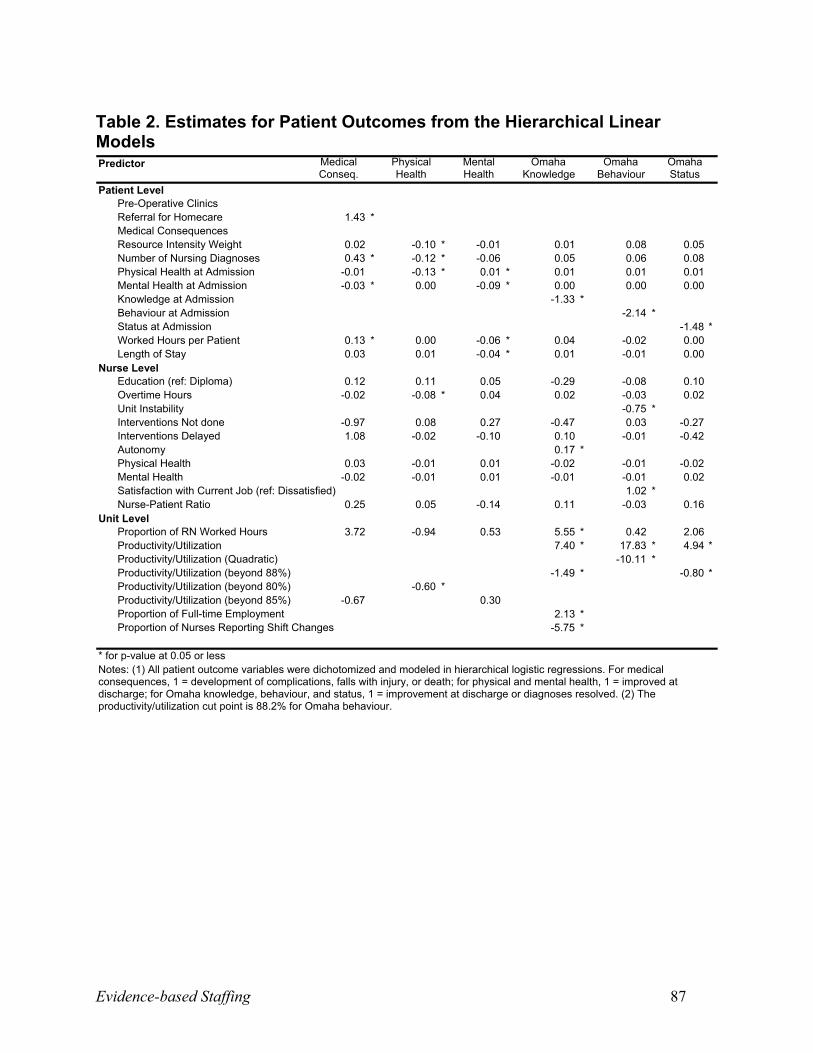
Tables 2 to 19 (Appendix C) display the variables modeled in relation to patient health and
safety outcomes.
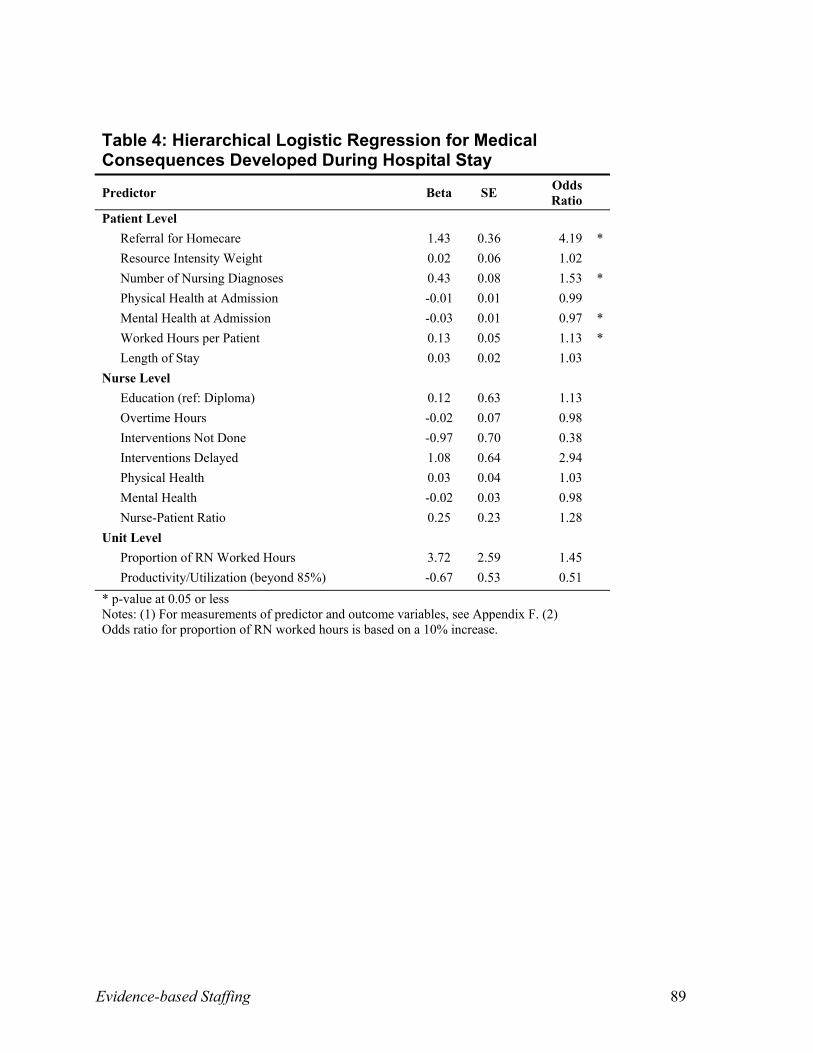
Medical Consequences: Since there were so few medical consequences of any one type, all
types of consequences were summed into one category. In this analysis, the factors associated
with the presence or absence of any medical consequences during a patient’s stay were
examined. As patients experienced greater numbers of nursing diagnoses, reflecting more
Evidence-based Staffing 23
complex nursing needs, they were more likely to suffer medical consequences. Medical
consequences were 53 percent more likely for each additional nursing diagnosis. In contrast,
patients with better mental health at admission were less likely to have medical consequences.
Patients who experienced medical consequences were more likely to require greater actual
worked hours of nursing care during their stay and 319 percent more likely to be referred to
homecare for follow-up after discharge, resulting in additional expense to the health system.
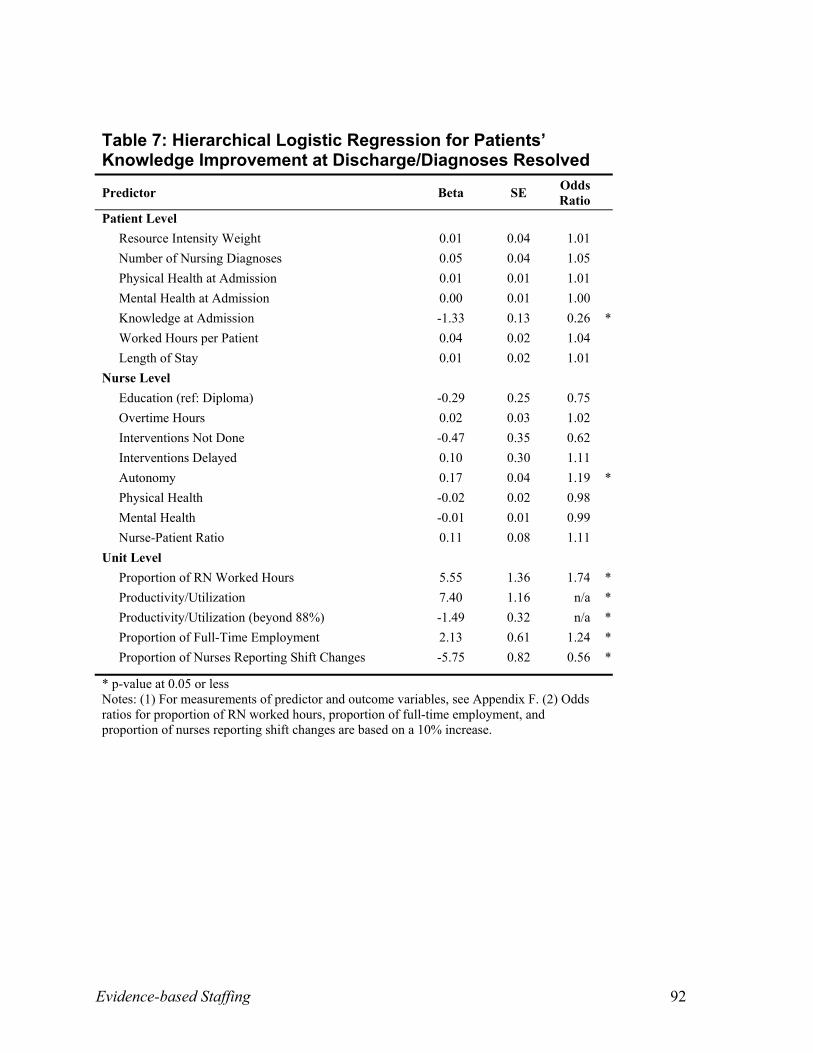
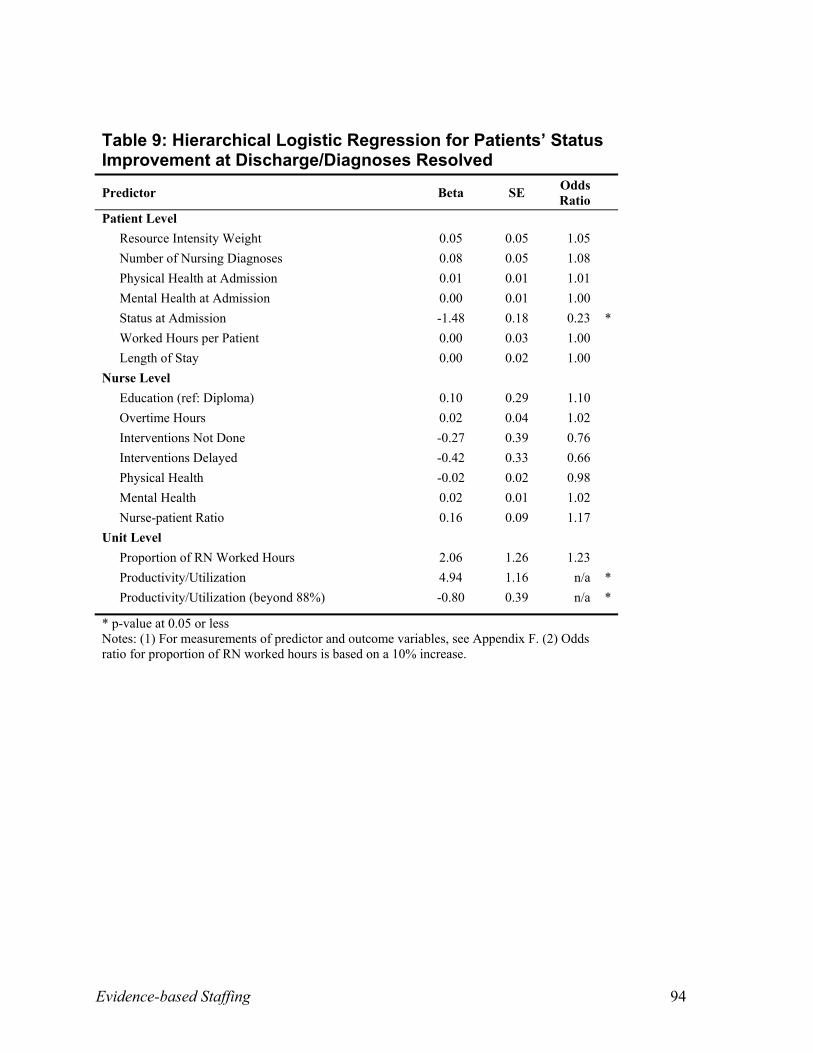
OMAHA Knowledge, Behaviour, and Status at Discharge. Helping patients understand the
cause and course of their conditions is seen to improve the overall health of patients. A ceiling
effect was observed among the OMAHA knowledge, behaviour, and status scores, in that
patients with higher scores at admission were less likely to demonstrate improvements in these
scores at discharge (because there was less room for improvement). Improved patient knowledge
scores at discharge were 74 percent more likely for every 10 percent increase in nursing worked
hours on the unit and 24 percent more likely for every 10 percent increase in full-time nurses on
the unit. When patients were cared for by nurses who reported higher autonomy in their jobs,
they were more likely to show increases in knowledge about their condition at discharge.
However, patient knowledge was 44 percent less likely to improve for every 10 percent increase
in the proportion of nurses who had at least one shift change in the last two weeks.
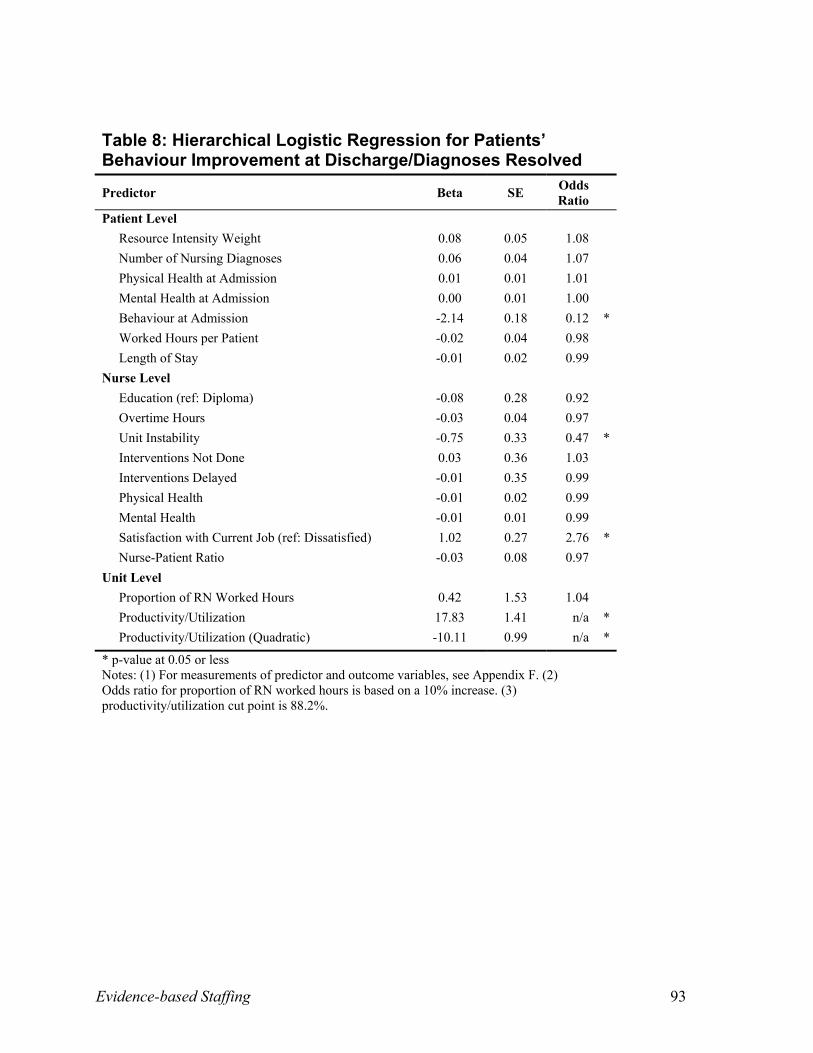
Helping patients understand which behaviours they need to change in order to improve their
health status is another important role function of the nurse. When cared for by nurses who were
very satisfied with their work, patients were 176 percent more likely to demonstrate
improvements in their behaviour scores at discharge. Conversely, patients cared for by nurses
with concerns about job security were 53 percent less likely to demonstrate improved behaviour
Evidence-based Staffing 24
scores at discharge. Productivity/Utilization levels below 88.2 percent were associated with
increased possibility of improvements in patients’ behaviour scores at discharge.
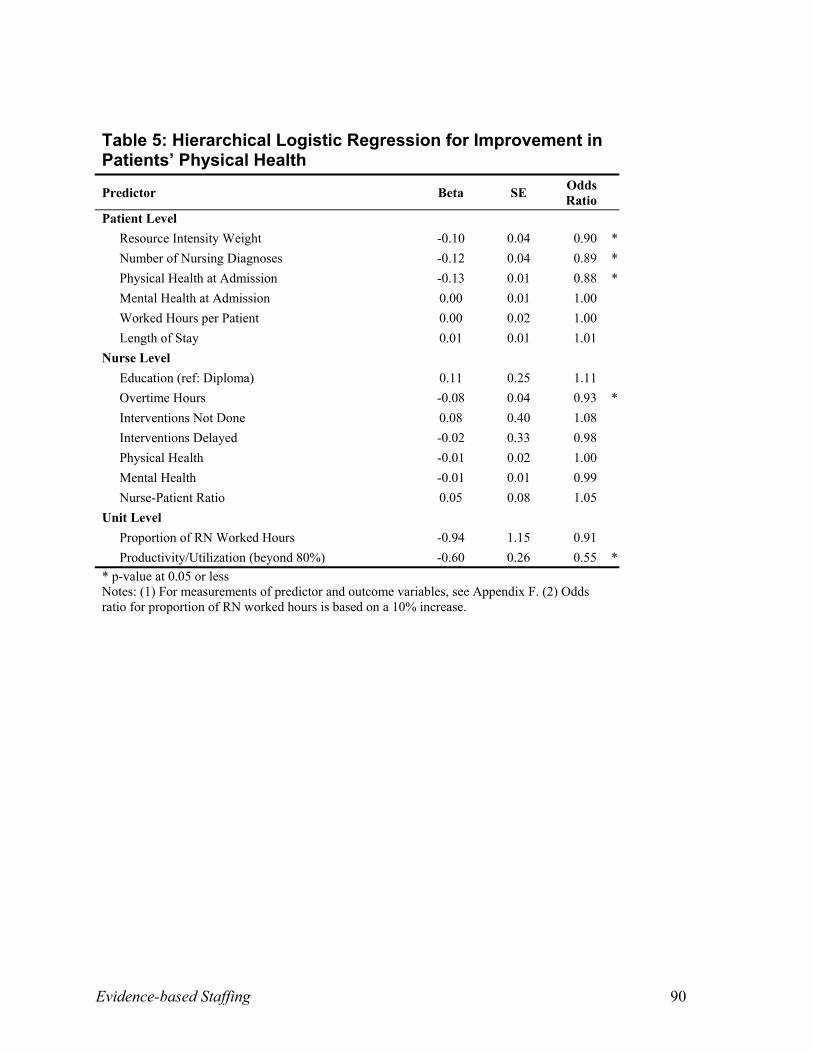
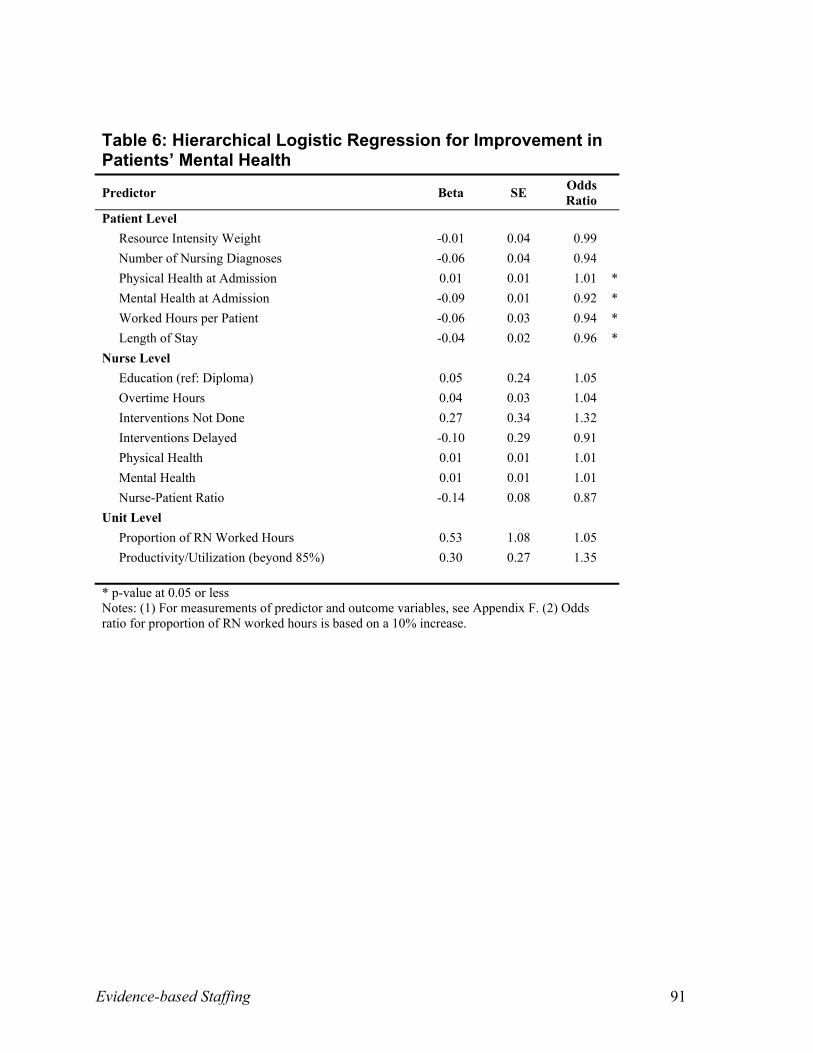
SF-12 Health Status at Discharge: As with the OMAHA scores, patients with higher
physical and mental health scores at admission were less likely to see improvements in these
scores at discharge. Improvement in patients’ physical health status at discharge was less likely
for patients with higher resource intensity weights and for patients with more nursing diagnosis.
These two factors reflect the medical acuity and nursing complexity of patients’ needs for
nursing care. Patient physical health scores were 45 percent less likely to improve when unit
productivity/utilization exceeded 80 percent and were seven percent less likely to improve for
each additional hour of nurse overtime. However, patients who scored higher in physical health
status at admission were more likely to have improvements in mental health status at discharge.
Patients who stayed longer in hospital were less likely to show improvements in mental health
status scores at discharge. More hours of care were likely to be used if patient mental health was
not improved at discharge.
Nurse Outcomes
Although improving patient outcomes and reducing the risk of medical consequences are
goals of healthcare, achievement of these goals may sometimes occur at the expense of nurse
health and safety. In order to retain and recruit nurses — senior and experienced nurses in
particular — understanding which factors influence nurse outcomes is pivotal. Ten nurse
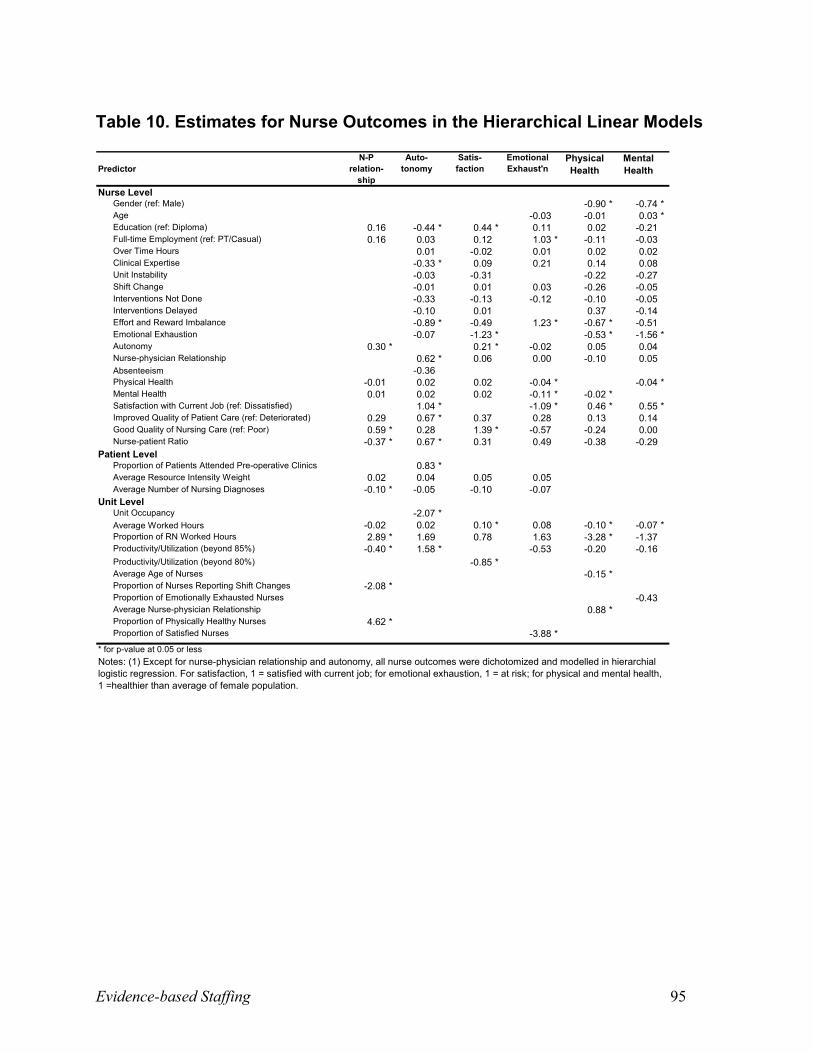
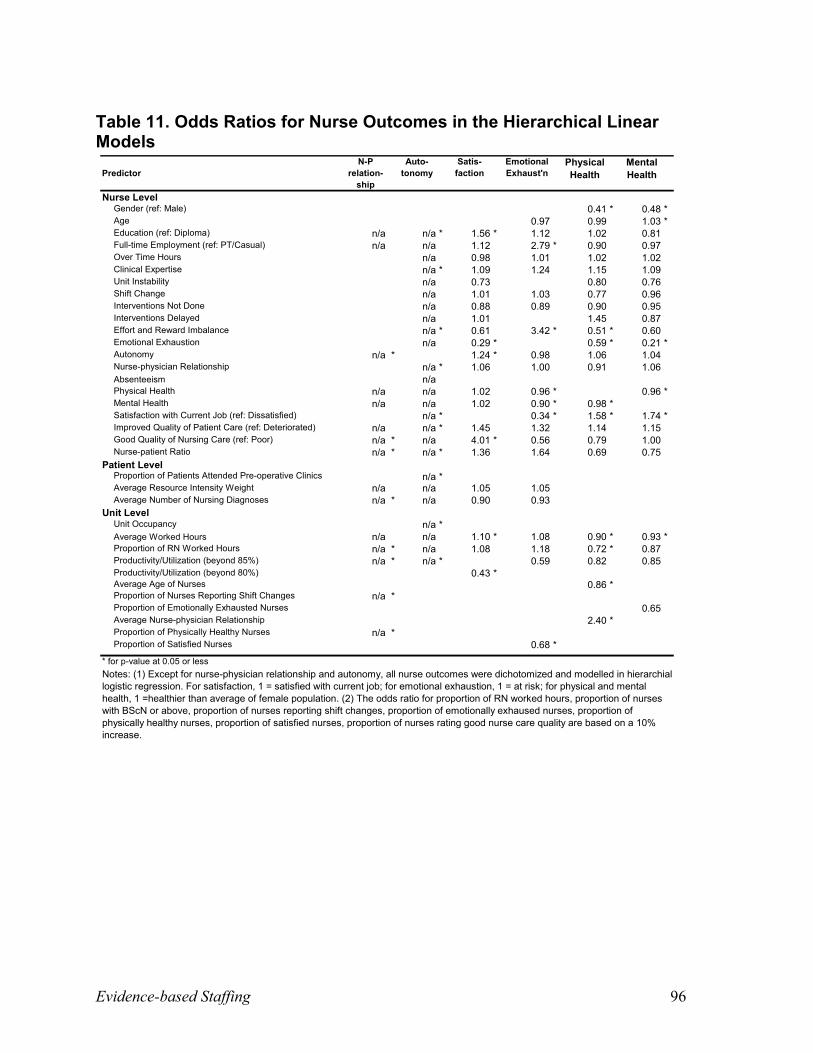
outcome variables derived from the literature were subsequently used in this analysis. Tables 10
to 19 (Appendix C) display the variables modeled in relation to nurse outcomes.
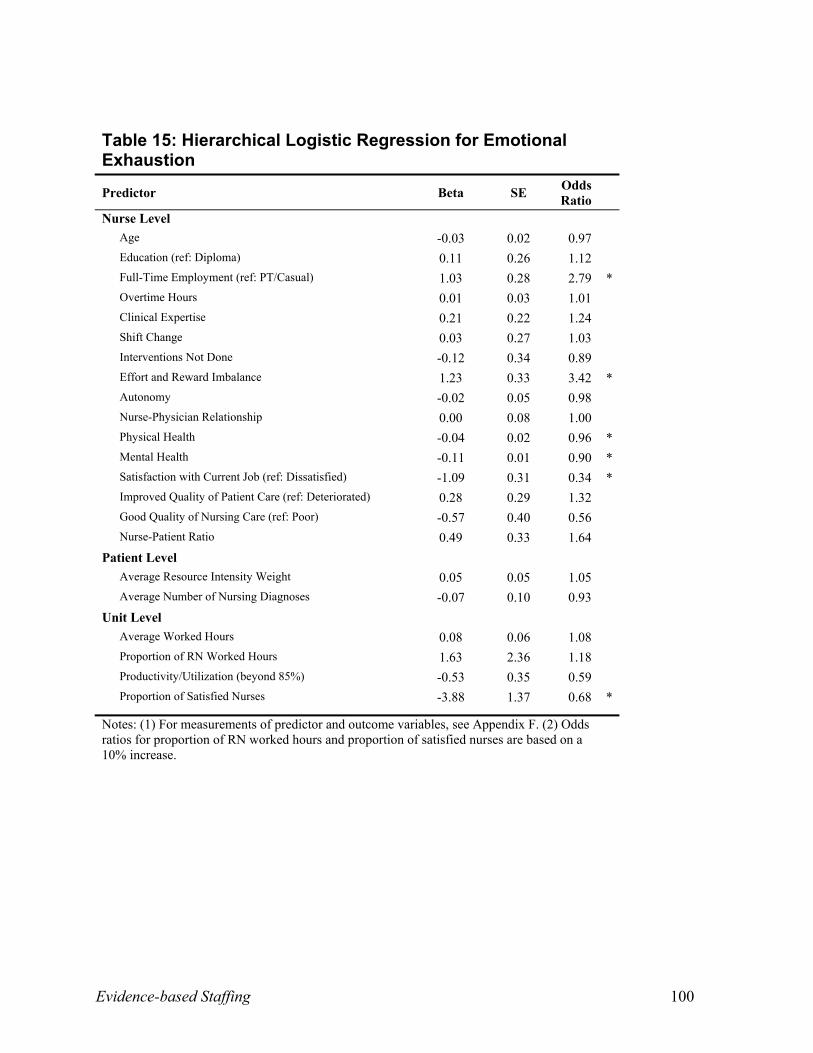
Emotional Exhaustion: Physically and mentally healthy nurses were less likely to experience
emotional exhaustion (burnout). The likelihood of emotional exhaustion increased by 242
Evidence-based Staffing 25
percent when nurses were at risk of an effort and reward imbalance and by 179 percent when
nurses worked full-time. Nurses were 32 percent less likely to suffer high emotional exhaustion
for every 10 percent increase in the proportion of satisfied nurses on units.
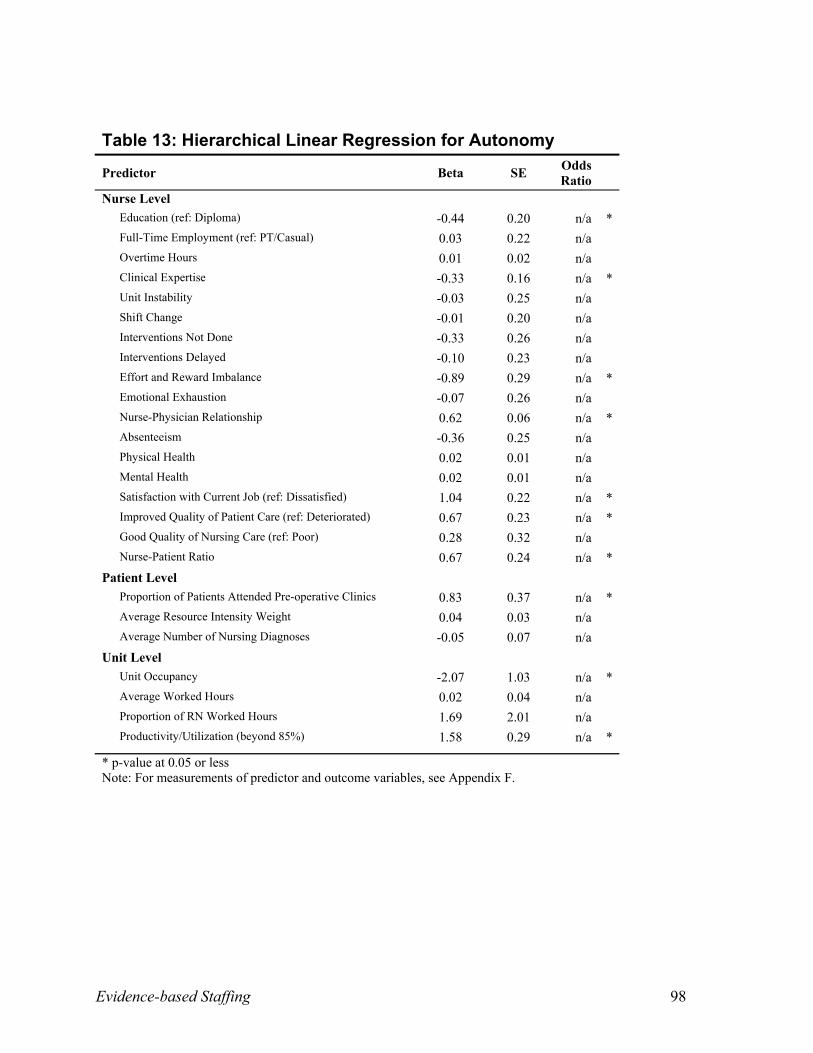
Autonomy: Nurses reported higher autonomy in practice when they reported stronger
relationships with physicians, were more satisfied with their job, or said the quality of patient
care improved over the last year. Autonomy was also higher when patients had attended a pre-
operative clinic and when the nurse-patient ratio was high. As unit productivity/utilization
exceeded 85 percent, nurses reported more autonomy, possibly since nurses have to make
decisions on their own under such circumstances. However, lower autonomy scores were
reported by degree-prepared nurses and by nurses who rated themselves as expert clinicians,
perhaps due to organizational constraints imposed on their practice. When occupancy is high on
the unit or when nurses were at risk of an effort and reward imbalance, autonomy was likely to
be lower.
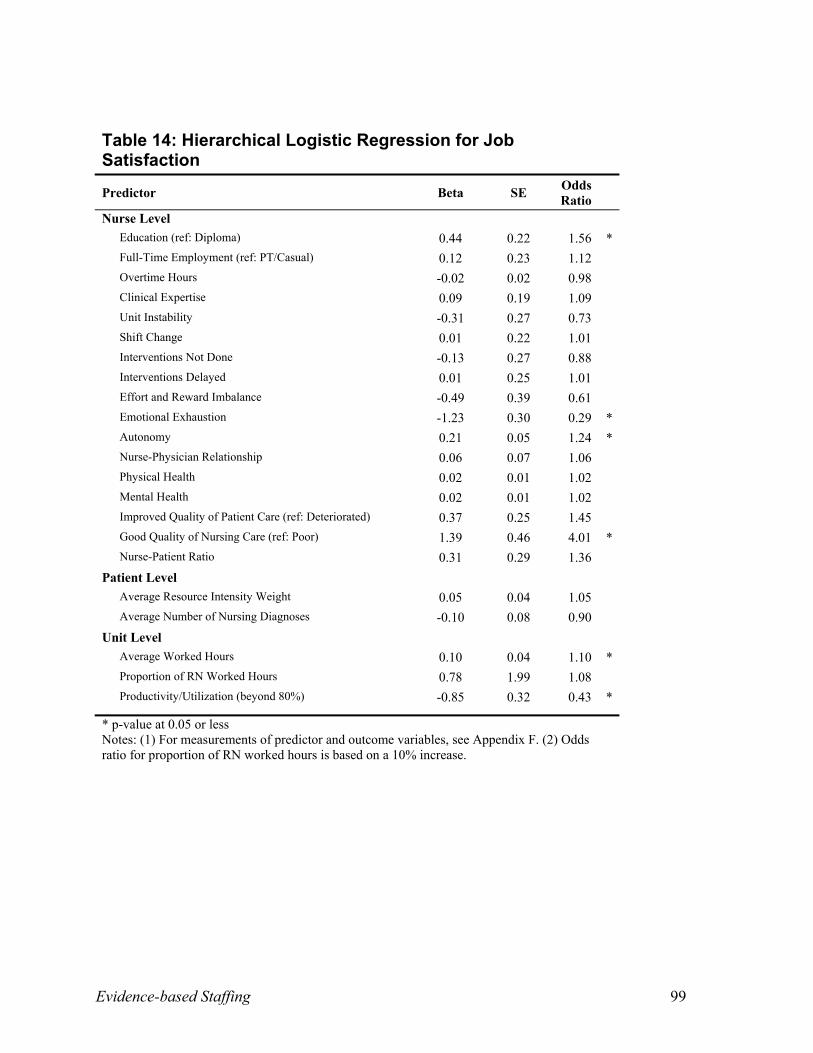
Job Satisfaction: Nurses who were at risk for emotional exhaustion were 71 percent less
likely to be satisfied with their jobs, and when unit productivity/utilization levels were higher
than 80 percent, nursing staff were 57 percent less likely to be satisfied. Nurse satisfaction was
301 percent more likely when nurses rated the nursing care given on the last shift as
good/excellent and 56 percent more likely among degree-prepared nurses. As the average hours
available for care on the unit increased and when nurses’ autonomy increased, so did nurses’
satisfaction.
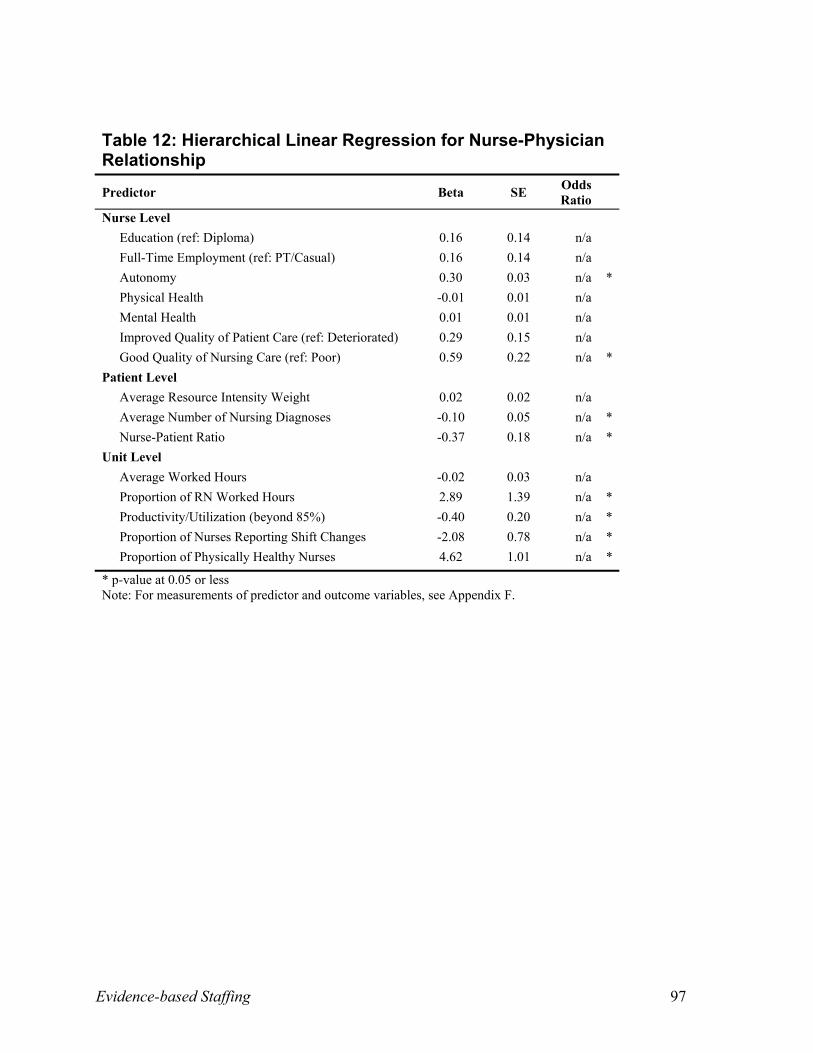
Nurse-Physician Relationships: On units with higher proportions of physically healthy nurses
and of nursing worked hours, nurses were more likely to have better relationships with
physicians. Nurses who perceived their practice to be more autonomous and those who rated the
Evidence-based Staffing 26
quality of nursing care on the last shift as good/excellent were also more likely to have better
relationships with physicians. However, nurse-physician relationships tended to deteriorate when
there was a higher proportion of nurses with frequent shift changes on the unit and as nurses took
on more patients in their daily assignment or care for patients with more nursing diagnoses.
Deteriorated relationships were also more likely as unit productivity/utilization levels exceeded
85 percent.
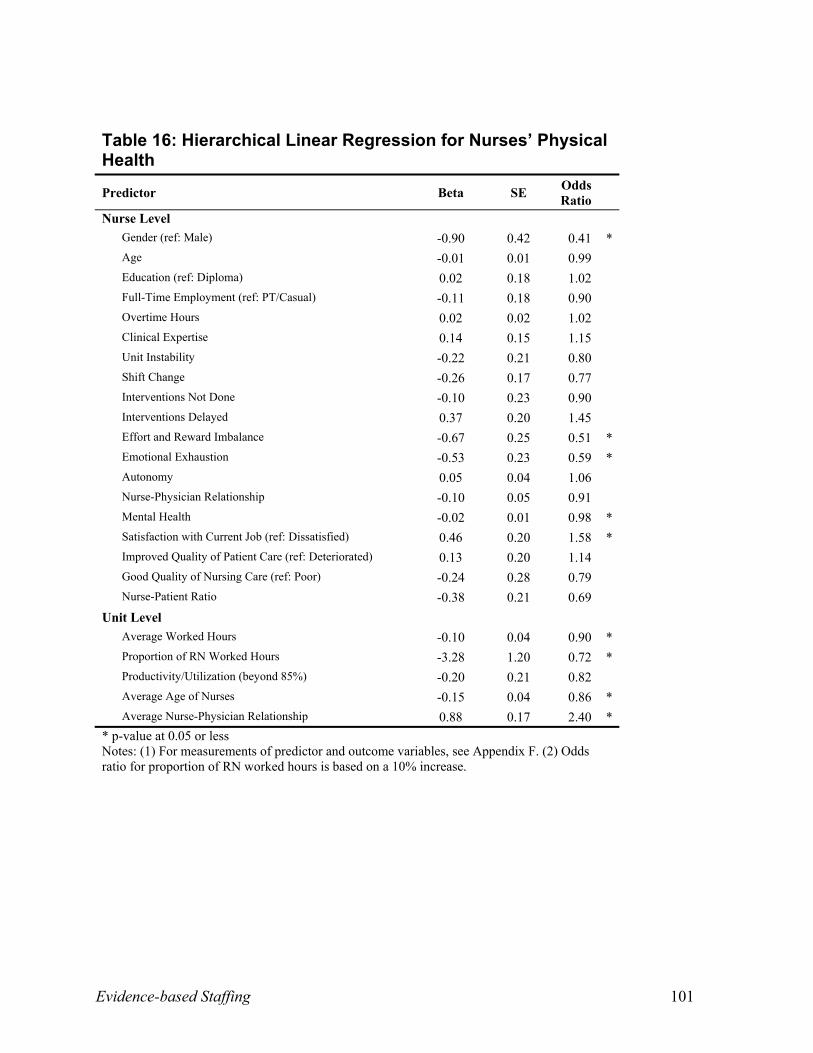
SF-12 Health Status: Higher physical health status scores were 59 percent less likely for
female nurses; 49 percent less likely when nurses were at risk for an effort and reward
imbalance; and 41 percent less likely for nurses at risk of emotional exhaustion. In contrast,
nurses were more likely to be physically healthy when stronger nurse-physician relationships
were reported on the unit and as the average worked hours available for care on the unit
decreased. The likelihood of being physically healthy increased by 58 percent when nurses were
satisfied with their job, and decreased by 28 percent for every 10 percent increase in nursing
worked hours probably because increased nursing hours came from the same nurses worked on
the unit rather than from new hired nurses.
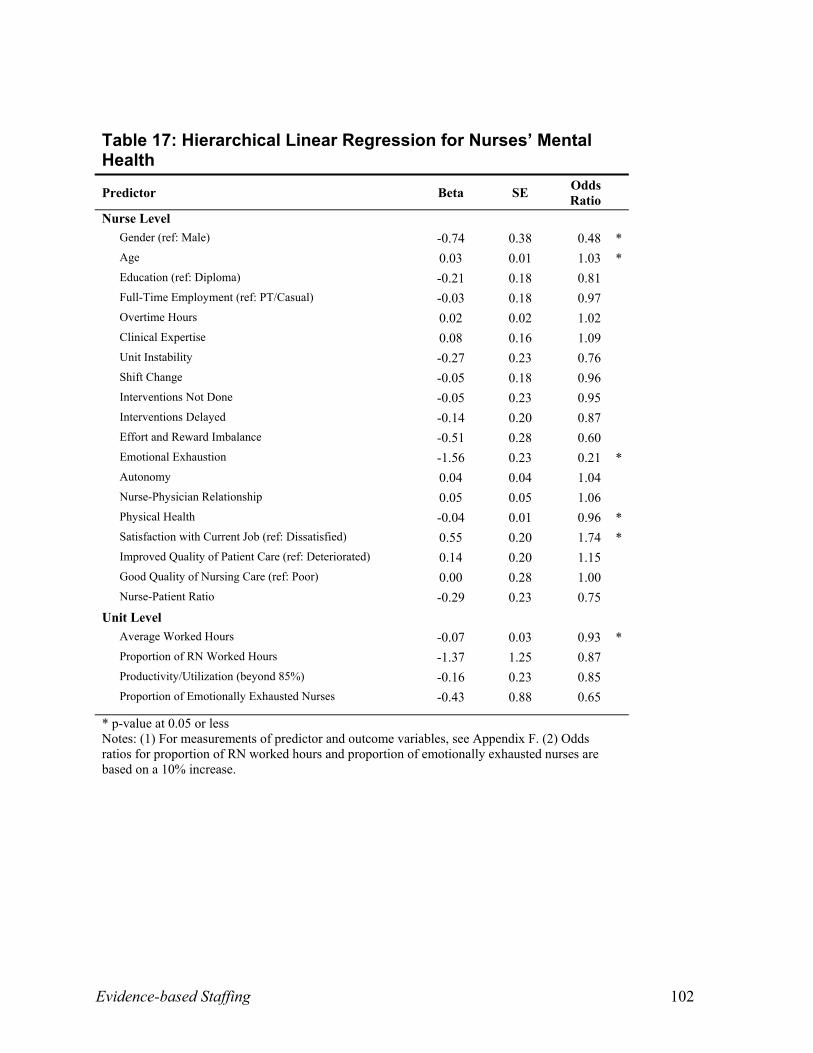
Female nurses were 52 percent less likely to be mentally healthy than male nurses, and older
nurses reported better mental health. Nurses with one point increases in their physical health
scores were four percent less likely to be mentally healthy. Nurses were less likely to be mentally
healthy when they were at risk of emotional exhaustion and as the average worked hours on the
unit increased. The likelihood of being mentally healthy increased by 74 percent when nurses
were satisfied with their current job and decreased by 79 percent when nurses were at risk of
emotional exhaustion.
Evidence-based Staffing 27
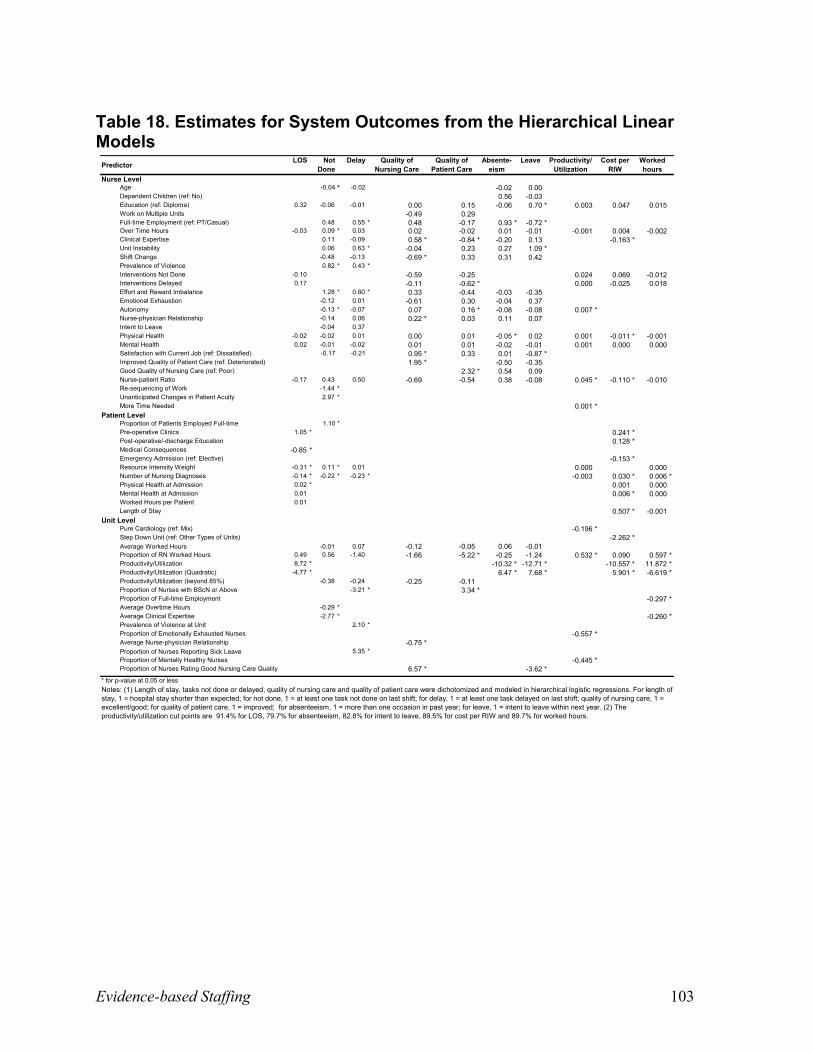
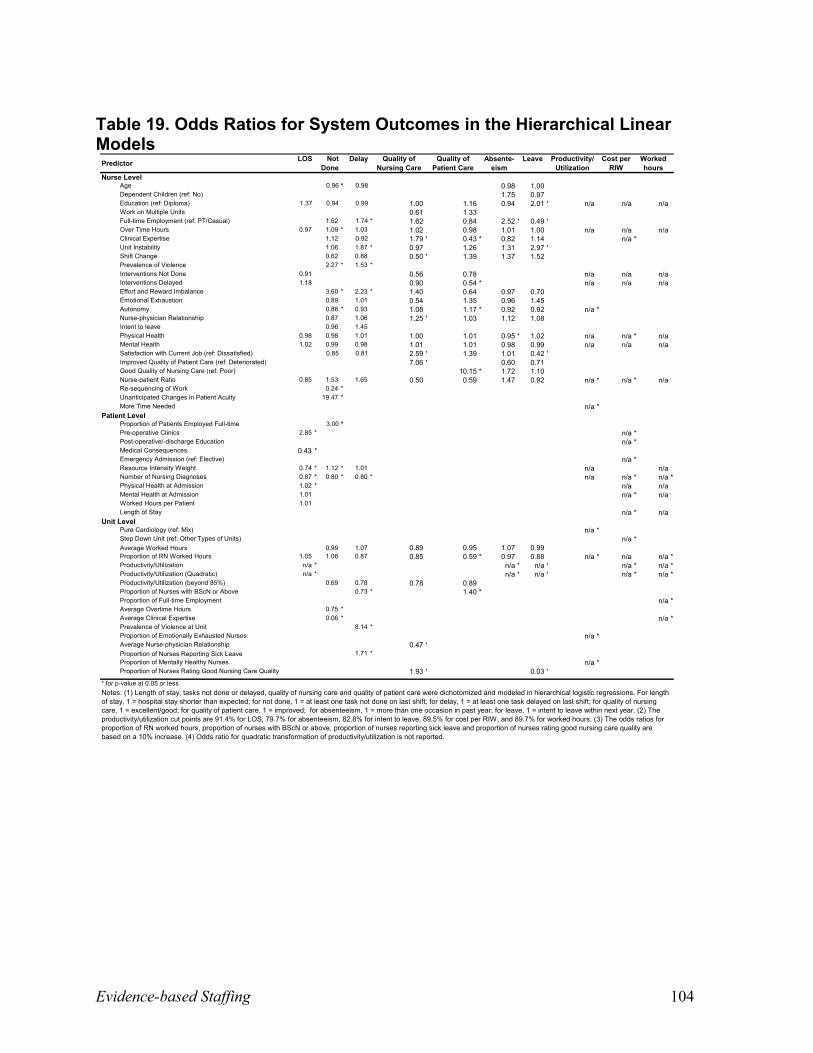
System Outcomes
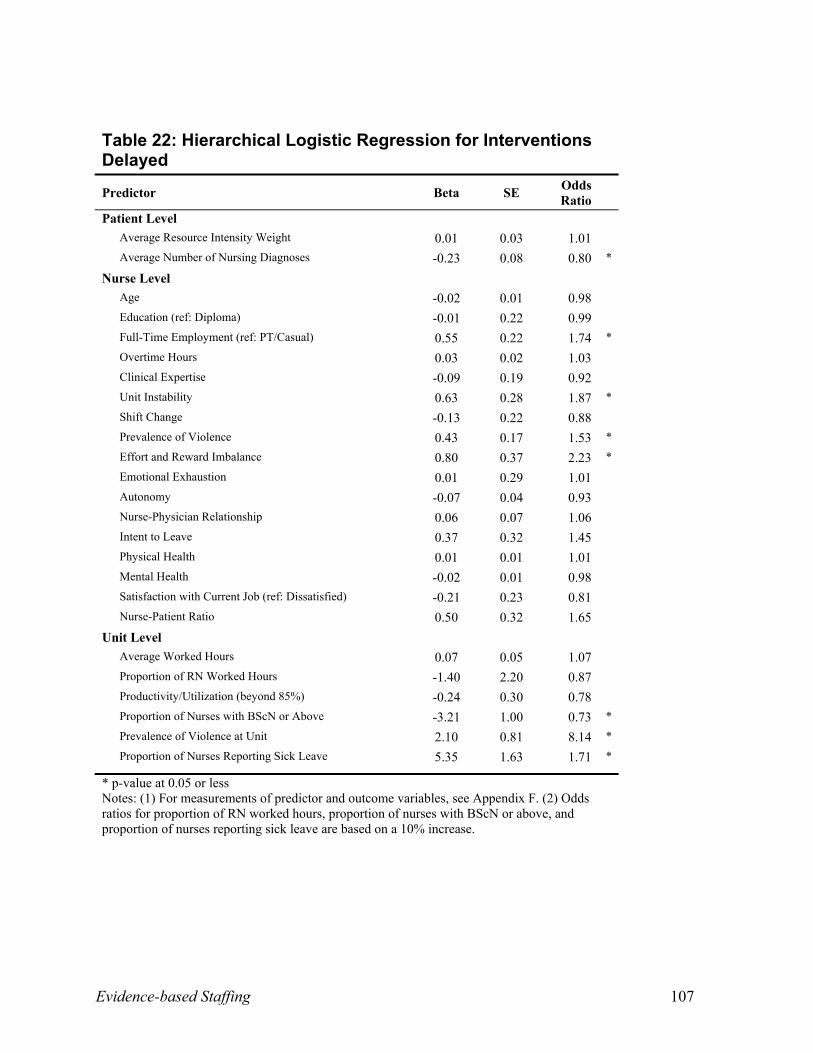
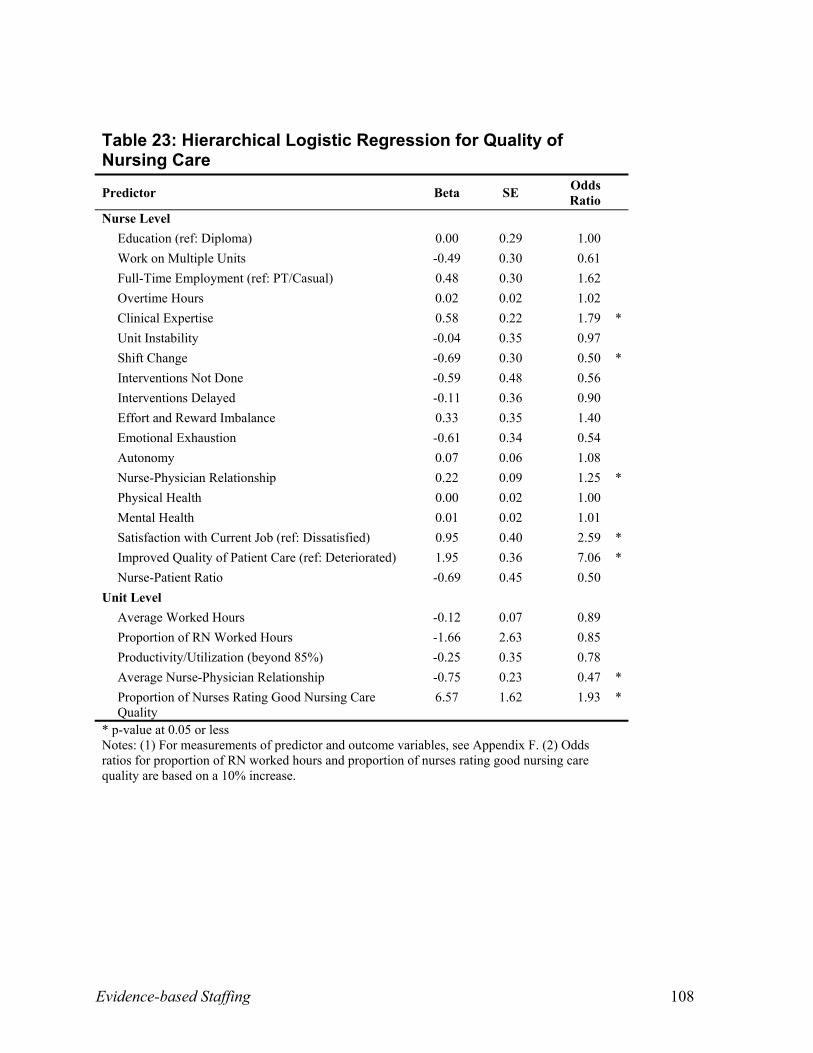
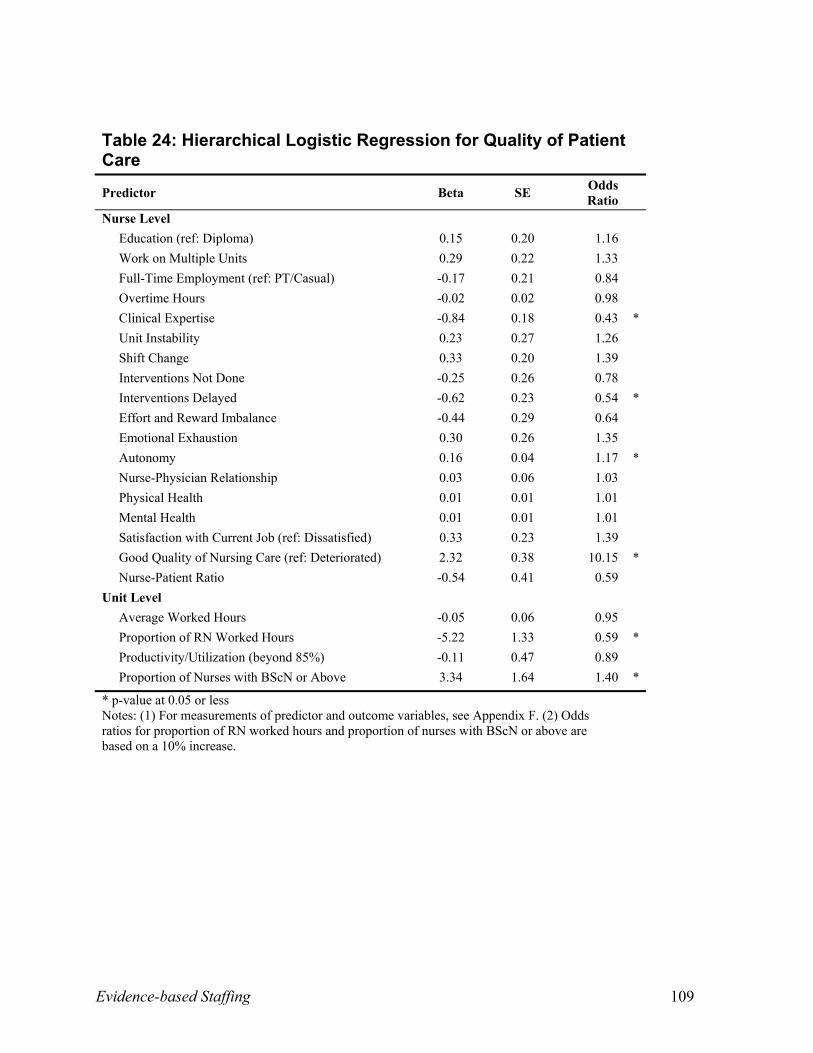
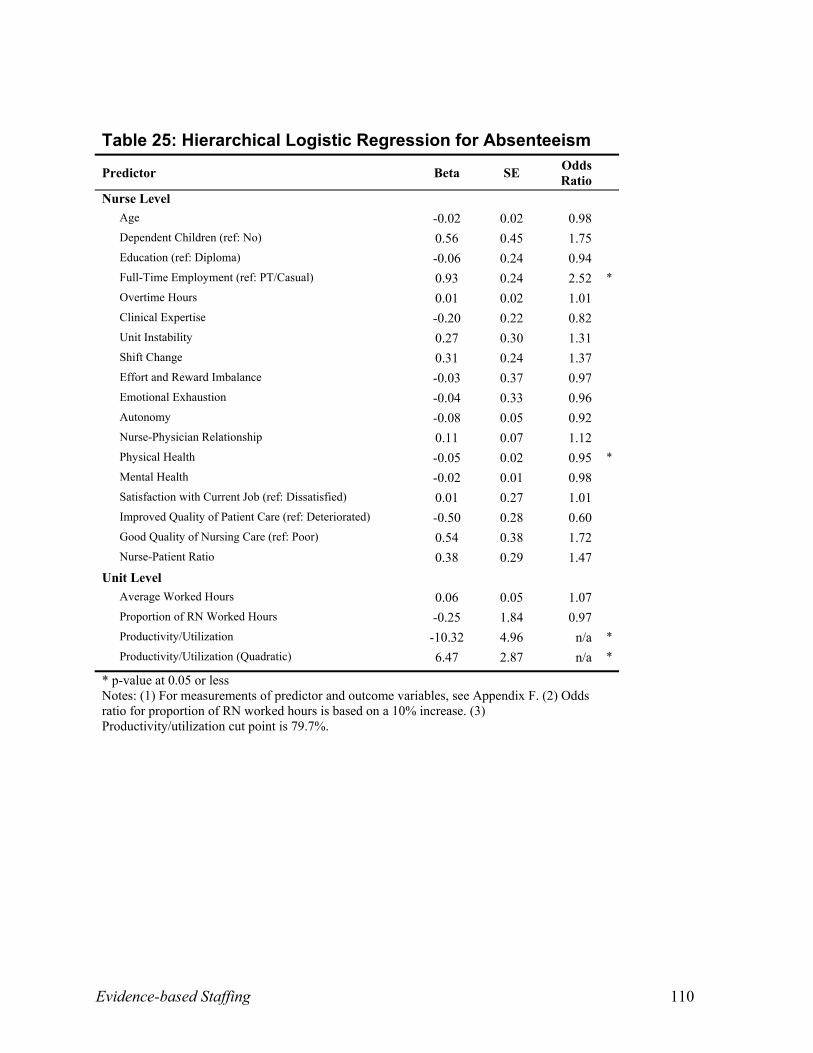
Tables 20 to 29 (Appendix C) display the variables modeled in relation to system outcomes.
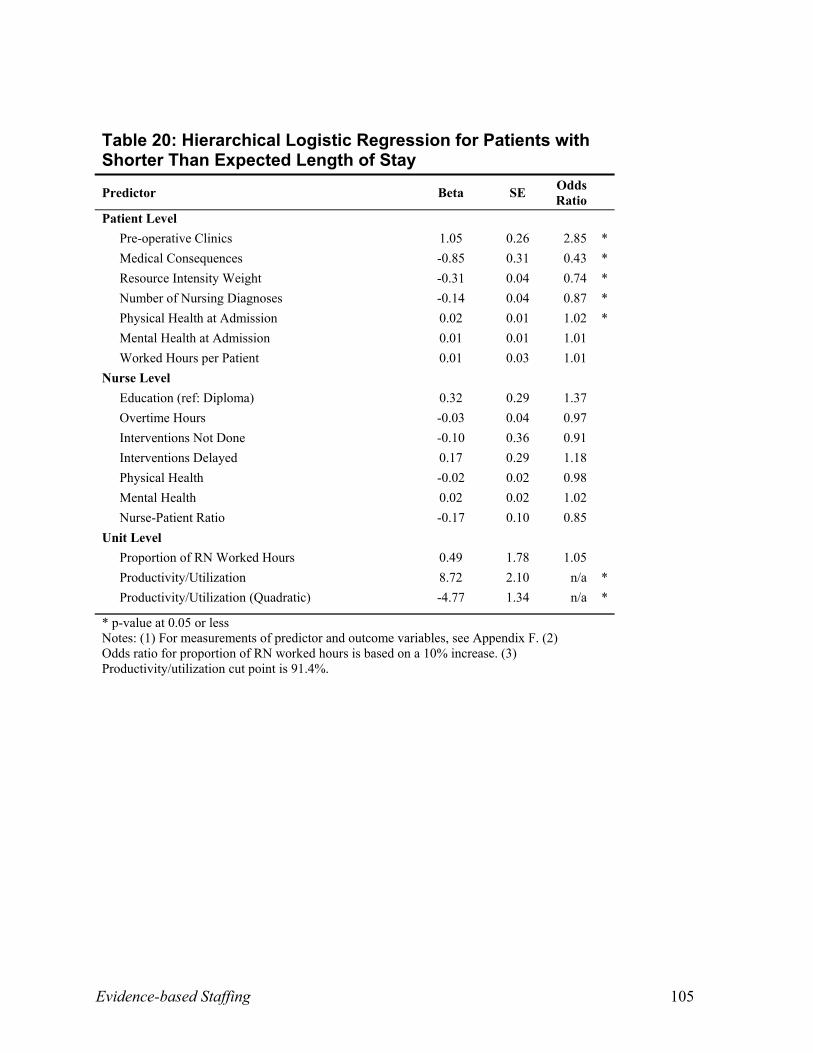
Length of Stay: Patients in units where the productivity/utilization of the unit exceeded 91
percent were more likely to have longer-than-expected lengths of stay. Patients with more
nursing diagnoses and with higher resource intensity weights, reflecting greater medical acuity,
were also more likely to have longer lengths of stay. Shorter-than-expected lengths of stay were
two percent and 185 percent more likely for patients whose physical health status scores were
one point higher at admission and for those who attended a pre-operative clinic, respectively.
Shorter-than-expected length of stay was 57 percent less likely when patients experienced
medical consequences and 13 percent less likely for each additional nursing diagnosis.
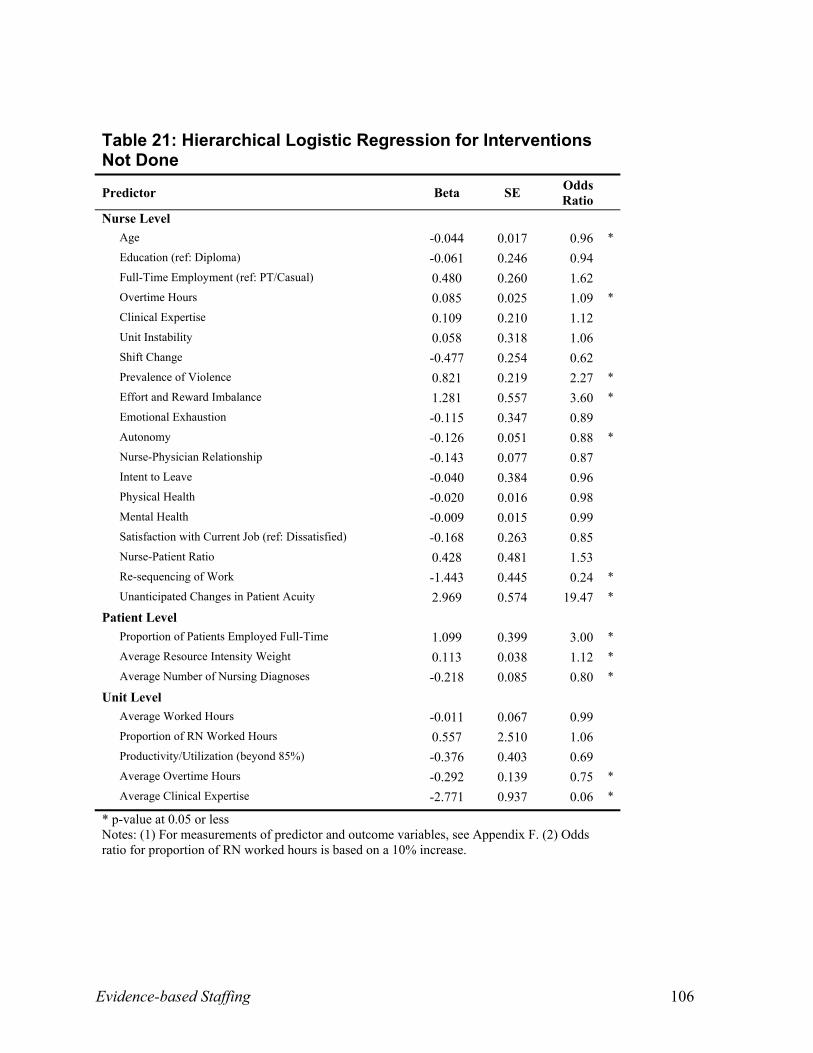
Interventions Not Done or Delayed: Older, experienced nurses were less likely to have
interventions not completed at the end of their shift. The likelihood of interventions not being
completed increased by 260 percent when nurses were at risk for an effort-reward imbalance.
The more often patients had unanticipated changes in acuity, the more often interventions were
left undone. The more frequently violence was experienced by individual nurses and the higher
the medical complexity (as indicated by the resource intensity weight), the more likely
interventions were not completed. The greater the number of nursing diagnoses, the less likely
interventions were not completed. The likelihood of interventions being left undone was reduced
as units hired nurses with more clinical expertise and reduced for units that increased average
overtime. Interventions not completed were 12 percent less likely with every one point increase
in the ratings of nurse autonomy. The more nurses re-sequenced their activities in response to
demands from others, the less often interventions were left undone.
Evidence-based Staffing 28
Delayed interventions were 74 percent more likely when nurses worked full-time, 87 percent
more likely when nurses had concerns about job security, and 123 percent more likely when
nurses were at risk of an effort and reward imbalance. Interventions were 27% less likely to be
delayed for every 10% increase in the proportion of degree-prepared nurses on the unit. More
complex patients with increasing numbers of nursing diagnoses were less likely to experience
delays in receiving interventions. However, when individual nurses experienced violence or
where the average level of violence was high on a unit, interventions were more likely to be
delayed. Interventions were 71 percent more likely to be delayed for every 10 percent increase in
absenteeism at the unit level.
Quality of Patient Care Over the Past Year: When nurses rated themselves as expert
clinicians, they were less likely to rate the quality of patient care on the unit as improved.
Likewise, when interventions were delayed, nurses were 46 percent less likely to report
improvements in the quality of patient care. The likelihood of improved nurse ratings of patient
care increased by 915 percent when nurses rated the quality of nursing care given on the unit as
good/excellent (as opposed to fair/poor) and when nurse autonomy was higher. Improved quality
of patient care was 41 percent less likely with every 10 percent increase in nursing worked hours
on the unit but 40 percent more likely with every 10 percent increase in degree-prepared nurses
on the unit.
Quality of Nursing Care on the Last Shift: Good or excellent ratings by nurses of the quality
of nursing care on the last shift were 606 percent more likely when individual nurses rated the
quality of patient care as improved over the last year; 159 percent more likely when nurses were
satisfied; and more likely when nurses rated themselves as clinical experts. Nurses’ reports of
strong nurse-physician relationships were also associated with good/excellent ratings of nursing
Evidence-based Staffing 29
care on the last shift. However, nurses who changed shifts at least once during the past two
weeks were 50 percent less likely to rate the quality of nursing care as good/excellent. Likewise
when a 10 percent increase in the proportion of ratings of quality of nursing care at the unit level
were good/excellent, individual nurses on the unit were 93 percent more likely to rate individual
scores of quality of nursing care as good/excellent. However, for units with higher ratings of
nurse-physician relationships on average, individual nurses were less likely to rate nursing care
as good/excellent.
Absenteeism: Full-time nurses were 152 percent more likely than part-time and casual nurses
to miss work. Nurses who scored one point higher in physical health status scores were five
percent less likely to miss work. When unit productivity/utilization was below 79.7 percent,
nurses tended to have fewer days absent.
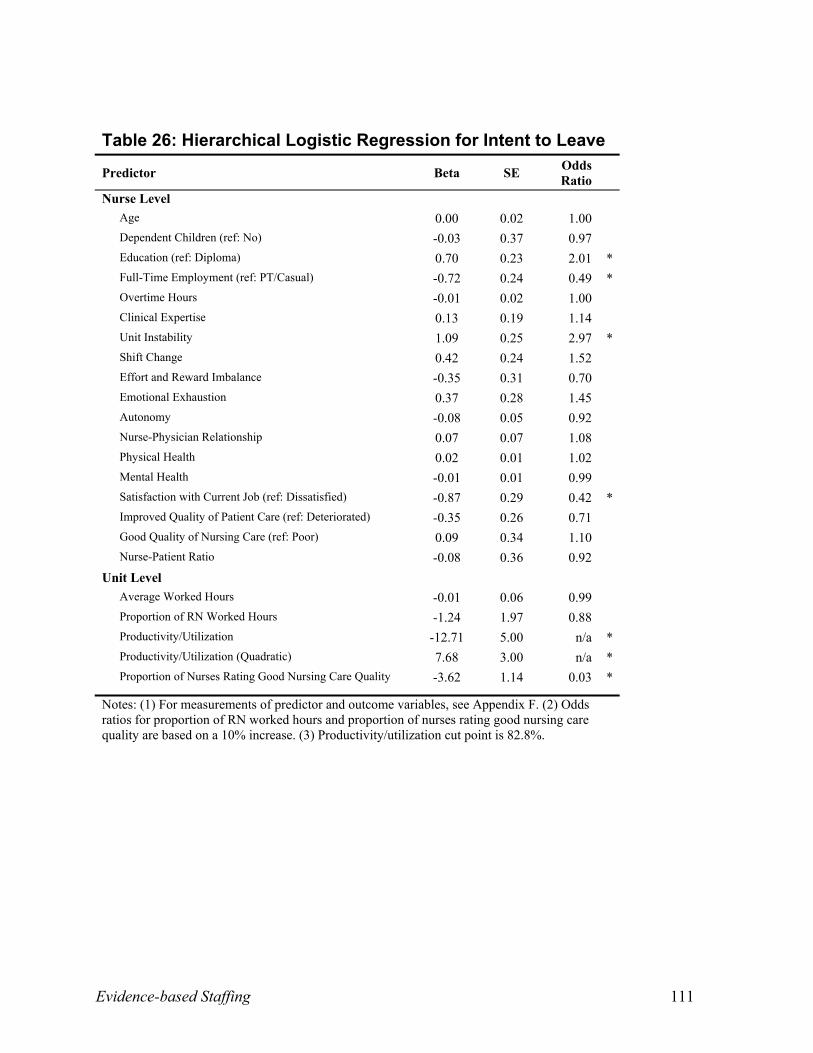
Intent to Leave: Degree-prepared nurses were 101 percent more likely to leave as compared
to diploma-prepared nurses. Nurses who reported job instability were 197 percent more likely to
report intentions of leaving than those who did not. Satisfied nurses were 58 percent less likely to
intend to leave. Full-time nurses were 51 percent less likely to leave than part-time or casual
nurses. When productivity/utilization was below 82.8 percent on the unit, nurses were less likely
to leave.
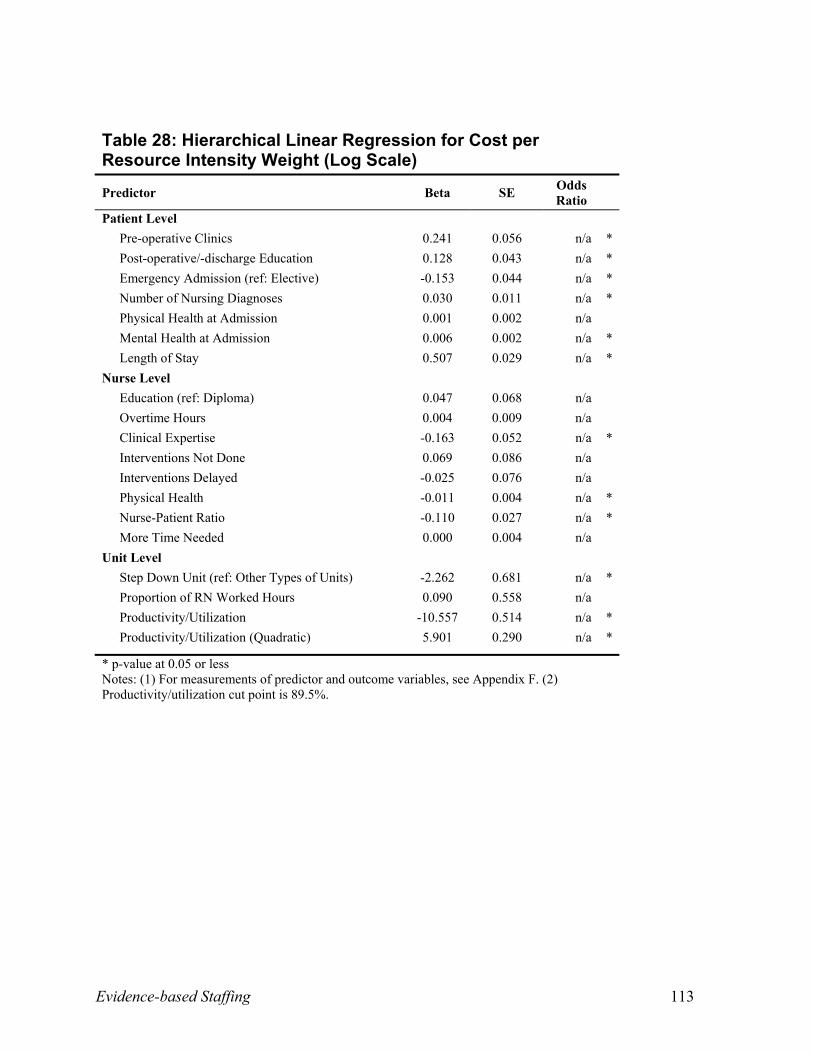
Cost Per Resource Intensity Weight: Patients who were admitted with higher mental health
status scores and with a higher number of nursing diagnoses were more likely to have higher
costs per resource intensity weight, as were patients who attended pre-operative and post-
operative education. Lower costs per resource intensity weight were more likely when care was
provided in part in step-down units, when nurses rated themselves as clinical experts, and with
emergency admissions, higher nurse-patient ratios, and higher physical health status scores
Evidence-based Staffing 30
among nurses. As length of stay increased and as unit productivity/utilization exceeded 90
percent, so did the cost per resource intensity weight.
Research Question 2
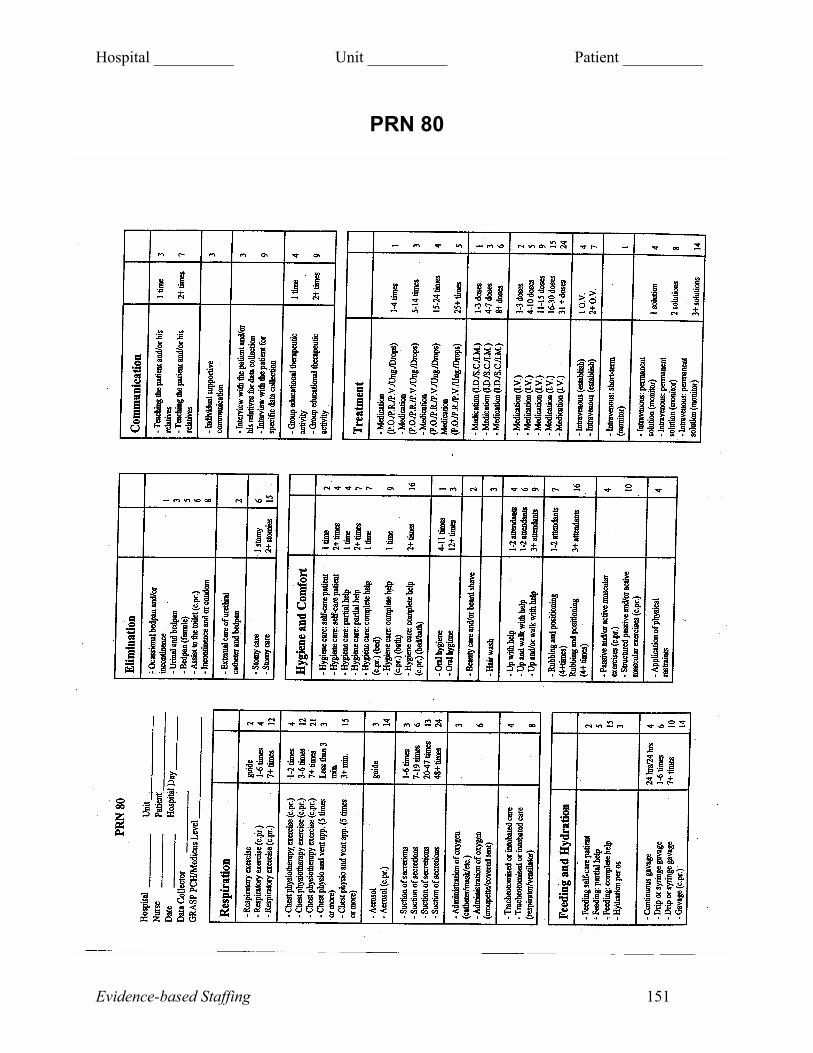
To what extent is there agreement between the estimates generated by a gold standard for
measuring nursing resource needs (PRN workload methodology) and the worked hours per
patient, and how does variance affect the patient and nurse outcomes?
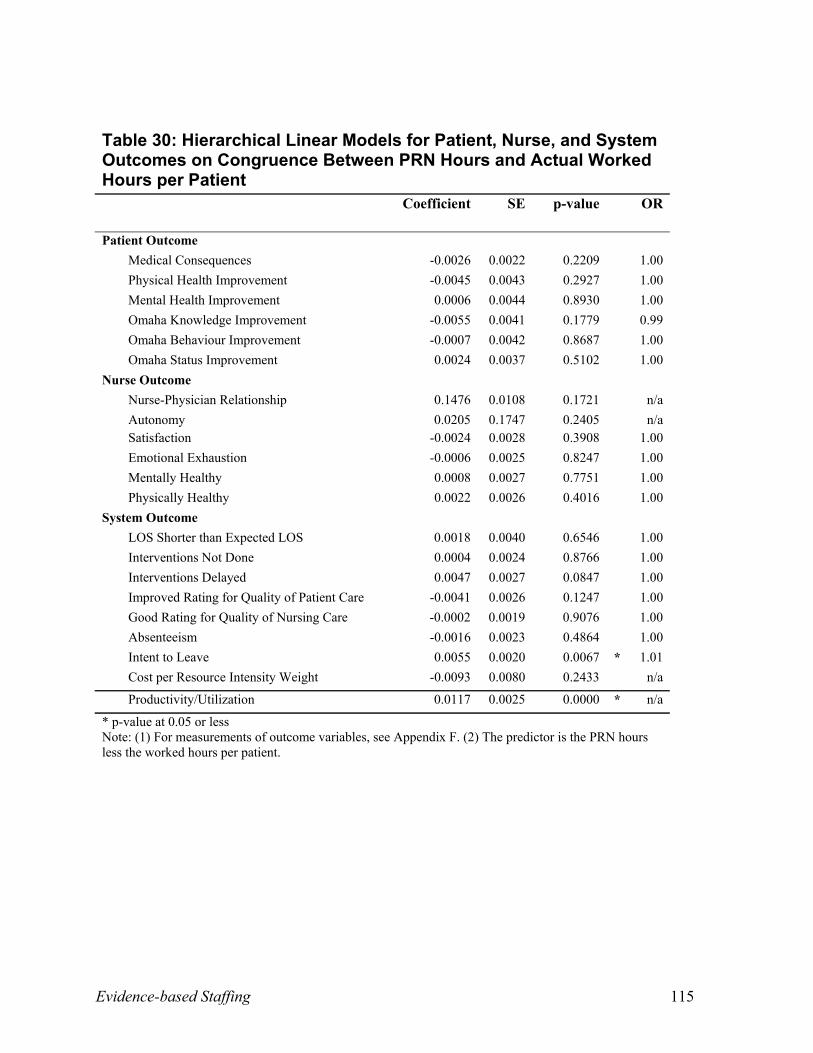
Table 30 (Appendix C) reveals that only two significant variables were found when
examining the PRN estimates and actual worked hours. When actual worked hours were less
than PRN predicted hours, nurses were more likely to leave in the next year and
productivity/utilization was more likely to be high.
Research Question 3
At what nurse-patient ratio and with what proportion of nursing worked hours are
productivity/utilization and patient and nurse outcomes improved, after controlling for the
influence of patient, nurse, organizational, and environmental factors?
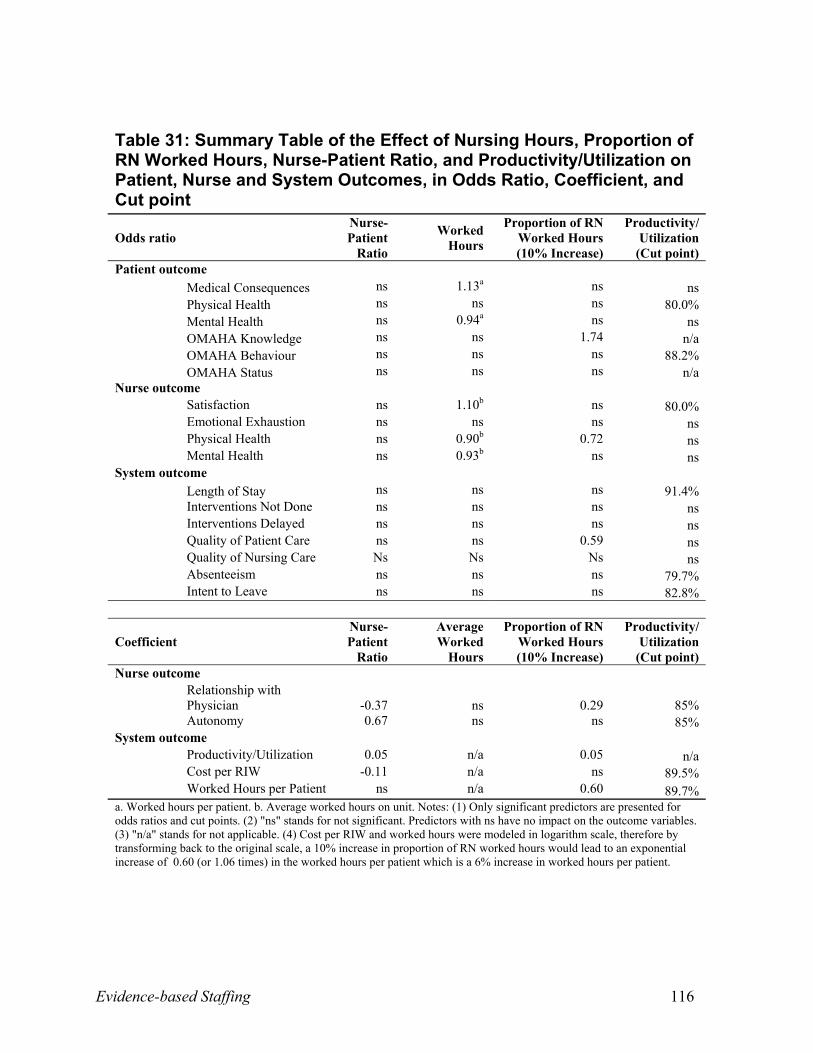
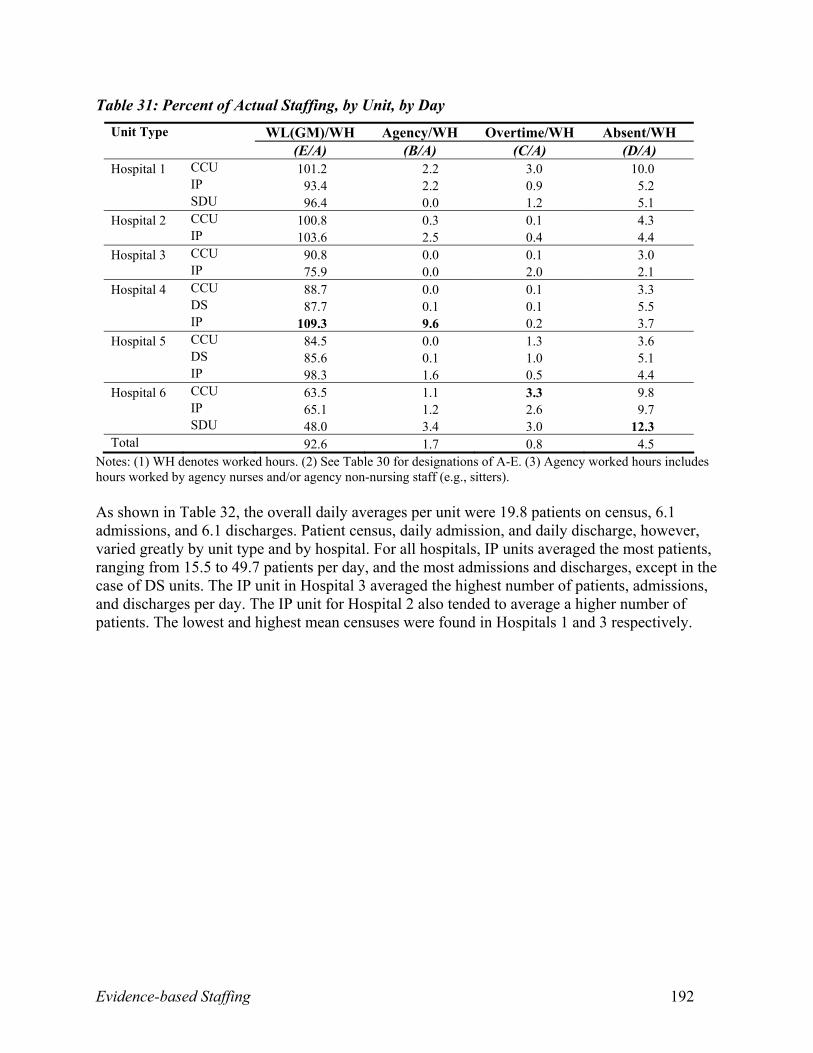
As shown in Table 31 (Appendix C), when a nurse was assigned more patients, the
relationship with physicians deteriorated and autonomy increased. When more patients were
assigned to a nurse, unit productivity/utilization increased and cost per resource intensity weight
decreased. For every additional worked hour per patient, the odds of medical consequences
increased by 13 percent, and the odds of improvement in patient mental health at discharge
decreased by six percent. For every additional hour increase in the average worked hours on the
unit, the likelihood of nurses being satisfied with the current job increased by 10 percent, but
their odds of being physically and mentally health declined by 10 percent and seven percent
respectively. For every 10 percent increase in the proportion of nursing worked hours the odds of
Evidence-based Staffing 31
patients having improved knowledge scores increased by 74 percent, but nurses were 28 percent
less likely to be physically healthy, were 41 percent less likely to rate the quality of patient care
as improved.
Given that the maximum productivity/utilization for any unit should not exceed 93 percent,
productivity/utilization levels range from 79.7 percent for absenteeism to 91.4 percent for
shorter-than-expected length of stay. These findings highlight the difficulties nurses face in this
study, where almost 50 percent of the nursing units worked over productivity/utilization levels of
93 percent.
Research Question 4
Which data elements, in addition to those routinely collected within administrative databases,
are critical for routine data collection in Canada? To what extent do policy and administrative
decision makers support the feasibility of routine data collection?
Discussion with our policy and practice decision-making partners identified that:
1. nurse SF-12 physical and mental health status, emotional exhaustion, autonomy, effort and
reward imbalance, and quality of nurse-physician relationships should be monitored annually
in the new National Nursing Health Survey;
2. unit workload data should be checked for reliability and validity at least annually, and these
data, in combination with worked hours, should be tracked regularly by nursing unit
managers to determine if actual values exceed those recommended in this study. The
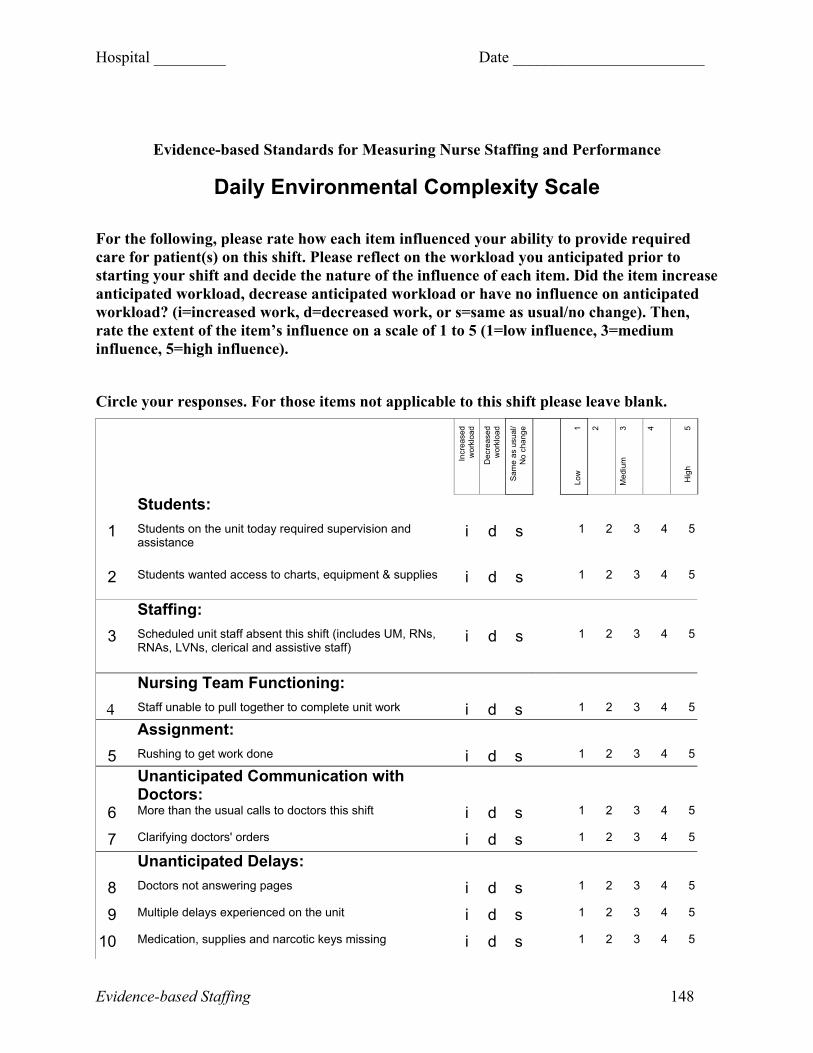
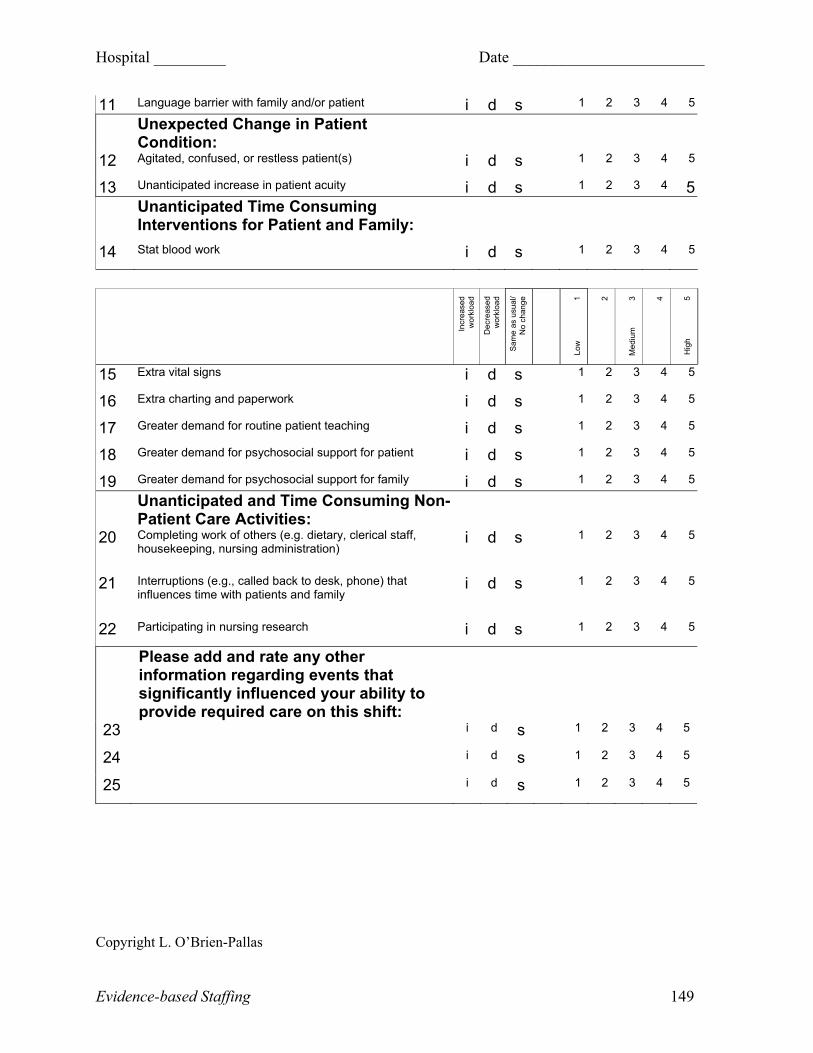
Environmental Complexity Scale should be completed on each shift by nurses.
Productivity/Utilization and environmental complexity should become quality indicators
used by the Canadian Council of Health Services Accreditation to monitor healthy
workplaces; and
Evidence-based Staffing 32
3. nursing diagnoses and OMAHA tool ratings should be used daily in practice. Automated care
planning systems that are easy to access and use are recommended. These are important
indicators of patient goal achievement.
V. Additional Resources
The reader is referred to the works of Aiken et al, O’Brien-Pallas et al, and Shamian and
O’Brien-Pallas et al as referenced in Appendix A.
VI. Further Research
1. Develop and validate a shorter version of the effort and reward imbalance scale.
2. Conduct studies to examine the influencing factors and nature of short- and long-term
illnesses among nurses. Evaluate strategies (such as access to fitness centers, improved hot
meals in the hospital, and mandatory breaks) that may enhance the health of nurses.
3. Replicate this study on other patient populations to determine if the productivity/utilization
cut-off points hold.
4. Explore experienced nurses’ perceptions of quality and develop measures of quality that can
be evaluated yearly at the nursing unit level.
VII. References
1. Canadian Nursing Advisory Committee. (2002).Our health, our future: Creating quality workplaces for Canadian nurses. Toronto, ON: Author.
2. O’Brien-Pallas, L. L., Thomson, D., Alksnis, C., Luba, M., Pagniello, A., Ray, K. et al (2003). Stepping to success and sustainability: An analysis of Ontario’s nursing workforce. Toronto, ON: Nursing Effectiveness, Utilization, and Outcomes Research Unit.
3. Canadian Council for Health Service Accreditation (2002). Recognition guidelines for 2003: Specific issues and related criteria. Ottawa, ON: Author.
4. Baumann, A., O'Brien-Pallas, L., Armstrong-Stassen, M., Blythe, J., Bourbonnais, R. Cameron, S. et al. (2001). Commitment and care: The benefits of a healthy workplace for
Evidence-based Staffing 33
nurse, their patients and the system – a policy synthesis. Ottawa, ON: Canadian Health Service Research Foundation.
5. O’Brien-Pallas, L. L., Alksnis, C., Wang, S., Birch, S., & Tomblin Murphy, G. (2003). Bring the future into focus: Projecting RN retirement in Canada. Toronto, ON: Canadian Institute for Health Information.
6. Aiken, L., Clarke, S., Sloane, D., Sochalski, J., & Silber, J. (2002). Hospital nurse staffing and patient mortality, nurse burnout, and job satisfaction. JAMA: The Journal of American Medical Association, 288(16), 1987-1993.
7. Shamian, J., O’Brien-Pallas, L., Kerr, M., Koehoorn, M., Thomson, D., & Alksnis, C. (2001). Effects of job strain, hospital organizational factors and individual characteristics on work-related disability among nurses. Toronto, ON: Ontario Workplace Safety and Insurance Board.
8. Grinspun, D. (2003). Part-time and casual nursing work: The perils of healthcare restructuring. International Journal of Sociology and Social Policy, 23(8/9), 54-70.
9. Canadian Institute for Health Information. (1999). MIS guidelines for Canadian healthcare facilities. Ottawa, ON: Author.
10. O’Brien-Pallas, L., Giovannetti, P., Peereboom, E., & Marton, C. (1995). Case costing and nursing workload: Past, present and future [Working Paper 95-1]. Hamilton, ON: Quality of Nursing Worklife Research Unit.
Evidence-based Staffing 34
Appendix A. Annotated Bibliography
Table of Contents
1. Patient Characteristics 35
2. Nurse Characteristics 38
3. System Characteristics and Behaviours 40
4. Throughputs 60
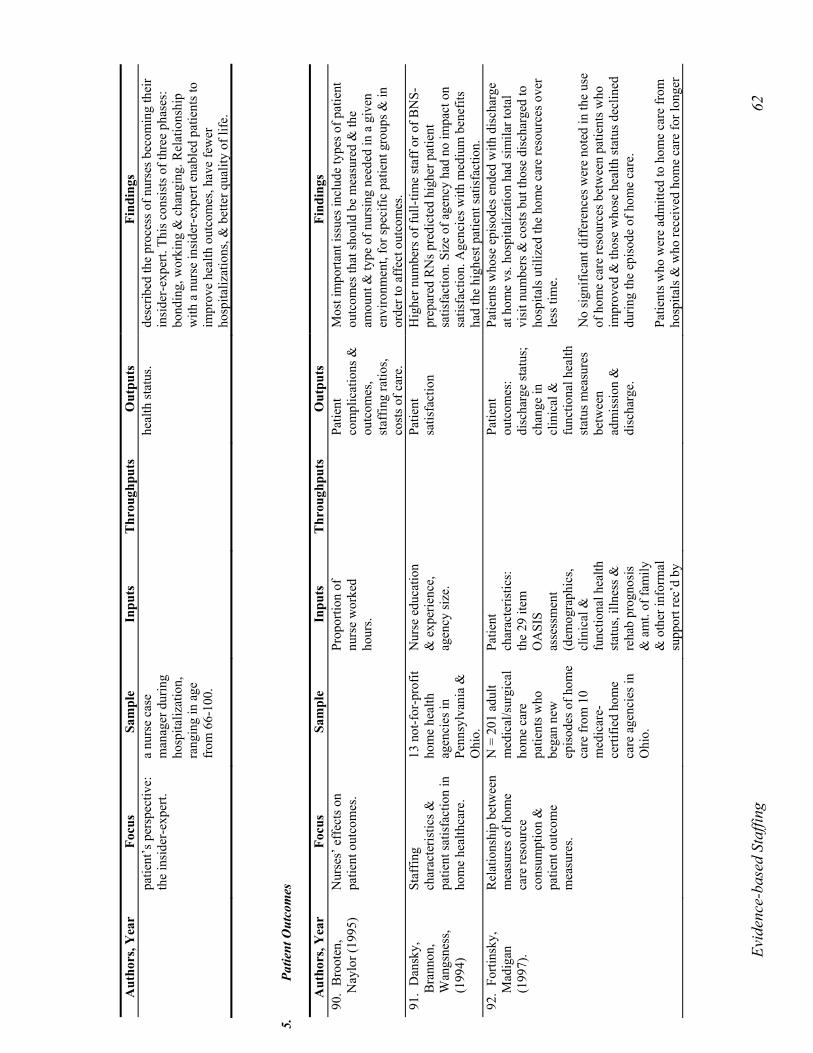
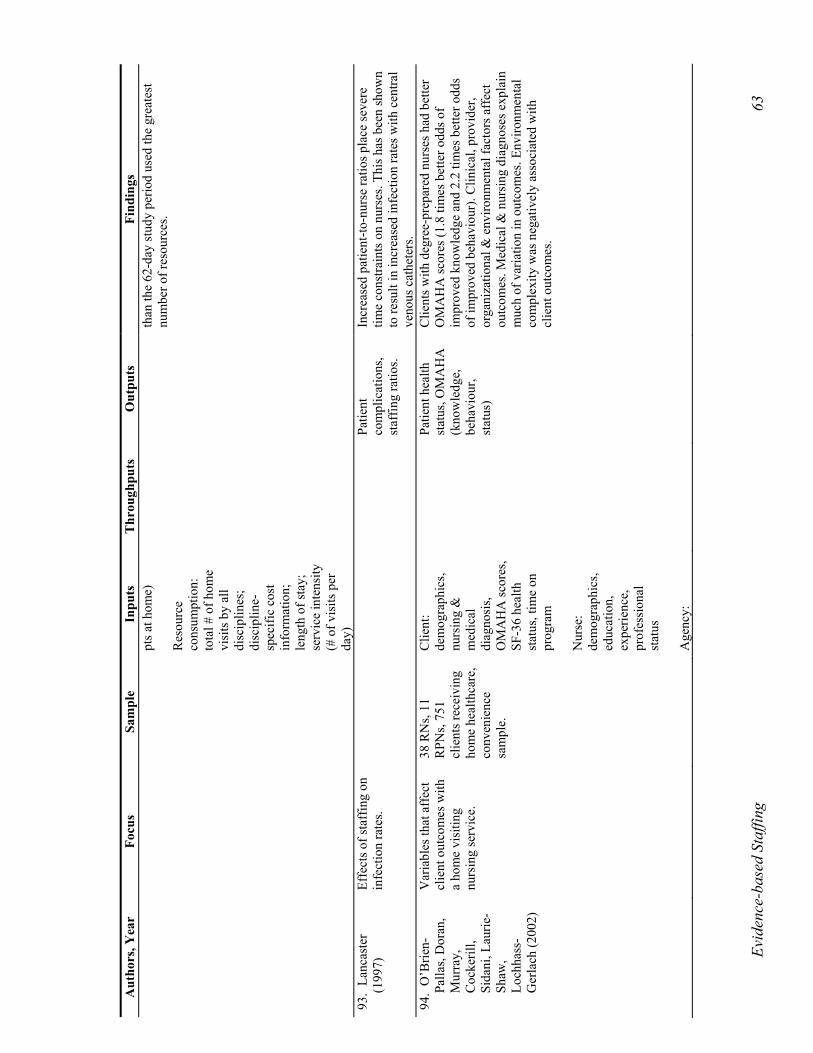
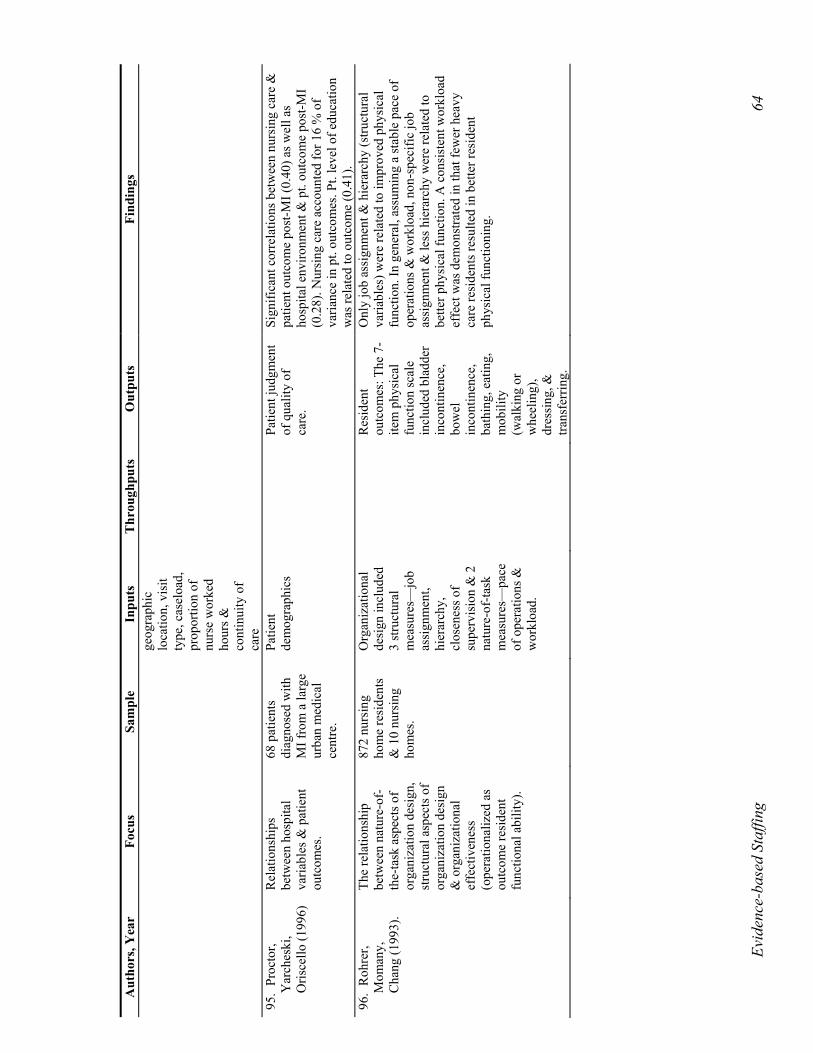
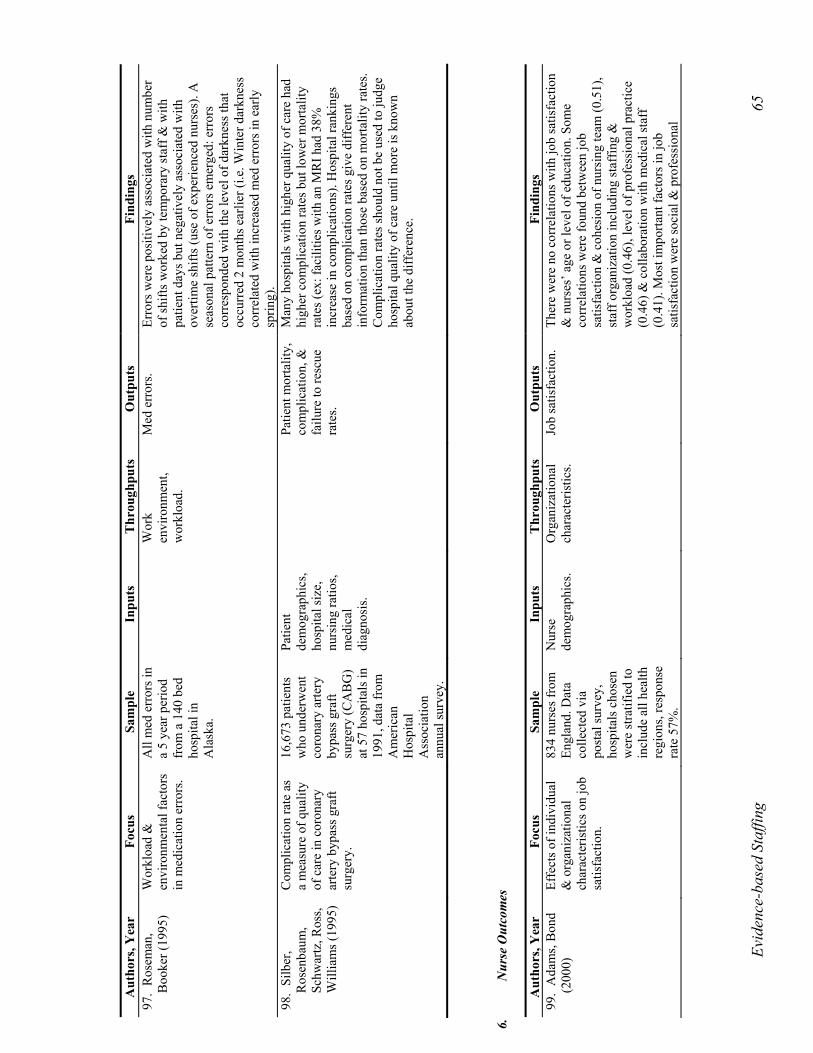
5. Patient Outcomes 62
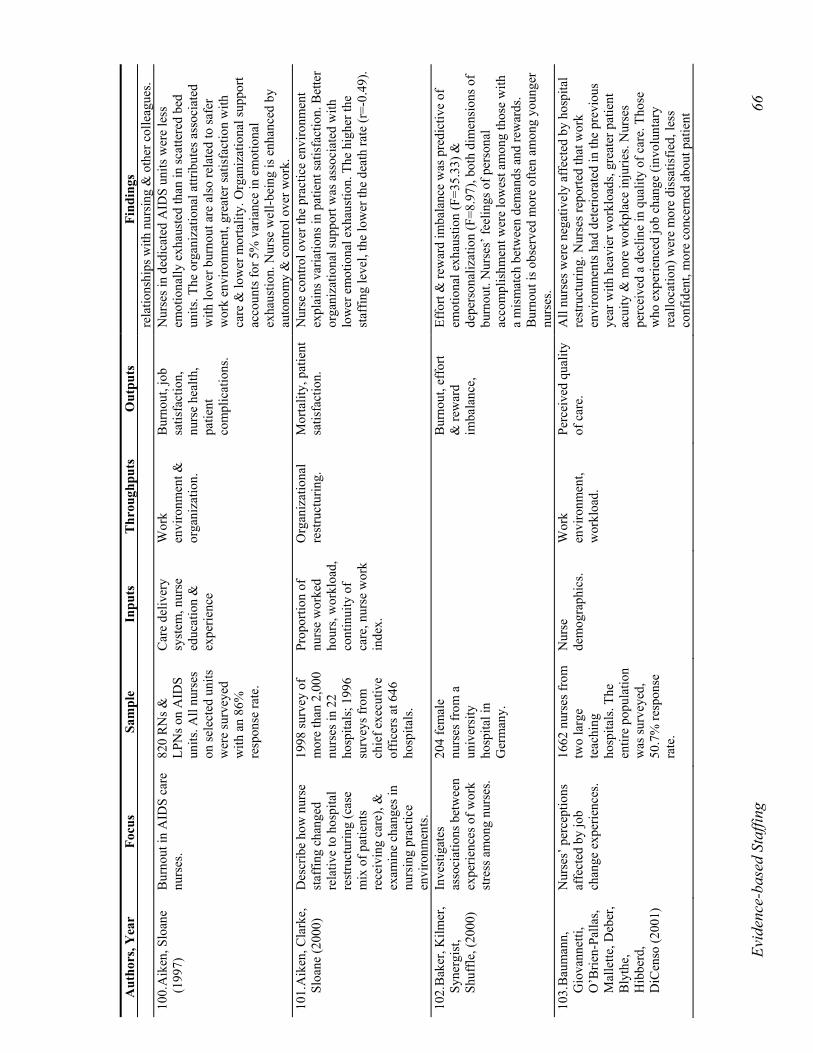
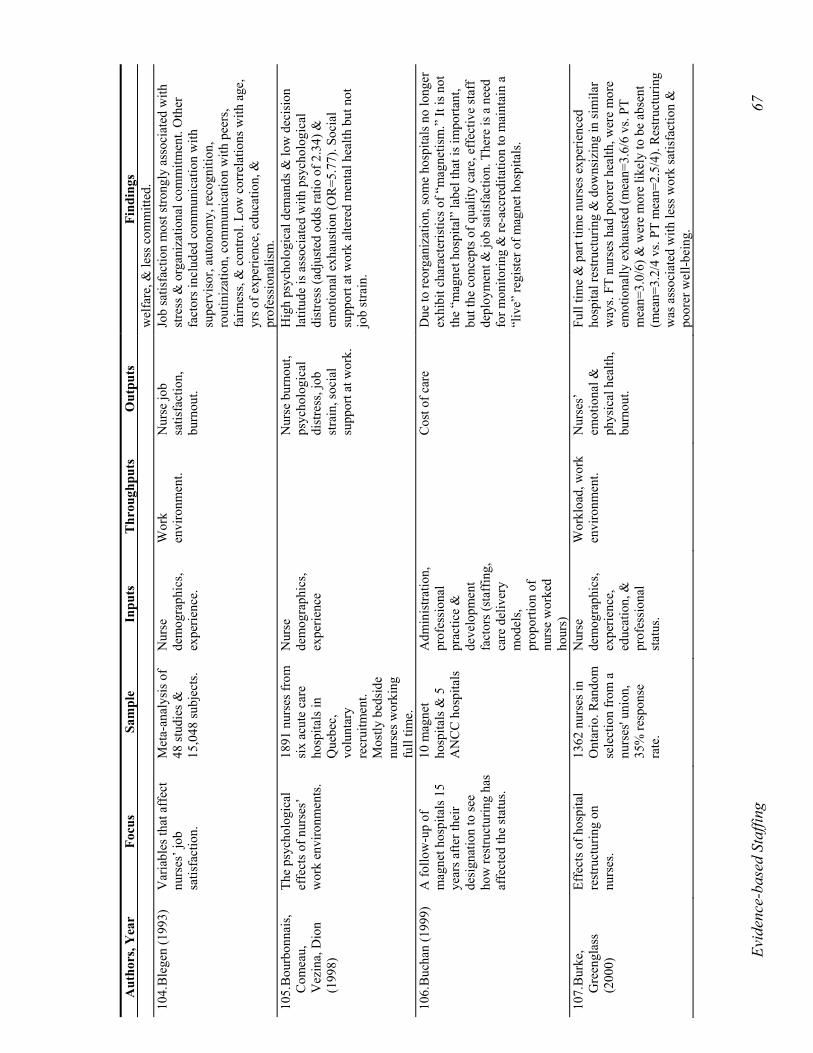
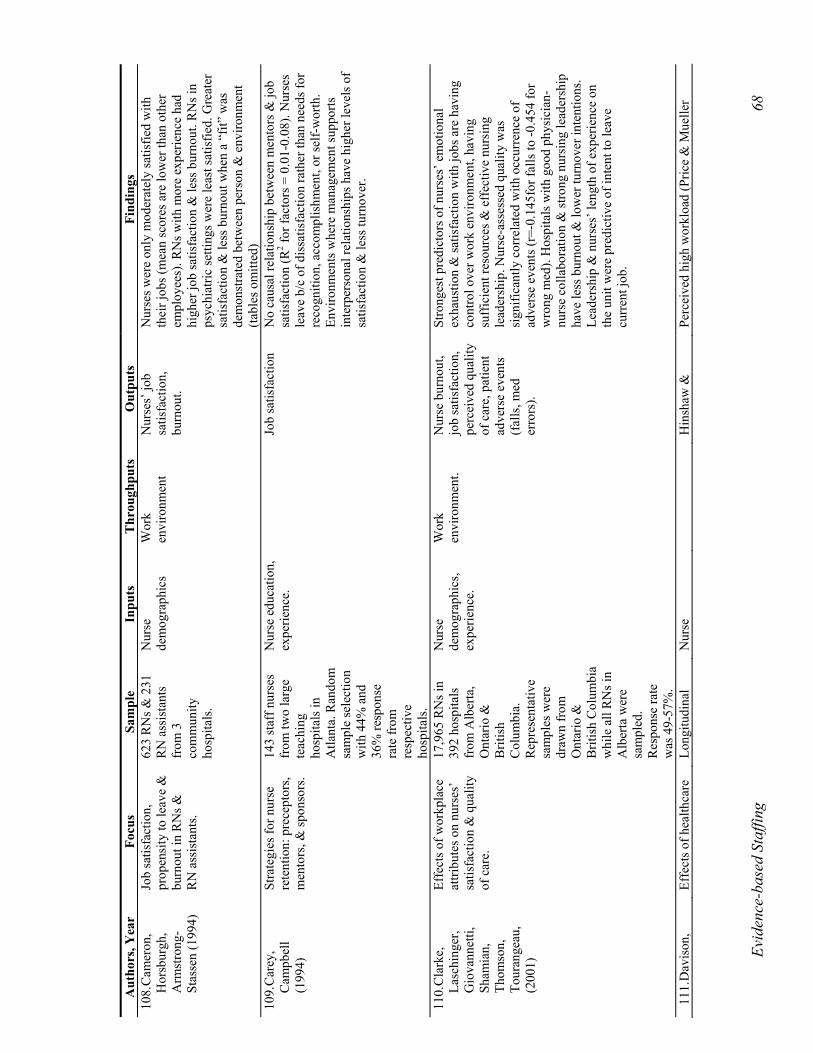
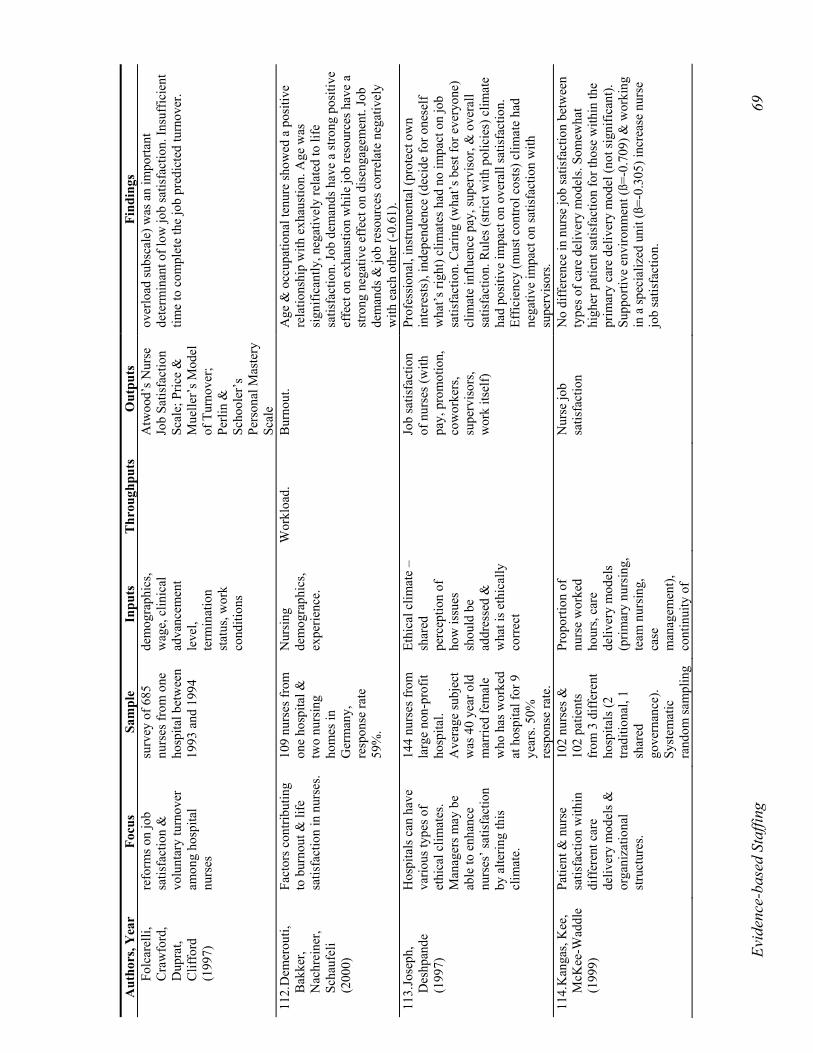
6. Nurse Outcomes 65
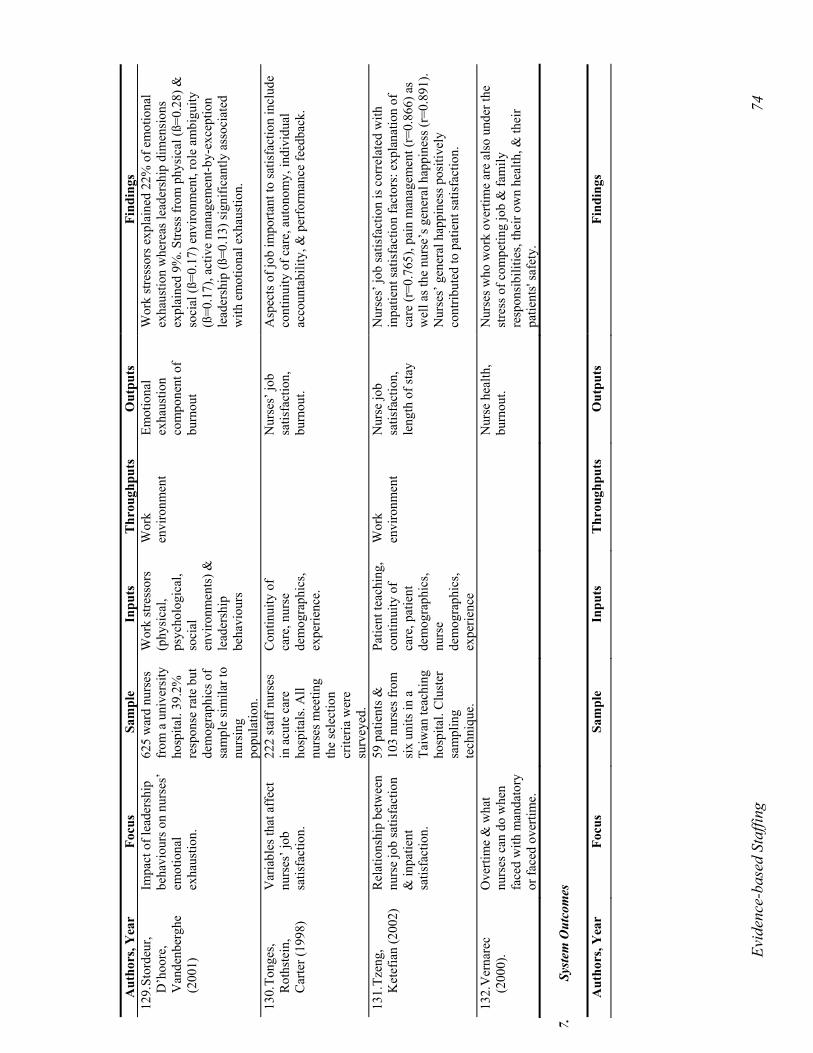
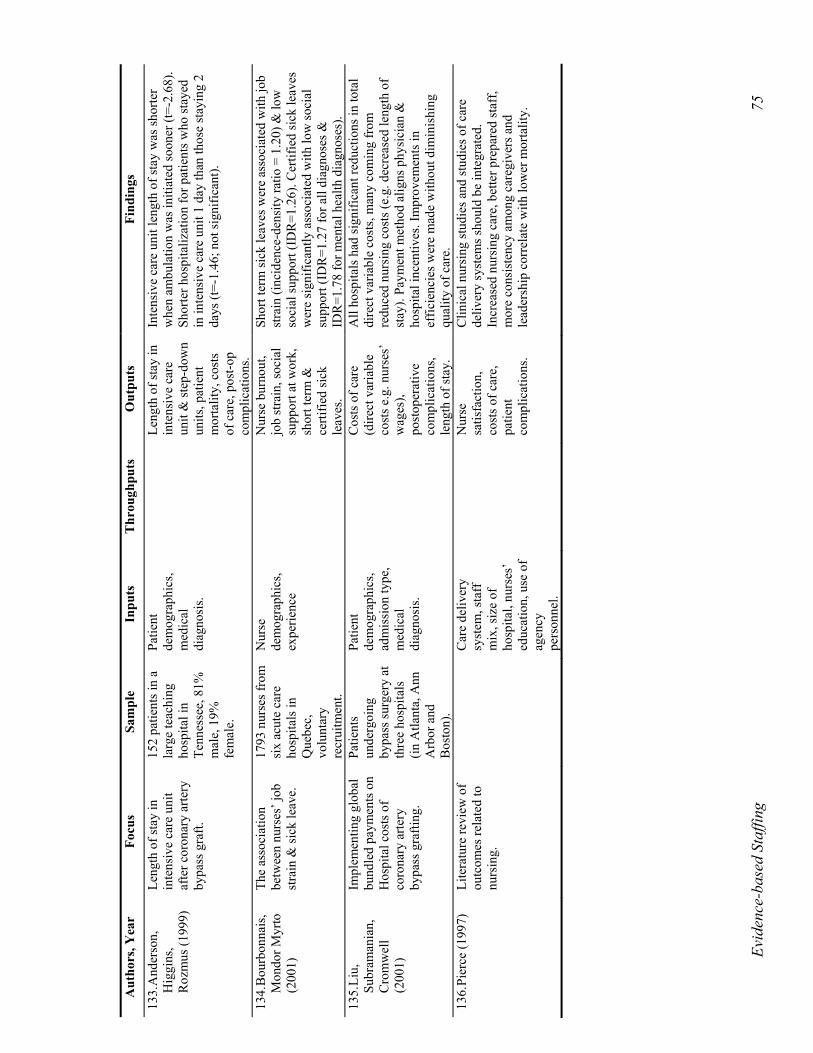
7. System Outcomes 74
8. Glossary 76
9. References 76
Evid
ence
-bas
ed S
taffi
ng
35
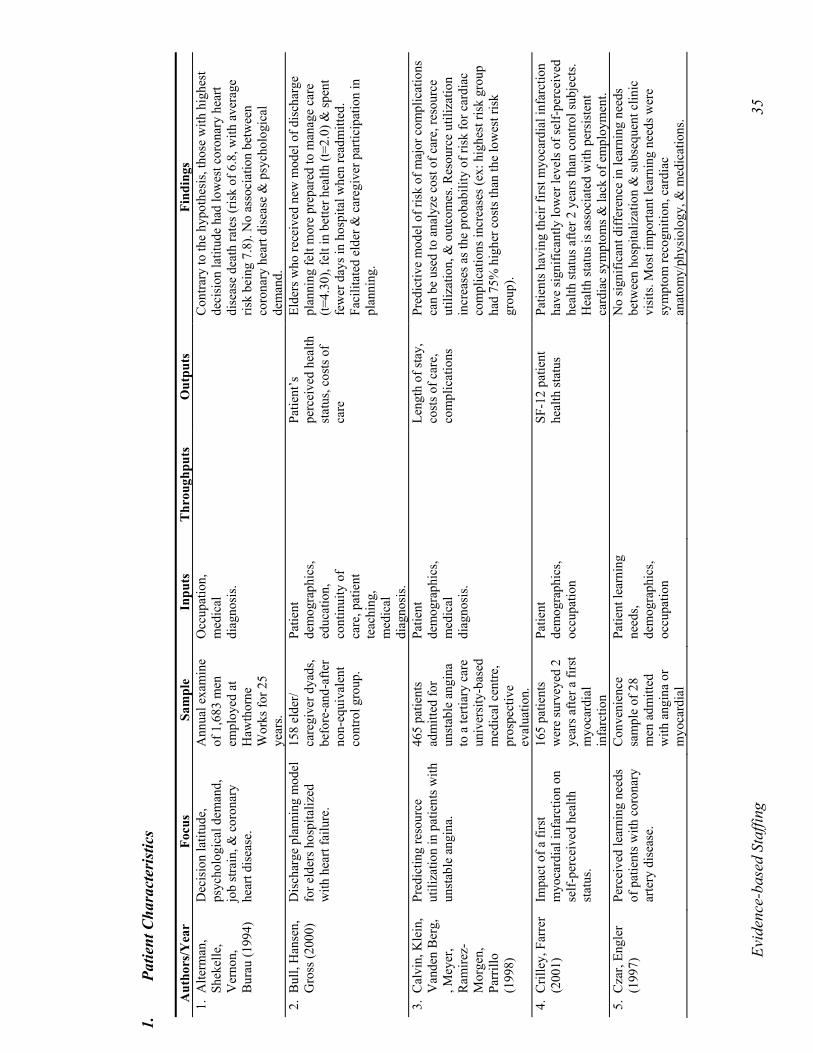
1.
Pa
tient
Cha
ract
eris
tics
A
utho
rs/Y
ear
Focu
s Sa
mpl
e In
puts
T
hrou
ghpu
ts
Out
puts
Fi
ndin
gs
1. A
lterm
an,
Shek
elle
, V
erno
n,
Bur
au (1
994)
Dec
isio
n la
titud
e,
psyc
holo
gica
l dem
and,
jo
b st
rain
, & c
oron
ary
hear
t dis
ease
.
Ann
ual e
xam
ine
of 1
,683
men
em
ploy
ed a
t H
awth
orne
W
orks
for 2
5 ye
ars.
Occ
upat
ion,
m
edic
al
diag
nosi
s.
Con
trary
to th
e hy
poth
esis
, tho
se w
ith h
ighe
st
deci
sion
latit
ude
had
low
est c
oron
ary
hear
t di
seas
e de
ath
rate
s (ris
k of
6.8
, with
ave
rage
ris
k be
ing
7.8)
. No
asso
ciat
ion
betw
een
coro
nary
hea
rt di
seas
e &
psy
chol
ogic
al
dem
and.
2.
Bul
l, H
anse
n,
Gro
ss (2
000)
D
isch
arge
pla
nnin
g m
odel
fo
r eld
ers h
ospi
taliz
ed
with
hea
rt fa
ilure
.
158
elde
r/ ca
regi
ver d
yads
, be
fore
-and
-afte
r no
n-eq
uiva
lent
co
ntro
l gro
up.
Patie
nt
dem
ogra
phic
s, ed
ucat
ion,
co
ntin
uity
of
care
, pat
ient
te
achi
ng,
med
ical
di
agno
sis.
Pa
tient
’s
perc
eive
d he
alth
st
atus
, cos
ts o
f ca
re
Elde
rs w
ho re
ceiv
ed n
ew m
odel
of d
isch
arge
pl
anni
ng fe
lt m
ore
prep
ared
to m
anag
e ca
re
(t=4.
30),
felt
in b
ette
r hea
lth (t
=2.0
) & sp
ent
few
er d
ays i
n ho
spita
l whe
n re
adm
itted
. Fa
cilit
ated
eld
er &
car
egiv
er p
artic
ipat
ion
in
plan
ning
.
3. C
alvi
n, K
lein
, V
ande
n B
erg,
, M
eyer
, R
amire
z-M
orge
n,
Parr
illo
(199
8)
Pred
ictin
g re
sour
ce
utili
zatio
n in
pat
ient
s with
un
stab
le a
ngin
a.
465
patie
nts
adm
itted
for
unst
able
ang
ina
to a
terti
ary
care
un
iver
sity
-bas
ed
med
ical
cen
tre,
pros
pect
ive
eval
uatio
n.
Patie
nt
dem
ogra
phic
s, m
edic
al
diag
nosi
s.
Le
ngth
of s
tay,
co
sts o
f car
e,
com
plic
atio
ns
Pred
ictiv
e m
odel
of r
isk
of m
ajor
com
plic
atio
ns
can
be u
sed
to a
naly
ze c
ost o
f car
e, re
sour
ce
utili
zatio
n, &
out
com
es. R
esou
rce
utili
zatio
n in
crea
ses a
s the
pro
babi
lity
of ri
sk fo
r car
diac
co
mpl
icat
ions
incr
ease
s (ex
: hig
hest
risk
gro
up
had
75%
hig
her c
osts
than
the
low
est r
isk
grou
p).
4. C
rille
y, F
arre
r (2
001)
Im
pact
of a
firs
t m
yoca
rdia
l inf
arct
ion
on
self-
perc
eive
d he
alth
st
atus
.
165
patie
nts
wer
e su
rvey
ed 2
ye
ars a
fter a
firs
t m
yoca
rdia
l in
farc
tion
Patie
nt
dem
ogra
phic
s, oc
cupa
tion
SF
-12
patie
nt
heal
th st
atus
Pa
tient
s hav
ing
thei
r firs
t myo
card
ial i
nfar
ctio
n ha
ve si
gnifi
cant
ly lo
wer
leve
ls o
f sel
f-pe
rcei
ved
heal
th st
atus
afte
r 2 y
ears
than
con
trol s
ubje
cts.
Hea
lth st
atus
is a
ssoc
iate
d w
ith p
ersi
sten
t ca
rdia
c sy
mpt
oms &
lack
of e
mpl
oym
ent.
5. C
zar,
Engl
er
(199
7)
Perc
eive
d le
arni
ng n
eeds
of
pat
ient
s with
cor
onar
y ar
tery
dis
ease
.
Con
veni
ence
sa
mpl
e of
28
men
adm
itted
w
ith a
ngin
a or
m
yoca
rdia
l
Patie
nt le
arni
ng
need
s, de
mog
raph
ics,
occu
patio
n
No
sign
ifica
nt d
iffer
ence
in le
arni
ng n
eeds
be
twee
n ho
spita
lizat
ion
& su
bseq
uent
clin
ic
visi
ts. M
ost i
mpo
rtant
lear
ning
nee
ds w
ere
sym
ptom
reco
gniti
on, c
ardi
ac
anat
omy/
phys
iolo
gy, &
med
icat
ions
.
Evid
ence
-bas
ed S
taffi
ng
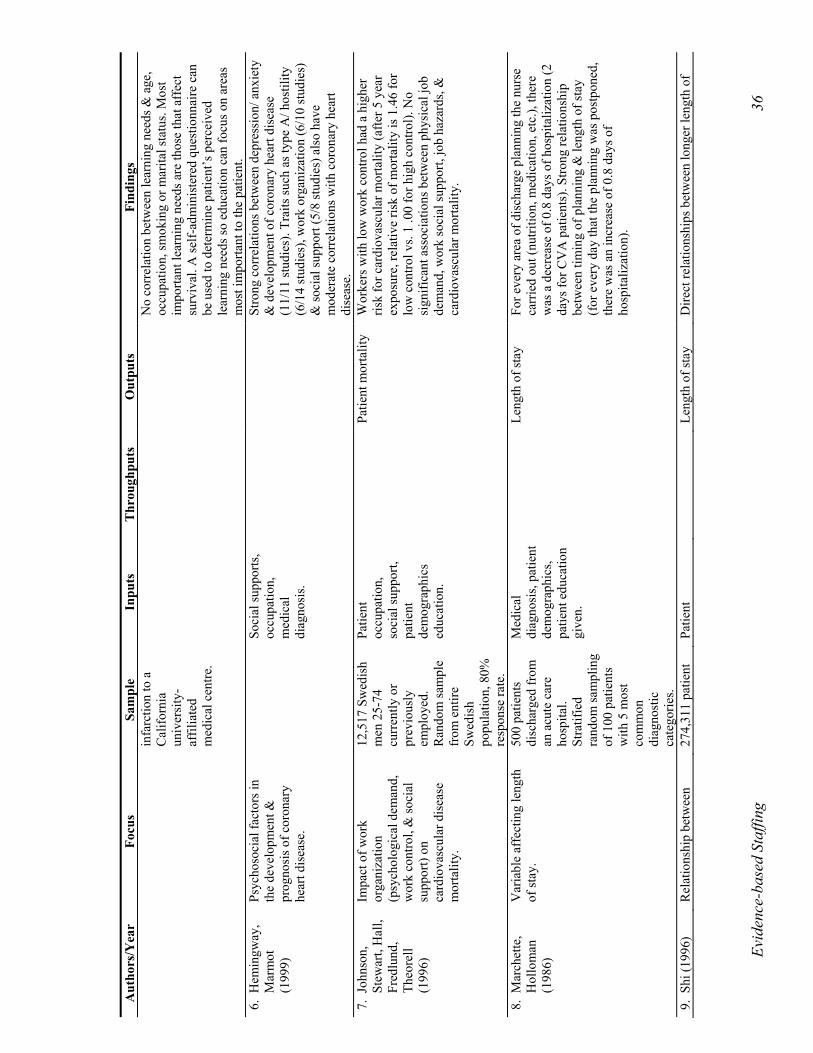
36
Aut
hors
/Yea
r Fo
cus
Sam
ple
Inpu
ts
Thr
ough
puts
O
utpu
ts
Find
ings
in
farc
tion
to a
C
alifo
rnia
un
iver
sity
-af
filia
ted
med
ical
cen
tre.
No
corr
elat
ion
betw
een
lear
ning
nee
ds &
age
, oc
cupa
tion,
smok
ing
or m
arita
l sta
tus.
Mos
t im
porta
nt le
arni
ng n
eeds
are
thos
e th
at a
ffec
t su
rviv
al. A
self-
adm
inis
tere
d qu
estio
nnai
re c
an
be u
sed
to d
eter
min
e pa
tient
’s p
erce
ived
le
arni
ng n
eeds
so e
duca
tion
can
focu
s on
area
s m
ost i
mpo
rtant
to th
e pa
tient
. 6.
Hem
ingw
ay,
Mar
mot
(1
999)
Psyc
hoso
cial
fact
ors i
n th
e de
velo
pmen
t &
prog
nosi
s of c
oron
ary
hear
t dis
ease
.
So
cial
supp
orts
, oc
cupa
tion,
m
edic
al
diag
nosi
s.
Stro
ng c
orre
latio
ns b
etw
een
depr
essi
on/ a
nxie
ty
& d
evel
opm
ent o
f cor
onar
y he
art d
isea
se
(11/
11 st
udie
s). T
raits
such
as t
ype
A/ h
ostil
ity
(6/1
4 st
udie
s), w
ork
orga
niza
tion
(6/1
0 st
udie
s)
& so
cial
supp
ort (
5/8
stud
ies)
als
o ha
ve
mod
erat
e co
rrel
atio
ns w
ith c
oron
ary
hear
t di
seas
e.
7. J
ohns
on,
Stew
art,
Hal
l, Fr
edlu
nd,
Theo
rell
(199
6)
Impa
ct o
f wor
k or
gani
zatio
n (p
sych
olog
ical
dem
and,
w
ork
cont
rol,
& so
cial
su
ppor
t) on
ca
rdio
vasc
ular
dis
ease
m
orta
lity.
12,5
17 S
wed
ish
men
25-
74
curr
ently
or
prev
ious
ly
empl
oyed
. R
ando
m sa
mpl
e fr
om e
ntire
Sw
edis
h po
pula
tion,
80%
re
spon
se ra
te.
Patie
nt
occu
patio
n,
soci
al su
ppor
t, pa
tient
de
mog
raph
ics
educ
atio
n.
Pa
tient
mor
talit
y W
orke
rs w
ith lo
w w
ork
cont
rol h
ad a
hig
her
risk
for c
ardi
ovas
cula
r mor
talit
y (a
fter 5
yea
r ex
posu
re, r
elat
ive
risk
of m
orta
lity
is 1
.46
for
low
con
trol v
s. 1
.00
for h
igh
cont
rol).
No
sign
ifica
nt a
ssoc
iatio
ns b
etw
een
phys
ical
job
dem
and,
wor
k so
cial
supp
ort,
job
haza
rds,
&
card
iova
scul
ar m
orta
lity.
8. M
arch
ette
, H
ollo
man
(1
986)
Var
iabl
e af
fect
ing
leng
th
of st
ay.
500
patie
nts
disc
harg
ed fr
om
an a
cute
car
e ho
spita
l. St
ratif
ied
rand
om sa
mpl
ing
of 1
00 p
atie
nts
with
5 m
ost
com
mon
di
agno
stic
ca
tego
ries.
Med
ical
di
agno
sis,
patie
nt
dem
ogra
phic
s, pa
tient
edu
catio
n gi
ven.
Le
ngth
of s
tay
For e
very
are
a of
dis
char
ge p
lann
ing
the
nurs
e ca
rrie
d ou
t (nu
tritio
n, m
edic
atio
n, e
tc.),
ther
e w
as a
dec
reas
e of
0.8
day
s of h
ospi
taliz
atio
n (2
da
ys fo
r CV
A p
atie
nts)
. Stro
ng re
latio
nshi
p be
twee
n tim
ing
of p
lann
ing
& le
ngth
of s
tay
(for
eve
ry d
ay th
at th
e pl
anni
ng w
as p
ostp
oned
, th
ere
was
an
incr
ease
of 0
.8 d
ays o
f ho
spita
lizat
ion)
.
9. S
hi (1
996)
R
elat
ions
hip
betw
een
274,
311
patie
nt
Patie
nt
Le
ngth
of s
tay
Dire
ct re
latio
nshi
ps b
etw
een
long
er le
ngth
of
Evid
ence
-bas
ed S
taffi
ng
37
Aut
hors
/Yea
r Fo
cus
Sam
ple
Inpu
ts
Thr
ough
puts
O
utpu
ts
Find
ings
patie
nt &
hos
pita
l ch
arac
teris
tics o
n le
ngth
of
stay
.
reco
rds &
484
ho
spita
ls,
rand
om sa
mpl
ing
of h
ospi
tals
&
disc
harg
es.
dem
ogra
phic
s, ho
spita
l siz
e,
med
ical
di
agno
sis,
soci
al
supp
ort.
stay
& o
lder
age
, non
-mar
ried
stat
us, b
eing
fe
mal
e, b
eing
Afr
ican
Am
eric
an, &
hav
ing
insu
ranc
e. F
ewer
hos
pita
l bed
s cor
rela
ted
with
sh
orte
r len
gth
of st
ay ta
bles
om
itted
).
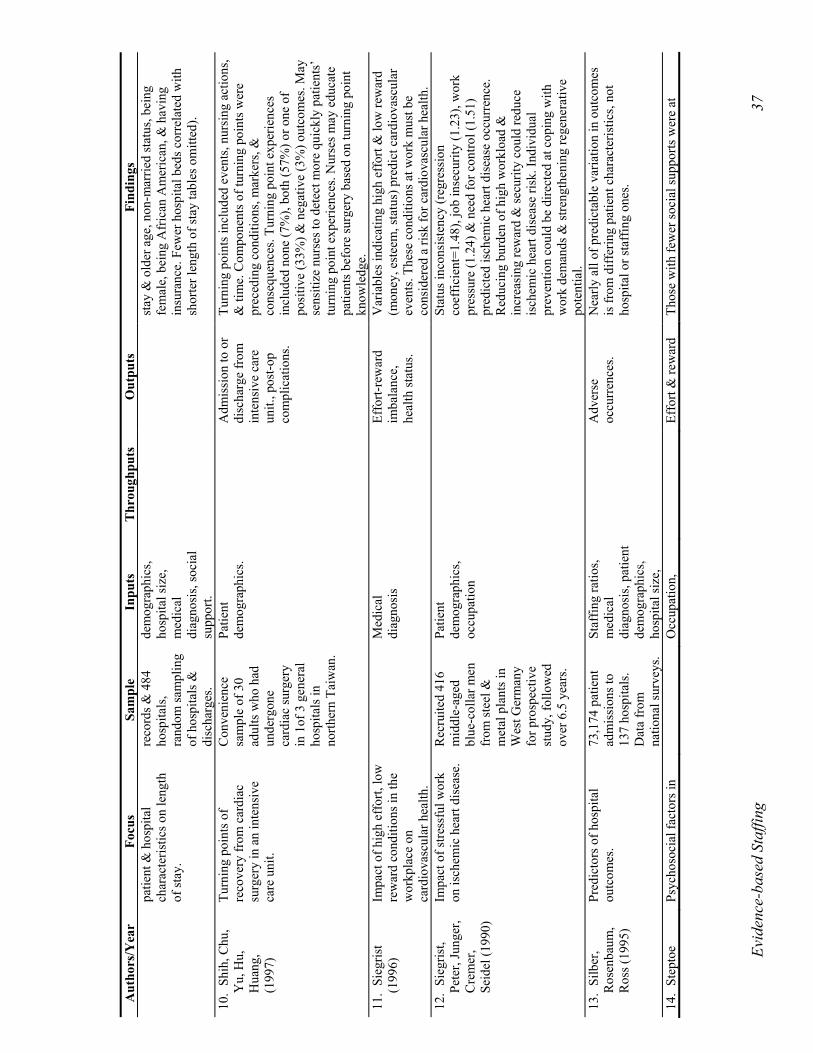
10.
Shih
, Chu
, Y
u, H
u,
Hua
ng,
(199
7)
Turn
ing
poin
ts o
f re
cove
ry fr
om c
ardi
ac
surg
ery
in a
n in
tens
ive
care
uni
t.
Con
veni
ence
sa
mpl
e of
30
adul
ts w
ho h
ad
unde
rgon
e ca
rdia
c su
rger
y in
1of
3 g
ener
al
hosp
itals
in
north
ern
Taiw
an.
Patie
nt
dem
ogra
phic
s.
Adm
issi
on to
or
disc
harg
e fr
om
inte
nsiv
e ca
re
unit.
, pos
t-op
com
plic
atio
ns.
Turn
ing
poin
ts in
clud
ed e
vent
s, nu
rsin
g ac
tions
, &
tim
e. C
ompo
nent
s of t
urni
ng p
oint
s wer
e pr
eced
ing
cond
ition
s, m
arke
rs, &
co
nseq
uenc
es. T
urni
ng p
oint
exp
erie
nces
in
clud
ed n
one
(7%
), bo
th (5
7%) o
r one
of
posi
tive
(33%
) & n
egat
ive
(3%
) out
com
es. M
ay
sens
itize
nur
ses t
o de
tect
mor
e qu
ickl
y pa
tient
s’
turn
ing
poin
t exp
erie
nces
. Nur
ses m
ay e
duca
te
patie
nts b
efor
e su
rger
y ba
sed
on tu
rnin
g po
int
know
ledg
e.
11.
Sieg
rist
(199
6)
Impa
ct o
f hig
h ef
fort,
low
re
war
d co
nditi
ons i
n th
e w
orkp
lace
on
card
iova
scul
ar h
ealth
.
M
edic
al
diag
nosi
s
Effo
rt-re
war
d im
bala
nce,
he
alth
stat
us.
Var
iabl
es in
dica
ting
high
eff
ort &
low
rew
ard
(mon
ey, e
stee
m, s
tatu
s) p
redi
ct c
ardi
ovas
cula
r ev
ents
. The
se c
ondi
tions
at w
ork
mus
t be
cons
ider
ed a
risk
for c
ardi
ovas
cula
r hea
lth.
12.
Sieg
rist,
Pete
r, Ju
nger
, C
rem
er,
Seid
el (1
990)
Impa
ct o
f stre
ssfu
l wor
k on
isch
emic
hea
rt di
seas
e.
Rec
ruite
d 41
6 m
iddl
e-ag
ed
blue
-col
lar m
en
from
stee
l &
met
al p
lant
s in
Wes
t Ger
man
y fo
r pro
spec
tive
stud
y, fo
llow
ed
over
6.5
yea
rs.
Patie
nt
dem
ogra
phic
s, oc
cupa
tion
Stat
us in
cons
iste
ncy
(reg
ress
ion
coef
ficie
nt=1
.48)
, job
inse
curit
y (1
.23)
, wor
k pr
essu
re (1
.24)
& n
eed
for c
ontro
l (1.
51)
pred
icte
d is
chem
ic h
eart
dise
ase
occu
rren
ce.
Red
ucin
g bu
rden
of h
igh
wor
kloa
d &
in
crea
sing
rew
ard
& se
curit
y co
uld
redu
ce
isch
emic
hea
rt di
seas
e ris
k. In
divi
dual
pr
even
tion
coul
d be
dire
cted
at c
opin
g w
ith
wor
k de
man
ds &
stre
ngth
enin
g re
gene
rativ
e po
tent
ial.
13
. Si
lber
, R
osen
baum
, R
oss (
1995
)
Pred
icto
rs o
f hos
pita
l ou
tcom
es.
73,1
74 p
atie
nt
adm
issi
ons t
o 13
7 ho
spita
ls.
Dat
a fr
om
natio
nal s
urve
ys.
Staf
fing
ratio
s, m
edic
al
diag
nosi
s, pa
tient
de
mog
raph
ics,
hosp
ital s
ize,
A
dver
se
occu
rren
ces.
N
early
all
of p
redi
ctab
le v
aria
tion
in o
utco
mes
is
from
diff
erin
g pa
tient
cha
ract
eris
tics,
not
hosp
ital o
r sta
ffin
g on
es.
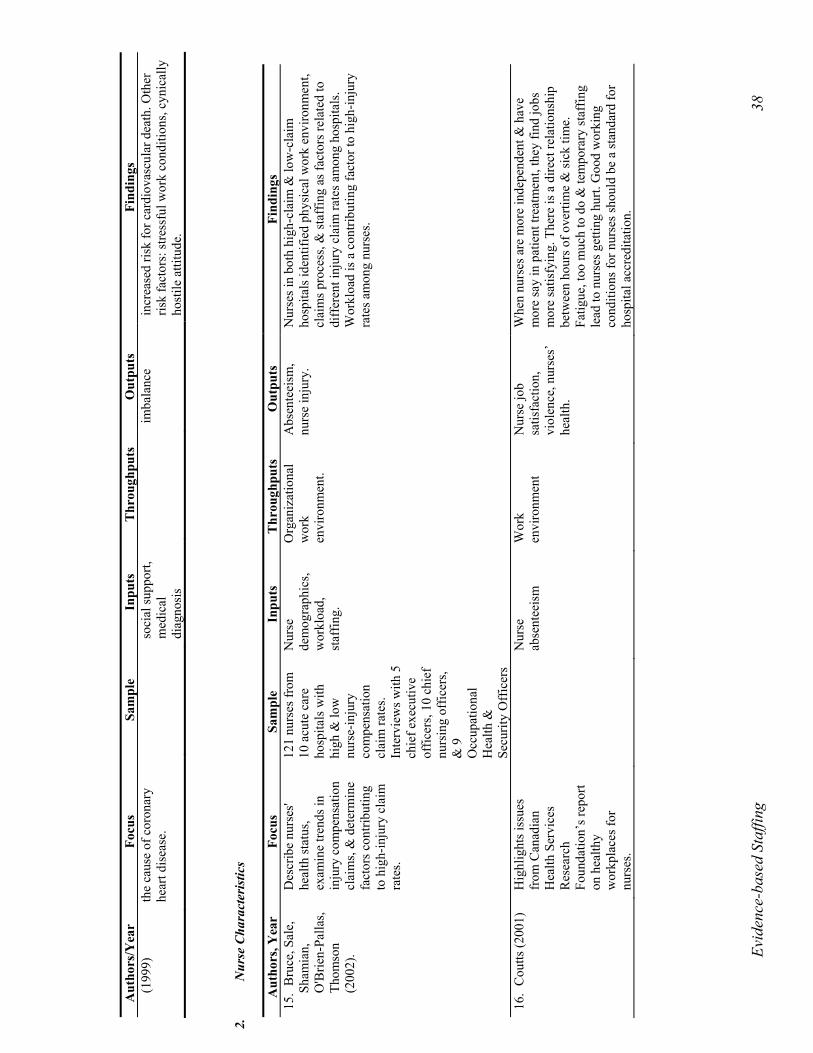
14.
Step
toe
Psyc
hoso
cial
fact
ors i
n
Occ
upat
ion,
Effo
rt &
rew
ard
Thos
e w
ith fe
wer
soci
al su
ppor
ts w
ere
at
Evid
ence
-bas
ed S
taffi
ng
38
Aut
hors
/Yea
r Fo
cus
Sam
ple
Inpu
ts
Thr
ough
puts
O
utpu
ts
Find
ings
(1
999)
th
e ca
use
of c
oron
ary
hear
t dis
ease
. so
cial
supp
ort,
med
ical
di
agno
sis
imba
lanc
e in
crea
sed
risk
for c
ardi
ovas
cula
r dea
th. O
ther
ris
k fa
ctor
s: st
ress
ful w
ork
cond
ition
s, cy
nica
lly
host
ile a
ttitu
de.
2.
Nur
se C
hara
cter
istic
s
Aut
hors
, Yea
r Fo
cus
Sam
ple
In
puts
T
hrou
ghpu
ts
Out
puts
Fi
ndin
gs
15.
Bru
ce, S
ale,
Sh
amia
n,
O'B
rien-
Palla
s, Th
omso
n (2
002)
.
Des
crib
e nu
rses
' he
alth
stat
us,
exam
ine
trend
s in
inju
ry c
ompe
nsat
ion
clai
ms,
& d
eter
min
e fa
ctor
s con
tribu
ting
to h
igh-
inju
ry c
laim
ra
tes.
121
nurs
es fr
om
10 a
cute
car
e ho
spita
ls w
ith
high
& lo
w
nurs
e-in
jury
co
mpe
nsat
ion
clai
m ra
tes.
Inte
rvie
ws w
ith 5
ch
ief e
xecu
tive
offic
ers,
10 c
hief
nu
rsin
g of
ficer
s, &
9
Occ
upat
iona
l H
ealth
&
Secu
rity
Off
icer
s
Nur
se
dem
ogra
phic
s, w
orkl
oad,
st
affin
g.
Org
aniz
atio
nal
wor
k en
viro
nmen
t.
Abs
ente
eism
, nu
rse
inju
ry.
Nur
ses i
n bo
th h
igh-
clai
m &
low
-cla
im
hosp
itals
iden
tifie
d ph
ysic
al w
ork
envi
ronm
ent,
clai
ms p
roce
ss, &
staf
fing
as fa
ctor
s rel
ated
to
diff
eren
t inj
ury
clai
m ra
tes a
mon
g ho
spita
ls.
Wor
kloa
d is
a c
ontri
butin
g fa
ctor
to h
igh-
inju
ry
rate
s am
ong
nurs
es.
16.
Cou
tts (2
001)
Hig
hlig
hts i
ssue
s fr
om C
anad
ian
Hea
lth S
ervi
ces
Res
earc
h Fo
unda
tion’
s rep
ort
on h
ealth
y w
orkp
lace
s for
nu
rses
.
N
urse
ab
sent
eeis
m
Wor
k en
viro
nmen
t N
urse
job
satis
fact
ion,
vi
olen
ce, n
urse
s’
heal
th.
Whe
n nu
rses
are
mor
e in
depe
nden
t & h
ave
mor
e sa
y in
pat
ient
trea
tmen
t, th
ey fi
nd jo
bs
mor
e sa
tisfy
ing.
The
re is
a d
irect
rela
tions
hip
betw
een
hour
s of o
verti
me
& si
ck ti
me.
Fa
tigue
, too
muc
h to
do
& te
mpo
rary
staf
fing
lead
to n
urse
s get
ting
hurt.
Goo
d w
orki
ng
cond
ition
s for
nur
ses s
houl
d be
a st
anda
rd fo
r ho
spita
l acc
redi
tatio
n.
Evid
ence
-bas
ed S
taffi
ng
39
Aut
hors
, Yea
r Fo
cus
Sam
ple
In
puts
T
hrou
ghpu
ts
Out
puts
Fi
ndin
gs
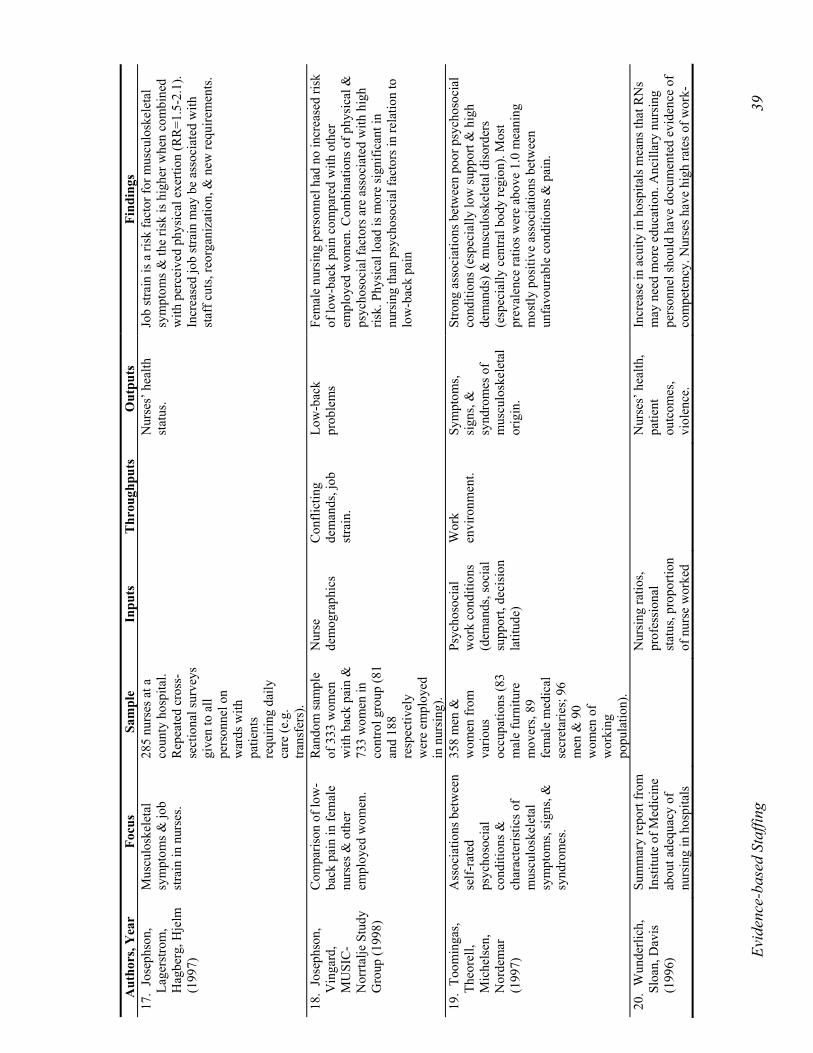
17.
Jose
phso
n,
Lage
rstro
m,
Hag
berg
, Hje
lm
(199
7)
Mus
culo
skel
etal
sy
mpt
oms &
job
stra
in in
nur
ses.
285
nurs
es a
t a
coun
ty h
ospi
tal.
Rep
eate
d cr
oss-
sect
iona
l sur
veys
gi
ven
to a
ll pe
rson
nel o
n w
ards
with
pa
tient
s re
quiri
ng d
aily
ca
re (e
.g.
trans
fers
).
Nur
ses’
hea
lth
stat
us.
Job
stra
in is
a ri
sk fa
ctor
for m
uscu
losk
elet
al
sym
ptom
s & th
e ris
k is
hig
her w
hen
com
bine
d w
ith p
erce
ived
phy
sica
l exe
rtion
(RR
=1.5
-2.1
). In
crea
sed
job
stra
in m
ay b
e as
soci
ated
with
st
aff c
uts,
reor
gani
zatio
n, &
new
requ
irem
ents
.
18.
Jose
phso
n,
Vin
gard
, M
USI
C-
Nor
rtalje
Stu
dy
Gro
up (1
998)
Com
paris
on o
f low
-ba
ck p
ain
in fe
mal
e nu
rses
& o
ther
em
ploy
ed w
omen
.
Ran
dom
sam
ple
of 3
33 w
omen
w
ith b
ack
pain
&
733
wom
en in
co
ntro
l gro
up (8
1 an
d 18
8 re
spec
tivel
y w
ere
empl
oyed
in
nur
sing
).
Nur
se
dem
ogra
phic
s C
onfli
ctin
g de
man
ds, j
ob
stra
in.
Low
-bac
k pr
oble
ms
Fem
ale
nurs
ing
pers
onne
l had
no
incr
ease
d ris
k of
low
-bac
k pa
in c
ompa
red
with
oth
er
empl
oyed
wom
en. C
ombi
natio
ns o
f phy
sica
l &
psyc
hoso
cial
fact
ors a
re a
ssoc
iate
d w
ith h
igh
risk.
Phy
sica
l loa
d is
mor
e si
gnifi
cant
in
nurs
ing
than
psy
chos
ocia
l fac
tors
in re
latio
n to
lo
w-b
ack
pain
19.
Toom
inga
s, Th
eore
ll,
Mic
hels
en,
Nor
dem
ar
(199
7)
Ass
ocia
tions
bet
wee
n se
lf-ra
ted
psyc
hoso
cial
co
nditi
ons &
ch
arac
teris
tics o
f m
uscu
losk
elet
al
sym
ptom
s, si
gns,
&
synd
rom
es.
358
men
&
wom
en fr
om
vario
us
occu
patio
ns (8
3 m
ale
furn
iture
m
over
s, 89
fe
mal
e m
edic
al
secr
etar
ies;
96
men
& 9
0 w
omen
of
wor
king
po
pula
tion)
.
Psyc
hoso
cial
w
ork
cond
ition
s (d
eman
ds, s
ocia
l su
ppor
t, de
cisi
on
latit
ude)
Wor
k en
viro
nmen
t. Sy
mpt
oms,
sign
s, &
sy
ndro
mes
of
mus
culo
skel
etal
or
igin
.
Stro
ng a
ssoc
iatio
ns b
etw
een
poor
psy
chos
ocia
l co
nditi
ons (
espe
cial
ly lo
w su
ppor
t & h
igh
dem
ands
) & m
uscu
losk
elet
al d
isor
ders
(e
spec
ially
cen
tral b
ody
regi
on).
Mos
t pr
eval
ence
ratio
s wer
e ab
ove
1.0
mea
ning
m
ostly
pos
itive
ass
ocia
tions
bet
wee
n un
favo
urab
le c
ondi
tions
& p
ain.
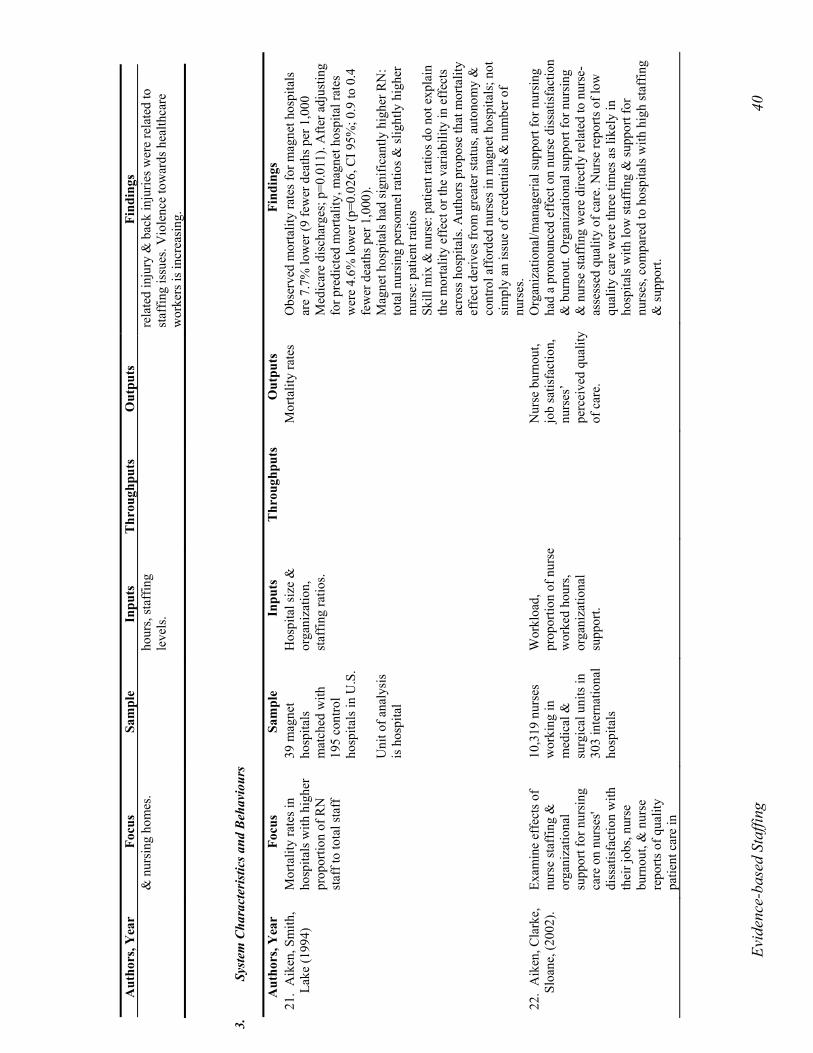
20.
Wun
derli
ch,
Sloa
n, D
avis
(1
996)
Sum
mar
y re
port
from
In
stitu
te o
f Med
icin
e ab
out a
dequ
acy
of
nurs
ing
in h
ospi
tals
N
ursi
ng ra
tios,
prof
essi
onal
st
atus
, pro
porti
on
of n
urse
wor
ked
N
urse
s’ h
ealth
, pa
tient
ou
tcom
es,
viol
ence
.
Incr
ease
in a
cuity
in h
ospi
tals
mea
ns th
at R
Ns
may
nee
d m
ore
educ
atio
n. A
ncill
ary
nurs
ing
pers
onne
l sho
uld
have
doc
umen
ted
evid
ence
of
com
pete
ncy.
Nur
ses h
ave
high
rate
s of w
ork-
Evid
ence
-bas
ed S
taffi
ng
40
Aut
hors
, Yea
r Fo
cus
Sam
ple
In
puts
T
hrou
ghpu
ts
Out
puts
Fi
ndin
gs
& n
ursi
ng h
omes
. ho
urs,
staf
fing
leve
ls.
rela
ted
inju
ry &
bac
k in
jurie
s wer
e re
late
d to
st
affin
g is
sues
. Vio
lenc
e to
war
ds h
ealth
care
w
orke
rs is
incr
easi
ng.
3.
Sy
stem
Cha
ract
eris
tics a
nd B
ehav
iour
s
Aut
hors
, Yea
r Fo
cus
Sam
ple
In
puts
T
hrou
ghpu
ts
Out
puts
Fi
ndin
gs
21.
Aik
en, S
mith
, La
ke (1
994)
M
orta
lity
rate
s in
hosp
itals
with
hig
her
prop
ortio
n of
RN
st
aff t
o to
tal s
taff
39 m
agne
t ho
spita
ls
mat
ched
with
19
5 co
ntro
l ho
spita
ls in
U.S
. U
nit o
f ana
lysi
s is
hos
pita
l
Hos
pita
l siz
e &
or
gani
zatio
n,
staf
fing
ratio
s.
M
orta
lity
rate
s O
bser
ved
mor
talit
y ra
tes f
or m
agne
t hos
pita
ls
are
7.7%
low
er (9
few
er d
eath
s per
1,0
00
Med
icar
e di
scha
rges
; p=0
.011
). A
fter a
djus
ting
for p
redi
cted
mor
talit
y, m
agne
t hos
pita
l rat
es
wer
e 4.
6% lo
wer
(p=0
.026
, CI 9
5%; 0
.9 to
0.4
fe
wer
dea
ths p
er 1
,000
). M
agne
t hos
pita
ls h
ad si
gnifi
cant
ly h
ighe
r RN
: to
tal n
ursi
ng p
erso
nnel
ratio
s & sl
ight
ly h
ighe
r nu
rse:
pat
ient
ratio
s Sk
ill m
ix &
nur
se: p
atie
nt ra
tios d
o no
t exp
lain
th
e m
orta
lity
effe
ct o
r the
var
iabi
lity
in e
ffec
ts
acro
ss h
ospi
tals
. Aut
hors
pro
pose
that
mor
talit
y ef
fect
der
ives
from
gre
ater
stat
us, a
uton
omy
&
cont
rol a
ffor
ded
nurs
es in
mag
net h
ospi
tals
; not
si
mpl
y an
issu
e of
cre
dent
ials
& n
umbe
r of
nurs
es.
22.
Aik
en, C
lark
e,
Sloa
ne, (
2002
).
Exam
ine
effe
cts o
f nu
rse
staf
fing
&
orga
niza
tiona
l su
ppor
t for
nur
sing
ca
re o
n nu
rses
' di
ssat
isfa
ctio
n w
ith
thei
r job
s, nu
rse
burn
out,
& n
urse
re
ports
of q
ualit
y pa
tient
car
e in
10,3
19 n
urse
s w
orki
ng in
m
edic
al &
su
rgic
al u
nits
in
303
inte
rnat
iona
l ho
spita
ls
Wor
kloa
d,
prop
ortio
n of
nur
se
wor
ked
hour
s, or
gani
zatio
nal
supp
ort.
N
urse
bur
nout
, jo
b sa
tisfa
ctio
n,
nurs
es’
perc
eive
d qu
ality
of
car
e.
Org
aniz
atio
nal/m
anag
eria
l sup
port
for n
ursi
ng
had
a pr
onou
nced
eff
ect o
n nu
rse
diss
atis
fact
ion
& b
urno
ut. O
rgan
izat
iona
l sup
port
for n
ursi
ng
& n
urse
staf
fing
wer
e di
rect
ly re
late
d to
nur
se-
asse
ssed
qua
lity
of c
are.
Nur
se re
ports
of l
ow
qual
ity c
are
wer
e th
ree
times
as l
ikel
y in
ho
spita
ls w
ith lo
w st
affin
g &
supp
ort f
or
nurs
es, c
ompa
red
to h
ospi
tals
with
hig
h st
affin
g &
supp
ort.
Evid
ence
-bas
ed S
taffi
ng
41
Aut
hors
, Yea
r Fo
cus
Sam
ple
In
puts
T
hrou
ghpu
ts
Out
puts
Fi
ndin
gs
hosp
itals
. 23
. A
iken
, Cla
rke,
Sl
oane
, So
chal
ski,
Silb
er (2
002)
.
Det
erm
ine
asso
ciat
ion
betw
een
patie
nt-to
-nur
se ra
tio
& p
atie
nt m
orta
lity,
fa
ilure
am
ong
surg
ical
pat
ient
s, &
fa
ctor
s rel
ated
to
nurs
e re
tent
ion.
210
adul
t gen
eral
ho
spita
ls; 1
0,18
4 st
aff n
urse
s ra
ndom
ly
surv
eyed
; 23
2,34
2 pa
tient
s di
scha
rged
.
Nur
se
dem
ogra
phic
s, pr
ofes
sion
al st
atus
, m
edic
al d
iagn
osis
, pa
tient
de
mog
raph
ics,
hosp
ital s
ize.
N
urse
job
satis
fact
ion,
bu
rnou
t, pa
tient
m
orta
lity,
cos
ts,
and
com
plic
atio
ns.
In h
ospi
tals
with
hig
h pa
tient
-to-n
urse
ratio
s, su
rgic
al p
atie
nts e
xper
ienc
e hi
gher
risk
-ad
just
ed 3
0-da
y m
orta
lity
& fa
ilure
-to-r
escu
e ra
tes (
odds
ratio
1.0
7), &
nur
ses a
re m
ore
likel
y to
exp
erie
nce
burn
out &
job
diss
atis
fact
ion
(odd
s rat
io fo
r dis
satis
fact
ion
is 1
.15)
.
24.
Arth
ur, J
ames
(1
994)
Li
tera
ture
revi
ew o
f va
rious
met
hods
of
nurs
e st
affin
g le
vel
mea
sure
men
t.
Pa
tient
de
mog
raph
ics,
nurs
ing
inte
rven
tions
, pa
tient
de
pend
ency
, and
pr
opor
tion
of n
urse
w
orke
d ho
urs.
Wor
kloa
d m
easu
rem
ent.
Staf
fing
ratio
s, le
ngth
of s
tay.
V
ario
us a
ppro
ache
s to
nurs
e de
man
d m
etho
ds:
cons
ensu
s (in
tuiti
ve, c
onsu
ltativ
e m
etho
d), t
op-
dow
n m
anag
emen
t (st
affin
g no
rms,
staf
fing
form
ulae
), &
bot
tom
-up
man
agem
ent (
nurs
ing
inte
rven
tions
, pat
ient
dep
ende
ncy)
. Deb
ates
su
rrou
ndin
g th
ese
met
hods
incl
ude:
co
mpa
rabi
lity
vs. l
ocal
suita
bilit
y, c
ontro
l, ef
ficie
ncy,
eff
ectiv
enes
s, &
phi
loso
phy
of c
are.
25
. B
aker
, M
essm
er,
Gyu
rko,
D
omag
ala,
Fr
ankl
in, E
ads,
Har
shm
an,
Layn
e (2
000)
Hos
pita
l ow
ners
hip,
pe
rfor
man
ce, &
ou
tcom
es.
6,09
7 ho
spita
ls
in th
e U
.S.
Hos
pita
l ow
ners
hip
type
(pub
lic,
priv
ate-
for p
rofit
, pr
ivat
e no
n-pr
ofit)
, pe
rfor
man
ce
Org
aniz
atio
nal
wor
k en
viro
nmen
t.
Adv
erse
eve
nts,
mor
bidi
ty,
mor
talit
y, p
atie
nt
satis
fact
ion,
nu
rse
satis
fact
ion,
co
sts,
prod
uctiv
ity.
Hos
pita
l ow
ners
hip
has a
n im
pact
on
hosp
ital
perf
orm
ance
in re
latio
n to
syst
em o
pera
tions
: co
sts,
pric
es, &
fina
ncia
l man
agem
ent
prac
tices
; & p
erso
nal i
ssue
s. A
ssoc
iatio
n be
twee
n ho
spita
l ow
ners
hip
& a
dver
se e
vent
s co
nsis
tent
ly su
ppor
ted.
26.
Ble
gen,
V
augh
n (1
998)
Nur
se st
affin
g &
pa
tient
occ
urre
nces
. 39
uni
ts in
11
hosp
itals
. St
affin
g m
ix, t
ype
of u
nit.
Pa
tient
co
mpl
icat
ions
(m
ed e
rror
s, fa
lls),
card
iopu
lmon
ary
arre
sts.
Hig
her p
ropo
rtion
of R
Ns r
esul
ted
in fe
wer
pa
tient
com
plic
atio
ns (m
ed e
rror
s/do
se R
2 =-0.
576,
falls
R2 =-
0.45
6) b
ut th
e re
latio
nshi
p is
no
t lin
ear.
Uni
ts w
ith R
N p
ropo
rtion
>85
% h
ad
high
er m
ed e
rror
s (m
ay b
e he
ight
ened
vi
gila
nce,
sick
er p
atie
nts w
ith m
ore
med
s).
27.
Ble
gen,
G
oode
, Ree
d,
(199
8).
Rel
atio
nshi
p am
ong
inci
denc
e ra
tes o
f 6
adve
rse
pt. o
utco
mes
, th
e ho
urs o
f car
e
42 in
patie
nt u
nits
in
an
880-
bed
univ
ersi
ty
hosp
ital.
Patie
nt a
cuity
: (u
niqu
e Pa
tient
C
lass
ifica
tion
Syst
em; l
evel
s
Pa
tient
ou
tcom
es:
med
icat
ion
erro
rs p
er 1
0,00
0
Con
trolli
ng fo
r ave
rage
pat
ient
acu
ity a
djus
ted
at u
nit l
evel
, RN
pro
porti
on w
as in
vers
ely
rela
ted
to th
e un
it ra
tes o
f med
icat
ion
erro
rs,
decu
biti,
& p
atie
nt c
ompl
aint
s. To
tal h
ours
of
Evid
ence
-bas
ed S
taffi
ng
42
Aut
hors
, Yea
r Fo
cus
Sam
ple
In
puts
T
hrou
ghpu
ts
Out
puts
Fi
ndin
gs
prov
ided
by
all
nurs
ing
pers
onne
l &
the
prop
ortio
n of
th
ose
care
hou
rs
give
n by
RN
s.
21,7
83
disc
harg
es &
19
8,96
2 pa
tient
da
ys o
f car
e pr
ovid
ed b
y 10
74 F
TE
nurs
ing
staf
f m
embe
rs, 8
32 o
f th
ose
FTEs
wer
e R
Ns.
Fisc
al y
ear 1
993.
rang
e be
twee
n 1
and
7 m
ost
acut
e/m
ost c
are)
N
urse
staf
fing:
All
Hou
rs (m
onth
ly
hour
s of c
are
patie
nt p
er d
ay b
y R
Ns,
LPN
s, N
As/
patie
nt d
ays
on u
nit);
RN
Hou
rs
(hou
rs o
f dire
ct R
N
patie
nt c
are/
patie
nt
days
); R
N
prop
ortio
n (R
N
hour
s pat
ient
per
da
y/A
ll H
ours
)
dose
s (nu
rse
self-
repo
rt), f
alls
, de
cubi
ti, u
rinar
y &
resp
irato
ry
infe
ctio
ns,
patie
nt
com
plai
nts p
er
1,00
0 pa
tient
da
ys &
mor
talit
y ra
tes p
er 1
,000
pa
tient
day
s.
care
from
all
nurs
ing
pers
onne
l wer
e as
soci
ated
di
rect
ly w
ith c
ompl
aint
s, de
cubi
ti, &
mor
talit
y;
how
ever
tota
l hou
rs o
f car
e w
ere
high
ly
corr
elat
ed w
ith a
cuity
. A
larg
er p
ropo
rtion
of c
are
deliv
ery
by R
Ns
was
ass
ocia
ted
with
a d
ecre
ase
in a
dver
se p
t ou
tcom
es u
p to
a le
vel o
f 87.
5% o
f RN
staf
fing.
W
hen
the
prop
ortio
n of
RN
s in
the
staf
f mix
w
as g
reat
er th
an 8
7.5%
, adv
erse
out
com
es a
lso
incr
ease
d.
28.
Bro
wn
(200
1)
Syno
psis
of A
NA
st
udy
on re
latio
nshi
p be
twee
n st
affin
g &
pa
tient
out
com
es.
Nea
rly 1
3 m
illio
n pa
tient
s in
150
0 ho
spita
ls
from
9 st
ates
Prop
ortio
n of
nur
se
wor
ked
hour
s, m
edic
al d
iagn
osis
.
St
affin
g ra
tios,
patie
nt
com
plic
atio
ns &
ou
tcom
es, l
engt
h of
stay
Seve
ral p
atie
nt o
utco
mes
wer
e si
gnifi
cant
ly
rela
ted
to st
affin
g (le
ngth
of s
tay,
pne
umon
ia,
post
-op
infe
ctio
ns, u
lcer
s, ur
inar
y ta
ct
infe
ctio
ns).
Cos
t sav
ings
in re
duct
ions
of s
taff
&
mix
may
not
be
real
savi
ngs w
hen
com
plic
atio
ns &
incr
ease
d le
ngth
of s
tay
are
cons
ider
ed.
29.
Bue
rhau
s (1
997)
M
anda
tory
min
imum
nu
rse
staf
fing
leve
ls
in h
ospi
tals
Pr
opor
tion
of n
urse
w
orke
d ho
urs,
nurs
e-to
-pat
ient
ra
tio
C
osts
of c
are,
cl
inic
al
outc
omes
Staf
fing
regu
latio
ns (i
f im
pose
d) w
ould
forc
e em
ploy
ers t
o ig
nore
dyn
amic
inte
ract
ions
of
econ
omic
, tec
hnol
ogy,
cap
ital &
labo
ur su
pply
va
riabl
es. T
here
wou
ld b
e si
gnifi
cant
cos
ts
asso
ciat
ed w
ith e
nfor
cing
the
regu
latio
n w
hich
w
ould
out
wei
gh th
e be
nefit
s.
Evid
ence
-bas
ed S
taffi
ng
43
Aut
hors
, Yea
r Fo
cus
Sam
ple
In
puts
T
hrou
ghpu
ts
Out
puts
Fi
ndin
gs
30.
Bur
ke (2
003)
Rel
atio
nshi
p be
twee
n ch
ange
s in
patie
nt-
nurs
e ra
tios r
esul
ting
from
hos
pita
l re
stru
ctur
ing
&
nurs
ing
staf
f sa
tisfa
ctio
n,
psyc
holo
gica
l hea
lth,
& p
erce
ptio
ns o
f ho
spita
l fun
ctio
ning
.
Self-
repo
rt su
rvey
of 7
44
hosp
ital-b
ased
nu
rsin
g su
rviv
ors.
1st
wav
e N
ov.
1996
. 2nd
wav
e N
ov. 1
999.
Patie
nt-n
urse
ratio
: cu
rren
t & c
hang
es
sinc
e re
stru
ctur
ing
bega
n N
urse
: exp
erie
nce,
em
ploy
men
t sta
tus,
educ
atio
n,
dem
ogra
phic
s H
ospi
tal:
size
W
ork
outc
omes
, w
ork
expe
rienc
es:
exte
nt o
f re
stru
ctur
ing,
pe
rcei
ved
wor
kloa
d, jo
b se
curit
y,
psyc
holo
gica
l he
alth
, hos
pita
l ef
fect
iven
ess:
53%
of n
urse
s rep
orte
d an
incr
ease
d pa
tient
-nu
rse
ratio
. Inc
reas
ed ra
tios a
ssoc
iate
d w
ith le
ss
job
satis
fact
ion
& jo
b se
curit
y, g
reat
er in
tent
ion
to q
uit &
mor
e re
stru
ctur
ing
initi
ativ
es, p
oore
r ps
ycho
logi
cal (
but n
ot p
hysi
cal)
heal
th, &
less
ef
fect
ive
hosp
ital f
unct
ioni
ng.
31.
Cal
iforn
ia
Nur
ses
Ass
ocia
tion.
(2
001)
Rea
sons
for t
he C
NA
ba
cked
nur
se-to
-pa
tient
ratio
s.
M
edic
al d
iagn
osis
Staf
fing
ratio
s St
rong
ratio
s will
hel
p re
duce
the
nurs
ing
shor
tage
. The
y m
ust b
e de
term
ined
in
acco
rdan
ce to
indi
vidu
al p
atie
nt c
are
need
s.
32.
Cal
lagh
an,
Car
twrig
ht,
O’R
ourk
e,
Dav
ies (
2003
)
Rel
atio
nshi
p be
twee
n in
fant
to st
aff r
atio
s in
firs
t thr
ee d
ays o
f lif
e on
the
surv
ival
to
hosp
ital d
isch
arge
692
very
low
bi
rth w
eigh
t in
fant
s in
an
Aus
tralia
n in
tens
ive
care
un
it Ja
n. 1
996
– D
ec.
1999
Infa
nt
char
acte
ristic
s:
depe
nden
cy
(infa
nt:n
urse
ratio
s:
inte
nsiv
e 1:
1, h
igh
1:2,
med
ium
1:3
, &
reco
very
1:5
), bi
rth
hist
ory,
adm
issi
on
& p
hysi
olog
ical
da
ta
Staf
fing:
num
ber o
f nu
rses
wor
king
per
sh
ift, m
axim
um
num
ber o
f inf
ants
pe
r shi
ft
Su
rviv
al to
ho
spita
l di
scha
rge,
ad
just
ed fo
r in
itial
risk
(usi
ng
Clin
ical
Ris
k In
dex
for B
abie
s)
& fo
r uni
t w
orkl
oad
(infa
nt
depe
nden
cy
scor
es)
Ove
rall
hosp
ital m
orta
lity
rate
of 1
2% (8
0 ou
t of
692
infa
nts)
. O
dds o
f mor
talit
y, a
djus
ted
for i
nitia
l ris
k &
un
it w
orkl
oad
impr
oved
by
82%
whe
n an
in
fant
:sta
ff ra
tio o
f gre
ater
than
1.7
1 oc
curr
ed.
33.
Cam
pbel
l, Ta
ylor
, C
alla
ghan
, Sh
uldh
am
Usi
ng c
ase
mix
gro
up
to p
redi
ct w
orkl
oad.
79
8 pa
tient
s &
30 n
urse
s fro
m
one
war
d.
Ret
rosp
ectiv
e
Patie
nt
dem
ogra
phic
s, ad
mis
sion
type
, ca
se m
ix g
roup
.
Wor
kloa
d C
osts
of c
are,
le
ngth
of s
tay.
R
egre
ssio
n an
alys
is sh
owed
that
ther
e w
as n
o re
latio
nshi
p be
twee
n re
sour
ces u
sed
& n
ursi
ng
clin
ical
hou
rs; h
owev
er, t
here
was
a g
ood
rela
tions
hip
betw
een
the
num
ber o
f pat
ient
s &
Evid
ence
-bas
ed S
taffi
ng
44
Aut
hors
, Yea
r Fo
cus
Sam
ple
In
puts
T
hrou
ghpu
ts
Out
puts
Fi
ndin
gs
(199
7)
data
from
ho
spita
l pt.
adm
inis
tratio
n sy
stem
.
reso
urce
s use
d. A
vera
ge le
ngth
s of s
tay
for c
ase
mix
gro
ups w
ere
grea
ter t
han
pred
icte
d. F
or
cyst
ic fi
bros
is p
atie
nts (
repr
esen
tativ
e of
sp
ecia
list n
ursi
ng),
case
mix
gro
up a
ccou
nted
fo
r onl
y 18
% o
f var
iatio
n in
nur
sing
tim
e re
quire
d. C
ase
mix
gro
up h
as sh
own
to b
e a
poor
pre
dict
or o
f nur
sing
requ
irem
ent.
34.
Can
adia
n La
bour
&
Bus
ines
s Cen
tre
(200
2).
Cos
t ass
ocia
ted
with
ab
sent
eeis
m,
over
time,
&
invo
lunt
ary
part-
time
empl
oym
ent.
201
bed
hosp
ital
in O
ttaw
a.
Nur
se
dem
ogra
phic
s.
Cos
ts o
f car
e,
abse
ntee
ism
, use
of
age
ncy
nurs
es,
turn
over
.
Ove
rtim
e ho
urs h
ave
incr
ease
d dr
amat
ical
ly
over
pas
t 3 y
ears
. Age
ncy
cost
s rep
rese
nt 3
4 %
of
ove
rtim
e co
sts.
Ther
e ar
e es
timat
es th
at 2
5-30
% o
f abs
ente
eism
is re
late
d to
stre
ss &
in
jury
. Add
ition
al fu
ll-tim
e eq
uiva
lent
s wou
ld
redu
ce c
osts
. 35
. C
lark
(200
2)
Effe
ct o
f nur
se
staf
fing
leve
ls o
n ad
vers
e ev
ents
.
Dat
a fr
om 7
99
hosp
itals
in 1
1 st
ates
.
Prop
ortio
n of
nur
se
wor
ked
hour
s.
Patie
nt
com
plic
atio
ns &
ou
tcom
es, l
engt
h of
stay
, sta
ffin
g ra
tios.
Hig
her p
ropo
rtion
of R
Ns r
esul
ted
in b
ette
r ca
re. N
o as
soci
atio
n be
twee
n lo
wer
rate
s of
outc
omes
& n
umbe
r of h
ours
of c
are
by L
PNs
or n
urse
s’ a
ides
.
Evid
ence
-bas
ed S
taffi
ng
45
Aut
hors
, Yea
r Fo
cus
Sam
ple
In
puts
T
hrou
ghpu
ts
Out
puts
Fi
ndin
gs
36.
Cla
rke,
R
ocke
tt, S
loan
e,
Aik
en (2
002)
Org
aniz
atio
nal
clim
ate,
staf
fing,
&
safe
ty e
quip
men
t
1998
surv
ey d
ata
for 2
287
med
ical
su
rgic
al u
nit
nurs
es in
22
US
hosp
itals
(20
wer
e m
agne
t ho
spita
ls).
1998
su
rvey
of
man
agem
ent,
infe
ctio
n co
ntro
l, pu
rcha
sing
of
ficia
ls re
: eq
uipm
ent
sele
ctio
n &
pr
ocur
emen
t
Self-
repo
rt co
mpl
ianc
e w
ith
univ
ersa
l pr
ecau
tions
&
perc
eive
d ris
k -
Nur
se
char
acte
ristic
s. Pr
otec
tive
Equi
pmen
t. N
urse
staf
fing:
pa
tient
s car
ed fo
r on
last
shift
w
orke
d; h
ospi
tal-
leve
l mea
sure
av
erag
ing
patie
nt
load
s, or
gani
zatio
nal
clim
ate
(R-N
WI)
- N
eedl
estic
k in
jurie
s & n
ear-
mis
ses:
self-
repo
rt oc
curr
ence
, fr
eque
ncy
in p
ast
mon
th &
pas
t ye
ar,
circ
umst
ance
s, re
porti
ng
- Ave
rage
day
shift
wor
kloa
d ra
nged
from
3.6
to
8.7
pat
ient
s per
nur
se (n
= 2
2)
- In
n=5,
ave
rage
day
shift
wor
kloa
d of
mor
e th
an 6
pat
ient
s (he
avie
st w
orkl
oad)
- n
urse
s with
hea
vies
t wor
kloa
d w
ere
50%
m
ore
likel
y to
repo
rt an
inju
ry &
40%
mor
e lik
ely
to re
port
a ne
ar-m
iss i
n th
e pr
eced
ing
mon
th
37.
Coc
keril
l, O
’Brie
n-Pa
llas,
Bol
ley,
Pin
k (1
993)
Mea
surin
g nu
rsin
g co
sts u
sing
nur
sing
w
orkl
oad.
256
patie
nt
reco
rds f
rom
4
units
in a
larg
e te
achi
ng
hosp
ital.
Cas
e m
ix g
roup
W
orkl
oad
(GR
ASP
, NIS
S,
Med
icus
, PR
N)
Cos
ts o
f car
e.
Ther
e w
ere
signi
fican
t diff
eren
ces a
mon
g sy
stem
s in
estim
ates
of c
are
for p
atie
nts.
Nur
sing
cos
ts p
er c
ase
diff
er si
gnifi
cant
ly
depe
ndin
g so
lely
on
wor
kloa
d m
easu
rem
ent
syst
em u
sed
(as m
uch
as 3
0% d
iffer
ence
in c
ost
for s
ame
patie
nt).
38
. D
oran
, M
cGill
is H
all,
Sida
ni,
O’B
rien-
Palla
s, D
onne
r, B
aker
, Pi
nk (2
001)
Effe
ct o
f nur
se
staf
fing
issu
es o
n nu
rse
com
mun
icat
ion
& p
atie
nt o
utco
mes
.
1116
nur
ses f
rom
19
urb
an
teac
hing
ho
spita
ls.
Stra
tifie
d ra
ndom
sam
ple,
97
% re
spon
se
rate
.
Staf
fing
ratio
s, pr
opor
tion
of n
urse
w
orke
d ho
urs,
patie
nt
dem
ogra
phic
s, ca
se
mix
gro
ups,
nurs
e ed
ucat
ion,
ex
perie
nce.
Pa
tient
hea
lth
stat
us.
Hig
her m
ix o
f RN
s im
prov
ed c
omm
unic
atio
n &
le
d to
ben
efic
ial p
atie
nt o
utco
mes
. Nur
se-
patie
nt ra
tio (r
=0.1
38) &
pro
porti
on o
f re
gula
ted
staf
f (r=
0.15
5) p
ositi
vely
aff
ecte
d nu
rse
com
mun
icat
ion.
Eff
ectiv
e co
mm
unic
atio
n am
ong
nurs
es le
d to
bet
ter p
atie
nt h
ealth
ou
tcom
es (r
=0.1
75).
39. E
isen
berg
, B
owm
an, F
oste
r (2
001)
Impa
ct o
f wor
kpla
ce
heal
th o
n qu
ality
of
care
.
St
affin
g m
ix, r
atio
s W
ork
envi
ronm
ent
Cos
ts o
f car
e,
qual
ity o
f car
e En
viro
nmen
t, or
gani
zatio
n, st
affin
g, &
cul
ture
in
fluen
ce q
ualit
y of
car
e vi
a th
eir e
ffec
t on
the
heal
thy
wor
kpla
ce. A
dequ
ate
num
ber o
f sta
ff,
Evid
ence
-bas
ed S
taffi
ng
46
Aut
hors
, Yea
r Fo
cus
Sam
ple
In
puts
T
hrou
ghpu
ts
Out
puts
Fi
ndin
gs
appr
opria
te b
lend
of s
kills
& p
rope
r equ
ipm
ent
enab
le w
ork.
Hea
vy w
orkl
oads
inhi
bit s
taff
fr
om p
artic
ipat
ing
in re
sear
ch. E
nhan
cing
w
orke
rs’ h
ealth
& sa
tisfa
ctio
n m
ay im
prov
e pa
tient
out
com
es.
40.
Gau
ci B
orda
, N
orm
an (1
997)
Fa
ctor
s tha
t inf
luen
ce
turn
over
& a
bsen
ce
of n
urse
s, th
e re
latio
nshi
p be
twee
n ab
senc
e &
turn
over
.
17 st
udie
s on
rela
tions
hip
betw
een
job
satis
fact
ion,
in
tent
to
stay
/leav
e &
ac
tual
turn
over
.
Nur
se jo
b sa
tisfa
ctio
n, sy
stem
or
gani
zatio
nal
fact
ors.
N
urse
ab
sent
eeis
m,
turn
over
.
Job
satis
fact
ion
influ
ence
s abs
ence
& in
tent
to
stay
. Int
ent t
o st
ay in
cur
rent
em
ploy
men
t in
fluen
ces t
urno
ver.
Inte
nt to
stay
is m
ost
stro
ngly
ass
ocia
ted
with
job
satis
fact
ion.
Pay
&
oppo
rtuni
ty fo
r alte
rnat
ive
empl
oym
ent a
lso
influ
ence
inte
nt to
stay
, whi
ch is
supp
orte
d by
tw
o st
udie
s. A
bsen
ce is
pos
itive
ly re
late
d to
tu
rnov
er (a
bsen
ce in
crea
sed
befo
re tu
rnov
er) &
ne
gativ
ely
rela
ted
to in
tent
to st
ay. K
insh
ip
resp
onsi
bilit
y is
dire
ctly
rela
ted
to in
tent
to
stay
. 41
. G
audi
ne
(200
0)
Nur
ses’
vie
ws o
f w
orkl
oad
& w
ork
over
load
.
31 st
aff n
urse
s fr
om 9
diff
eren
t un
its o
f a
hosp
ital i
n ce
ntra
l Can
ada,
vo
lunt
eer
sam
plin
g.
Nur
se
dem
ogra
phic
s, ex
perie
nce,
and
pa
tient
acu
ity.
Sim
ulta
neou
s de
man
ds,
unan
ticip
ated
ev
ents
, in
terr
uptio
ns,
nois
e le
vel.
Nur
ses’
feel
ings
of
wor
kloa
d &
ov
erlo
ad.
Mea
ning
s tha
t nur
ses a
ttrib
uted
to w
orkl
oad
incl
ude
volu
me,
sim
ulta
neou
s dem
ands
, de
man
ds o
n se
lf, q
ualit
ativ
e ov
erlo
ad,
antic
ipat
ion,
resp
onsi
bilit
y, in
terd
epen
denc
e,
non-
wor
k ro
les &
exh
aust
ion.
The
mea
ning
s of
wor
k ov
erlo
ad in
clud
e si
mul
tane
ous d
eman
ds,
qual
itativ
e w
ork
over
load
, hea
vy lo
ad, &
re
spon
sibi
lity.
The
se m
eani
ngs i
nclu
de m
ore
dim
ensi
ons t
han
curr
ent m
easu
res o
f wor
kloa
d.
Evid
ence
-bas
ed S
taffi
ng
47
Aut
hors
, Yea
r Fo
cus
Sam
ple
In
puts
T
hrou
ghpu
ts
Out
puts
Fi
ndin
gs
42.
Gre
engl
ass,
Bur
ke (2
001)
Im
pact
of h
ospi
tal
rest
ruct
urin
g on
nu
rses
.
1363
nur
ses
empl
oyed
in
hosp
itals
un
derg
oing
re
stru
ctur
ing.
R
ando
m
sele
ctio
n fr
om
unio
n m
embe
rshi
p,
35%
resp
onse
ra
te.
Nur
se e
duca
tion,
de
mog
raph
ics,
hosp
ital s
ize.
Pe
rcei
ved
qual
ity
of c
are,
job
satis
fact
ion,
w
orki
ng
cond
ition
s.
Res
truct
urin
g ha
d a
nega
tive
effe
ct o
n st
aff
(97.
9% o
f res
pond
ents
agr
ee) &
wor
king
co
nditi
ons (
94%
). It
has c
ompr
omis
ed th
e qu
ality
of c
are
& re
duce
d nu
rses
’ abi
lity
to
prov
ide
serv
ices
for p
atie
nts.
Dur
ing
hosp
ital
rest
ruct
urin
g w
orkl
oad
was
the
mos
t sig
nific
ant
& c
onsi
sten
t pre
dict
or o
f dis
tress
in n
urse
s, as
m
anife
sted
in lo
wer
job
satis
fact
ion,
pr
ofes
sion
al e
ffic
acy,
& jo
b se
curit
y. G
reat
er
wor
kloa
d al
so c
ontri
bute
d to
dep
ress
ion,
cy
nici
sm, &
anx
iety
. 43
. G
rillo
-Pec
k,
Ris
ner (
1995
) Im
plem
enta
tion
of a
nu
rsin
g pa
rtner
ship
m
odel
.
156
patie
nts
from
a
neur
osci
ence
un
it in
an
800-
bed
not-f
or-
prof
it ho
spita
l in
Ohi
o.
Prop
ortio
n of
nur
se
wor
ked
hour
s, ca
re
deliv
ery
syst
em,
med
ical
dia
gnos
is,
patie
nt
dem
ogra
phic
s, an
d co
ntin
uity
of c
are.
Pa
tient
leng
th o
f st
ay,
com
plic
atio
ns
(infe
ctio
ns,
falls
), m
edic
atio
n er
rors
.
A n
ursi
ng p
artn
ersh
ip m
odel
whi
ch in
clud
ed a
de
crea
se in
RN
s & a
prim
ary
nurs
ing
mod
el
was
impl
emen
ted.
RN
s wer
e pa
rtner
ed w
ith a
pa
tient
car
e te
chni
cian
& a
ssis
ted
by se
rvic
e as
soci
ates
. Thi
s allo
wed
for c
ontin
uity
of c
are.
Pa
tient
com
plic
atio
ns sh
owed
a d
ownw
ard
trend
afte
r the
impl
emen
tatio
n &
leng
th o
f sta
y de
crea
sed.
RN
s wer
e ab
le to
spen
d le
ss ti
me
in
non-
prof
essi
onal
task
s. 44
. H
allo
ran
(198
5)
Effe
cts o
f var
iabl
es
on n
ursi
ng w
orkl
oad.
25
60 p
atie
nt
reco
rds &
141
nu
rsin
g st
aff
mem
bers
from
a
279-
bed
acut
e ca
re, c
omm
unity
ho
spita
l. Th
is
incl
uded
all
patie
nts a
dmitt
ed
& d
isch
arge
d ov
er a
4 m
onth
pe
riod.
Nur
sing
dia
gnos
es,
med
ical
dia
gnos
es
(DR
G),
patie
nt
dem
ogra
phic
s.
C
osts
of c
are,
nu
rsin
g w
orkl
oad.
Var
iatio
ns in
nur
sing
wor
kloa
d w
ere
bette
r ex
plai
ned
by n
ursi
ng c
ondi
tion
than
by
med
ical
co
nditi
on o
r pat
ient
dem
ogra
phic
s (75
% o
f the
su
m o
f the
squa
red
regr
essi
on c
oeff
icie
nt is
as
soci
ated
with
nur
sing
dia
gnos
is &
25
% is
as
soci
ated
with
med
ical
dia
gnos
is).
Ther
e w
as a
st
rong
pos
itive
rela
tions
hip
betw
een
wor
kloa
d &
leng
th o
f sta
y in
hos
pita
l (co
rrel
atio
n co
effic
ient
=0.7
74).
Of d
emog
raph
ic
char
acte
ristic
s, on
ly a
ge is
ass
ocia
ted
with
va
riatio
ns in
wor
kloa
d (r
=0.1
98).
45.
Har
tz,
Kra
kaue
r, K
uhn,
You
ng,
Fact
ors t
hat a
ffec
t pa
tient
mor
talit
y ra
tes.
3100
hos
pita
ls in
th
e U
nite
d St
ates
. Dat
a fr
om
Patie
nt
dem
ogra
phic
s, m
edic
al d
iagn
osis
,
Pa
tient
mor
talit
y.
Hig
her m
orta
lity
rate
s wer
e as
soci
ated
with
for-
prof
it (1
21/1
000
patie
nts v
s. av
erag
e of
11
6/10
00) &
pub
lic h
ospi
tals
(120
/100
0) &
Evid
ence
-bas
ed S
taffi
ng
48
Aut
hors
, Yea
r Fo
cus
Sam
ple
In
puts
T
hrou
ghpu
ts
Out
puts
Fi
ndin
gs
Jaco
bsen
, Gay
, M
uenz
, Kat
zoff
, B
aile
y, R
imm
(1
989)
the
Hea
lthca
re
Fina
ncin
g A
dmin
istra
tion
& th
e A
mer
ican
H
ospi
tal
Ass
ocia
tion
annu
al su
rvey
.
hosp
ital s
ize,
pr
opor
tion
of n
urse
w
orke
d ho
urs,
nurs
e ra
tios.
oste
opat
hic
hosp
itals
(129
/100
0). T
he
char
acte
ristic
s mos
t clo
sely
link
ed w
ith
mor
talit
y ar
e re
late
d to
trai
ning
of m
edic
al st
aff
(e.g
. hig
her p
erce
ntag
e of
RN
s = lo
wer
m
orta
lity)
. Hig
her o
ccup
ancy
rate
was
as
soci
ated
with
low
er m
orta
lity
rate
.
46.
Hen
drix
, Fo
rem
an (2
001)
Opt
imal
nur
se
staf
fing
leve
ls in
long
te
rm c
are.
Ove
r 12,
000
fede
rally
ce
rtifie
d sk
illed
&
inte
rmed
iate
nu
rsin
g ho
mes
in
the
Uni
ted
Stat
es
(dat
a fr
om
1994
).
Prop
ortio
n of
nur
se
wor
ked
hour
s, nu
rsin
g ra
tios.
C
ost o
f car
e,
cost
s of i
njur
y,
patie
nt o
utco
mes
(d
ecub
itus
ulce
rs),
publ
ic
burd
en.
Ther
e is
an
optim
al le
vel o
f nur
se st
affin
g th
at
min
imiz
es d
ecub
itus u
lcer
s in
nurs
ing
hom
es.
The
pres
ence
of R
Ns (
supe
rior s
kills
; ß=-
1.65
9)
& n
urse
s’ a
ides
(low
er w
age;
ß=-
7.33
4))
redu
ces c
osts
ass
ocia
ted
with
ulc
er c
are
whi
le
the
pres
ence
of L
PNs (
ß=4.
544)
incr
ease
s the
co
st o
f ulc
er c
are.
Nur
sing
hom
es sh
ould
in
crea
se th
e nu
mbe
r of R
Ns &
NA
s. 47
. K
enne
y.
(200
1)
Pilo
t pro
ject
for
impl
emen
ting
LPN
s to
mai
ntai
n qu
ality
du
ring
staf
fing
shor
tage
s.
St
affin
g m
ix,
ratio
s. W
orkl
oad.
N
urse
s’ h
ealth
, co
sts o
f car
e,
patie
nt
satis
fact
ion,
co
mpl
icat
ions
(f
alls
, med
er
rors
), nu
rse
satis
fact
ion
Ther
e w
ere
no c
hang
es in
qua
lity
of c
are
(num
ber o
f tre
atm
ent/p
roce
dure
err
ors &
falls
re
mai
ned
stab
le) o
r sta
ff sa
tisfa
ctio
n w
ith th
e ad
ditio
n of
LPN
s. LP
Ns w
ere
dele
gate
d to
task
s by
RN
s who
wer
e st
ill re
spon
sibl
e fo
r sev
eral
pa
tient
s.
48.
Kna
us, D
rape
r, W
agne
r, Zi
mm
erm
an
(198
6)
Influ
enci
ng fa
ctor
s on
mor
talit
y in
in
tens
ive
care
uni
ts.
5,03
0 pa
tient
s in
inte
nsiv
e ca
re
units
in 1
3 te
rtiar
y ca
re
hosp
itals
. H
ospi
tals
wer
e se
lf se
lect
ed &
pa
tient
s wer
e co
nven
ienc
e sa
mpl
ed.
Patie
nt
dem
ogra
phic
s, ad
mis
sion
type
, m
edic
al d
iagn
osis
.
Pa
tient
co
mpl
icat
ions
&
outc
omes
.
Deg
ree
of c
oord
inat
ion
of in
tens
ive
care
po
sitiv
ely
influ
ence
s its
eff
ectiv
enes
s. In
tera
ctio
n &
com
mun
icat
ion
betw
een
phys
icia
ns &
nur
ses a
ffec
t pat
ient
mor
talit
y.
49.
Kob
s. (1
997)
A
dequ
acy
of n
urse
st
affin
g.
Pr
opor
tion
of n
urse
w
orke
d ho
urs.
Pa
tient
co
mpl
icat
ions
, Th
ere
is a
pos
itive
cor
rela
tion
betw
een
shor
ter
leng
th o
f sta
y &
hig
her s
taff
ing
leve
ls. A
s RN
Evid
ence
-bas
ed S
taffi
ng
49
Aut
hors
, Yea
r Fo
cus
Sam
ple
In
puts
T
hrou
ghpu
ts
Out
puts
Fi
ndin
gs
leng
th o
f sta
y,
staf
fing
ratio
s. st
affin
g in
crea
sed,
pat
ient
com
plic
atio
ns
decr
ease
d.
50.
Kov
ner (
2001
) Im
pact
of s
taff
ing
&
wor
k or
gani
zatio
n on
pa
tient
out
com
es &
he
alth
care
wor
kers
.
N
urse
s’ e
duca
tion,
st
affin
g ra
tios.
N
urse
s’ h
ealth
, pa
tient
co
mpl
icat
ions
.
Inve
rse
rela
tions
hip
betw
een
mor
talit
y &
nu
mbe
r of R
Ns.
Inve
rse
rela
tions
hip
betw
een
com
plic
atio
ns &
num
ber o
f RN
s. Th
ere
are
high
rate
s of i
llnes
s & in
jury
am
ong
heal
thca
re
pers
onne
l. 51
. K
ovne
r, G
erge
n (1
998)
Rel
atio
nshi
p be
twee
n nu
rse
staf
fing
&
adve
rse
even
ts.
589
acut
e-ca
re
hosp
itals
in 1
0 st
ates
, dat
a fr
om
a 20
% st
ratif
ied
prob
abili
ty
sam
ple
to
appr
oxim
ate
US
hosp
itals
.
Nur
se st
affin
g (F
TE R
Ns w
orki
ng
patie
nt p
er d
ay).
Pa
tient
mor
talit
y,
med
icat
ion
erro
r ra
tes,
post
-op
erat
ive
infe
ctio
ns.
Inve
rse
rela
tions
hips
bet
wee
n FT
E R
Ns p
er
adju
sted
inpa
tient
day
& u
rinar
y ta
ct in
fect
ions
(-
636.
96, p
<.00
1), p
neum
onia
(-15
9.41
, p<
.001
), th
rom
bosi
s (-3
3.22
, p<.
01),
pulm
onar
y co
mpr
omis
e (-
59.6
9, p
<.05
) afte
r maj
or
surg
ery.
52.
Kra
kaue
r, B
aile
y, S
kella
n,
Stew
art,
Har
tz,
Kuh
n, R
imm
(1
992)
Eval
uatio
n of
a
mod
el fo
r ana
lyzi
ng
hosp
ital m
orta
lity
rate
s.
42,7
73 p
atie
nts
from
84
hosp
itals
. R
ando
m
sam
plin
g of
di
scha
rges
&
hosp
itals
from
st
rata
.
Prop
ortio
n of
nur
se
wor
ked
hour
s, ho
spita
l siz
e.
Pa
tient
co
mpl
icat
ions
. H
ospi
tals
with
hig
her p
ropo
rtion
of R
Ns h
ad
low
er a
djus
ted
mor
talit
y ra
tes (
diff
eren
ce o
f 2.
1-3.
6%).
53.
Kra
mer
, Sc
hmal
enbe
rg.
(198
8) P
art 1
.
Cha
ract
eris
tics o
f m
agne
t hos
pita
ls.
16 m
agne
t ho
spita
ls.
Hos
pita
l siz
e,
staf
fing
ratio
s, nu
rse
educ
atio
n,
expe
rienc
e.
N
urse
turn
over
. M
agne
t hos
pita
ls a
re su
cces
sful
in re
crui
ting
&
reta
inin
g nu
rses
dur
ing
perio
ds o
f sho
rtage
. Fl
uidi
ty &
info
rmal
ity a
llow
s for
co
mm
unic
atio
n &
exc
hang
e of
info
rmat
ion.
St
aff n
urse
s wer
e al
low
ed ti
me
for r
esea
rch,
pu
blic
atio
n &
spec
ial p
roje
cts.
Ther
e is
supp
ort
for c
ontin
uing
edu
catio
n &
enc
oura
gem
ent o
f au
tono
my
& e
ntre
pren
eurs
hip.
54
. K
ram
er,
Schm
alen
berg
(1
988)
Par
t 2.
Cha
ract
eris
tics o
f m
agne
t hos
pita
ls.
16 m
agne
t ho
spita
ls.
Hos
pita
l siz
e,
staf
fing
ratio
s, nu
rse
educ
atio
n,
expe
rienc
e.
N
urse
turn
over
. M
agne
t hos
pita
ls h
ave
char
acte
ristic
s sim
ilar t
o w
ell r
un c
ompa
nies
. The
y de
al w
ith n
ursi
ng
shor
tage
by
alte
ring
orga
niza
tiona
l con
ditio
ns
to e
limin
ate
inte
rnal
shor
tage
. Lea
ders
are
Evid
ence
-bas
ed S
taffi
ng
50
Aut
hors
, Yea
r Fo
cus
Sam
ple
In
puts
T
hrou
ghpu
ts
Out
puts
Fi
ndin
gs
high
ly v
isib
le &
acc
essi
ble.
Mag
net h
ospi
tals
va
lue
qual
ity, a
uton
omy,
info
rmal
co
mm
unic
atio
n, in
nova
tion,
edu
catio
n, re
spec
t, ex
celle
nce,
& b
ringi
ng o
ut th
e be
st in
eac
h in
divi
dual
. 55
. K
utso
gian
nis,
Hag
ue, T
riska
, Jo
hnst
on,
Nos
ewor
thy
(200
1)
Org
aniz
atio
n of
in
tens
ive
care
uni
ts &
th
e in
fluen
ce o
n pa
tient
out
com
es.
C
are
deliv
ery
syst
em.
Wor
k en
viro
nmen
t &
orga
niza
tion.
Cos
ts o
f car
e,
patie
nt
com
plic
atio
ns,
leng
th o
f sta
y.
Impo
rtant
fact
ors i
n or
gani
zatio
n in
clud
e co
mm
unic
atio
n, le
ader
ship
, & in
terd
isci
plin
ary
polit
ics.
Bet
ter s
tand
ardi
zed
prac
tices
&
coor
dina
tion
wer
e re
late
d to
bet
ter o
utco
mes
(lo
wer
mor
talit
y &
mor
bidi
ty).
56.
Man
itoba
N
ursi
ng
Stra
tegy
(200
3).
The
Man
itoba
N
ursi
ng S
trate
gy
(MN
S) is
a re
port
rele
ased
by
the
Man
itoba
go
vern
men
t to
addr
ess t
he c
once
rns
rais
ed b
y nu
rses
&
othe
r sta
keho
lder
s w
ithin
the
heal
thca
re
syst
em.
Wor
k en
viro
nmen
t.
MN
S in
clud
es:
1.
Incr
ease
the
supp
ly o
f nur
ses
2.
Impr
ove
acce
ss to
staf
f dev
elop
men
t for
nu
rses
.
3.
3.
Impr
ove
the
utili
zatio
n of
nur
ses.
4.
Impr
ove
wor
king
con
ditio
ns.
5.
Incr
ease
nur
ses'
oppo
rtuni
ties t
o pr
ovid
e in
put i
nto
deci
sion
-mak
ing.
57.
Max
wel
l (2
002)
. Fa
ctor
s nee
ded
to
crea
te h
igh-
qual
ity
care
env
ironm
ents
.
Sy
stem
or
gani
zatio
n,
wor
kloa
d, n
urse
jo
b co
ntro
l.
N
urse
hea
lth, j
ob
satis
fact
ion,
pa
tient
ou
tcom
es.
Job
desi
gn, j
ob re
war
ds, o
rgan
izat
iona
l cha
nge,
&
job
secu
rity
can
have
maj
or e
mpl
oyee
hea
lth
impl
icat
ions
. Rol
e st
ress
ors &
job
inse
curit
y in
fluen
ce th
e w
ork
envi
ronm
ent.
Wor
kloa
d,
wor
k pa
ce, &
wor
k sc
hedu
ling
are
impo
rtant
w
ork
envi
ronm
ent i
ssue
s fac
ing
heal
th-c
are
wor
kers
. Pos
itive
hea
lth o
utco
mes
for n
urse
s ar
e as
soci
ated
with
hig
h jo
b co
ntro
l & a
bal
ance
of
job
dem
ands
with
suff
icie
nt re
sour
ces.
Hos
pita
ls w
ith p
ositi
ve w
ork
envi
ronm
ents
ha
ve b
ette
r sta
ff re
crui
tmen
t & re
tent
ion,
&
patie
nt o
utco
mes
.
Evid
ence
-bas
ed S
taffi
ng
51
Aut
hors
, Yea
r Fo
cus
Sam
ple
In
puts
T
hrou
ghpu
ts
Out
puts
Fi
ndin
gs
58.
McG
illis
Hal
l, Ir
vine
Dor
an,
Bak
er, P
ink,
Si
dani
, O'B
rien-
Palla
s, D
onne
r (2
002)
.
Rep
orts
on
staf
f mix
&
wor
k st
atus
of
nurs
es in
adu
lt m
edic
al, s
urgi
cal,
&
obst
etric
al u
nits
in
Ont
ario
's te
achi
ng
hosp
itals
.
19 te
achi
ng
hosp
itals
, 2,0
46
patie
nts,
1,11
6 nu
rses
, 74
unit
man
ager
s. R
ando
m
sam
plin
g w
as
used
.
Nur
se
dem
ogra
phic
s, ex
perie
nce,
em
ploy
men
t sta
tus,
care
del
iver
y sy
stem
, pro
porti
on
of n
urse
wor
ked
hour
s.
Ther
e is
a n
eed
for d
evel
opin
g ap
prop
riate
le
vels
of k
now
ledg
e &
skill
for c
ompl
ex
inpa
tient
s car
ed fo
r in
med
ical
/sur
gica
l &
obst
etric
al u
nits
. The
pro
porti
ons o
f RN
s with
in
the
indi
vidu
al u
nit s
taff
ing
mod
els r
emai
ned
rela
tivel
y hi
gh (6
0-89
%).
Mor
e th
an o
ne th
ird
of th
e nu
rsin
g st
aff w
ere
empl
oyed
on
a pa
rt-tim
e or
cas
ual b
asis
. 59
. M
itche
ll,
Arm
stro
ng,
Sim
pson
, Len
tz
(198
9)
The
Dem
onst
ratio
n C
ritic
al C
are
Uni
t: or
gani
zatio
nal &
cl
inic
al o
utco
mes
.
42 n
urse
s, 68
ph
ysic
ians
, 192
pa
tient
ad
mis
sion
s. Pa
tient
s re
pres
enta
tive
of
unit’
s pop
ulat
ion
exce
pt fo
r dru
g ov
erdo
se o
r sho
rt st
ay.
Hos
pita
l siz
e &
ty
pe, n
urse
de
mog
raph
ics,
adm
issi
on ty
pe,
patie
nt
dem
ogra
phic
s, m
edic
al d
iagn
osis
.
C
osts
of c
are,
nu
rse
job
satis
fact
ion,
&
burn
out,
patie
nt
com
plic
atio
ns,
leng
th o
f sta
y.
Posi
tive
orga
niza
tiona
l & c
linic
al o
utco
mes
ex
ist w
ith v
alue
d as
pect
s of o
rgan
izat
iona
l en
viro
nmen
t (hi
gh n
urse
-phy
sici
an
colla
bora
tion,
hig
hly
rate
d nu
rsin
g pe
rfor
man
ce, p
ositi
ve o
rgan
izat
iona
l clim
ate)
as
com
pare
d w
ith h
isto
rical
com
paris
on
sam
ples
.
60.
Mitc
hell,
Sh
orte
ll, (1
997)
E7ff
ects
of
orga
niza
tiona
l va
riabl
es in
car
e de
liver
y sy
stem
s on
adve
rse
outc
omes
.
81 re
sear
ch
pape
rs.
Org
aniz
atio
nal
varia
bles
in c
are
deliv
ery
syst
ems.
Pa
tient
m
orbi
dity
, m
orta
lity,
&
adve
rse
effe
cts.
Som
e su
ppor
t tha
t nur
sing
surv
eilla
nce,
qua
lity
of w
orki
ng e
nviro
nmen
t & in
tera
ctio
ns w
ith
othe
r pro
fess
iona
ls a
re re
late
d to
low
er
mor
talit
y &
com
plic
atio
ns. P
atie
nt v
aria
bles
ha
ve a
gre
ater
impa
ct th
an o
rgan
izat
iona
l va
riabl
es. A
dver
se e
vent
s are
mor
e cl
osel
y re
late
d to
org
aniz
atio
nal f
acto
rs th
an is
m
orta
lity.
Evid
ence
-bas
ed S
taffi
ng
52
Aut
hors
, Yea
r Fo
cus
Sam
ple
In
puts
T
hrou
ghpu
ts
Out
puts
Fi
ndin
gs
61.
Nee
dlem
an,
Bue
rhau
s, M
attk
e, S
tew
art,
Zele
vins
ky
(200
2)
Exam
ine
the
rela
tion
betw
een
the
amou
nt
of c
are
prov
ided
by
nurs
es a
t the
hos
pita
l &
pat
ient
s' ou
tcom
es.
1997
adm
in d
ata
for 7
99 h
ospi
tal
in 1
1 U
S st
ates
(d
isch
arge
s:
5,07
5,96
9 m
edic
al &
1,
104,
659
surg
ical
pat
ient
s;
acco
unte
d fo
r 26
% o
f 199
7 di
scha
rges
from
no
n-fe
dera
l US
hosp
itals
). U
nit
of a
naly
sis w
as
hosp
ital.
Inpa
tient
staf
fing
leve
ls p
atie
nt p
er
day
adju
sted
for
inpa
tient
vs.
outp
atie
nt b
ias;
di
ffer
ence
s be
twee
n ho
spita
ls
leve
l of n
ursi
ng
care
per
DR
G; r
isk
adju
stm
ent f
or
patie
nt
char
acte
ristic
s; &
ho
spita
l ch
arac
teris
tics
(num
ber o
f hos
pita
l be
ds, t
each
ing
stat
us, s
tate
, &
met
ropo
litan
/non
-m
etro
polit
an).
Le
ngth
of s
tay,
po
st-o
pera
tive
com
plic
atio
ns,
adve
rse
even
ts,
mor
talit
y. F
ailu
re
to re
scue
def
ined
as
: “de
ath
from
pn
eum
onia
, sh
ock
or c
ardi
ac
arre
st, u
pper
GI
blee
ding
, sep
sis,
or d
eep
veno
us
thro
mbo
sis”
p.
1715
- Mea
n ho
urs o
f nur
sing
car
e pe
r pat
ient
-day
w
as 1
1.4;
of w
hich
, 7.8
, 1.2
& 2
.4 p
rovi
ded
by
RN
s, LP
Ns,
& n
ursi
ng a
ides
resp
ectiv
ely.
Mea
n pr
opor
tion
of to
tal h
ours
of R
N c
are
was
68%
&
of n
ursi
ng a
ides
car
e w
as 2
1%.
- Am
ong
med
ical
pat
ient
s, a
high
er p
ropo
rtion
of
RN
hou
rs o
f car
e pa
tient
per
day
& g
reat
er
abso
lute
num
ber o
f RN
hou
rs o
f car
e pe
r day
as
soci
ated
with
shor
ter l
engt
h of
stay
(p=0
.01
&
p<0.
001)
, low
er ra
tes o
f urin
ary
tact
infe
ctio
n (
p<0.
001
& p
=0.0
03) &
low
er ra
tes o
f upp
er G
I bl
eedi
ng (p
=0.0
3 &
p=0
.007
). H
ighe
r pr
opor
tion
of R
N h
ours
ass
ocia
ted
with
low
er
rate
s of p
neum
onia
(p=0
.001
), sh
ock
or c
ardi
ac
arre
st (p
=0.0
07),
& fa
ilure
to re
scue
(p=0
.05)
. - A
mon
g su
rgic
al p
atie
nts,
high
er p
ropo
rtion
of
RN
car
e as
soci
ated
with
low
er ra
tes o
f urin
ary
tact
infe
ctio
n (p
=0.0
4). G
reat
er n
umbe
r of
hour
s of R
N c
are
patie
nt p
er d
ay a
ssoc
iate
d w
ith lo
wer
rate
s of f
ailu
re to
resc
ue (p
=0.0
08).
- N
o as
soci
atio
n fo
und
betw
een
RN
staf
fing
leve
ls &
rate
of i
n-ho
spita
l mor
talit
y. N
o as
soci
atio
n fo
und
betw
een
incr
ease
d st
affin
g by
LP
N o
r nur
sing
aid
es &
rate
of a
dver
se
outc
omes
. 62
. O
’Brie
n-Pa
llas,
Coc
keril
l, Le
att
(199
2)
Det
erm
ine
equi
vale
nce
of
wor
kloa
d es
timat
es
of 5
pat
ient
cl
assi
ficat
ion
met
hods
(NIS
S,
GR
ASP
, Med
icus
, PR
N 7
6 &
PR
N 8
0)
206
patie
nts
from
a la
rge
urba
n te
achi
ng
hosp
ital,
purp
osiv
e sa
mpl
ing
in
sele
cted
uni
ts
(crit
ical
car
e un
it, in
tens
ive
care
uni
t, et
c.).
Cas
e m
ix g
roup
cl
assi
ficat
ion
Pr
ogra
m c
ost
fore
cast
ing
Clin
ical
ly si
gnifi
cant
diff
eren
ces i
n ho
urs o
f ca
re e
stim
ates
foun
d by
eac
h sy
stem
but
a h
igh
corr
elat
ion
betw
een
the
syst
ems s
ugge
sts t
hat
calib
ratio
n co
uld
be u
sed
to c
ompa
re d
ata
(alp
has <
0.0
001)
.
63.
O’B
rien-
Pres
ents
a m
eta-
14 n
ursi
ng u
nits
N
ursi
ng
Pres
ence
of n
ew
Am
ount
of d
irect
M
ultif
acto
rial i
nten
sity
& c
ompl
exity
of c
are
Evid
ence
-bas
ed S
taffi
ng
53
Aut
hors
, Yea
r Fo
cus
Sam
ple
In
puts
T
hrou
ghpu
ts
Out
puts
Fi
ndin
gs
Palla
s, Ir
vine
, Pe
ereb
oom
, M
urra
y (1
997)
para
digm
for
exam
inin
g nu
rsin
g w
ork
& re
sour
ce u
se.
in a
489
bed
pe
diat
ric te
rtiar
y ca
re, u
rban
, un
iver
sity
-af
filia
ted
hosp
ital,
cros
s-se
ctio
nal s
ampl
e.
com
plex
ity
(NA
ND
A),
med
ical
com
plex
ity
case
mix
gro
ups
(CM
Gs T
M),
med
ical
seve
rity
(leng
th o
f sta
y).
staf
f, re
lief s
taff
, un
antic
ipat
ed
even
ts.
care
requ
ired
(PR
N 8
0), c
osts
of
car
e.
mod
el e
xam
ines
cos
ts, n
ursi
ng w
ork
&
varia
bilit
y in
reso
urce
use
acr
oss p
atie
nts &
en
viro
nmen
ts. R
elat
ions
hips
obs
erve
d be
twee
n 4
key
varia
bles
& w
orkl
oad:
pat
ient
’s n
ursi
ng
cond
ition
(pos
itive
line
ar re
latio
nshi
p w
ith #
of
diag
nose
s), m
edic
al c
ondi
tion
(mos
t hav
e co
effic
ient
s of v
aria
tion
> 0.
5), c
areg
iver
ch
arac
teris
tics &
the
envi
ronm
ent.
64.
O’B
rien-
Palla
s, D
oran
, M
urra
y,
Coc
keril
l, Si
dani
, Lau
rie-
Shaw
, Lo
chha
ss-
Ger
lach
(200
1)
Var
iabl
es th
at a
ffec
t nu
rsin
g ut
iliza
tion
in
a ho
me
visi
ting
nurs
ing
serv
ice.
38 R
Ns,
11
RPN
s; 7
51
clie
nts r
ecei
ving
ho
me
heal
thca
re
(6,8
40 v
isits
or
7% o
f age
ncy
case
load
dur
ing
stud
y pe
riod)
; co
nven
ienc
e sa
mpl
e.
Clie
nts w
ere
unit
of a
naly
sis.
Clie
nt:
dem
ogra
phic
s, nu
rsin
g &
med
ical
di
agno
ses,
OM
AH
A sc
ores
, SF
-36
heal
th st
atus
, tim
e on
pro
gram
N
urse
: ed
ucat
ion,
ex
perie
nce,
pr
ofes
sion
al st
atus
. A
genc
y:
geog
raph
ic
loca
tion,
vis
it ty
pe,
case
load
, pr
opor
tion
of n
urse
w
orke
d ho
urs &
co
ntin
uity
of c
are.
Age
ncy:
vis
it tim
e En
viro
nmen
tal
Com
plex
ity:
com
petin
g de
man
ds/n
urse
sa
fety
, un
antic
ipat
ed
case
com
plex
ity,
form
al
info
rmat
ion
exch
ange
, voi
ce
mai
l, tra
vel,
unan
ticip
ated
ad
mis
sion
s.
Patie
nt h
ealth
st
atus
, OM
AH
A
scor
es
(kno
wle
dge,
be
havi
our,
and
stat
us).
Nur
se: p
erce
ived
ad
equa
cy o
f car
e tim
e.
Age
ncy:
tota
l vi
sits
.
Ove
rall,
Clie
nt C
are
Del
iver
y M
odel
exp
lain
ed
47%
(R2 =
.46)
of t
he v
aria
tion
in a
vera
ge v
isit
time.
Med
ical
& n
ursi
ng d
iagn
oses
exp
lain
ed
14.7
% o
f var
iatio
n in
ave
rage
vis
it le
ngth
. Sp
ecifi
cally
, men
tal h
ealth
dia
gnos
es
cont
ribut
ed to
long
er b
ut n
ot n
eces
saril
y m
ore
visi
ts. U
nant
icip
ated
cas
e co
mpl
exity
&
unan
ticip
ated
adm
issi
ons w
ere
posi
tivel
y as
soci
ated
with
gre
ater
ave
rage
vis
it tim
e,
expl
aini
ng 2
0.5%
of t
he v
aria
tion.
O
vera
ll, C
lient
Car
e D
eliv
ery
Mod
el e
xpla
ined
35
.6%
(R2 =
.33)
of t
he v
aria
tion
in n
umbe
r of
visi
ts. V
isits
per
form
ed b
y de
gree
-pre
pare
d nu
rses
resu
lted
in fe
wer
tota
l vis
its &
impr
oved
R
N p
erce
ptio
ns o
f vis
it ad
equa
cy. G
reat
er ti
me
per v
isit,
hig
her s
core
s for
form
al in
form
atio
n ex
chan
ge &
con
tinui
ty o
f car
e by
the
prim
ary
nurs
e w
ere
asso
ciat
ed w
ith fe
wer
vis
its. A
m
edic
al d
iagn
osis
of n
eopl
asm
, gre
ater
num
ber
of n
urse
s vis
iting
clie
nt, p
allia
tive
& lo
ng
dura
tion
visi
ts ty
pes,
& in
crea
sing
use
of v
oice
m
ail w
ere
asso
ciat
ed w
ith in
crea
sed
num
ber o
f vi
sits
. 65
. O
’Brie
n-Pa
llas,
Thom
son,
A
lksn
is, B
ruce
Econ
omic
impa
ct o
f st
affin
g de
cisi
ons
Ont
ario
acu
te
care
hos
pita
ls
Hos
pita
l C
hara
cter
istic
s:
earn
ed (p
aid)
hou
rs
patie
nt p
er d
ay (f
or
Bet
wee
n 19
94 a
nd 1
998,
inpa
tient
cas
es
drop
ped
by 1
84,7
66 w
hile
out
patie
nt c
ases
in
crea
sed
by 1
44, 6
03. D
ata
sugg
est t
hat a
n in
crea
se in
the
over
all r
esou
rces
use
d by
Evid
ence
-bas
ed S
taffi
ng
54
Aut
hors
, Yea
r Fo
cus
Sam
ple
In
puts
T
hrou
ghpu
ts
Out
puts
Fi
ndin
gs
(200
1)
RN
, RPN
, & U
CP
com
bine
d),
RN
su
rvey
of
abse
ntee
ism
&
over
time,
staf
fing,
co
mpe
nsat
ion,
w
orkl
oad
data
&
prod
uctiv
ity
Patie
nt
Cha
ract
eris
tics:
re
lativ
e in
tens
ity
wei
ghts
, co
mpl
exity
of
inpa
tient
hos
pita
l ca
ses (
1994
/95
– 19
98/9
9);
hosp
italiz
ed p
atie
nts i
n re
cent
yea
rs e
ven
thou
gh th
e nu
mbe
r of h
ospi
taliz
ed c
ases
& th
e av
erag
e le
ngth
of s
tay
have
dec
reas
ed.
Com
plex
ity le
vels
hav
e te
nded
to in
crea
se fo
r al
l age
gro
ups i
n ea
ch y
ear b
etw
een
1994
and
19
98, w
hile
the
over
all n
umbe
r of n
urse
s w
orki
ng in
hos
pita
l set
tings
ahs
dec
reas
ed.
In 1
998/
99 a
lone
, $17
1 m
illio
n sp
ent o
n ov
ertim
e ho
urs (
appr
ox. 2
,250
FTE
s); o
f whi
ch,
$57
mill
ion
on o
verti
me
pay
prem
ium
s. $1
9 m
illio
n sp
ent o
n nu
rsin
g ag
ency
per
sonn
el &
$3
9 m
illio
n sp
ent o
n si
ck ti
me
(app
rox.
765
FT
Es).
Ove
rtim
e co
sts a
lmos
t per
fect
ly c
orre
late
d (r
=.92
8, p
>.01
) with
sick
tim
e co
sts.
Hou
rs
patie
nt p
er d
ay w
ere
rela
ted
to b
oth
over
time
cost
s (r=
.439
, p<.
01) &
sick
tim
e co
sts (
r= .4
88,
p<.0
1) su
gges
ting
that
as h
ours
of c
are
patie
nt
per d
ay in
crea
sed,
so d
id th
e ov
ertim
e th
at
nurs
es w
ere
aske
d to
wor
k &
the
inci
denc
e of
m
isse
d sh
ifts d
ue to
illn
ess.
66.
Pink
erto
n,
Riv
ers (
2001
) Fa
ctor
s tha
t aff
ect
staf
fing
need
s.
Nur
se e
duca
tion,
ex
perie
nce,
use
of
relie
f sta
ff,
wor
kloa
d,
prop
ortio
n of
nur
se
wor
ked
hour
s
Freq
uenc
y &
co
mpl
exity
of
chan
ges.
Bur
nout
. Im
porta
nt v
aria
bles
incl
ude
unit
cohe
sive
ness
, ch
aos f
acto
rs, c
omm
unic
atio
n, o
rgan
izat
iona
l sk
ills o
f nur
ses,
supp
ort s
taff
ava
ilabi
lity,
&
num
ber o
f flo
at st
aff.
Evid
ence
-bas
ed S
taffi
ng
55
Aut
hors
, Yea
r Fo
cus
Sam
ple
In
puts
T
hrou
ghpu
ts
Out
puts
Fi
ndin
gs
67.
Potte
r, B
arr,
McS
wee
ney,
Sl
edge
(200
3)
Rel
atio
nshi
p be
twee
n R
N st
affin
g le
vels
&
patie
nt o
utco
mes
.
All
acut
e in
patie
nt c
are
units
(n=3
2) o
f on
e ho
spita
l. 20
00.0
2-20
01.0
1.
Uni
t of a
naly
sis
was
inpa
tient
un
it. A
djus
ted
for f
loat
pe
rcen
tage
&
acui
ty.
8 ho
ur d
ay sh
ift
nurs
e st
affin
g co
nver
ted
to d
irect
nu
rsin
g ca
re d
aily
ho
urs p
er p
atie
nt
for a
ll nu
rsin
g pe
rson
nel
per
mon
th; a
vera
ge:
num
ber o
f hou
rs o
f nu
rsin
g ca
re p
er
patie
nt d
aily
on
day
shift
; pe
rcen
tage
of
RN
& U
AP
dire
ct c
are
hour
s;
float
per
cent
age;
to
tal p
atie
nt c
are
hour
s. Pa
tient
ch
arac
teris
tics:
ac
uity
(ven
dor-
base
d pa
tient
cl
assi
ficat
ion
tool
).
Pa
tient
ou
tcom
es: f
alls
pe
r 100
0 pa
tient
da
ys, m
edic
atio
n er
rors
per
1,0
00
patie
nt d
ays,
self-
repo
rted
sym
ptom
m
anag
emen
t (V
AS)
, sel
f-ca
re
& h
ealth
stat
us
(Nat
iona
l Cen
ter
for H
ealth
St
atis
tics H
ealth
In
terv
iew
Su
rvey
) & p
ost-
disc
harg
e pa
tient
sa
tisfa
ctio
n.
Perc
enta
ge o
f RN
hou
rs n
egat
ivel
y co
rrel
ated
w
ith p
atie
nts’
per
cept
ion
of p
ain
& p
ositi
vely
co
rrel
ated
with
pat
ient
s’ p
erce
ptio
ns o
f sel
f-ca
re a
bilit
y &
hea
lth st
atus
, as w
ell a
s sa
tisfa
ctio
n po
st-d
isch
arge
.
68.
Pres
cott
(199
3)
Impa
ct o
f nur
se
staf
fing
leve
ls &
skill
m
ix o
n pa
tient
ou
tcom
es
Pr
opor
tion
of n
urse
w
orke
d ho
urs,
staf
fing
leve
ls.
Pa
tient
mor
talit
y,
qual
ity, a
nd c
osts
of
car
e.
Hig
h pe
rcen
tage
of R
Ns i
s ass
ocia
ted
with
lo
wer
than
exp
ecte
d m
orta
lity
rate
s (13
st
udie
s), l
engt
h of
stay
, cos
ts, c
ompl
icat
ions
. Sa
lary
savi
ngs o
f dec
linin
g sk
ill m
ix m
ay b
e of
fset
by
prod
uctiv
ity d
eclin
es.
69.
Pres
cott
(198
6)
Whe
ther
or
gani
zatio
nal,
adm
inis
trativ
e, &
pr
actic
e fa
ctor
s di
ffer
entia
te a
mon
g ho
spita
ls &
pat
ient
ca
re u
nits
as t
o re
gist
ered
nur
se
1044
staf
f nur
ses
wor
king
on
90
patie
nt c
are
units
in
15
hosp
itals
. D
ata
colle
cted
in
1981
& 1
982
Uni
t vac
ancy
rate
s, vo
lunt
ary
turn
over
, st
abili
ty.
33 p
redi
ctor
va
riabl
es.
Staf
f-pa
tient
ratio
s
Mod
el e
xpla
ined
52%
of v
aria
bilit
y in
vac
ancy
ra
tes,
56%
of v
aria
bilit
y in
stab
ility
rate
s, &
42
% o
f var
iabi
lity
in re
lativ
e tu
rnov
er.
Hig
h va
canc
y ra
tes a
ssoc
iate
d w
ith 7
var
iabl
es
incl
udin
g hi
gh st
aff-
patie
nt ra
tios o
n ev
enin
g sh
ift &
per
ceiv
ed in
adeq
uacy
of w
orki
ng
cond
ition
s.
Evid
ence
-bas
ed S
taffi
ng
56
Aut
hors
, Yea
r Fo
cus
Sam
ple
In
puts
T
hrou
ghpu
ts
Out
puts
Fi
ndin
gs
vaca
ncy,
stab
ility
, &
turn
over
rate
s. at
org
aniz
atio
nal
leve
l. H
igh
stab
ility
ass
ocia
ted
with
7 v
aria
bles
in
clud
ing
incr
ease
d st
aff-
patie
nt ra
tios &
pe
rcei
ved
inad
equa
cy o
f wor
king
con
ditio
ns.
Hig
h tu
rnov
er a
ssoc
iate
d w
ith 7
var
iabl
es
incl
udin
g lo
w st
aff-
patie
nt ra
tios o
n ni
ght s
hift
& p
erce
ived
inad
equa
cy o
f wor
king
con
ditio
ns.
70.
Rob
erts
on,
Dow
d, H
assa
n (1
997)
Staf
fing
inte
nsity
&
cost
s of c
are.
19
6 ac
ute
care
ho
spita
ls in
C
alifo
rnia
from
A
HA
ann
ual
surv
ey.
Prop
ortio
n of
N
urse
wor
ked
hour
s
C
osts
of c
are,
St
affin
g ra
tios.
Neg
ativ
e as
soci
atio
n be
twee
n so
me
staf
fing
leve
ls &
cos
ts o
f car
e (r
=-0.
04 to
r=-0
.36)
. H
ighe
r res
pira
tory
car
e te
chni
cian
staf
fing
inte
nsity
is re
late
d to
low
er c
osts
per
epi
sode
of
care
(r=-
0.36
). Po
sitiv
e re
latio
nshi
p be
twee
n R
N st
affin
g in
tens
ity &
cos
ts o
f car
e (m
ay b
e du
e to
use
of h
igh
skill
mix
stra
tegy
) r=0
.08.
Th
ere
are
limits
of s
kill-
spec
ific
staf
fing
inte
nsity
bel
ow w
hich
cos
ts o
f car
e ar
e ac
tual
ly
incr
ease
d. U
nder
staf
fing
incr
ease
s cos
ts &
re
duce
s qua
lity.
71
. Sa
info
rt,
Kar
sh, B
oosk
e,
Smith
(200
1)
Rev
iew
of l
itera
ture
on
cha
ract
eris
tics &
im
pact
of h
ealth
y w
ork
orga
niza
tions
H
ospi
tal s
ize,
car
e de
liver
y sy
stem
, st
affin
g
Wor
k en
viro
nmen
t N
urse
hea
lth
stat
us, p
atie
nt
com
plic
atio
ns,
job
satis
fact
ion,
bu
rnou
t
Cre
ates
a m
odel
& re
sear
ch a
gend
a fo
r he
alth
care
qua
lity
impr
ovem
ent &
pat
ient
sa
fety
. Org
aniz
atio
nal f
acto
rs &
wor
king
co
nditi
ons a
ffec
t em
ploy
ee h
ealth
&
prod
uctiv
ity.
72.
Seag
o, A
sh,
Spet
z, C
offm
an,
Gru
mba
ch
(200
1)
Cha
ract
eris
tics o
f ac
ute
care
hos
pita
ls
that
repo
rt R
N
shor
tage
s whe
n w
ides
prea
d sh
orta
ge
exis
ts &
whe
n w
ides
prea
d sh
orta
ge
is n
o lo
nger
evi
dent
.
All
acut
e-ca
re
hosp
itals
in
Uni
ted
Stat
es,
seco
ndar
y da
ta
from
nat
iona
l su
rvey
.
Staf
fing
leve
ls
(sho
rtage
s), p
atie
nt
dem
ogra
phic
s, nu
rse
educ
atio
n,
care
del
iver
y sy
stem
.
Loca
tion
in S
outh
, hig
h pe
rcen
tage
of n
on-
whi
te c
ount
y re
side
nts,
high
per
cent
age
of
patie
nts w
ith M
edic
are
as p
ayer
, hig
her p
atie
nt
acui
ty &
use
of t
eam
nur
sing
car
e de
liver
y pr
edic
ted
hosp
itals
repo
rting
shor
tage
s bot
h w
hen
ther
e w
as &
whe
n th
ere
was
not
a
wid
espr
ead
shor
tage
. Wag
e is
not
a si
gnifi
cant
pr
edic
tor o
f sho
rtage
s. R
N w
orkf
orce
pol
icy
need
s to
plac
e em
phas
is o
n di
strib
utio
n re
lativ
e to
ove
rall
supp
ly.
73.
Seyb
olt (
1986
) U
nder
stan
ding
the
647
fem
ales
RN
s C
aree
r sta
ge, w
ork-
N
urse
turn
over
Tu
rnov
er in
tent
ions
of e
mpl
oyee
s at d
iffer
ent
Evid
ence
-bas
ed S
taffi
ng
57
Aut
hors
, Yea
r Fo
cus
Sam
ple
In
puts
T
hrou
ghpu
ts
Out
puts
Fi
ndin
gs
caus
es o
f pre
mat
ure
nurs
e tu
rnov
er in
or
der t
o re
tain
nur
ses.
at a
larg
e W
est
Coa
st h
ospi
tal
role
des
ign
(job,
in
tera
ctio
ns,
orga
niza
tiona
l po
licie
s)
inte
ntio
ns
care
er st
ages
are
aff
ecte
d by
diff
erin
g w
ork-
role
de
sign
fact
ors.
74.
Silb
er,
Will
iam
s, K
raka
uer,
Schw
artz
(199
2)
Hos
pita
l & p
atie
nt
char
acte
ristic
s tha
t pr
edic
t mor
talit
y af
ter
surg
ery.
2831
pat
ient
s un
derg
oing
ch
olec
yste
ctom
y &
314
1 pa
tient
s un
derg
oing
tra
nsur
ethr
al
pros
tate
ctom
y.
Ran
dom
se
lect
ion,
from
7
stat
es.
Patie
nt
char
acte
ristic
s, nu
mbe
r of h
ospi
tal
beds
, sta
ff ra
tios
A
dver
se p
atie
nt
outc
omes
, m
orta
lity
Adv
erse
occ
urre
nces
ass
ocia
ted
prim
arily
with
pa
tient
cha
ract
eris
tics.
Failu
re to
resc
ue
asso
ciat
ed m
ore
with
hos
pita
l cha
ract
eris
tics
than
pat
ient
cha
ract
eris
tics (
high
er re
lativ
e ris
k). U
nder
stan
ding
reas
ons b
ehin
d va
riatio
ns
in m
orta
lity
shou
ld b
e us
ed to
upg
rade
qua
lity
of c
are.
75.
Soch
alsk
i (2
001)
Qua
lity
of c
are,
nur
se
staf
fing
& p
atie
nt
outc
omes
.
13,2
00 m
edic
al-
surg
ical
RN
s fr
om a
cute
car
e ho
spita
ls in
Pe
nnsy
lvan
ia.
Ran
dom
sam
ple
from
stat
e bo
ard
data
base
, 52%
re
spon
se ra
te.
Nur
se
dem
ogra
phic
s, ed
ucat
ion,
pr
opor
tion
of n
urse
w
orke
d ho
urs
Wor
k en
viro
nmen
t, w
orkl
oad
Job
satis
fact
ion,
bu
rnou
t, pa
tient
co
mpl
icat
ions
Med
ical
/sur
gica
l RN
s had
low
est s
core
s on
qual
ity o
f car
e (c
ompa
red
to o
ther
type
s of
units
), ha
d a
high
er n
umbe
r of t
asks
left
undo
ne
at th
e en
d of
shift
& a
re e
xper
ienc
ing
sign
ifica
nt le
vels
of b
urno
ut. H
ighe
r wor
kloa
ds
wer
e as
soci
ated
with
low
er q
ualit
y (r
=-0.
24).
41%
of n
urse
s wer
e m
oder
atel
y or
ver
y di
ssat
isfie
d w
ith th
eir j
ob.
76.
Sovi
e, Ja
wad
(2
001)
Im
pact
of h
ospi
tal
rest
ruct
urin
g on
pa
tient
out
com
es
1997
& 1
998
fisca
l yea
r dat
a fr
om 2
9 U
.S.
univ
ersi
ty
teac
hing
ho
spita
ls (w
ith >
30
0 ac
ute
oper
atin
g be
ds)
from
8 o
f 9 U
.S.
cens
us re
gion
s; 1
in
patie
nt a
cute
ad
ult m
edic
al
Stru
ctur
e:
MEC
ON
-PEE
Rx
Ope
ratio
ns
Ben
chm
arki
ng
Dat
abas
e R
epor
ts
(FTE
for e
ach
type
of
nur
sing
pe
rson
nel;
prop
ortio
n of
nur
se
wor
ked
hour
s;
hour
s wor
ked
per
patie
nt d
aily
for
Proc
ess:
M
anag
emen
t Pr
actic
es &
O
rgan
izat
iona
l Pr
oces
ses
Que
stio
nnai
re &
Q
ualit
y of
Em
ploy
men
t Su
rvey
subs
cale
on
aut
onom
y &
de
cisi
on-m
akin
g
Out
com
e:
Patie
nt o
utco
mes
(a
nnua
l fal
l rat
es,
noso
com
ial
pres
sure
ulc
ers,
urin
ary
tact
in
fect
ions
, pa
tient
sa
tisfa
ctio
n w
ith
vario
us su
rvey
s)
- RN
s few
er in
num
ber w
ith a
n in
crea
se in
un
licen
sed
assi
stiv
e pe
rson
nel.
- inc
reas
ed R
N h
ours
wor
ked
patie
nt p
er d
ay
asso
ciat
ed w
ith lo
wer
fall
rate
s (F=
11.7
3,
p=0.
002)
& h
ighe
r pat
ient
satis
fact
ion
with
pai
n m
anag
emen
t (F=
15.0
5, p
=0.0
007)
- i
ncre
ased
wor
ked
hour
s pat
ient
per
day
by
all
staf
f ass
ocia
ted
with
low
er ra
tes o
f urin
ary
tract
in
fect
ions
.
Evid
ence
-bas
ed S
taffi
ng
58
Aut
hors
, Yea
r Fo
cus
Sam
ple
In
puts
T
hrou
ghpu
ts
Out
puts
Fi
ndin
gs
unit
& su
rgic
al
unit
per h
ospi
tal;
Uni
ts o
f ana
lysi
s:
hosp
ital n
ursi
ng
dept
(inc
l. in
tens
ive
care
un
its);
med
ical
un
its;
surg
ical
uni
ts
RN
, unl
icen
sed
staf
f, LP
N, c
lerk
s, m
anag
ers;
labo
ur
cost
s per
dis
char
ge;
rest
ruct
urin
g as
sess
men
t too
l; &
in
terv
iew
) - n
urse
de
mog
raph
ics &
sa
tisfa
ctio
n (I
ndiv
idua
l Nur
se
Que
stio
nnai
re)
77.
Stric
klan
d,
Nee
ly (1
995)
Im
plem
enta
tion
of a
St
anda
rd S
taff
ing
Inde
x to
allo
cate
nu
rsin
g st
aff.
9000
-bed
ac
adem
ic
med
ical
cen
tre in
Te
xas.
Staf
fing
mix
, pa
tient
acu
ity
C
osts
of c
are,
pr
oduc
tivity
, st
affin
g ra
tios
New
syst
em d
eter
min
ed n
ursi
ng p
rodu
ctiv
ity
quic
kly
& e
ffic
ient
ly &
spec
ific
patie
nt n
eed
wer
e de
term
ined
thro
ugh
regu
lar &
thor
ough
ev
alua
tions
. One
per
son
was
resp
onsi
ble
for
staf
fing
on e
ach
unit.
The
SSI
allo
wed
for a
n ef
ficie
nt &
acc
urat
e ut
iliza
tion
of n
ursi
ng
pers
onne
l. 78
. Ta
rnow
-M
ordi
, Hau
, W
arde
n,
Shea
rer (
2000
)
The
rela
tions
hip
of
nurs
ing
requ
irem
ents
&
wor
kloa
d m
easu
res
& h
ospi
tal m
orta
lity
in th
e in
tens
ive
care
un
it.
One
adu
lt in
tens
ive
care
un
it in
the
UK
. A
ll ad
mis
sion
s (n
=105
0)
betw
een
1992
&
1995
that
met
cr
iteria
for
adju
stm
ent o
f m
orta
lity
risk
by
the
APA
CH
E II
eq
uatio
n (A
cute
Ph
ysio
logy
&
Chr
onic
Hea
lth
Eval
uatio
n)
- Pat
ient
pre
dict
ed
risk
of m
orta
lity
(APA
CH
E II
eq
uatio
n w
hich
us
es in
form
atio
n fr
om th
e 1st
24h
af
ter a
dmis
sion
). in
tens
ive
care
uni
t w
orkl
oad:
oc
cupa
ncy
(hig
hest
nu
mbe
r of b
eds
occu
pied
eac
h sh
ift
& p
eak
occu
panc
y as
the
high
est
occu
panc
y pe
r shi
ft du
ring
patie
nt
stay
), to
tal
M
orta
lity
rate
s “U
nadj
uste
d m
orta
lity
was
gre
ater
for p
atie
nts
expo
sed
to h
igh
vers
us m
oder
ate
over
all
inte
nsiv
e ca
re u
nit w
orkl
oad
(odd
s rat
io 4
-0 [2
-6-
6.2]
” (p
. 187
). Pa
tient
s exp
osed
to h
igh
inte
nsiv
e ca
re u
nit
wor
kloa
d w
ere
mor
e lik
ely
to d
ie (o
dds r
atio
3-
1 [1
.9-5
.0])
than
thos
e ex
pose
d to
low
er
wor
kloa
d, b
oth
befo
re &
afte
r adj
ustm
ent f
or
risk
by th
e A
PAC
HE
II e
quat
ion.
Tw
o m
easu
res o
f int
ensi
ve c
are
unit
wor
kloa
d m
ost s
trong
ly a
ssoc
iate
d w
ith a
djus
ted
mor
talit
y (e
xclu
ding
tota
l uni
t nur
sing
car
e re
quire
men
ts) w
ere
peak
occ
upan
cy &
the
ratio
of
occ
upie
d to
app
ropr
iate
ly st
affe
d be
ds.
Evid
ence
-bas
ed S
taffi
ng
59
Aut
hors
, Yea
r Fo
cus
Sam
ple
In
puts
T
hrou
ghpu
ts
Out
puts
Fi
ndin
gs
Inte
nsiv
e ca
re u
nit
nurs
ing
requ
irem
ent-U
K
Inte
nsiv
e C
are
Soci
ety
reco
mm
enda
tion,
ra
tio o
f occ
upie
d to
ap
prop
riate
ly
staf
fed
beds
Use
of a
ggre
gate
dat
a (to
tal)
inte
nsiv
e ca
re u
nit
nurs
ing
care
requ
irem
ents
) may
exp
lain
the
asso
ciat
ion
betw
een
high
inte
nsiv
e ca
re u
nit
nurs
ing
requ
irem
ent &
mor
talit
y, p
oten
tially
be
caus
e m
ore
serio
usly
ill p
ts a
re m
ore
likel
y to
di
e.
79.
Wai
, Bam
e,
Rob
inso
n (1
998)
Lite
ratu
re re
view
of
nurs
ing
turn
over
.
Nur
se
dem
ogra
phic
s, ed
ucat
ion,
pr
ofes
sion
al st
atus
, ho
spita
l siz
e.
Wor
kloa
d C
osts
of c
are,
job
satis
fact
ion.
O
lder
staf
f, m
inor
ities
, tho
se w
ith h
ighe
r in
com
e, e
mot
iona
l sup
port,
or l
onge
r ten
ure
had
low
er tu
rnov
er. F
acto
rs le
adin
g to
turn
over
in
clud
e jo
b sa
tisfa
ctio
n &
tens
ion,
or
gani
zatio
nal c
omm
itmen
t, jo
b po
ssib
ilitie
s &
supe
rvis
or b
ehav
iour
. 80
. W
eism
an,
Ale
xand
er,
Cha
se (1
981)
Rea
sons
for n
ursi
ng
turn
over
. 12
59 fu
ll-tim
e R
Ns i
n tw
o la
rge
univ
ersi
ty-
affil
iate
d ho
spita
ls. E
ntire
po
pula
tion
was
ta
rget
ed, 9
8%
resp
onse
rate
.
Nur
se
dem
ogra
phic
s.
Job
satis
fact
ion
Maj
ority
resi
gned
due
to jo
b di
ssat
isfa
ctio
n (5
7.1%
and
72.
5%).
Pers
onal
fact
ors h
ave
little
ef
fect
on
turn
over
pro
cess
. Rea
sons
for
resi
gnin
g in
clud
e w
ork
pres
sure
s due
to
unde
rsta
ffin
g &
num
ber o
r sch
edul
ing
of w
ork
hour
s. Lo
w p
ay w
as le
ast f
requ
ently
cite
d as
the
reas
on (l
ess t
han
2%).
81.
Whi
tman
, Y
ooky
ang,
D
avid
son,
Wol
f, W
ang
(200
2)
Det
erm
ine
the
rela
tions
hips
bet
wee
n nu
rsin
g st
affin
g &
sp
ecifi
c nu
rse-
sens
itive
out
com
es.
Obs
erva
tiona
l da
ta fr
om 9
5 pa
tient
car
e un
its
acro
ss 1
0 ac
ute
care
hos
pita
ls in
ea
ster
n U
S.
Nur
se p
rofe
ssio
nal
stat
us, s
taff
ing
hour
s, pa
tient
day
s pe
r uni
t, w
orke
d ho
urs p
atie
nt p
er
day
(WH
PPD
)
Stru
ctur
al
hosp
ital o
r uni
t va
riatio
ns.
Med
ical
err
ors,
fall
rate
s, in
fect
ions
, ulc
er
rate
s.
Sign
ifica
nt in
vers
e re
latio
nshi
ps p
rese
nt
betw
een
staf
fing
& fa
lls in
car
diac
inte
nsiv
e ca
re (r
=-0.
53),
med
icat
ion
erro
rs in
car
diac
&
non-
card
iac
inte
nsiv
e ca
re u
nit (
r=-0
.55
and
-0.
65 re
spec
tivel
y) &
rest
rain
t rat
es in
med
ical
-su
rgic
al u
nits
(r=-
0.48
). N
o st
atis
tical
ly
sign
ifica
nt re
latio
nshi
ps w
ere
foun
d be
twee
n th
e ou
tcom
es o
f cen
tral l
ine
infe
ctio
n ra
tes &
pr
essu
re u
lcer
rate
s & W
HPP
D a
cros
s spe
cial
ty
units
. An
inve
rse
rela
tions
hip
betw
een
WH
PPD
&
falls
was
pre
sent
in c
ardi
ac in
term
edia
te c
are
(r=-
0.53
). Th
e im
pact
of s
taff
ing
on o
utco
mes
Evid
ence
-bas
ed S
taffi
ng
60
Aut
hors
, Yea
r Fo
cus
Sam
ple
In
puts
T
hrou
ghpu
ts
Out
puts
Fi
ndin
gs
is h
ighl
y va
riabl
e ac
ross
spec
ialty
uni
ts, b
ut
whe
n pr
esen
t, th
e re
latio
nshi
ps a
re in
vers
ely
rela
ted
with
low
er st
affin
g le
vels
resu
lting
in
high
er ra
tes o
f all
outc
omes
.
4.
Thro
ughp
uts
A
utho
rs, Y
ear
Focu
s Sa
mpl
e
Inpu
ts
Thr
ough
puts
O
utpu
ts
Find
ings
82
. A
llred
, M
iche
l, A
rfor
d,
Car
ter,
Vei
tch,
D
ring,
Bea
son,
H
iott,
Fin
ch
(199
4)
Stud
y of
en
viro
nmen
tal
unce
rtain
ty.
113
RN
s fro
m a
te
rtiar
y ca
re
med
ical
cen
tre in
so
uth-
east
ern
Uni
ted
Stat
es.
Stra
tifie
d ra
ndom
sa
mpl
ing,
66%
re
spon
se ra
te.
Nur
ses’
ex
perie
nce.
W
ork
envi
ronm
ent,
unan
ticip
ated
ev
ents
, en
viro
nmen
tal
unce
rtain
ty.
N
o di
ffer
ence
bet
wee
n nu
rses
’ wor
k st
atus
or
expe
rienc
e &
resp
onse
pat
tern
s afte
r chi
-squ
are
anal
ysis
. Inc
reas
e in
env
ironm
ents
’ com
plex
ity
(r=0
.49)
, cha
ngea
bilit
y (r
=0.3
4) &
un
pred
icta
bilit
y (r
=0.5
6) le
ad to
incr
ease
d en
viro
nmen
tal u
ncer
tain
ty.
83.
Bro
wn
(200
0)
One
-Sto
p R
ecov
ery:
a
fast
-trac
k pr
ogra
m
for c
ardi
ac su
rgic
al
patie
nts.
N
urse
ratio
s, pa
tient
teac
hing
, an
d m
edic
al
diag
nosi
s.
Le
ngth
of s
tay
in
inte
nsiv
e ca
re
unit
& st
ep-d
own
units
, cos
ts o
f ca
re, p
atie
nt
com
plic
atio
ns
Fast
-trac
k pr
ogra
ms i
mpr
ove
patie
nt c
omfo
rt,
enha
nce
qual
ity o
f car
e, &
redu
ce c
osts
. B
arrie
rs in
clud
e ph
ysic
ian
relu
ctan
ce, l
imite
d re
sour
ces,
lack
of c
omm
unic
atio
n, &
pat
ient
&
fam
ily a
nxie
ty. O
ne-s
top
Rec
over
y of
fers
co
ntin
uity
of s
taff
, lim
its m
ultip
le in
patie
nt
trans
fers
, inc
reas
es fl
exib
ility
in h
uman
&
inst
itutio
nal r
esou
rces
, red
uces
inte
nsiv
e ca
re
unit
read
mis
sion
s, &
enh
ance
s pat
ient
com
fort
& fa
mily
supp
ort.
Patie
nt c
are
is p
rovi
ded
in
one
loca
tion
by c
onsi
sten
t sta
ff th
roug
hout
the
reco
very
. 84
. C
ady,
Mat
tes,
Bur
ton
(199
5)
Impl
emen
tatio
n of
a
step
-dow
n un
it to
de
crea
se in
tens
ive
care
uni
t len
gth
of
Teac
hing
ho
spita
l with
220
ad
ult b
eds,
27%
ar
e in
tens
ive
care
Patie
nt
dem
ogra
phic
s, m
edic
al
diag
nosi
s, pa
tient
Nur
sing
w
orkl
oad
Leng
th o
f sta
y in
in
tens
ive
care
un
it. ,
read
mis
sion
s to
Tim
e sp
ent i
n in
tens
ive
care
uni
t dec
reas
ed
sign
ifica
ntly
for t
hose
adm
itted
to st
ep d
own
unit
1.99
day
s ins
tead
of 3
.35)
. Len
gth
of st
ay
did
not d
iffer
for t
hose
in a
step
dow
n un
it.
Evid
ence
-bas
ed S
taffi
ng
61
Aut
hors
, Yea
r Fo
cus
Sam
ple
In
puts
T
hrou
ghpu
ts
Out
puts
Fi
ndin
gs
stay
. un
it. C
ompa
rabl
e in
stitu
tions
pr
ovid
ed
info
rmat
ion
for
com
paris
on.
acui
ty,
prop
ortio
n of
nu
rse
wor
ked
hour
s, nu
rsin
g ra
tios.
inte
nsiv
e ca
re
unit.
, nu
rse
job
satis
fact
ion,
pa
tient
co
mpl
icat
ions
, co
sts o
f car
e.
Qua
lity
of c
are
rem
aine
d ex
celle
nt &
cos
ts
wer
e de
crea
sed
for p
atie
nt in
the
step
dow
n un
it.
85.
Coh
n,
Ros
boro
ugh,
Fe
rnan
dez
(199
7)
Red
ucin
g co
sts &
le
ngth
of s
tay
&
impr
ovin
g ef
ficie
ncy
& q
ualit
y of
car
e in
ca
rdia
c su
rger
y.
Mul
tidis
cipl
inar
y he
alth
care
team
at
Brig
ham
&
Wom
en’s
ho
spita
l.
Med
ical
di
agno
sis.
Le
ngth
of s
tay,
co
sts o
f car
e M
ultid
isci
plin
ary
grou
p m
et w
eekl
y to
dis
cuss
pr
oble
ms w
ith c
ardi
ac su
rgic
al se
rvic
es. C
are
Coo
rdin
atio
n Te
am m
onito
rs c
linic
al p
athw
ays
& re
com
men
ds w
ays t
o im
prov
e se
rvic
es.
Res
ults
incl
ude
high
er v
olum
e of
surg
ery,
de
crea
sed
leng
th o
f sta
y (b
y ab
out 1
5%),
decr
ease
d co
sts,
& in
crea
sed
patie
nt sa
tisfa
ctio
n (to
95%
). 86
. D
renk
ard
(200
1)
Stra
tegi
c pl
anni
ng
met
hodo
logy
for
nurs
ing
care
.
C
are
deliv
ery
syst
em.
The
met
hodo
logy
use
s a tr
ansf
orm
atio
nal
lead
ersh
ip a
sses
smen
t too
l, qu
ality
pla
nnin
g m
etho
ds &
larg
e gr
oup
inte
rven
tions
to e
ngag
e nu
rses
in im
plem
enta
tion
of st
rate
gies
. Six
dr
ivin
g st
rate
gies
for n
ursi
ng w
ere
dete
rmin
ed:
lead
ersh
ip, p
ract
ice,
cul
ture
, lea
rnin
g, a
nd
rese
arch
& ro
le c
larit
y.
87.
Duf
fy,
Lem
ieux
(199
5)
Serv
ice-
line
conc
ept
& p
atie
nt-c
ente
red
care
in a
car
diac
se
tting
.
C
ontin
uity
of
care
.
Cos
ts o
f car
e,
prod
uctiv
ity.
A h
oriz
onta
l, m
ultid
isci
plin
ary
envi
ronm
ent
with
a p
erfo
rman
ce-b
ased
mod
el is
des
crib
ed.
Empl
oyee
role
s are
bro
aden
ed to
focu
s on
the
entir
e pr
oces
s of c
are
with
all
disc
iplin
es
wor
king
toge
ther
. 88
. H
elt,
Jelin
ek
(198
8)
Nur
sing
pro
duct
ivity
&
qua
lity
in th
e w
ake
of c
ost c
uttin
g.
Eigh
t mill
ion
patie
nt d
ays f
rom
M
edic
us
Nat
iona
l D
atab
ase
in U
S.
Hos
pita
l siz
e,
wor
kloa
d,
prop
ortio
n of
nu
rse
wor
ked
hour
s.
Pe
rcei
ved
qual
ity
of c
are,
leng
th o
f st
ay, c
osts
of
care
.
Even
in fa
ce o
f sta
ffin
g re
duct
ions
, pro
duct
ivity
(d
ecre
ase
in ra
tio o
f nur
sing
hou
rs to
wor
kloa
d)
& q
ualit
y (b
ased
on
spec
ific
obje
ctiv
es) h
ave
impr
oved
. Whi
le a
cuity
incr
ease
d, le
ngth
of
stay
had
dec
reas
ed. I
ncre
ased
per
cent
age
of
RN
s lea
ds to
incr
ease
d pr
oduc
tivity
, onl
y ha
lf of
whi
ch is
lost
due
to h
ighe
r cos
ts.
89.
Lam
b, S
tem
pel
(199
4)
Nur
se c
ase
man
agem
ent f
rom
the
16 p
atie
nts w
ho
had
wor
ked
with
C
ontin
uity
of
care
.
Patie
nt
com
plic
atio
ns,
The
stud
y ex
plor
ed p
atie
nts’
per
spec
tive
of
wor
king
with
a n
urse
cas
e m
anag
er. P
atie
nts
Evid
ence
-bas
ed S
taffi
ng
62
Aut
hors
, Yea
r Fo
cus
Sam
ple
In
puts
T
hrou
ghpu
ts
Out
puts
Fi
ndin
gs
patie
nt’s
per
spec
tive:
th
e in
side
r-ex
pert.
a
nurs
e ca
se
man
ager
dur
ing
hosp
italiz
atio
n,
rang
ing
in a
ge
from
66-
100.
heal
th st
atus
. de
scrib
ed th
e pr
oces
s of n
urse
s bec
omin
g th
eir
insi
der-
expe
rt. T
his c
onsi
sts o
f thr
ee p
hase
s:
bond
ing,
wor
king
& c
hang
ing.
Rel
atio
nshi
p w
ith a
nur
se in
side
r-ex
pert
enab
led
patie
nts t
o im
prov
e he
alth
out
com
es, h
ave
few
er
hosp
italiz
atio
ns, &
bet
ter q
ualit
y of
life
.
5.
Patie
nt O
utco
mes
Aut
hors
, Yea
r Fo
cus
Sam
ple
In
puts
T
hrou
ghpu
ts
Out
puts
Fi
ndin
gs
90.
Bro
oten
, N
aylo
r (19
95)
Nur
ses’
eff
ects
on
patie
nt o
utco
mes
.
Prop
ortio
n of
nu
rse
wor
ked
hour
s.
Pa
tient
co
mpl
icat
ions
&
outc
omes
, st
affin
g ra
tios,
cost
s of c
are.
Mos
t im
porta
nt is
sues
incl
ude
type
s of p
atie
nt
outc
omes
that
shou
ld b
e m
easu
red
& th
e am
ount
& ty
pe o
f nur
sing
nee
ded
in a
giv
en
envi
ronm
ent,
for s
peci
fic p
atie
nt g
roup
s & in
or
der t
o af
fect
out
com
es.
91.
Dan
sky,
B
rann
on,
Wan
gsne
ss,
(199
4)
Staf
fing
char
acte
ristic
s &
patie
nt sa
tisfa
ctio
n in
ho
me
heal
thca
re.
13 n
ot-f
or-p
rofit
ho
me
heal
th
agen
cies
in
Penn
sylv
ania
&
Ohi
o.
Nur
se e
duca
tion
& e
xper
ienc
e,
agen
cy si
ze.
Pa
tient
sa
tisfa
ctio
n H
ighe
r num
bers
of f
ull-t
ime
staf
f or o
f BN
S-pr
epar
ed R
Ns p
redi
cted
hig
her p
atie
nt
satis
fact
ion.
Siz
e of
age
ncy
had
no im
pact
on
satis
fact
ion.
Age
ncie
s with
med
ium
ben
efits
ha
d th
e hi
ghes
t pat
ient
satis
fact
ion.
92
. Fo
rtins
ky,
Mad
igan
(1
997)
.
Rel
atio
nshi
p be
twee
n m
easu
res o
f hom
e ca
re re
sour
ce
cons
umpt
ion
&
patie
nt o
utco
me
mea
sure
s.
N =
201
adu
lt m
edic
al/s
urgi
cal
hom
e ca
re
patie
nts w
ho
bega
n ne
w
epis
odes
of h
ome
care
from
10
med
icar
e-ce
rtifie
d ho
me
care
age
ncie
s in
Ohi
o.
Patie
nt
char
acte
ristic
s:
the
29 it
em
OA
SIS
asse
ssm
ent
(dem
ogra
phic
s, cl
inic
al &
fu
nctio
nal h
ealth
st
atus
, illn
ess &
re
hab
prog
nosi
s &
am
t. of
fam
ily
& o
ther
info
rmal
su
ppor
t rec
’d b
y
Pa
tient
ou
tcom
es:
disc
harg
e st
atus
; ch
ange
in
clin
ical
&
func
tiona
l hea
lth
stat
us m
easu
res
betw
een
adm
issi
on &
di
scha
rge.
Patie
nts w
hose
epi
sode
s end
ed w
ith d
isch
arge
at
hom
e vs
. hos
pita
lizat
ion
had
sim
ilar t
otal
vi
sit n
umbe
rs &
cos
ts b
ut th
ose
disc
harg
ed to
ho
spita
ls u
tiliz
ed th
e ho
me
care
reso
urce
s ove
r le
ss ti
me.
N
o si
gnifi
cant
diff
eren
ces w
ere
note
d in
the
use
of h
ome
care
reso
urce
s bet
wee
n pa
tient
s who
im
prov
ed &
thos
e w
hose
hea
lth st
atus
dec
lined
du
ring
the
epis
ode
of h
ome
care
. Pa
tient
s who
wer
e ad
mitt
ed to
hom
e ca
re fr
om
hosp
itals
& w
ho re
ceiv
ed h
ome
care
for l
onge
r
Evid
ence
-bas
ed S
taffi
ng
63
Aut
hors
, Yea
r Fo
cus
Sam
ple
In
puts
T
hrou
ghpu
ts
Out
puts
Fi
ndin
gs
pts a
t hom
e)
Res
ourc
e co
nsum
ptio
n:
tota
l # o
f hom
e vi
sits
by
all
disc
iplin
es;
disc
iplin
e-sp
ecifi
c co
st
info
rmat
ion;
le
ngth
of s
tay;
se
rvic
e in
tens
ity
(# o
f vis
its p
er
day)
than
the
62-d
ay st
udy
perio
d us
ed th
e gr
eate
st
num
ber o
f res
ourc
es.
93.
Lanc
aste
r (1
997)
Effe
cts o
f sta
ffin
g on
in
fect
ion
rate
s.
Patie
nt
com
plic
atio
ns,
staf
fing
ratio
s.
Incr
ease
d pa
tient
-to-n
urse
ratio
s pla
ce se
vere
tim
e co
nstra
ints
on
nurs
es. T
his h
as b
een
show
n to
resu
lt in
incr
ease
d in
fect
ion
rate
s with
cen
tral
veno
us c
athe
ters
. 94
. O
’Brie
n-Pa
llas,
Dor
an,
Mur
ray,
C
ocke
rill,
Sida
ni, L
aurie
-Sh
aw,
Loch
hass
-G
erla
ch (2
002)
Var
iabl
es th
at a
ffec
t cl
ient
out
com
es w
ith
a ho
me
visi
ting
nurs
ing
serv
ice.
38 R
Ns,
11
RPN
s, 75
1 cl
ient
s rec
eivi
ng
hom
e he
alth
care
, co
nven
ienc
e sa
mpl
e.
Clie
nt:
dem
ogra
phic
s, nu
rsin
g &
m
edic
al
diag
nosi
s, O
MA
HA
scor
es,
SF-3
6 he
alth
st
atus
, tim
e on
pr
ogra
m
Nur
se:
dem
ogra
phic
s, ed
ucat
ion,
ex
perie
nce,
pr
ofes
sion
al
stat
us
Age
ncy:
Pa
tient
hea
lth
stat
us, O
MA
HA
(k
now
ledg
e,
beha
viou
r, st
atus
)
Clie
nts w
ith d
egre
e-pr
epar
ed n
urse
s had
bet
ter
OM
AH
A sc
ores
(1.8
tim
es b
ette
r odd
s of
impr
oved
kno
wle
dge
and
2.2
times
bet
ter o
dds
of im
prov
ed b
ehav
iour
). C
linic
al, p
rovi
der,
orga
niza
tiona
l & e
nviro
nmen
tal f
acto
rs a
ffec
t ou
tcom
es. M
edic
al &
nur
sing
dia
gnos
es e
xpla
in
muc
h of
var
iatio
n in
out
com
es. E
nviro
nmen
tal
com
plex
ity w
as n
egat
ivel
y as
soci
ated
with
cl
ient
out
com
es.
Evid
ence
-bas
ed S
taffi
ng
64
Aut
hors
, Yea
r Fo
cus
Sam
ple
In
puts
T
hrou
ghpu
ts
Out
puts
Fi
ndin
gs
geog
raph
ic
loca
tion,
vis
it ty
pe, c
asel
oad,
pr
opor
tion
of
nurs
e w
orke
d ho
urs &
co
ntin
uity
of
care
95
. Pr
octo
r, Y
arch
eski
, O
risce
llo (1
996)
Rel
atio
nshi
ps
betw
een
hosp
ital
varia
bles
& p
atie
nt
outc
omes
.
68 p
atie
nts
diag
nose
d w
ith
MI f
rom
a la
rge
urba
n m
edic
al
cent
re.
Patie
nt
dem
ogra
phic
s
Patie
nt ju
dgm
ent
of q
ualit
y of
ca
re.
Sign
ifica
nt c
orre
latio
ns b
etw
een
nurs
ing
care
&
patie
nt o
utco
me
post
-MI (
0.40
) as w
ell a
s ho
spita
l env
ironm
ent &
pt.
outc
ome
post
-MI
(0.2
8). N
ursi
ng c
are
acco
unte
d fo
r 16
% o
f va
rianc
e in
pt.
outc
omes
. Pt.
leve
l of e
duca
tion
was
rela
ted
to o
utco
me
(0.4
1).
96.
Roh
rer,
Mom
any,
C
hang
(199
3).
The
rela
tions
hip
betw
een
natu
re-o
f-th
e-ta
sk a
spec
ts o
f or
gani
zatio
n de
sign
, st
ruct
ural
asp
ects
of
orga
niza
tion
desi
gn
& o
rgan
izat
iona
l ef
fect
iven
ess
(ope
ratio
naliz
ed a
s ou
tcom
e re
side
nt
func
tiona
l abi
lity)
.
872
nurs
ing
hom
e re
side
nts
& 1
0 nu
rsin
g ho
mes
.
Org
aniz
atio
nal
desi
gn in
clud
ed
3 st
ruct
ural
m
easu
res—
job
assi
gnm
ent,
hier
arch
y,
clos
enes
s of
supe
rvis
ion
& 2
na
ture
-of-
task
m
easu
res—
pace
of
ope
ratio
ns &
w
orkl
oad.
R
esid
ent
outc
omes
: The
7-
item
phy
sica
l fu
nctio
n sc
ale
incl
uded
bla
dder
in
cont
inen
ce,
bow
el
inco
ntin
ence
, ba
thin
g, e
atin
g,
mob
ility
(w
alki
ng o
r w
heel
ing)
, dr
essi
ng, &
tra
nsfe
rrin
g.
Onl
y jo
b as
sign
men
t & h
iera
rchy
(stru
ctur
al
varia
bles
) wer
e re
late
d to
impr
oved
phy
sica
l fu
nctio
n. In
gen
eral
, ass
umin
g a
stab
le p
ace
of
oper
atio
ns &
wor
kloa
d, n
on-s
peci
fic jo
b as
sign
men
t & le
ss h
iera
rchy
wer
e re
late
d to
be
tter p
hysi
cal f
unct
ion.
A c
onsi
sten
t wor
kloa
d ef
fect
was
dem
onst
rate
d in
that
few
er h
eavy
ca
re re
side
nts r
esul
ted
in b
ette
r res
iden
t ph
ysic
al fu
nctio
ning
.
Evid
ence
-bas
ed S
taffi
ng
65
Aut
hors
, Yea
r Fo
cus
Sam
ple
In
puts
T
hrou
ghpu
ts
Out
puts
Fi
ndin
gs
97.
Ros
eman
, B
ooke
r (19
95)
Wor
kloa
d &
en
viro
nmen
tal f
acto
rs
in m
edic
atio
n er
rors
.
All
med
err
ors i
n a
5 ye
ar p
erio
d fr
om a
140
bed
ho
spita
l in
Ala
ska.
W
ork
envi
ronm
ent,
wor
kloa
d.
Med
err
ors.
Erro
rs w
ere
posi
tivel
y as
soci
ated
with
num
ber
of sh
ifts w
orke
d by
tem
pora
ry st
aff &
with
pa
tient
day
s but
neg
ativ
ely
asso
ciat
ed w
ith
over
time
shift
s (us
e of
exp
erie
nced
nur
ses)
. A
seas
onal
pat
tern
of e
rror
s em
erge
d: e
rror
s co
rres
pond
ed w
ith th
e le
vel o
f dar
knes
s tha
t oc
curr
ed 2
mon
ths e
arlie
r (i.e
. Win
ter d
arkn
ess
corr
elat
ed w
ith in
crea
sed
med
err
ors i
n ea
rly
sprin
g).
98.
Silb
er,
Ros
enba
um,
Schw
artz
, Ros
s, W
illia
ms (
1995
)
Com
plic
atio
n ra
te a
s a
mea
sure
of q
ualit
y of
car
e in
cor
onar
y ar
tery
byp
ass g
raft
surg
ery.
16,6
73 p
atie
nts
who
und
erw
ent
coro
nary
arte
ry
bypa
ss g
raft
surg
ery
(CA
BG
) at
57
hosp
itals
in
1991
, dat
a fr
om
Am
eric
an
Hos
pita
l A
ssoc
iatio
n an
nual
surv
ey.
Patie
nt
dem
ogra
phic
s, ho
spita
l siz
e,
nurs
ing
ratio
s, m
edic
al
diag
nosi
s.
Pa
tient
mor
talit
y,
com
plic
atio
n, &
fa
ilure
to re
scue
ra
tes.
Man
y ho
spita
ls w
ith h
ighe
r qua
lity
of c
are
had
high
er c
ompl
icat
ion
rate
s but
low
er m
orta
lity
rate
s (ex
: fac
ilitie
s with
an
MR
I had
38%
in
crea
se in
com
plic
atio
ns).
Hos
pita
l ran
king
s ba
sed
on c
ompl
icat
ion
rate
s giv
e di
ffer
ent
info
rmat
ion
than
thos
e ba
sed
on m
orta
lity
rate
s. C
ompl
icat
ion
rate
s sho
uld
not b
e us
ed to
judg
e ho
spita
l qua
lity
of c
are
until
mor
e is
kno
wn
abou
t the
diff
eren
ce.
6.
N
urse
Out
com
es
A
utho
rs, Y
ear
Focu
s Sa
mpl
e In
puts
T
hrou
ghpu
ts
Out
puts
Fi
ndin
gs
99.
Ada
ms,
Bon
d (2
000)
Ef
fect
s of i
ndiv
idua
l &
org
aniz
atio
nal
char
acte
ristic
s on
job
satis
fact
ion.
834
nurs
es fr
om
Engl
and.
Dat
a co
llect
ed v
ia
post
al su
rvey
, ho
spita
ls c
hose
n w
ere
stra
tifie
d to
in
clud
e al
l hea
lth
regi
ons,
resp
onse
ra
te 5
7%.
Nur
se
dem
ogra
phic
s. O
rgan
izat
iona
l ch
arac
teris
tics.
Job
satis
fact
ion.
Th
ere
wer
e no
cor
rela
tions
with
job
satis
fact
ion
& n
urse
s’ a
ge o
r lev
el o
f edu
catio
n. S
ome
corr
elat
ions
wer
e fo
und
betw
een
job
satis
fact
ion
& c
ohes
ion
of n
ursi
ng te
am (0
.51)
, st
aff o
rgan
izat
ion
incl
udin
g st
affin
g &
w
orkl
oad
(0.4
6), l
evel
of p
rofe
ssio
nal p
ract
ice
(0.4
6) &
col
labo
ratio
n w
ith m
edic
al st
aff
(0.4
1). M
ost i
mpo
rtant
fact
ors i
n jo
b sa
tisfa
ctio
n w
ere
soci
al &
pro
fess
iona
l
Evid
ence
-bas
ed S
taffi
ng
66
Aut
hors
, Yea
r Fo
cus
Sam
ple
Inpu
ts
Thr
ough
puts
O
utpu
ts
Find
ings
re
latio
nshi
ps w
ith n
ursi
ng &
oth
er c
olle
ague
s. 10
0. A
iken
, Slo
ane
(199
7)
Bur
nout
in A
IDS
care
nu
rses
. 82
0 R
Ns &
LP
Ns o
n A
IDS
units
. All
nurs
es
on se
lect
ed u
nits
w
ere
surv
eyed
w
ith a
n 86
%
resp
onse
rate
.
Car
e de
liver
y sy
stem
, nur
se
educ
atio
n &
ex
perie
nce
Wor
k en
viro
nmen
t &
orga
niza
tion.
Bur
nout
, job
sa
tisfa
ctio
n,
nurs
e he
alth
, pa
tient
co
mpl
icat
ions
.
Nur
ses i
n de
dica
ted
AID
S un
its w
ere
less
em
otio
nally
exh
aust
ed th
an in
scat
tere
d be
d un
its. T
he o
rgan
izat
iona
l attr
ibut
es a
ssoc
iate
d w
ith lo
wer
bur
nout
are
als
o re
late
d to
safe
r w
ork
envi
ronm
ent,
grea
ter s
atis
fact
ion
with
ca
re &
low
er m
orta
lity.
Org
aniz
atio
nal s
uppo
rt ac
coun
ts fo
r 5%
var
ianc
e in
em
otio
nal
exha
ustio
n. N
urse
wel
l-bei
ng is
enh
ance
d by
au
tono
my
& c
ontro
l ove
r wor
k.
101.
Aik
en, C
lark
e,
Sloa
ne (2
000)
D
escr
ibe
how
nur
se
staf
fing
chan
ged
rela
tive
to h
ospi
tal
rest
ruct
urin
g (c
ase
mix
of p
atie
nts
rece
ivin
g ca
re),
&
exam
ine
chan
ges i
n nu
rsin
g pr
actic
e en
viro
nmen
ts.
1998
surv
ey o
f m
ore
than
2,0
00
nurs
es in
22
hosp
itals
; 199
6 su
rvey
s fro
m
chie
f exe
cutiv
e of
ficer
s at 6
46
hosp
itals
.
Prop
ortio
n of
nu
rse
wor
ked
hour
s, w
orkl
oad,
co
ntin
uity
of
care
, nur
se w
ork
inde
x.
Org
aniz
atio
nal
rest
ruct
urin
g.
Mor
talit
y, p
atie
nt
satis
fact
ion.
N
urse
con
trol o
ver t
he p
ract
ice
envi
ronm
ent
expl
ains
var
iatio
ns in
pat
ient
satis
fact
ion.
Bet
ter
orga
niza
tiona
l sup
port
was
ass
ocia
ted
with
lo
wer
em
otio
nal e
xhau
stio
n. T
he h
ighe
r the
st
affin
g le
vel,
the
low
er th
e de
ath
rate
(r=-
0.49
).
102.
Bak
er, K
ilmer
, Sy
nerg
ist,
Shuf
fle, (
2000
)
Inve
stig
ates
as
soci
atio
ns b
etw
een
expe
rienc
es o
f wor
k st
ress
am
ong
nurs
es.
204
fem
ale
nurs
es fr
om a
un
iver
sity
ho
spita
l in
Ger
man
y.
Bur
nout
, eff
ort
& re
war
d im
bala
nce,
Effo
rt &
rew
ard
imba
lanc
e w
as p
redi
ctiv
e of
em
otio
nal e
xhau
stio
n (F
=35.
33) &
de
pers
onal
izat
ion
(F=8
.97)
, bot
h di
men
sion
s of
burn
out.
Nur
ses’
feel
ings
of p
erso
nal
acco
mpl
ishm
ent w
ere
low
est a
mon
g th
ose
with
a
mis
mat
ch b
etw
een
dem
ands
and
rew
ards
. B
urno
ut is
obs
erve
d m
ore
ofte
n am
ong
youn
ger
nurs
es.
103.
Bau
man
n,
Gio
vann
etti,
O
’Brie
n-Pa
llas,
Mal
lette
, Deb
er,
Bly
the,
H
ibbe
rd,
DiC
enso
(200
1)
Nur
ses’
per
cept
ions
af
fect
ed b
y jo
b ch
ange
exp
erie
nces
.
1662
nur
ses f
rom
tw
o la
rge
teac
hing
ho
spita
ls. T
he
entir
e po
pula
tion
was
surv
eyed
, 50
.7%
resp
onse
ra
te.
Nur
se
dem
ogra
phic
s. W
ork
envi
ronm
ent,
wor
kloa
d.
Perc
eive
d qu
ality
of
car
e.
All
nurs
es w
ere
nega
tivel
y af
fect
ed b
y ho
spita
l re
stru
ctur
ing.
Nur
ses r
epor
ted
that
wor
k en
viro
nmen
ts h
ad d
eter
iora
ted
in th
e pr
evio
us
year
with
hea
vier
wor
kloa
ds, g
reat
er p
atie
nt
acui
ty &
mor
e w
orkp
lace
inju
ries.
Nur
ses
perc
eive
d a
decl
ine
in q
ualit
y of
car
e. T
hose
w
ho e
xper
ienc
ed jo
b ch
ange
(inv
olun
tary
re
allo
catio
n) w
ere
mor
e di
ssat
isfie
d, le
ss
conf
iden
t, m
ore
conc
erne
d ab
out p
atie
nt
Evid
ence
-bas
ed S
taffi
ng
67
Aut
hors
, Yea
r Fo
cus
Sam
ple
Inpu
ts
Thr
ough
puts
O
utpu
ts
Find
ings
w
elfa
re, &
less
com
mitt
ed.
104.
Ble
gen
(199
3)
Var
iabl
es th
at a
ffec
t nu
rses
’ job
sa
tisfa
ctio
n.
Met
a-an
alys
is o
f 48
stud
ies &
15
,048
subj
ects
.
Nur
se
dem
ogra
phic
s, ex
perie
nce.
Wor
k en
viro
nmen
t. N
urse
job
satis
fact
ion,
bu
rnou
t.
Job
satis
fact
ion
mos
t stro
ngly
ass
ocia
ted
with
st
ress
& o
rgan
izat
iona
l com
mitm
ent.
Oth
er
fact
ors i
nclu
ded
com
mun
icat
ion
with
su
perv
isor
, aut
onom
y, re
cogn
ition
, ro
utin
izat
ion,
com
mun
icat
ion
with
pee
rs,
fairn
ess,
& c
ontro
l. Lo
w c
orre
latio
ns w
ith a
ge,
yrs o
f exp
erie
nce,
edu
catio
n, &
pr
ofes
sion
alis
m.
105.
Bou
rbon
nais
, C
omea
u,
Vez
ina,
Dio
n (1
998)
The
psyc
holo
gica
l ef
fect
s of n
urse
s’
wor
k en
viro
nmen
ts.
1891
nur
ses f
rom
si
x ac
ute
care
ho
spita
ls in
Q
uebe
c,
volu
ntar
y re
crui
tmen
t. M
ostly
bed
side
nu
rses
wor
king
fu
ll tim
e.
Nur
se
dem
ogra
phic
s, ex
perie
nce
N
urse
bur
nout
, ps
ycho
logi
cal
dist
ress
, job
st
rain
, soc
ial
supp
ort a
t wor
k.
Hig
h ps
ycho
logi
cal d
eman
ds &
low
dec
isio
n la
titud
e is
ass
ocia
ted
with
psy
chol
ogic
al
dist
ress
(adj
uste
d od
ds ra
tio o
f 2.3
4) &
em
otio
nal e
xhau
stio
n (O
R=5
.77)
. Soc
ial
supp
ort a
t wor
k al
tere
d m
enta
l hea
lth b
ut n
ot
job
stra
in.
106.
Buc
han
(199
9)
A fo
llow
-up
of
mag
net h
ospi
tals
15
year
s afte
r the
ir de
sign
atio
n to
see
how
rest
ruct
urin
g ha
s af
fect
ed th
e st
atus
.
10 m
agne
t ho
spita
ls &
5
AN
CC
hos
pita
ls
Adm
inis
tratio
n,
prof
essi
onal
pr
actic
e &
de
velo
pmen
t fa
ctor
s (st
affin
g,
care
del
iver
y m
odel
s, pr
opor
tion
of
nurs
e w
orke
d ho
urs)
C
ost o
f car
e D
ue to
reor
gani
zatio
n, so
me
hosp
itals
no
long
er
exhi
bit c
hara
cter
istic
s of “
mag
netis
m.”
It is
not
th
e “m
agne
t hos
pita
l” la
bel t
hat i
s im
porta
nt,
but t
he c
once
pts o
f qua
lity
care
, eff
ectiv
e st
aff
depl
oym
ent &
job
satis
fact
ion.
The
re is
a n
eed
for m
onito
ring
& re
-acc
redi
tatio
n to
mai
ntai
n a
“liv
e” re
gist
er o
f mag
net h
ospi
tals
.
107.
Bur
ke,
Gre
engl
ass
(200
0)
Effe
cts o
f hos
pita
l re
stru
ctur
ing
on
nurs
es.
1362
nur
ses i
n O
ntar
io. R
ando
m
sele
ctio
n fr
om a
nu
rses
' uni
on,
35%
resp
onse
ra
te.
Nur
se
dem
ogra
phic
s, ex
perie
nce,
ed
ucat
ion,
&
prof
essi
onal
st
atus
.
Wor
kloa
d, w
ork
envi
ronm
ent.
Nur
ses’
em
otio
nal &
ph
ysic
al h
ealth
, bu
rnou
t.
Full
time
& p
art t
ime
nurs
es e
xper
ienc
ed
hosp
ital r
estru
ctur
ing
& d
owns
izin
g in
sim
ilar
way
s. FT
nur
ses h
ad p
oore
r hea
lth, w
ere
mor
e em
otio
nally
exh
aust
ed (m
ean=
3.6/
6 vs
. PT
mea
n=3.
0/6)
& w
ere
mor
e lik
ely
to b
e ab
sent
(m
ean=
3.2/
4 vs
. PT
mea
n=2.
5/4)
. Res
truct
urin
g w
as a
ssoc
iate
d w
ith le
ss w
ork
satis
fact
ion
&
poor
er w
ell-b
eing
.
Evid
ence
-bas
ed S
taffi
ng
68
Aut
hors
, Yea
r Fo
cus
Sam
ple
Inpu
ts
Thr
ough
puts
O
utpu
ts
Find
ings
10
8. C
amer
on,
Hor
sbur
gh,
Arm
stro
ng-
Stas
sen
(199
4)
Job
satis
fact
ion,
pr
open
sity
to le
ave
&
burn
out i
n R
Ns &
R
N a
ssis
tant
s.
623
RN
s & 2
31
RN
ass
ista
nts
from
3
com
mun
ity
hosp
itals
.
Nur
se
dem
ogra
phic
s W
ork
envi
ronm
ent
Nur
ses’
job
satis
fact
ion,
bu
rnou
t.
Nur
ses w
ere
only
mod
erat
ely
satis
fied
with
th
eir j
obs (
mea
n sc
ores
are
low
er th
an o
ther
em
ploy
ees)
. RN
s with
mor
e ex
perie
nce
had
high
er jo
b sa
tisfa
ctio
n &
less
bur
nout
. RN
s in
psyc
hiat
ric se
tting
s wer
e le
ast s
atis
fied.
Gre
ater
sa
tisfa
ctio
n &
less
bur
nout
whe
n a
“fit”
was
de
mon
stra
ted
betw
een
pers
on &
env
ironm
ent
(tabl
es o
mitt
ed)
109.
Car
ey,
Cam
pbel
l (1
994)
Stra
tegi
es fo
r nur
se
rete
ntio
n: p
rece
ptor
s, m
ento
rs, &
spon
sors
.
143
staf
f nur
ses
from
two
larg
e te
achi
ng
hosp
itals
in
Atla
nta.
Ran
dom
sa
mpl
e se
lect
ion
with
44%
and
36
% re
spon
se
rate
from
re
spec
tive
hosp
itals
.
Nur
se e
duca
tion,
ex
perie
nce.
Job
satis
fact
ion
No
caus
al re
latio
nshi
p be
twee
n m
ento
rs &
job
satis
fact
ion
(R2 fo
r fac
tors
= 0
.01-
0.08
). N
urse
s le
ave
b/c
of d
issa
tisfa
ctio
n ra
ther
than
nee
ds fo
r re
cogn
ition
, acc
ompl
ishm
ent,
or se
lf-w
orth
. En
viro
nmen
ts w
here
man
agem
ent s
uppo
rts
inte
rper
sona
l rel
atio
nshi
ps h
ave
high
er le
vels
of
satis
fact
ion
& le
ss tu
rnov
er.
110.
Cla
rke,
La
schi
nger
, G
iova
nnet
ti,
Sham
ian,
Th
omso
n,
Tour
ange
au,
(200
1)
Effe
cts o
f wor
kpla
ce
attri
bute
s on
nurs
es’
satis
fact
ion
& q
ualit
y of
car
e.
17,9
65 R
Ns i
n 39
2 ho
spita
ls
from
Alb
erta
, O
ntar
io &
B
ritis
h C
olum
bia.
R
epre
sent
ativ
e sa
mpl
es w
ere
draw
n fr
om
Ont
ario
&
Brit
ish
Col
umbi
a w
hile
all
RN
s in
Alb
erta
wer
e sa
mpl
ed.
Res
pons
e ra
te
was
49-
57%
.
Nur
se
dem
ogra
phic
s, ex
perie
nce.
Wor
k en
viro
nmen
t. N
urse
bur
nout
, jo
b sa
tisfa
ctio
n,
perc
eive
d qu
ality
of
car
e, p
atie
nt
adve
rse
even
ts
(fal
ls, m
ed
erro
rs).
Stro
nges
t pre
dict
ors o
f nur
ses’
em
otio
nal
exha
ustio
n &
satis
fact
ion
with
jobs
are
hav
ing
cont
rol o
ver w
ork
envi
ronm
ent,
havi
ng
suff
icie
nt re
sour
ces &
eff
ectiv
e nu
rsin
g le
ader
ship
. Nur
se-a
sses
sed
qual
ity w
as
sign
ifica
ntly
cor
rela
ted
with
occ
urre
nce
of
adve
rse
even
ts (r
=-0.
145f
or fa
lls to
-0.4
54 fo
r w
rong
med
). H
ospi
tals
with
goo
d ph
ysic
ian-
nurs
e co
llabo
ratio
n &
stro
ng n
ursi
ng le
ader
ship
ha
ve le
ss b
urno
ut &
low
er tu
rnov
er in
tent
ions
. Le
ader
ship
& n
urse
s’ le
ngth
of e
xper
ienc
e on
th
e un
it w
ere
pred
ictiv
e of
inte
nt to
leav
e cu
rren
t job
.
111.
Dav
ison
, Ef
fect
s of h
ealth
care
Lo
ngitu
dina
l N
urse
Hin
shaw
&
Perc
eive
d hi
gh w
orkl
oad
(Pric
e &
Mue
ller
Evid
ence
-bas
ed S
taffi
ng
69
Aut
hors
, Yea
r Fo
cus
Sam
ple
Inpu
ts
Thr
ough
puts
O
utpu
ts
Find
ings
Fo
lcar
elli,
C
raw
ford
, D
upra
t, C
liffo
rd
(199
7)
refo
rms o
n jo
b sa
tisfa
ctio
n &
vo
lunt
ary
turn
over
am
ong
hosp
ital
nurs
es
surv
ey o
f 685
nu
rses
from
one
ho
spita
l bet
wee
n 19
93 a
nd 1
994
dem
ogra
phic
s, w
age,
clin
ical
ad
vanc
emen
t le
vel,
term
inat
ion
stat
us, w
ork
cond
ition
s
Atw
ood’
s Nur
se
Job
Satis
fact
ion
Scal
e; P
rice
&
Mue
ller’
s Mod
el
of T
urno
ver;
Perli
n &
Sc
hool
er’s
Pe
rson
al M
aste
ry
Scal
e
over
load
subs
cale
) was
an
impo
rtant
de
term
inan
t of l
ow jo
b sa
tisfa
ctio
n. In
suff
icie
nt
time
to c
ompl
ete
the
job
pred
icte
d tu
rnov
er.
112.
Dem
erou
ti,
Bak
ker,
Nac
hrei
ner,
Scha
ufel
i (2
000)
Fact
ors c
ontri
butin
g to
bur
nout
& li
fe
satis
fact
ion
in n
urse
s.
109
nurs
es fr
om
one
hosp
ital &
tw
o nu
rsin
g ho
mes
in
Ger
man
y,
resp
onse
rate
59
%.
Nur
sing
de
mog
raph
ics,
expe
rienc
e.
Wor
kloa
d.
Bur
nout
. A
ge &
occ
upat
iona
l ten
ure
show
ed a
pos
itive
re
latio
nshi
p w
ith e
xhau
stio
n. A
ge w
as
sign
ifica
ntly
, neg
ativ
ely
rela
ted
to li
fe
satis
fact
ion.
Job
dem
ands
hav
e a
stro
ng p
ositi
ve
effe
ct o
n ex
haus
tion
whi
le jo
b re
sour
ces h
ave
a st
rong
neg
ativ
e ef
fect
on
dise
ngag
emen
t. Jo
b de
man
ds &
job
reso
urce
s cor
rela
te n
egat
ivel
y w
ith e
ach
othe
r (-0
.61)
. 11
3. Jo
seph
, D
eshp
ande
(1
997)
Hos
pita
ls c
an h
ave
vario
us ty
pes o
f et
hica
l clim
ates
. M
anag
ers m
ay b
e ab
le to
enh
ance
nu
rses
’ sat
isfa
ctio
n by
alte
ring
this
cl
imat
e.
144
nurs
es fr
om
larg
e no
n-pr
ofit
hosp
ital.
Ave
rage
subj
ect
was
40
year
old
m
arrie
d fe
mal
e w
ho h
as w
orke
d at
hos
pita
l for
9
year
s. 50
%
resp
onse
rate
.
Ethi
cal c
limat
e –
shar
ed
perc
eptio
n of
ho
w is
sues
sh
ould
be
addr
esse
d &
w
hat i
s eth
ical
ly
corr
ect
Jo
b sa
tisfa
ctio
n of
nur
ses (
with
pa
y, p
rom
otio
n,
cow
orke
rs,
supe
rvis
ors,
wor
k its
elf)
Prof
essi
onal
, ins
trum
enta
l (pr
otec
t ow
n in
tere
sts)
, ind
epen
denc
e (d
ecid
e fo
r one
self
wha
t’s ri
ght)
clim
ates
had
no
impa
ct o
n jo
b sa
tisfa
ctio
n. C
arin
g (w
hat’s
bes
t for
eve
ryon
e)
clim
ate
influ
ence
pay
, sup
ervi
sor,
& o
vera
ll sa
tisfa
ctio
n. R
ules
(stri
ct w
ith p
olic
ies)
clim
ate
had
posi
tive
impa
ct o
n ov
eral
l sat
isfa
ctio
n.
Effic
ienc
y (m
ust c
ontro
l cos
ts) c
limat
e ha
d ne
gativ
e im
pact
on
satis
fact
ion
with
su
perv
isor
s. 11
4. K
anga
s, K
ee,
McK
ee-W
addl
e (1
999)
Patie
nt &
nur
se
satis
fact
ion
with
in
diff
eren
t car
e de
liver
y m
odel
s &
orga
niza
tiona
l st
ruct
ures
.
102
nurs
es &
10
2 pa
tient
s fr
om 3
diff
eren
t ho
spita
ls (2
tra
ditio
nal,
1 sh
ared
go
vern
ance
). Sy
stem
atic
ra
ndom
sam
plin
g
Prop
ortio
n of
nu
rse
wor
ked
hour
s, ca
re
deliv
ery
mod
els
(prim
ary
nurs
ing,
te
am n
ursi
ng,
case
m
anag
emen
t),
cont
inui
ty o
f
N
urse
job
satis
fact
ion
No
diff
eren
ce in
nur
se jo
b sa
tisfa
ctio
n be
twee
n ty
pes o
f car
e de
liver
y m
odel
s. So
mew
hat
high
er p
atie
nt sa
tisfa
ctio
n fo
r tho
se w
ithin
the
prim
ary
care
del
iver
y m
odel
(not
sign
ifica
nt).
Supp
ortiv
e en
viro
nmen
t (ß=
-0.7
09) &
wor
king
in
a sp
ecia
lized
uni
t (ß=
-0.3
05) i
ncre
ase
nurs
e jo
b sa
tisfa
ctio
n.
Evid
ence
-bas
ed S
taffi
ng
70
Aut
hors
, Yea
r Fo
cus
Sam
ple
Inpu
ts
Thr
ough
puts
O
utpu
ts
Find
ings
us
ed. I
nclu
sion
cr
iteria
incl
uded
6m
os e
xper
ienc
e &
type
of u
nit.
care
, pat
ient
de
mog
raph
ics
115.
Kov
ner,
C.,
Hen
dric
kson
, G
., K
nick
man
, J.,
Fin
kler
, S.
(199
4)
Nur
se re
crui
tmen
t &
rete
ntio
n.
37 h
ospi
tals
, 858
R
Ns o
n 68
pilo
t un
its &
335
RN
s on
com
paris
on
units
. Pilo
t uni
ts
wer
e se
lf-se
lect
ed;
com
paris
on u
nits
w
ere
chos
en b
y ev
alua
tors
to b
e si
mila
r to
pilo
t un
its.
Nur
se
satis
fact
ion
Pilo
t pro
ject
to im
prov
e re
crui
tmen
t &
rete
ntio
n. A
ll of
the
inno
vatio
ns e
nhan
ced
satis
fact
ion.
Nur
ses r
anke
d pa
y as
mos
t im
porta
nt fa
ctor
, fol
low
ed b
y au
tono
my
&
prof
essi
onal
stat
us. E
duca
tion
initi
ativ
es,
reor
gani
zatio
n, &
new
tech
nolo
gy e
nhan
ced
satis
fact
ion.
With
eac
h ch
ange
, the
re w
as a
n in
itial
dis
satis
fact
ion.
116.
Kra
mer
&
Schm
alen
berg
(1
990)
Job
satis
fact
ion
&
rete
ntio
n of
nur
ses i
n m
agne
t & n
on-
mag
net h
ospi
tals
.
1800
nur
ses i
n m
agne
t & n
on-
mag
net h
ospi
tals
ac
ross
Uni
ted
Stat
es.
Imag
e &
va
luat
ion
of
nurs
es –
how
th
ey se
e th
emse
lves
&
how
oth
ers s
ee
them
;
Jo
b sa
tisfa
ctio
n,
incl
udin
g or
gani
zatio
nal
stru
ctur
e,
prof
essi
onal
pr
actic
e,
man
agem
ent
styl
e, q
ualit
y of
le
ader
ship
, pr
ofes
sion
al
deve
lopm
ent;
also
ove
rall
job
satis
fact
ion.
Mag
net h
ospi
tals
hav
e hi
gher
deg
ree
of
satis
fact
ion
& b
ette
r sta
ffin
g si
tuat
ions
than
no
n-m
agne
t. Po
sitiv
e co
rrel
atio
n be
twee
n ho
spita
l im
age
of n
ursi
ng &
ade
quac
y of
st
affin
g.
117.
Kra
mer
, H
afne
r (19
89)
Impa
ct o
f val
ues o
n nu
rses
’ sat
isfa
ctio
n &
pe
rcei
ved
prod
uctiv
ity.
2336
staf
f nur
ses
in 2
4 ho
spita
ls.
A 1
/3 sa
mpl
e,
prop
ortio
nate
by
regi
ons o
f the
co
untry
, of t
he
mag
net h
ospi
tals
W
ork
envi
ronm
ent.
Nur
ses’
job
satis
fact
ion,
pe
rcei
ved
qual
ity
of c
are.
Inve
rse
corr
elat
ion
betw
een
valu
e co
ngru
ence
&
nur
se jo
b sa
tisfa
ctio
n, q
ualit
y of
car
e (f
or
staf
f nur
se-to
p m
anag
er d
yad,
cor
rela
tion
betw
een
valu
e co
ngru
ence
& sa
tisfa
ctio
n ra
nged
from
0.0
74-0
.377
). St
aff n
urse
s rep
orte
d fe
wer
fact
ors a
s im
porta
nt to
satis
fact
ion
&
qual
ity o
f car
e th
an d
id o
ther
mem
bers
of
Evid
ence
-bas
ed S
taffi
ng
71
Aut
hors
, Yea
r Fo
cus
Sam
ple
Inpu
ts
Thr
ough
puts
O
utpu
ts
Find
ings
w
as d
raw
n,
rand
om sa
mpl
ing
of n
urse
s.
nurs
ing.
Impo
rtant
fact
ors i
nclu
de ro
le c
larit
y,
role
evo
lvem
ent,
role
dis
tanc
e, re
spon
sive
ness
fr
om m
anag
emen
t, au
tono
my.
11
8. K
utzs
cher
, Sa
bist
on,
Lasc
hing
er,
Nis
h (1
997)
.
Effe
cts o
f tea
mw
ork
on st
aff p
erce
ptio
n of
em
pow
erm
ent &
job
satis
fact
ion.
210
staf
f who
pa
rtici
pate
d on
m
ultid
isci
plin
ary
team
s & a
ra
ndom
sam
ple
of 1
85 st
aff
(res
pons
e ra
te
52%
) who
did
no
t.
W
ork
envi
ronm
ent
Job
satis
fact
ion.
Pe
rcep
tions
of w
ork
empo
wer
men
t wer
e hi
gher
fo
r sta
ff w
ho w
ere
on te
ams (
t=5.
04).
The
staf
f on
team
s was
slig
htly
mor
e sa
tisfie
d bu
t the
di
ffer
ence
was
not
sign
ifica
nt.
119.
Lasc
hing
er,
Fine
gan,
Sh
amia
n (2
001)
Impa
ct o
f wor
kpla
ce
empo
wer
men
t &
orga
niza
tiona
l tru
st
on n
urse
s’ w
ork
satis
fact
ion.
412
staf
f nur
ses
from
Ont
ario
. R
ando
m
sele
ctio
n fr
om
prof
essi
onal
re
gist
ry li
st,
equa
l sam
plin
g of
mal
es &
fe
mal
es.
Nur
se
dem
ogra
phic
s, pr
ofes
sion
al
stat
us.
Wor
k en
viro
nmen
t N
urse
s’ jo
b sa
tisfa
ctio
n St
aff n
urse
em
pow
erm
ent i
mpa
cts o
n th
eir t
rust
in
man
agem
ent &
thei
r job
satis
fact
ion.
Fo
ster
ing
envi
ronm
ents
that
enh
ance
em
pow
erm
ent w
ill h
ave
posi
tive
effe
cts o
n m
embe
rs &
eff
ectiv
enes
s. A
cces
s to
info
rmat
ion
(cor
rela
tion=
0.49
) & su
ppor
t (0.
46)
are
stro
ngly
rela
ted
to tr
ust i
n m
anag
emen
t. Fe
edba
ck &
gui
danc
e ar
e al
so re
late
d to
trus
t.
120.
Leite
r, H
arvi
e,
Friz
zell
(199
8)
Impa
ct o
f nur
se
burn
out o
n pa
tient
sa
tisfa
ctio
n.
711
nurs
es &
60
5 pa
tient
s fr
om si
xtee
n ho
spita
l uni
ts.
Vol
unte
ers
com
plet
ed th
e nu
rse
surv
eys &
pa
tient
s wer
e ra
ndom
ly
sam
pled
.
Nur
se &
pat
ient
de
mog
raph
ics.
N
urse
bur
nout
, m
eani
ngfu
lnes
s of
wor
k, p
atie
nt
outc
omes
, &
satis
fact
ion.
Patie
nts’
per
cept
ions
of q
ualit
y w
ere
corr
elat
ed
with
nur
ses’
rela
tions
hips
with
wor
k (m
ore
mea
ning
, les
s exh
aust
ion=
high
er p
erce
ptio
n of
qu
ality
). Pa
tient
s wer
e m
ore
satis
fied
on u
nits
w
here
nur
ses f
ound
the
wor
k m
eani
ngfu
l &
wer
e le
ss sa
tisfie
d on
uni
ts w
here
nur
ses w
ere
exha
uste
d or
rate
d hi
gh o
n cy
nici
sm (S
pear
man
ra
nk o
rder
cor
rela
tions
). N
o co
rrel
atio
ns
betw
een
prof
essi
onal
eff
icac
y &
pat
ient
sa
tisfa
ctio
n.
Evid
ence
-bas
ed S
taffi
ng
72
Aut
hors
, Yea
r Fo
cus
Sam
ple
Inpu
ts
Thr
ough
puts
O
utpu
ts
Find
ings
12
1. M
cGill
is H
all,
Dor
an, B
aker
, Pi
nk, S
idan
i, O
’Brie
n-Pa
llas,
Don
ner (
2001
)
Impa
ct o
f nur
sing
st
aff m
ix m
odel
s &
orga
niza
tiona
l cha
nge
stra
tegi
es.
2046
pat
ient
s, 11
16 n
urse
s, 63
un
it m
anag
ers,
50 se
nior
ex
ecut
ives
from
19
teac
hing
ho
spita
ls a
cros
s O
ntar
io.
Prop
ortio
n of
nu
rse
wor
ked
hour
s, m
edic
al
diag
nosi
s (ca
se
mix
gro
up)
M
ed e
rror
s, in
fect
ions
, nur
se
job
satis
fact
ion,
pe
rcei
ved
qual
ity
of c
are.
Nur
sing
lead
ersh
ip h
as p
ositi
ve in
fluen
ce o
n nu
rses
’ job
satis
fact
ion
(t=4.
88).
Low
er
com
plex
ity o
f pat
ient
s cor
resp
onds
with
hig
h jo
b sa
tisfa
ctio
n (t=
-3.1
7). U
nits
with
low
er
prop
ortio
n of
RN
s to
RPN
s had
mor
e m
ed
erro
rs &
wou
nd in
fect
ions
.
122.
McN
eese
-Sm
ith, C
rook
(2
003)
Var
iabl
es in
fluen
cing
nu
rses
’ val
ues.
412
RN
s fro
m 3
Lo
s Ang
eles
ho
spita
ls.
Hos
pita
ls w
ere
sele
cted
for
conv
enie
nce,
nu
rses
wer
e ra
ndom
ly
sam
pled
.
Nur
se
dem
ogra
phic
s, ed
ucat
ion
N
urse
job
satis
fact
ion
Hig
hest
rate
d va
lue
was
goo
d su
perv
isor
y re
latio
ns. I
f man
ager
s sup
port
nurs
es in
at
tain
ing
valu
es in
wor
k se
tting
, ret
entio
n m
ay
be im
prov
ed. C
orre
latio
ns b
etw
een
supe
rvis
ory
rela
tions
& se
curit
y (r
=0.5
9) &
secu
rity
&
achi
evem
ent (
r=0.
60) w
ere
note
d. N
egat
ive
corr
elat
ion
with
eco
nom
ic v
alue
s & jo
b sa
tisfa
ctio
n (r
=-0.
14).
123.
Mos
s, R
owle
s (1
997)
Th
e ef
fect
of n
urse
m
anag
ers’
m
anag
emen
t sty
les
on st
aff n
urse
job
satis
fact
ion.
623
nurs
es in
3
Mid
wes
tern
ho
spita
ls
Man
agem
ent
styl
es
(exp
loiti
ve/
auth
orita
tive,
be
nevo
lent
/ au
thor
itativ
e,
cons
ulta
tive,
pa
rtici
pativ
e).
Jo
b sa
tisfa
ctio
n B
y us
ing
appr
opria
te m
anag
emen
t sty
les,
staf
f nu
rse
job
satis
fact
ion
may
be
impr
oved
. Job
sa
tisfa
ctio
n im
prov
ed a
s the
styl
e ap
proa
ched
pa
rtici
pativ
e m
anag
emen
t.
124.
Mun
ro (1
983)
Jo
b sa
tisfa
ctio
n am
ong
rece
nt
grad
uate
s.
329
rece
nt
nurs
ing
grad
uate
s. D
esig
n w
as a
st
ratif
ied,
two-
stag
e pr
obab
ility
sa
mpl
e of
hig
h sc
hool
gra
ds in
U
S (2
% in
nu
rsin
g).
Nur
se e
duca
tion
Jo
b sa
tisfa
ctio
n Ed
ucat
ion
back
grou
nd d
id n
ot a
ffec
t job
sa
tisfa
ctio
n. A
chie
vem
ent,
resp
onsi
bilit
y (3
3%
of v
aria
nce)
, adv
ance
men
t, gr
owth
(2.2
% o
f va
rianc
e), &
wor
k its
elf (
5.5%
of v
aria
nce)
are
re
late
d to
satis
fact
ion.
Adm
inis
trato
rs n
eed
to
appe
al to
nur
ses’
nee
ds fo
r cha
lleng
es &
op
portu
nitie
s to
grow
.
125.
Nak
ata,
Say
lor
Man
agem
ent s
tyle
&
102
RN
s &
W
ork
Job
satis
fact
ion.
Po
sitiv
e co
rrel
atio
n be
twee
n pe
rcei
ved
Evid
ence
-bas
ed S
taffi
ng
73
Aut
hors
, Yea
r Fo
cus
Sam
ple
Inpu
ts
Thr
ough
puts
O
utpu
ts
Find
ings
(1
994)
nu
rse
satis
fact
ion.
LP
Ns f
rom
an
acut
e ca
re
hosp
ital i
n C
alifo
rnia
. All
staf
f in
sele
cted
un
its w
as
surv
eyed
with
a
43%
resp
onse
ra
te.
envi
ronm
ent.
man
agem
ent s
tyle
& st
aff n
urse
job
satis
fact
ion
(r=0
.48)
. The
clo
ser t
he m
anag
emen
t sty
le to
pa
rtici
pativ
e gr
oup
man
agem
ent,
the
high
er th
e sa
tisfa
ctio
n. N
urse
s wou
ld li
ke to
be
mor
e in
volv
ed in
dec
isio
n-m
akin
g &
setti
ng o
f uni
t go
als.
Aut
onom
y &
aut
horit
y ar
e so
urce
s of j
ob
satis
fact
ion
whi
le p
oor c
omm
unic
atio
n le
ads t
o di
ssat
isfa
ctio
n.
126.
RN
AO
(200
2)
To d
eter
min
e th
e ex
tent
to w
hich
RN
s ha
ve se
en sp
ecifi
c ch
ange
s in
thei
r wor
k en
viro
nmen
ts si
nce
the
task
forc
e re
com
men
datio
ns
wer
e re
leas
ed.
Surv
eys g
iven
to
RN
AO
mem
bers
&
non
-mem
ber
RN
s,
RN
s age
23-
67
yrs.
Con
veni
ence
sa
mpl
e, 5
49
resp
onse
s.
Nur
se
dem
ogra
phic
s, em
ploy
men
t st
atus
, sec
tor o
f em
ploy
men
t, po
sitio
n,
wor
kloa
d,
prop
ortio
n of
nu
rse
wor
ked
hour
s
Wor
k en
viro
nmen
t. N
urse
job
satis
fact
ion.
R
espo
nden
ts a
re n
ot e
xper
ienc
ing
a hi
gh d
egre
e of
con
trol t
hrou
gh fl
exib
ility
of t
he w
ork
sche
dule
s. Pr
ofes
sion
al sa
tisfa
ctio
n w
as ra
ted
high
ly. R
Ns i
ndic
ate
no c
hang
e in
opp
ortu
nitie
s to
par
ticip
ate
in d
ecis
ion-
mak
ing
that
in
fluen
ces p
atie
nt c
are.
Whe
n nu
rses
hav
e sa
tisfa
ctor
y w
orkl
oads
& c
ontin
uity
of p
atie
nt
assi
gnm
ent,
thei
r ove
rall
job
satis
fact
ion
impr
oves
. Con
sist
ency
in p
atie
nt a
ssig
nmen
t is
linke
d to
nur
ses'
perc
eptio
ns o
f im
prov
ed
orga
niza
tiona
l com
mitm
ent t
o nu
rsin
g.
127.
Roe
del,
Nys
trom
(199
8)
Fact
ors t
hat a
ffec
t nu
rses
’ job
sa
tisfa
ctio
n.
135
RN
s fro
m a
20
0-be
d co
mm
unity
ho
spita
l, se
lf-se
lect
ion,
all
fem
ale
resp
onde
nts.
Nur
ses’
ed
ucat
ion.
W
ork
envi
ronm
ent.
Nur
se jo
b sa
tisfa
ctio
n.
Nur
ses r
anke
d co
-wor
ker s
atis
fact
ion
as th
e hi
ghes
t sat
isfa
ctio
n sc
ore.
Les
s tas
k id
entit
y,
auto
nom
y or
feed
back
is re
late
d to
low
er jo
b sa
tisfa
ctio
n. S
kill
varie
ty &
task
sign
ifica
nce
tend
to b
e un
rela
ted
to m
ost f
acet
s of j
ob
satis
fact
ion.
128.
Shul
lanb
erge
r (2
000)
Lite
ratu
re re
view
of
cost
-eff
ectiv
e nu
rse
staf
fing
Pr
opor
tion
of
nurs
e w
orke
d ho
urs
Wor
kloa
d
Cos
ts o
f car
e,
nurs
e sa
tisfa
ctio
n.
Nur
se sa
tisfa
ctio
n ha
s pos
itive
rela
tions
hip
with
se
lf-sc
hedu
ling.
Opt
imal
skill
mix
of 8
5% R
Ns.
Nur
ses’
rem
uner
ativ
e va
lue
is m
ore
than
wha
t ca
n be
mea
sure
d by
wor
kloa
d.
Evid
ence
-bas
ed S
taffi
ng
74
Aut
hors
, Yea
r Fo
cus
Sam
ple
Inpu
ts
Thr
ough
puts
O
utpu
ts
Find
ings
12
9. St
orde
ur,
D’h
oore
, V
ande
nber
ghe
(200
1)
Impa
ct o
f lea
ders
hip
beha
viou
rs o
n nu
rses
’ em
otio
nal
exha
ustio
n.
625
war
d nu
rses
fr
om a
uni
vers
ity
hosp
ital.
39.2
%
resp
onse
rate
but
de
mog
raph
ics o
f sa
mpl
e si
mila
r to
nurs
ing
popu
latio
n.
Wor
k st
ress
ors
(phy
sica
l, ps
ycho
logi
cal,
soci
al
envi
ronm
ents
) &
lead
ersh
ip
beha
viou
rs
Wor
k en
viro
nmen
t Em
otio
nal
exha
ustio
n
com
pone
nt o
f bu
rnou
t
Wor
k st
ress
ors e
xpla
ined
22%
of e
mot
iona
l ex
haus
tion
whe
reas
lead
ersh
ip d
imen
sion
s ex
plai
ned
9%. S
tress
from
phy
sica
l (ß=
0.28
) &
soci
al (ß
=0.1
7) e
nviro
nmen
t, ro
le a
mbi
guity
(ß
=0.1
7), a
ctiv
e m
anag
emen
t-by-
exce
ptio
n le
ader
ship
(ß=0
.13)
sign
ifica
ntly
ass
ocia
ted
with
em
otio
nal e
xhau
stio
n.
130.
Tong
es,
Rot
hste
in,
Car
ter (
1998
)
Var
iabl
es th
at a
ffec
t nu
rses
’ job
sa
tisfa
ctio
n.
222
staf
f nur
ses
in a
cute
car
e ho
spita
ls. A
ll nu
rses
mee
ting
the
sele
ctio
n cr
iteria
wer
e su
rvey
ed.
Con
tinui
ty o
f ca
re, n
urse
de
mog
raph
ics,
expe
rienc
e.
N
urse
s’ jo
b sa
tisfa
ctio
n,
burn
out.
Asp
ects
of j
ob im
porta
nt to
satis
fact
ion
incl
ude
cont
inui
ty o
f car
e, a
uton
omy,
indi
vidu
al
acco
unta
bilit
y, &
per
form
ance
feed
back
.
131.
Tzen
g,
Ket
efia
n (2
002)
R
elat
ions
hip
betw
een
nurs
e jo
b sa
tisfa
ctio
n &
inpa
tient
sa
tisfa
ctio
n.
59 p
atie
nts &
10
3 nu
rses
from
si
x un
its in
a
Taiw
an te
achi
ng
hosp
ital.
Clu
ster
sa
mpl
ing
tech
niqu
e.
Patie
nt te
achi
ng,
cont
inui
ty o
f ca
re, p
atie
nt
dem
ogra
phic
s, nu
rse
dem
ogra
phic
s, ex
perie
nce
Wor
k en
viro
nmen
t N
urse
job
satis
fact
ion,
le
ngth
of s
tay
Nur
ses’
job
satis
fact
ion
is c
orre
late
d w
ith
inpa
tient
satis
fact
ion
fact
ors:
exp
lana
tion
of
care
(r=0
.765
), pa
in m
anag
emen
t (r=
0.86
6) a
s w
ell a
s the
nur
se’s
gen
eral
hap
pine
ss (r
=0.8
91).
Nur
ses’
gen
eral
hap
pine
ss p
ositi
vely
co
ntrib
uted
to p
atie
nt sa
tisfa
ctio
n.
132.
Ver
nare
c (2
000)
. O
verti
me
& w
hat
nurs
es c
an d
o w
hen
face
d w
ith m
anda
tory
or
face
d ov
ertim
e.
N
urse
hea
lth,
burn
out.
Nur
ses w
ho w
ork
over
time
are
also
und
er th
e st
ress
of c
ompe
ting
job
& fa
mily
re
spon
sibi
litie
s, th
eir o
wn
heal
th, &
thei
r pa
tient
s' sa
fety
.
7.
Syst
em O
utco
mes
Aut
hors
, Yea
r Fo
cus
Sam
ple
In
puts
T
hrou
ghpu
ts
Out
puts
Fi
ndin
gs
Evid
ence
-bas
ed S
taffi
ng
75
Aut
hors
, Yea
r Fo
cus
Sam
ple
In
puts
T
hrou
ghpu
ts
Out
puts
Fi
ndin
gs
133.
And
erso
n,
Hig
gins
, R
ozm
us (1
999)
Leng
th o
f sta
y in
in
tens
ive
care
uni
t af
ter c
oron
ary
arte
ry
bypa
ss g
raft.
152
patie
nts i
n a
larg
e te
achi
ng
hosp
ital i
n Te
nnes
see,
81%
m
ale,
19%
fe
mal
e.
Patie
nt
dem
ogra
phic
s, m
edic
al
diag
nosi
s.
Le
ngth
of s
tay
in
inte
nsiv
e ca
re
unit
& st
ep-d
own
units
, pat
ient
m
orta
lity,
cos
ts
of c
are,
pos
t-op
com
plic
atio
ns.
Inte
nsiv
e ca
re u
nit l
engt
h of
stay
was
shor
ter
whe
n am
bula
tion
was
initi
ated
soon
er (t
=-2.
68).
Shor
ter h
ospi
taliz
atio
n fo
r pat
ient
s who
stay
ed
in in
tens
ive
care
uni
t 1 d
ay th
an th
ose
stay
ing
2 da
ys (t
=-1.
46; n
ot si
gnifi
cant
).
134.
Bou
rbon
nais
, M
ondo
r Myr
to
(200
1)
The
asso
ciat
ion
betw
een
nurs
es’ j
ob
stra
in &
sick
leav
e.
1793
nur
ses f
rom
si
x ac
ute
care
ho
spita
ls in
Q
uebe
c,
volu
ntar
y re
crui
tmen
t.
Nur
se
dem
ogra
phic
s, ex
perie
nce
N
urse
bur
nout
, jo
b st
rain
, soc
ial
supp
ort a
t wor
k,
shor
t ter
m &
ce
rtifie
d si
ck
leav
es.
Shor
t ter
m si
ck le
aves
wer
e as
soci
ated
with
job
stra
in (i
ncid
ence
-den
sity
ratio
= 1
.20)
& lo
w
soci
al su
ppor
t (ID
R=1
.26)
. Cer
tifie
d si
ck le
aves
w
ere
sign
ifica
ntly
ass
ocia
ted
with
low
soci
al
supp
ort (
IDR
=1.2
7 fo
r all
diag
nose
s &
IDR
=1.7
8 fo
r men
tal h
ealth
dia
gnos
es).
135.
Liu,
Su
bram
ania
n,
Cro
mw
ell
(200
1)
Impl
emen
ting
glob
al
bund
led
paym
ents
on
Hos
pita
l cos
ts o
f co
rona
ry a
rtery
by
pass
gra
fting
.
Patie
nts
unde
rgoi
ng
bypa
ss su
rger
y at
th
ree
hosp
itals
(in
Atla
nta,
Ann
A
rbor
and
B
osto
n).
Patie
nt
dem
ogra
phic
s, ad
mis
sion
type
, m
edic
al
diag
nosi
s.
C
osts
of c
are
(dire
ct v
aria
ble
cost
s e.g
. nur
ses’
w
ages
), po
stop
erat
ive
com
plic
atio
ns,
leng
th o
f sta
y.
All
hosp
itals
had
sign
ifica
nt re
duct
ions
in to
tal
dire
ct v
aria
ble
cost
s, m
any
com
ing
from
re
duce
d nu
rsin
g co
sts (
e.g.
dec
reas
ed le
ngth
of
stay
). Pa
ymen
t met
hod
alig
ns p
hysi
cian
&
hosp
ital i
ncen
tives
. Im
prov
emen
ts in
ef
ficie
ncie
s wer
e m
ade
with
out d
imin
ishi
ng
qual
ity o
f car
e.
136.
Pier
ce (1
997)
Li
tera
ture
revi
ew o
f ou
tcom
es re
late
d to
nu
rsin
g.
C
are
deliv
ery
syst
em, s
taff
m
ix, s
ize
of
hosp
ital,
nurs
es’
educ
atio
n, u
se o
f ag
ency
pe
rson
nel.
N
urse
sa
tisfa
ctio
n,
cost
s of c
are,
pa
tient
co
mpl
icat
ions
.
Clin
ical
nur
sing
stud
ies a
nd st
udie
s of c
are
deliv
ery
syst
ems s
houl
d be
inte
grat
ed.
Incr
ease
d nu
rsin
g ca
re, b
ette
r pre
pare
d st
aff,
mor
e co
nsis
tenc
y am
ong
care
give
rs a
nd
lead
ersh
ip c
orre
late
with
low
er m
orta
lity.
Evidence-based Staffing 76
8. Glossary
• BNS – Bachelor of Nursing Science
• LPN – Licensed Practical Nurse
• RPN – Registered Practical Nurse
• RN – Registered Nurse
• WHPPD – worked hours per patient day
9. References
Patient Characteristics
1. Alterman, T., Shekelle, R., Vernon, S. & Burau, K. (1994). Decision latitude,
psychological demand, job strain and coronary heart disease in the western electric study. American Journal of Epidemiology, 139(6), 620-627.
2. Bull, M. J., Hansen, H. E., & Gross, C. R. (2000). A professional-patient partnership model of discharge planning with elders hospitalized with heart failure. Applied Nursing Research, 13(1), 19-28.
3. Calvin, J. E., Klein, L. W., VandenBerg, B. J., Meyer, P., Ramirez-Morgen, L. M., & Parrillo, J. E. (1998). Clinical predictors easily obtained at presentation predict resource utilization in unstable angina. American Heart Journal, 136, 373-381.
4. Crilley, J. G., & Farrer, M. (2001). Impact of first myocardial infarction on self-perceived health status. QJM: Monthly Journal of the Association of Physicians, 94(1), 13-18.
5. Czar, M.L., & Engler, M. M. (1997). Perceived learning needs of patients with coronary artery disease using a questionnaire assessment tool. Heart & Lung, 26(2), 109-117.
6. Hemingway, H., & Marmot, M. (1999). Evidence based cardiology: Psychosocial factors in the aetiology and prognosis of coronary heart disease. Systematic review of prospective cohort studies. British Medical Journal, 318(7196), 1460-7.
7. Johnson, J., Stewart, W., Hall, E., Fredlund, P., & Theorell, T. (1996). Long-term psychosocial work environment and cardiovascular mortality among Swedish men. American Journal of Public Health, 86(3), 324-31.
8. Marchette, R., & Holloron, F. (1986). Length of stay: Significant variable. Journal of Nursing Administration, 16(3), 12-20.
9. Shi, L. (1996). Patient and hospital characteristics associated with average length of stay. Healthcare Management Review, 21(2), 46-61.
10. Shih, F. J., Chu, S. H., Yu, P. J., Hu, W. Y., & Huang, G. S. (1997). Turning points of recover from cardiac surgery during the intensive care unit transition. Heart & Lung, 26(2), 9-108.
11. Siegrist, J., Peter, R., Junge, A., Cremer, P., & Seidel, D. (1990). Low status control, high effort work & ischemic heart disease: Prospective evidence from blue-collar men. Social Science & Medicine, 31(10), 1127-1134.
Evidence-based Staffing 77
12. Siegrist, J. (1996). Adverse health effects of high-effort/low-reward conditions. Journal of Occupational Health, 1(1), 27-41.
13. Silber, J., Rosenbaum, P., & Ross, R. (1995). Comparing the contributions of groups of predictors: Which outcomes vary with hospital rather than patient characteristics? Journal of the American Statistical Association, 90(429), 7-18.
14. Steptoe, A. (1999). Psychosocial factors in the aetiology of coronary heart disease. Heart 82(3), 258-9.
Nurse Characteristics
15. Bruce, S., Sale, J., Shamian, J., O’Brien-Pallas, L., & Thomson, D. (2002).
Musculoskeletal injuries, stress and absenteeism. Canadian Nurse, 98(9), 12-17. 16. Coutts, J. (2001). Health workplaces mean more satisfied nurses. Hospital Quarterly
(Summer), 57-58. 17. Josephson, M., Lagerstrom, M., Hagberg, M., & Wigaeus, H. E. (1997). Musculo-skeletal
symptoms and job strain among nursing personnel: A study over a three year period. Occupational and Environmental Medicine, 54, 681-685.
18. Josephson, M., Vingard, E., & MUSIC-Norrtalje Study Group (1998). Workplace factors and care seeking for low-back pain among female nursing personnel. Scandinavian Journal of Work, Environment and Health, 24(6), 465-472.
19. Toomingas, A., Theorell, T., Michelsen, H., Nordemar, R., & Stockholm MUSIC I Study Group (1997). Associations between self-rated psychosocial work conditions & musculoskeletal symptoms & signs. Scandinavian Journal of Work, Environment and Health, 23(2), 130-139.
20. Wunderlich, G., Sloan, F., & Davis, C. (1996). Nursing staff in hospitals & nursing homes: is it adequate? In G. S. Wunderlich, F A. Sloan, & C. K. Davis (Eds.), Washington, D.C.: National Academy Press
System Characteristics
21. Aiken, L., Clarke, S., & Sloane, D. (2002). Hospital staffing, organization, and quality of
and patient mortality, nurse burnout, and job satisfaction. JAMA: The Journal of the American Medical Association, 288(16), 1987-1993.
23. Aiken, L., Smith, H., & Lake, E. (1994). Lower Medicare mortality among a set of hospitals known for good nursing care. Medical Care, 32(8), 771-787.
24. Arthur, T., & James, N. (1994). Determining nurse staffing levels: A critical review of the literature. Journal of Advanced Nursing, 19, 558-565.
25. Baker, C., Messmer, P., Gyurko, C., Domagala, S., Conly, F., Eads, T., et al. (2000). Hospital ownership, performance, and outcomes: Assessing the state-of-the-science. Journal of Nursing Administration, 30(5), 227-240.
26. Blegen, M., & Vaughn, T. (1998). A multi-site study of nurse staffing and patient occurrences. Nursing Economics, 16(4), 196-198.
27. Blegen, M., Goode, C., Reed, L. (1998). Nurse staffing and patient outcomes. Nursing Research, 47(1), 43-50.
Evidence-based Staffing 78
28. Brown, S. (2001) Research evidence linking staffing and patient outcomes. Orthopaedic Nursing, 20(1), 67-68.
29. Buerhaus, P. (1997). What is the harm in imposing mandatory nurse staffing? Nursing Economics, 15(2), 66-72.
30. Burke, R. J. (2003). Hospital restructuring, workload, and nursing staff satisfaction and work experiences. Healthcare Manager, 22(2), 99-107.
31. California Nurses Association (2001). CNA On-Line, 12 reasons for the CNA backed nurse-to-patient ratios. Retrieved October 5, 2001, from http://www.calnurse.org/cna/staff3/12reasons.html.
32. Callaghan, L. A., Cartwright, D. W., O’Rourke, P., & Davies, M. W. (2003). Infant to staff ratios and risk of mortality in very low birthweight infants. Archives of Disease in Childhood Fetal and Neonatal Edition, 88, F94-F97.
33. Campbell, T., Taylor, S., Callaghan, S. Shuldham, C. (1997). Case mix type as a predictor of nursing workload. Journal of Nursing Management, 5, 237-240.
34. Canadian Labour and Business Centre (2002). Full-time equivalents and financial costs associated with absenteeism, overtime, and involuntary part-time employment in the nursing profession (pp. 1-10). Ottawa, ON.
35. Clark, A. (2002). Nurse staffing levels and prevention of adverse events. Clinical Nurse Specialist, 16(5), 237-238.
36. Clarke, S. P., Rockett, J. L., Sloane, D. M., & Aiken, L. H. (2002). Organizational climate, staffing, and safety equipment as predictors of needlestick injuries and near-misses in hospital nurses. American Journal of Infection Control, 30(4), 207-216.
37. Cockerill, R., O’Brien-Pallas, L., Bolley, H., & Pink, G. (1993). Measuring nursing workload for case costing. Nursing Economics, 11(6), 342-349.
38. Doran, D., McGillis Hall, L., Sidani, S., O’Brien-Pallas, L., Donner, G., Baker, G. R., et al. (2001). Nursing staff mix and patient outcome achievement: The mediating role of nurse communication. International Nursing Perspective, 1(2-3), 74-83.
39. Eisenberg, J., Bowman, C., & Foster, N. (2001). Does a healthy healthcare workplace produce higher-quality care? Journal on Quality Improvement, 27(9), 444-457.
40. Gauci Borda, R., & Norman, I. (1997). Factors influencing turnover and absence of nurses: A research review. International Journal of Nursing Studies, 34(6), 385-394.
41. Gaudine, A. P. (2000). What do nurses mean by workload and by work overload? Journal of Nursing Leadership, 13(2), 22-27.
42. Greenglass, R., & Burke, R. (2001). Impact of restructuring scale: an instrument to measure effects of hospital restructuring. Healthcare Management Forum, 14(3), 24-28.
43. Grillo-Peck, A. M., & Risner, P. B. (1995). The effect of a partnership model on quality and length of stay. Nursing Economics, 13(6), 367-374.
44. Halloran, E. (1985). Nursing workload, medical diagnosis related groups and nursing diagnosis. Research in Nursing and Health, 8, 421-433.
45. Hartz, A., Krakauer, H., Kuhn, E., Young, M., Jacobsen, S., Gay, G., et al. (1989). Hospital characteristics and mortality rates. The New England Journal of Medicine, 321(25), 1720-1725.
46. Hendrix, T. J., Foreman, S. E. (2001). Optimal long-term care nurse-staffing levels Nursing Economics$, 10(4), 164-175.
47. Kenney, P. (2001). Maintaining quality care during a nursing shortage using licensed practical nurses in acute care. Journal of Nursing Care Quality, 15(4), 60-68.
Evidence-based Staffing 79
48. Knaus, W., Draper, E., Wagner, D., & Zimmerman, J. (1986). An evaluation of outcome from intensive care in major medical centers. Annals of Internal Medicine, 104(3), 410-418.
49. Kobs, A. (1997). The adequacy of nurse staffing. Nursing Management, 28(11), 16-20. 50. Kovner, C. (2001). The impact of staffing and the organization of work on patient
outcomes and healthcare workers in healthcare organizations. Journal on Quality Improvement, 27(9), 458-468.
51. Kovner, C., & Gergen, P. J. (1998) Nurse Staffing Levels & Adverse Events Following Surgery in US Hospitals. Journal of Nursing Scholarship, 30(4), 315-321.
52. Krakauer, H., Bailey, R. C., Skellan, K., Stewart, J., Hartz, A., Kuhn, et al. (1992). Evaluation of the HCFA Model for the analysis of mortality following hospitalization. Health Services Research, 27(3), 317-335.
53. Kramer, M., &Schmalenberg, C. (1988). Magnet hospitals: Part I, Institutions of excellence. Journal of Nursing Administration, 18(1), 13-24.
54. Kramer, M., & Schmalenberg, C. (1988). Magnet hospitals: Part II, Institutions of excellence. Journal of Nursing Administration, 18(2), 11-19.
55. Kutsogiannis, C. H., Triska, O. H., Johnston, R. G., & Noseworthy, T. (2001). The organizational structure of intensive care units and its influence on patient outcomes. Healthcare Management Forum, 14(4), 28-34.
56. Manitoba Nursing Strategy (2003). Manitoba nursing strategy: Three year progress report. Winnipeg. Manitoba Government.
57. Maxwell, J. (2002) Creating high-quality health-care workplaces. Canadian Healthcare Management, 102(11), 101-110.
58. McGillis Hall, L., Doran, D., Baker, G., Pink, G., Sidani, S., O’Brien-Pallas, L., et al. (2002). Nurse staffing and work status in medical, surgical and obstetrical units in Ontario teaching hospitals. Hospital Quarterly, 5(4), 64-69.
59. Mitchell, P. H., Armstrong, S., Forshee Simpson, T., & Lentz, M. (1989). American Association of Critical-Care Nurses Demonstration Project: Profile of excellence in critical care nursing. Heart & Lung 18(3), 219-237.
60. Mitchell, P. H., Shortell, S. M. (1997). Adverse outcomes & variations in organization of care delivery. Medical Care, 35(11), NS19-NS32.
61. Needleman, J., Buerhaus, P., Mattke, S., Stewart, M., & Zelevinsky, K. (2002). Nurse-staffing levels and the quality of care in hospitals. New England Journal of Medicine, 346(22), 1715-1722.
62. O’Brien-Pallas L, Irvine D, Peereboom E, & Murray M (1997). Measuring nursing workload: Understanding the variability. Nursing Economics$, 15(4), 171-182.
63. O’Brien-Pallas, L., Irvine Doran, D., Murray, M., Cockerill, R., Sidani, S., Laurie-Shaw, B., et al. (2001). Evaluation of a client care delivery model part 1: Variability in nursing utilization in community home nursing. Nursing Economic$, 19(6), 267-276.
64. O’Brien-Pallas, L. L., Cockerill, R., & Leatt, P. (1992). Different systems–different costs. Journal of Nursing Administration, 22(12), 17-22.
65. O'Brien-Pallas, L. L., Thomson, D., Alksnis, C., & Bruce, S. (2001). The economic impact of nurse staffing decisions: Time to turn down another road. Hospital Quarterly, 4(3), 42-50.
67. Potter, P., Barr, N., McSweeney, M., & Sledge, J. (2003). Identifying nurse staffing and patient outcome relationships: A guide for change in care delivery. Nursing Economics, 21(4), 158-166.
68. Prescott, P. A. (1986). DRG prospective reimbursement: The nursing intensity factor. Nursing Management, 17(1), 43-48.
69. Prescott, P. A. (1993). Nursing: An important component of hospital survival under a reformed healthcare system. Nursing Economics, 11(4), 192-199.
70. Robertson, R., Dowd, S., & Hassen, M. (1997). Skill-specific staffing intensity and the cost of hospital care. Healthcare Management Review, 22(4), 61-71.
71. Sainfort, F., Karsh, B., Booske, B., & Smith, M. (2001). Applying quality improvement principles to achieve healthy work organizations. Journal of Quality Improvement, 27(9), 469-483.
72. Seago, J., Ash, M., Spetz, J., Coffman, J., & Grumbach, K. (2001). Hospital registered nurse shortages: environmental, patient, and institutional predictors. Health Services Research, 36(5), 831-852.
73. Seybolt, J. W. (1986). Dealing with premature employee turnover. Journal of Nursing Administration, 16, 26-32.
74. Silber, J. H., Williams, S. V., Krakauer, H., & Schwartz, J. S. (1992). Hospital & patient characteristics associated with death after surgery. Medical Care, 30(7), 615-629.
75. Sochalski, J. (2001). Quality of care, nurse staffing, and patient outcomes. Policy, Politics & Nursing Practice, 2(1) 9-18.
76. Sovie, M. D., & Jawad, A. F. (2001). Hospital restructuring and its impact on outcomes: Nursing staff regulations are premature. Journal of Nursing Administration, 31(12), 588-600.
77. Strickland, B., & Neely, S. (1995). Using a standard staffing index to allocate nursing staff. Journal of Nursing Administration, 25(3), 13-21.
78. Tarnow-Mordi, W. O., Hau, C., Warden, A., & Shearer, A. J. (2000). Hospital mortality in relation to staff workload: A 4-year study in an adult intensive-care unit. The Lancet, 356, 185-189.
79. Wai, T., Bame, S., & Robinson, C. (1998). Review of nursing turnover research. Social Science Medicine, 47(12), 1905-1924.
80. Weisman, C. S., Alexander, C. S., & Chase, G. A. (1981). Evaluating reasons for nursing turnover-comparison of exit interview and panel data. Evaluation and the Health Professions, 4(2), 107-127.
81. Whitman, G., Kim, Y., Davidson, L., Wolf, G., & Wang, S. (2002). The impact of staffing on patient outcomes across specialty units. Journal of Nursing Administration. 32(12), 633-639.
Throughputs 82. Allred, C. A., Michel, Y., Arford P. H., Carter, V., Veitch J. S., Dring, R., et al. (1994).
Environmental uncertainty: Implications for practice model redesign. Nursing Economics, 12(6), 318-325.
83. Brown, M. M. (2000). Implementation Strategy: One-stop recovery for cardiac surgical patients. AACN Clinical Issues: Advanced Practice in Acute Critical Care, 11(3), 412-423
Evidence-based Staffing 81
84. Cady, N., Mattes, M., & Burton, S. (1995). Reducing intensive care unit length of stay: A step-down unit for first-day heart surgery patients. Journal of Nursing Administration, 25(12), 29-35.
85. Cohn, L., Rosborough, D., & Fernandez, J. (1997). Reducing costs and length of stay and improving efficiency and quality of care in cardiac surgery. The Annals of Thoracic Surgery, 64, S58-60.
86. Drenkard, K. (2001). Creating a future worth experiencing. Journal of Nursing Administration, 31(7/8), 364-376.
87. Duffy, J., & Lemieux, K. (1995). A cardiac service line approach to patient-centred care. Nursing Administration Quarterly, 20 (1), 12-23.
88. Helt, E. & Jelinek, R. (1988). In the wake of cost cutting, nursing productivity and quality improve. Nursing Management, 19(6), 36-48.
89. Lamb, G. S., & Stempel, J. E. (1994). Nurse case management from the client's view: Growing as insider-expert. Nursing Outlook, 42(1), 7-13.
Patient Outcomes 90. Brooten, D., & Naylor, M. (1995). Nurses’ effect on changing patient outcomes. Image:
Journal of Nursing Scholarship, 27(2), 95-99. 91. Dansky, K. H., Brannoon, D., & Wangsness, S. (1994). Human resources management
practices and patient satisfaction in home healthcare. Home Health Services Quarterly, 15(1), 43-56.
92. Fortinsky, R. H., & Madigan, E. A. (1997). Home care resource consumption and patient outcomes: What are the relationships. Home Healthcare Services Quarterly, 16(3), 55-73.
93. Lancaster, A. (1997). Understaffing can increase infection rates. RN, 60(10), 79. 94. O’Brien-Pallas, L., Doran, D., Murray, M., Cockerill, R., Sidani, S., Laurie-Shaw, B., et al.
(2002). Evaluation of a client care delivery model, part 2: variability in client outcomes in community home nursing. Nursing Economic$, 20(1), 13-21, 36.
95. Proctor, T., Yarcheski, A., & Oriscello, R. (1996). The relationship of hospital process variables to patient outcome post-myocardial infarction. International Journal of Nursing Studies, 33(2), 121-130.
96. Rohrer, J. E., Momany, E. T., & Chang, W. (1993). Organizational predictors of outcomes of long-stay nursing home residents. Social Science & Medicine, 37(4), 549-54.
97. Roseman, C., & Booker, J. (1995). Workload and environmental factors in hospital medication errors. Nursing Research, 44(4), 226-230.
98. Silber, J. H., Rosenbaum, P. R., Sanford Schwartz, J., Ross, R. N., & Williams, S. V. (1995). Evaluation of the complication rate as a measure of quality care in coronary artery bypass graft surgery. JAMA: The Journal of the American Medical Association, 274(4), 317-323.
Nurse Outcomes
99. Adams, A., & Bond, S. (2000). Hospital nurses’ job satisfaction, individual and
organizational characteristics. Journal of Advanced Nursing, 32(3), 536-543.
Evidence-based Staffing 82
100. Aiken, L, & Sloane, D. (1997). Effects of organizational innovations in AIDS care on burnout among urban hospital nurses. Work and Occupations, 24(4), 453-477.
101. Aiken, L., Clarke, S., & Sloane, D. (2000). Hospital restructuring: Does it adversely affect care and outcomes. Journal of Nursing Administration, 30(10), 457-465.
102. Bakker, A., Christel, K., Johannes, S., & Wilmar, S. (2000). Effort-reward imbalance and burnout among nurses. Journal of Advanced Nursing, 31(4), 884-891.
103. Baumann, A., Giovannetti, P., O’Brien-Pallas, L., Mallette, C., Deber, R., Blythe, J., et al. (2001). Healthcare restructuring: The impact of job change. Canadian Journal Nursing Leadership, 14(1), 14-20.
104. Blegen, M. (1993). Nurses’ job satisfaction: A meta-analysis of related variables. Nursing Research, 42(1), 36-41.
105. Bourbonnais, R., Comeau, M., Vezina, M., & Dion, G. (1998). Job strain, psychological distress, & burnout in nurses. American Journal of Industrial Medicine, 34, 20-28.
106. Buchan, J. (1999). Still attractive after all these years? Magnet hospitals in a changing healthcare environment. Journal of Advanced Nursing, 30(1), 100-108.
107. Burke, R., & Greenglass, E. (2000). Effects of hospital restructuring on full time and part time nursing staff in Ontario. International Journal of Nursing Studies, 37, 163-171.
108. Cameron, S. J., Horsburgh, M. E., & Armstrong-Stassen, M. (1994). Job satisfaction, propensity to leave and burnout in RNs and RNAs: A multivariate perspective. Canadian Journal of Nursing Administration, 7(3), 43-64.
109. Carey, S. J., Campbell, S. T. (1994). Preceptor, mentor, and sponsor roles: creative strategies for nurse retention. Journal of Nursing Administration, 24(12), 39-48.
110. Clarke, H., Laschinger, H., Giovannetti, P., Shamian, J., Thomson, D., & Tourangeau, A. (2001). Nursing shortages: Workplace environments are essential to the solution. Hospital Quarterly (Summer), 50-56.
111. Davison, H., Folcarelli, P. H., Crawford, S., Duprat, L. J., & Clifford, J. C. (1997). 112. Demerouti, E., Bakker, A., Nachreiner, F., & Schaufeli, W. (2000). A model of burnout
and life satisfaction amongst nurses. Journal of Advanced Nursing, 32(2), 454-464. 113. Joseph, J., & Deshpande, S. (1997). The impact of ethical climate on job satisfaction of
nurses. Healthcare Management Review, 22(1), 76-81. 114. Kangas, S., Kee, C. C., McKee-Waddle, R. (1999). Organizational factors, nurses’ job
satisfaction, and patient satisfaction with nursing care. Journal of Nursing Administration, 29(1), 32-42.
115. Kovner, C., Hendrickson, G., Knickman, J., & Finkler, S. (1994). Nursing care delivery models and nurse satisfaction. Nursing Administration Quarterly, 19(1), 74-85.
116. Kramer, M., & Hafner, L. (1989). Shared values: Impact on staff nurse job satisfaction and perceived productivity. Nursing Research, 38(3), 172-176.
117. Kramer. M., & Schmalenberg, C. (1990). Job satisfaction and retention: Insights for the 90’s, Parts I and II. Nursing, 21, 2-7, 9-13.
118. Kutzscher, L. I. T., Sabiston, J. A., Laschinger-Spence, H. K., & Nish, M. (1997). The effects of teamwork on staff perception and empowerment and job satisfaction. Healthcare Management Forum, 10(2), 12-17.
119. Laschinger, H., Finegan J., & Shamian, J. (2001). The impact of workplace empowerment, organizational trust, on staff nurses’ work and organizational commitment. Healthcare Management Review, 26(3), 7-23.
Evidence-based Staffing 83
120. Leiter, M. P., Harvie, P., & Frizzell, C. (1998). The correspondence of patient satisfaction and nurse burnout. Social Science & Medicine, 47(10), 1611-1617
121. McGillis Hall, L., Doran, D., Baker, G., Pink, G., Sidani, S., O’Brien-Pallas, L., et al. (2001). A study of the impact of nursing staff mix models and organizational change strategies on patient, system and nurse outcomes. Toronto, ON: Faculty of Nursing, University of Toronto and Canadian Health Services Research Foundation/Ontario Council of Teaching Hospitals.
122. McNeese-Smith, D., & Crook, M. (2003). Nursing values and a changing nurse workforce: Values, age, and job stages. Journal of Nursing Administration, 33(5), 260-270.
123. Moss, R., & Rowles, C. J. (1997). Staff nurse job satisfaction and management style. Nursing Management, 28(1), 32-34.
124. Munro, B. H. (1983). Job satisfaction among recent graduates of schools of nursing. Nursing Research, 32, 350-355.
125. Nakata, J.A., & Saylor, C. (1994). Management style and staff nurse satisfaction in a changing environment. Nursing Administration Quarterly, 18(3), 51-57.
126. Registered Nurses Association of Ontario. (2002). Tracking the Nursing Task Force (1999): RNs rate their nursing work life. Toronto, ON: RNAO.
127. Roedel, R., & Nystrom, P. (1988). Nursing jobs and satisfaction. Nursing Management, 19(2), 34-38.
128. Shullanberger, G. (2000). Nurse staffing decisions: An integrative review of the literature. Nursing Economic$, 18, (13), 124-32, 146-8.
129. Stordeur S, D’hoore W, & Vandenberghe, C. (2001). Leadership, organizational stress, & emotional exhaustion among hospital nursing staff. Journal of Advanced Nursing 35(4), 533-542.
130. Tonges, M., Rothsein, H., & Carter, H. (1998). Sources of satisfaction in hospital nursing practice. Journal of Nursing Administration, 28(5) 47-61.
131. Tzeng, H-M., & Ketefian, S. (2002). The relationship between nurses’ job satisfaction and inpatient satisfaction: An exploratory study in a Taiwan teaching hospital. Journal of Nursing Care Quality, 16(2), 39-49.
132. Vernarec, E. (2000). Just say “no” to mandatory overtime? RN, 63(12), 69-70, 72, 74.
System Outcomes 133. Anderson, B., Higgins, L., & Rozmus, C. (1999). Critical pathways: application to selected
134. Bourbonnais, R., & Mondor Myrto (2001). Job strain & sickness absence among nurses in the Province of Quebec. American Journal of Industrial Medicine, 39, 194-202.
135. Liu, C. F., Subramanian, S., & Cromwell, J. (2001). Impact of global bundled payments on hospital costs of coronary artery bypass grafting. Journal of Healthcare Finance, 27(4), 39-54.
136. Pierce, S. (1997). Nurse-sensitive healthcare outcomes in acute care settings: An integrative analysis of the literature. Journal of Nursing Care Quality. 11(4), 60-72.
Evidence-based Staffing 84
Appendix B. Patient Care Delivery Model
Patient Characteristics• Demographics• Significant other support• Medical diagnoses• Nursing diagnoses• OMAHA knowledge, behaviour,
System Characteristics• Geographic location• Hospital size• Unit size, type, patient mix• Occupancy
System Behaviours• Workload• Nurse-to-patient ratios• Proportion of RN worked hours• Continuity of care/shift change• Unit instability• Overtime• Use of agency & relief staff• # of units nurse works on• Non-nursing tasks
Patient Outcomes• Medical consequences• OMAHA knowledge, behaviour,
status• SF-12 health status• Resource intensity weight• Mortality
Nurse Outcomes• Burnout• Effort & reward imbalance• Autonomy & control• Job satisfaction• Relationships with MDs• SF-12 health status• Violence at work
System Outcomes• Length of stay• Cost per resource intensity
weight• Quality of patient care• Quality of nursing care• Interventions delayed• Interventions not done• Absenteeism• Intent to leave
Patient Care
Delivery System in Cardiac &
Cardio-vascular
Units
INTERMEDIATE OUTPUTS
• Worked hours• Productivity/
Utilization
Environmental Complexity Factors• Resequencing of work in
response to others• Unanticipated delays due to
changes in patient acuity• Characteristics & composition
of caregiving team
INPUTS
Feedback
THROUGHPUTS
OUPUTS
Perceived Work Environment
Interventions
Patient Care Delivery Model(O’Brien-Pallas et al., 2003)
Evidence-based Staffing 85
Appendix C. Tables
Table 1. Key Variables and Data Sources ......................................................................................................86 Table 2. Estimates for Patient Outcomes from the Hierarchical Linear Models.................................87 Table 3. Odds Ratios for Patient Outcomes from the Hierarchical Linear Models............................88 Table 4: Hierarchical Logistic Regression for Medical Consequences Developed During Hospital
Stay .......................................................................................................................................................89 Table 5: Hierarchical Logistic Regression for Improvement in Patients’ Physical Health..............90 Table 6: Hierarchical Logistic Regression for Improvement in Patients’ Mental Health ................91 Table 7: Hierarchical Logistic Regression for Patients’ Knowledge Improvement at
Discharge/Diagnoses Resolved ....................................................................................................92 Table 8: Hierarchical Logistic Regression for Patients’ Behaviour Improvement at
Discharge/Diagnoses Resolved ....................................................................................................93 Table 9: Hierarchical Logistic Regression for Patients’ Status Improvement at
Discharge/Diagnoses Resolved ....................................................................................................94 Table 10. Estimates for Nurse Outcomes in the Hierarchical Linear Models......................................95 Table 11. Odds Ratios for Nurse Outcomes in the Hierarchical Linear Models.................................96 Table 12: Hierarchical Linear Regression for Nurse-Physician Relationship .....................................97 Table 13: Hierarchical Linear Regression for Autonomy..........................................................................98 Table 14: Hierarchical Logistic Regression for Job Satisfaction.............................................................99 Table 15: Hierarchical Logistic Regression for Emotional Exhaustion...............................................100 Table 16: Hierarchical Linear Regression for Nurses’ Physical Health ..............................................101 Table 17: Hierarchical Linear Regression for Nurses’ Mental Health.................................................102 Table 18. Estimates for System Outcomes from the Hierarchical Linear Models............................103 Table 19. Odds Ratios for System Outcomes in the Hierarchical Linear Models ............................104 Table 20: Hierarchical Logistic Regression for Patients with Shorter Than Expected Length of
Stay .....................................................................................................................................................105 Table 21: Hierarchical Logistic Regression for Interventions Not Done ............................................106 Table 22: Hierarchical Logistic Regression for Interventions Delayed...............................................107 Table 23: Hierarchical Logistic Regression for Quality of Nursing Care...........................................108 Table 24: Hierarchical Logistic Regression for Quality of Patient Care .............................................109 Table 25: Hierarchical Logistic Regression for Absenteeism ................................................................110 Table 26: Hierarchical Logistic Regression for Intent to Leave ............................................................111 Table 27: Hierarchical Linear Regression for Productivity/Utilization...............................................112 Table 28: Hierarchical Linear Regression for Cost per Resource Intensity Weight (Log Scale).113 Table 29: Hierarchical Linear Regression for Worked Hours per Patient (Log Scale) ...114 Table 30: Hierarchical Linear Models for Patient, Nurse, and System Outcomes on Congruence
Between PRN Hours and Actual Worked Hours per Patient.............................................115 Table 31: Summary Table of the Effect of Nursing Hours, Proportion of RN Worked Hours,
Nurse-Patient Ratio, and Productivity/Utilization on Patient, Nurse and System Outcomes, in Odds Ratio, Coefficient, and Cut point .........................................................116
Evidence-based Staffing 86
Table 1. Key Variables and Data Sources
Measure When Administered Method/Source SF-12 Health Status Survey (physical and mental health status)
• Admission or in pre-op clinic
• Discharge
• Patient self-report
NANDA Nursing Diagnoses and OMAHA Problem Rating Scale
• Admission
• Discharge
• Daily to identify new or resolved diagnoses
• Data collector from patient chart/kardex and nurse
Patient Data Form • Once over patient stay • Data collector from patient chart/kardex/interview
PRN Workload Tool • Daily • Data collector from patient chart/kardex, unit workload tool, and nurse
Case Mix Group • After discharge • Electronic file submitted by Heath Records Department
Resource Intensity Weight
• After discharge • Electronic file submitted by Heath Records Department
Nurse Survey • Once at beginning of data collection
• Nurse self-report
Daily Unit Staffing Form • Daily • Data collector from unit assignment sheet and ward clerk
Environmental Complexity Scale
• Daily • Nurses
Evidence-based Staffing 87
Table 2. Estimates for Patient Outcomes from the Hierarchical Linear Models
Predictor Medical Conseq.
Physical Health
Mental Health
OmahaKnowledge
Omaha Behaviour
OmahaStatus
Patient Level Pre-Operative Clinics Referral for Homecare 1.43 *Medical Consequences Resource Intensity Weight 0.02 -0.10 * -0.01 0.01 0.08 0.05Number of Nursing Diagnoses 0.43 * -0.12 * -0.06 0.05 0.06 0.08Physical Health at Admission -0.01 -0.13 * 0.01 * 0.01 0.01 0.01Mental Health at Admission -0.03 * 0.00 -0.09 * 0.00 0.00 0.00Knowledge at Admission -1.33 * Behaviour at Admission -2.14 *Status at Admission -1.48 *Worked Hours per Patient 0.13 * 0.00 -0.06 * 0.04 -0.02 0.00Length of Stay 0.03 0.01 -0.04 * 0.01 -0.01 0.00
Unit Level Proportion of RN Worked Hours 3.72 -0.94 0.53 5.55 * 0.42 2.06Productivity/Utilization 7.40 * 17.83 * 4.94 *Productivity/Utilization (Quadratic) -10.11 *Productivity/Utilization (beyond 88%) -1.49 * -0.80 *Productivity/Utilization (beyond 80%) -0.60 *Productivity/Utilization (beyond 85%) -0.67 0.30Proportion of Full-time Employment 2.13 * Proportion of Nurses Reporting Shift Changes -5.75 *
* for p-value at 0.05 or less Notes: (1) All patient outcome variables were dichotomized and modeled in hierarchical logistic regressions. For medical consequences, 1 = development of complications, falls with injury, or death; for physical and mental health, 1 = improved at discharge; for Omaha knowledge, behaviour, and status, 1 = improvement at discharge or diagnoses resolved. (2) The productivity/utilization cut point is 88.2% for Omaha behaviour.
Evidence-based Staffing 88
Table 3. Odds Ratios for Patient Outcomes from the Hierarchical Linear Models
Predictor Medical Conseq.
Physical Health
Mental Health
OmahaKnowledge
Omaha Behaviour
OmahaStatus
Patient Level Pre-Operative Clinics Referral for Homecare 4.19 *Medical Consequences Resource Intensity Weight 1.02 0.90 * 0.99 1.01 1.08 1.05Number of Nursing Diagnoses 1.53 * 0.89 * 0.94 1.05 1.07 1.08Physical Health at Admission 0.99 0.88 * 1.01 * 1.01 1.01 1.01Mental Health at Admission 0.97 * 1.00 0.92 * 1.00 1.00 1.00Knowledge at Admission 0.26 * Behaviour at Admission 0.12 * Status at Admission 0.23 *Worked Hours per Patient 1.13 * 1.00 0.94 * 1.04 0.98 1.00Length of Stay 1.03 1.01 0.96 * 1.01 0.99 1.00
* for p-value at 0.05 or less Notes: (1) All patient outcome variables were dichotomized and modeled in hierarchical logistic regressions. For medical consequences, 1 = falls with injury, medication errors, death, or development of complications; for physical and mental health, 1 = Improved at discharge; for Omaha knowledge, behaviour and status, 1 = improvement at discharge or diagnoses resolved. (2) The productivity/utilization cut point is 88.2% for Omaha behaviour. (3) The odds ratios for proportion of RN worked hours, proportion of full-time employment and proportion of nurses reporting shift changes are based on a 10% increase. (4) Odds ratio for quadratic transformation of productivity/utilization is not reported.
Evidence-based Staffing 89
Table 4: Hierarchical Logistic Regression for Medical Consequences Developed During Hospital Stay
Predictor Beta SE Odds Ratio
Patient Level Referral for Homecare 1.43 0.36 4.19 * Resource Intensity Weight 0.02 0.06 1.02 Number of Nursing Diagnoses 0.43 0.08 1.53 * Physical Health at Admission -0.01 0.01 0.99 Mental Health at Admission -0.03 0.01 0.97 * Worked Hours per Patient 0.13 0.05 1.13 * Length of Stay 0.03 0.02 1.03 Nurse Level Education (ref: Diploma) 0.12 0.63 1.13 Overtime Hours -0.02 0.07 0.98 Interventions Not Done -0.97 0.70 0.38 Interventions Delayed 1.08 0.64 2.94 Physical Health 0.03 0.04 1.03 Mental Health -0.02 0.03 0.98 Nurse-Patient Ratio 0.25 0.23 1.28 Unit Level Proportion of RN Worked Hours 3.72 2.59 1.45 Productivity/Utilization (beyond 85%) -0.67 0.53 0.51 * p-value at 0.05 or less Notes: (1) For measurements of predictor and outcome variables, see Appendix F. (2) Odds ratio for proportion of RN worked hours is based on a 10% increase.
Evidence-based Staffing 90
Table 5: Hierarchical Logistic Regression for Improvement in Patients’ Physical Health
Predictor Beta SE Odds Ratio
Patient Level Resource Intensity Weight -0.10 0.04 0.90 * Number of Nursing Diagnoses -0.12 0.04 0.89 * Physical Health at Admission -0.13 0.01 0.88 * Mental Health at Admission 0.00 0.01 1.00 Worked Hours per Patient 0.00 0.02 1.00 Length of Stay 0.01 0.01 1.01 Nurse Level Education (ref: Diploma) 0.11 0.25 1.11 Overtime Hours -0.08 0.04 0.93 * Interventions Not Done 0.08 0.40 1.08 Interventions Delayed -0.02 0.33 0.98 Physical Health -0.01 0.02 1.00 Mental Health -0.01 0.01 0.99 Nurse-Patient Ratio 0.05 0.08 1.05 Unit Level Proportion of RN Worked Hours -0.94 1.15 0.91 Productivity/Utilization (beyond 80%) -0.60 0.26 0.55 * * p-value at 0.05 or less Notes: (1) For measurements of predictor and outcome variables, see Appendix F. (2) Odds ratio for proportion of RN worked hours is based on a 10% increase.
Evidence-based Staffing 91
Table 6: Hierarchical Logistic Regression for Improvement in Patients’ Mental Health
Predictor Beta SE Odds Ratio
Patient Level Resource Intensity Weight -0.01 0.04 0.99 Number of Nursing Diagnoses -0.06 0.04 0.94 Physical Health at Admission 0.01 0.01 1.01 * Mental Health at Admission -0.09 0.01 0.92 * Worked Hours per Patient -0.06 0.03 0.94 * Length of Stay -0.04 0.02 0.96 * Nurse Level Education (ref: Diploma) 0.05 0.24 1.05 Overtime Hours 0.04 0.03 1.04 Interventions Not Done 0.27 0.34 1.32 Interventions Delayed -0.10 0.29 0.91 Physical Health 0.01 0.01 1.01 Mental Health 0.01 0.01 1.01 Nurse-Patient Ratio -0.14 0.08 0.87 Unit Level Proportion of RN Worked Hours 0.53 1.08 1.05 Productivity/Utilization (beyond 85%) 0.30 0.27 1.35
* p-value at 0.05 or less Notes: (1) For measurements of predictor and outcome variables, see Appendix F. (2) Odds ratio for proportion of RN worked hours is based on a 10% increase.
Evidence-based Staffing 92
Table 7: Hierarchical Logistic Regression for Patients’ Knowledge Improvement at Discharge/Diagnoses Resolved
Predictor Beta SE Odds Ratio
Patient Level Resource Intensity Weight 0.01 0.04 1.01 Number of Nursing Diagnoses 0.05 0.04 1.05 Physical Health at Admission 0.01 0.01 1.01 Mental Health at Admission 0.00 0.01 1.00 Knowledge at Admission -1.33 0.13 0.26 * Worked Hours per Patient 0.04 0.02 1.04 Length of Stay 0.01 0.02 1.01 Nurse Level Education (ref: Diploma) -0.29 0.25 0.75 Overtime Hours 0.02 0.03 1.02 Interventions Not Done -0.47 0.35 0.62 Interventions Delayed 0.10 0.30 1.11 Autonomy 0.17 0.04 1.19 * Physical Health -0.02 0.02 0.98 Mental Health -0.01 0.01 0.99 Nurse-Patient Ratio 0.11 0.08 1.11 Unit Level Proportion of RN Worked Hours 5.55 1.36 1.74 * Productivity/Utilization 7.40 1.16 n/a * Productivity/Utilization (beyond 88%) -1.49 0.32 n/a * Proportion of Full-Time Employment 2.13 0.61 1.24 * Proportion of Nurses Reporting Shift Changes -5.75 0.82 0.56 *
* p-value at 0.05 or less Notes: (1) For measurements of predictor and outcome variables, see Appendix F. (2) Odds ratios for proportion of RN worked hours, proportion of full-time employment, and proportion of nurses reporting shift changes are based on a 10% increase.
Evidence-based Staffing 93
Table 8: Hierarchical Logistic Regression for Patients’ Behaviour Improvement at Discharge/Diagnoses Resolved
Predictor Beta SE Odds Ratio
Patient Level Resource Intensity Weight 0.08 0.05 1.08 Number of Nursing Diagnoses 0.06 0.04 1.07 Physical Health at Admission 0.01 0.01 1.01 Mental Health at Admission 0.00 0.01 1.00 Behaviour at Admission -2.14 0.18 0.12 * Worked Hours per Patient -0.02 0.04 0.98 Length of Stay -0.01 0.02 0.99 Nurse Level Education (ref: Diploma) -0.08 0.28 0.92 Overtime Hours -0.03 0.04 0.97 Unit Instability -0.75 0.33 0.47 * Interventions Not Done 0.03 0.36 1.03 Interventions Delayed -0.01 0.35 0.99 Physical Health -0.01 0.02 0.99 Mental Health -0.01 0.01 0.99 Satisfaction with Current Job (ref: Dissatisfied) 1.02 0.27 2.76 * Nurse-Patient Ratio -0.03 0.08 0.97 Unit Level Proportion of RN Worked Hours 0.42 1.53 1.04 Productivity/Utilization 17.83 1.41 n/a * Productivity/Utilization (Quadratic) -10.11 0.99 n/a *
* p-value at 0.05 or less Notes: (1) For measurements of predictor and outcome variables, see Appendix F. (2) Odds ratio for proportion of RN worked hours is based on a 10% increase. (3) productivity/utilization cut point is 88.2%.
Evidence-based Staffing 94
Table 9: Hierarchical Logistic Regression for Patients’ Status Improvement at Discharge/Diagnoses Resolved
Predictor Beta SE Odds Ratio
Patient Level Resource Intensity Weight 0.05 0.05 1.05 Number of Nursing Diagnoses 0.08 0.05 1.08 Physical Health at Admission 0.01 0.01 1.01 Mental Health at Admission 0.00 0.01 1.00 Status at Admission -1.48 0.18 0.23 * Worked Hours per Patient 0.00 0.03 1.00 Length of Stay 0.00 0.02 1.00 Nurse Level Education (ref: Diploma) 0.10 0.29 1.10 Overtime Hours 0.02 0.04 1.02 Interventions Not Done -0.27 0.39 0.76 Interventions Delayed -0.42 0.33 0.66 Physical Health -0.02 0.02 0.98 Mental Health 0.02 0.01 1.02 Nurse-patient Ratio 0.16 0.09 1.17 Unit Level Proportion of RN Worked Hours 2.06 1.26 1.23 Productivity/Utilization 4.94 1.16 n/a * Productivity/Utilization (beyond 88%) -0.80 0.39 n/a *
* p-value at 0.05 or less Notes: (1) For measurements of predictor and outcome variables, see Appendix F. (2) Odds ratio for proportion of RN worked hours is based on a 10% increase.
Evidence-based Staffing 95
Table 10. Estimates for Nurse Outcomes in the Hierarchical Linear Models
Patient LevelProportion of Patients Attended Pre-operative Clinics 0.83 *Average Resource Intensity Weight 0.02 0.04 0.05 0.05Average Number of Nursing Diagnoses -0.10 * -0.05 -0.10 -0.07
Unit LevelUnit Occupancy -2.07 *Average Worked Hours -0.02 0.02 0.10 * 0.08 -0.10 * -0.07 *Proportion of RN Worked Hours 2.89 * 1.69 0.78 1.63 -3.28 * -1.37Productivity/Utilization (beyond 85%) -0.40 * 1.58 * -0.53 -0.20 -0.16Productivity/Utilization (beyond 80%) -0.85 *Average Age of Nurses -0.15 *Proportion of Nurses Reporting Shift Changes -2.08 *Proportion of Emotionally Exhausted Nurses -0.43Average Nurse-physician Relationship 0.88 *Proportion of Physically Healthy Nurses 4.62 *Proportion of Satisfied Nurses -3.88 *
* for p-value at 0.05 or lessNotes: (1) Except for nurse-physician relationship and autonomy, all nurse outcomes were dichotomized and modelled in hierarchial logistic regression. For satisfaction, 1 = satisfied with current job; for emotional exhaustion, 1 = at risk; for physical and mental health, 1 =healthier than average of female population.
Evidence-based Staffing 96
Table 11. Odds Ratios for Nurse Outcomes in the Hierarchical Linear Models
Patient LevelProportion of Patients Attended Pre-operative Clinics n/a *Average Resource Intensity Weight n/a n/a 1.05 1.05Average Number of Nursing Diagnoses n/a * n/a 0.90 0.93
Unit LevelUnit Occupancy n/a *Average Worked Hours n/a n/a 1.10 * 1.08 0.90 * 0.93 *Proportion of RN Worked Hours n/a * n/a 1.08 1.18 0.72 * 0.87Productivity/Utilization (beyond 85%) n/a * n/a * 0.59 0.82 0.85Productivity/Utilization (beyond 80%) 0.43 *Average Age of Nurses 0.86 *Proportion of Nurses Reporting Shift Changes n/a *Proportion of Emotionally Exhausted Nurses 0.65Average Nurse-physician Relationship 2.40 *Proportion of Physically Healthy Nurses n/a *Proportion of Satisfied Nurses 0.68 *
* for p-value at 0.05 or lessNotes: (1) Except for nurse-physician relationship and autonomy, all nurse outcomes were dichotomized and modelled in hierarchial logistic regression. For satisfaction, 1 = satisfied with current job; for emotional exhaustion, 1 = at risk; for physical and mental health, 1 =healthier than average of female population. (2) The odds ratio for proportion of RN worked hours, proportion of nurses with BScN or above, proportion of nurses reporting shift changes, proportion of emotionally exhaused nurses, proportion of physically healthy nurses, proportion of satisfied nurses, proportion of nurses rating good nurse care quality are based on a 10% increase.
Evidence-based Staffing 97
Table 12: Hierarchical Linear Regression for Nurse-Physician Relationship
Predictor Beta SE Odds Ratio
Nurse Level Education (ref: Diploma) 0.16 0.14 n/a Full-Time Employment (ref: PT/Casual) 0.16 0.14 n/a Autonomy 0.30 0.03 n/a * Physical Health -0.01 0.01 n/a Mental Health 0.01 0.01 n/a Improved Quality of Patient Care (ref: Deteriorated) 0.29 0.15 n/a Good Quality of Nursing Care (ref: Poor) 0.59 0.22 n/a * Patient Level Average Resource Intensity Weight 0.02 0.02 n/a Average Number of Nursing Diagnoses -0.10 0.05 n/a * Nurse-Patient Ratio -0.37 0.18 n/a * Unit Level Average Worked Hours -0.02 0.03 n/a Proportion of RN Worked Hours 2.89 1.39 n/a * Productivity/Utilization (beyond 85%) -0.40 0.20 n/a * Proportion of Nurses Reporting Shift Changes -2.08 0.78 n/a * Proportion of Physically Healthy Nurses 4.62 1.01 n/a *
* p-value at 0.05 or less Note: For measurements of predictor and outcome variables, see Appendix F.
Evidence-based Staffing 98
Table 13: Hierarchical Linear Regression for Autonomy
Predictor Beta SE Odds Ratio
Nurse Level Education (ref: Diploma) -0.44 0.20 n/a * Full-Time Employment (ref: PT/Casual) 0.03 0.22 n/a Overtime Hours 0.01 0.02 n/a Clinical Expertise -0.33 0.16 n/a * Unit Instability -0.03 0.25 n/a Shift Change -0.01 0.20 n/a Interventions Not Done -0.33 0.26 n/a Interventions Delayed -0.10 0.23 n/a Effort and Reward Imbalance -0.89 0.29 n/a * Emotional Exhaustion -0.07 0.26 n/a Nurse-Physician Relationship 0.62 0.06 n/a * Absenteeism -0.36 0.25 n/a Physical Health 0.02 0.01 n/a Mental Health 0.02 0.01 n/a Satisfaction with Current Job (ref: Dissatisfied) 1.04 0.22 n/a * Improved Quality of Patient Care (ref: Deteriorated) 0.67 0.23 n/a * Good Quality of Nursing Care (ref: Poor) 0.28 0.32 n/a Nurse-Patient Ratio 0.67 0.24 n/a * Patient Level Proportion of Patients Attended Pre-operative Clinics 0.83 0.37 n/a * Average Resource Intensity Weight 0.04 0.03 n/a Average Number of Nursing Diagnoses -0.05 0.07 n/a Unit Level Unit Occupancy -2.07 1.03 n/a * Average Worked Hours 0.02 0.04 n/a Proportion of RN Worked Hours 1.69 2.01 n/a Productivity/Utilization (beyond 85%) 1.58 0.29 n/a *
* p-value at 0.05 or less Note: For measurements of predictor and outcome variables, see Appendix F.
Evidence-based Staffing 99
Table 14: Hierarchical Logistic Regression for Job Satisfaction
Predictor Beta SE Odds Ratio
Nurse Level Education (ref: Diploma) 0.44 0.22 1.56 * Full-Time Employment (ref: PT/Casual) 0.12 0.23 1.12 Overtime Hours -0.02 0.02 0.98 Clinical Expertise 0.09 0.19 1.09 Unit Instability -0.31 0.27 0.73 Shift Change 0.01 0.22 1.01 Interventions Not Done -0.13 0.27 0.88 Interventions Delayed 0.01 0.25 1.01 Effort and Reward Imbalance -0.49 0.39 0.61 Emotional Exhaustion -1.23 0.30 0.29 * Autonomy 0.21 0.05 1.24 * Nurse-Physician Relationship 0.06 0.07 1.06 Physical Health 0.02 0.01 1.02 Mental Health 0.02 0.01 1.02 Improved Quality of Patient Care (ref: Deteriorated) 0.37 0.25 1.45 Good Quality of Nursing Care (ref: Poor) 1.39 0.46 4.01 * Nurse-Patient Ratio 0.31 0.29 1.36 Patient Level Average Resource Intensity Weight 0.05 0.04 1.05 Average Number of Nursing Diagnoses -0.10 0.08 0.90 Unit Level Average Worked Hours 0.10 0.04 1.10 * Proportion of RN Worked Hours 0.78 1.99 1.08 Productivity/Utilization (beyond 80%) -0.85 0.32 0.43 *
* p-value at 0.05 or less Notes: (1) For measurements of predictor and outcome variables, see Appendix F. (2) Odds ratio for proportion of RN worked hours is based on a 10% increase.
Evidence-based Staffing 100
Table 15: Hierarchical Logistic Regression for Emotional Exhaustion
Predictor Beta SE Odds Ratio
Nurse Level Age -0.03 0.02 0.97 Education (ref: Diploma) 0.11 0.26 1.12 Full-Time Employment (ref: PT/Casual) 1.03 0.28 2.79 * Overtime Hours 0.01 0.03 1.01 Clinical Expertise 0.21 0.22 1.24 Shift Change 0.03 0.27 1.03 Interventions Not Done -0.12 0.34 0.89 Effort and Reward Imbalance 1.23 0.33 3.42 * Autonomy -0.02 0.05 0.98 Nurse-Physician Relationship 0.00 0.08 1.00 Physical Health -0.04 0.02 0.96 * Mental Health -0.11 0.01 0.90 * Satisfaction with Current Job (ref: Dissatisfied) -1.09 0.31 0.34 * Improved Quality of Patient Care (ref: Deteriorated) 0.28 0.29 1.32 Good Quality of Nursing Care (ref: Poor) -0.57 0.40 0.56 Nurse-Patient Ratio 0.49 0.33 1.64 Patient Level Average Resource Intensity Weight 0.05 0.05 1.05 Average Number of Nursing Diagnoses -0.07 0.10 0.93 Unit Level Average Worked Hours 0.08 0.06 1.08 Proportion of RN Worked Hours 1.63 2.36 1.18 Productivity/Utilization (beyond 85%) -0.53 0.35 0.59 Proportion of Satisfied Nurses -3.88 1.37 0.68 *
Notes: (1) For measurements of predictor and outcome variables, see Appendix F. (2) Odds ratios for proportion of RN worked hours and proportion of satisfied nurses are based on a 10% increase.
Evidence-based Staffing 101
Table 16: Hierarchical Linear Regression for Nurses’ Physical Health
Predictor Beta SE Odds Ratio
Nurse Level Gender (ref: Male) -0.90 0.42 0.41 * Age -0.01 0.01 0.99 Education (ref: Diploma) 0.02 0.18 1.02 Full-Time Employment (ref: PT/Casual) -0.11 0.18 0.90 Overtime Hours 0.02 0.02 1.02 Clinical Expertise 0.14 0.15 1.15 Unit Instability -0.22 0.21 0.80 Shift Change -0.26 0.17 0.77 Interventions Not Done -0.10 0.23 0.90 Interventions Delayed 0.37 0.20 1.45 Effort and Reward Imbalance -0.67 0.25 0.51 * Emotional Exhaustion -0.53 0.23 0.59 * Autonomy 0.05 0.04 1.06 Nurse-Physician Relationship -0.10 0.05 0.91 Mental Health -0.02 0.01 0.98 * Satisfaction with Current Job (ref: Dissatisfied) 0.46 0.20 1.58 * Improved Quality of Patient Care (ref: Deteriorated) 0.13 0.20 1.14 Good Quality of Nursing Care (ref: Poor) -0.24 0.28 0.79 Nurse-Patient Ratio -0.38 0.21 0.69 Unit Level Average Worked Hours -0.10 0.04 0.90 * Proportion of RN Worked Hours -3.28 1.20 0.72 * Productivity/Utilization (beyond 85%) -0.20 0.21 0.82 Average Age of Nurses -0.15 0.04 0.86 * Average Nurse-Physician Relationship 0.88 0.17 2.40 * * p-value at 0.05 or less Notes: (1) For measurements of predictor and outcome variables, see Appendix F. (2) Odds ratio for proportion of RN worked hours is based on a 10% increase.
Evidence-based Staffing 102
Table 17: Hierarchical Linear Regression for Nurses’ Mental Health
Predictor Beta SE Odds Ratio
Nurse Level Gender (ref: Male) -0.74 0.38 0.48 * Age 0.03 0.01 1.03 * Education (ref: Diploma) -0.21 0.18 0.81 Full-Time Employment (ref: PT/Casual) -0.03 0.18 0.97 Overtime Hours 0.02 0.02 1.02 Clinical Expertise 0.08 0.16 1.09 Unit Instability -0.27 0.23 0.76 Shift Change -0.05 0.18 0.96 Interventions Not Done -0.05 0.23 0.95 Interventions Delayed -0.14 0.20 0.87 Effort and Reward Imbalance -0.51 0.28 0.60 Emotional Exhaustion -1.56 0.23 0.21 * Autonomy 0.04 0.04 1.04 Nurse-Physician Relationship 0.05 0.05 1.06 Physical Health -0.04 0.01 0.96 * Satisfaction with Current Job (ref: Dissatisfied) 0.55 0.20 1.74 * Improved Quality of Patient Care (ref: Deteriorated) 0.14 0.20 1.15 Good Quality of Nursing Care (ref: Poor) 0.00 0.28 1.00 Nurse-Patient Ratio -0.29 0.23 0.75 Unit Level Average Worked Hours -0.07 0.03 0.93 * Proportion of RN Worked Hours -1.37 1.25 0.87 Productivity/Utilization (beyond 85%) -0.16 0.23 0.85 Proportion of Emotionally Exhausted Nurses -0.43 0.88 0.65
* p-value at 0.05 or less Notes: (1) For measurements of predictor and outcome variables, see Appendix F. (2) Odds ratios for proportion of RN worked hours and proportion of emotionally exhausted nurses are based on a 10% increase.
Evidence-based Staffing 103
Table 18. Estimates for System Outcomes from the Hierarchical Linear Models
Patient LevelProportion of Patients Employed Full-time 1.10 *Pre-operative Clinics 1.05 * 0.241 *Post-operative/-discharge Education 0.128 *Medical Consequences -0.85 *Emergency Admission (ref: Elective) -0.153 *Resource Intensity Weight -0.31 * 0.11 * 0.01 0.000 0.000Number of Nursing Diagnoses -0.14 * -0.22 * -0.23 * -0.003 0.030 * 0.006 *Physical Health at Admission 0.02 * 0.001 0.000Mental Health at Admission 0.01 0.006 * 0.000Worked Hours per Patient 0.01Length of Stay 0.507 * -0.001
Unit LevelPure Cardiology (ref: Mix) -0.196 *Step Down Unit (ref: Other Types of Units) -2.262 *Average Worked Hours -0.01 0.07 -0.12 -0.05 0.06 -0.01Proportion of RN Worked Hours 0.49 0.56 -1.40 -1.66 -5.22 * -0.25 -1.24 0.532 * 0.090 0.597 *Productivity/Utilization 8.72 * -10.32 * -12.71 * -10.557 * 11.872 *Productivity/Utilization (Quadratic) -4.77 * 6.47 * 7.68 * 5.901 * -6.619 *Productivity/Utilization (beyond 85%) -0.38 -0.24 -0.25 -0.11Proportion of Nurses with BScN or Above -3.21 * 3.34 *Proportion of Full-time Employment -0.297 *Average Overtime Hours -0.29 *Average Clinical Expertise -2.77 * -0.260 *Prevalence of Violence at Unit 2.10 *Proportion of Emotionally Exhausted Nurses -0.557 *Average Nurse-physician Relationship -0.75 *Proportion of Nurses Reporting Sick Leave 5.35 *Proportion of Mentally Healthy Nurses -0.445 *Proportion of Nurses Rating Good Nursing Care Quality 6.57 * -3.62 *
* for p-value at 0.05 or lessNotes: (1) Length of stay, tasks not done or delayed, quality of nursing care and quality of patient care were dichotomized and modeled in hierarchical logistic regressions. For length of stay, 1 = hospital stay shorter than expected; for not done, 1 = at least one task not done on last shift; for delay, 1 = at least one task delayed on last shift; quality of nursing care, 1 = excellent/good; for quality of patient care, 1 = improved; for absenteeism, 1 = more than one occasion in past year; for leave, 1 = intent to leave within next year. (2) The productivity/utilization cut points are 91.4% for LOS, 79.7% for absenteeism, 82.8% for intent to leave, 89.5% for cost per RIW and 89.7% for worked hours.
Evidence-based Staffing 104
Table 19. Odds Ratios for System Outcomes in the Hierarchical Linear Models
Patient Level Proportion of Patients Employed Full-time 3.00 *Pre-operative Clinics 2.85 * n/a *Post-operative/-discharge Education n/a *Medical Consequences 0.43 *Emergency Admission (ref: Elective) n/a *Resource Intensity Weight 0.74 * 1.12 * 1.01 n/a n/aNumber of Nursing Diagnoses 0.87 * 0.80 * 0.80 * n/a n/a * n/a *Physical Health at Admission 1.02 * n/a n/aMental Health at Admission 1.01 n/a * n/aWorked Hours per Patient 1.01Length of Stay n/a * n/a
Unit LevelPure Cardiology (ref: Mix) n/a *Step Down Unit (ref: Other Types of Units) n/a *Average Worked Hours 0.99 1.07 0.89 0.95 1.07 0.99Proportion of RN Worked Hours 1.05 1.06 0.87 0.85 0.59 * 0.97 0.88 n/a * n/a n/a *Productivity/Utilization n/a * n/a * n/a * n/a * n/a *Productivity/Utilization (Quadratic) n/a * n/a * n/a * n/a * n/a *Productivity/Utilization (beyond 85%) 0.69 0.78 0.78 0.89Proportion of Nurses with BScN or Above 0.73 * 1.40 *Proportion of Full-time Employment n/a *Average Overtime Hours 0.75 *Average Clinical Expertise 0.06 * n/a *Prevalence of Violence at Unit 8.14 *Proportion of Emotionally Exhausted Nurses n/a *Average Nurse-physician Relationship 0.47 *Proportion of Nurses Reporting Sick Leave 1.71 *Proportion of Mentally Healthy Nurses n/a *Proportion of Nurses Rating Good Nursing Care Quality 1.93 * 0.03 *
* for p-value at 0.05 or lessNotes: (1) Length of stay, tasks not done or delayed, quality of nursing care and quality of patient care were dichotomized and modeled in hierarchical logistic regressions. For length of stay, 1 = hospital stay shorter than expected; for not done, 1 = at least one task not done on last shift; for delay, 1 = at least one task delayed on last shift; for quality of nursing care, 1 = excellent/good; for quality of patient care, 1 = improved; for absenteeism, 1 = more than one occasion in past year; for leave, 1 = intent to leave within next year. (2) The productivity/utilization cut points are 91.4% for LOS, 79.7% for absenteeism, 82.8% for intent to leave, 89.5% for cost per RIW, and 89.7% for worked hours. (3) The odds ratios for proportion of RN worked hours, proportion of nurses with BScN or above, proportion of nurses reporting sick leave and proportion of nurses rating good nursing care quality are based on a 10% increase. (4) Odds ratio for quadratic transformation of productivity/utilization is not reported.
Evidence-based Staffing 105
Table 20: Hierarchical Logistic Regression for Patients with Shorter Than Expected Length of Stay
Predictor Beta SE Odds Ratio
Patient Level Pre-operative Clinics 1.05 0.26 2.85 * Medical Consequences -0.85 0.31 0.43 * Resource Intensity Weight -0.31 0.04 0.74 * Number of Nursing Diagnoses -0.14 0.04 0.87 * Physical Health at Admission 0.02 0.01 1.02 * Mental Health at Admission 0.01 0.01 1.01 Worked Hours per Patient 0.01 0.03 1.01 Nurse Level Education (ref: Diploma) 0.32 0.29 1.37 Overtime Hours -0.03 0.04 0.97 Interventions Not Done -0.10 0.36 0.91 Interventions Delayed 0.17 0.29 1.18 Physical Health -0.02 0.02 0.98 Mental Health 0.02 0.02 1.02 Nurse-Patient Ratio -0.17 0.10 0.85 Unit Level Proportion of RN Worked Hours 0.49 1.78 1.05 Productivity/Utilization 8.72 2.10 n/a * Productivity/Utilization (Quadratic) -4.77 1.34 n/a *
* p-value at 0.05 or less Notes: (1) For measurements of predictor and outcome variables, see Appendix F. (2) Odds ratio for proportion of RN worked hours is based on a 10% increase. (3) Productivity/utilization cut point is 91.4%.
Evidence-based Staffing 106
Table 21: Hierarchical Logistic Regression for Interventions Not Done
Average Resource Intensity Weight 0.113 0.038 1.12 *
Average Number of Nursing Diagnoses -0.218 0.085 0.80 *
Unit Level
Average Worked Hours -0.011 0.067 0.99 Proportion of RN Worked Hours 0.557 2.510 1.06 Productivity/Utilization (beyond 85%) -0.376 0.403 0.69 Average Overtime Hours -0.292 0.139 0.75 *
Average Clinical Expertise -2.771 0.937 0.06 *
* p-value at 0.05 or less Notes: (1) For measurements of predictor and outcome variables, see Appendix F. (2) Odds ratio for proportion of RN worked hours is based on a 10% increase.
Evidence-based Staffing 107
Table 22: Hierarchical Logistic Regression for Interventions Delayed
Predictor Beta SE Odds Ratio
Patient Level Average Resource Intensity Weight 0.01 0.03 1.01
Average Number of Nursing Diagnoses -0.23 0.08 0.80 *
Nurse-Physician Relationship 0.06 0.07 1.06 Intent to Leave 0.37 0.32 1.45 Physical Health 0.01 0.01 1.01 Mental Health -0.02 0.01 0.98 Satisfaction with Current Job (ref: Dissatisfied) -0.21 0.23 0.81 Nurse-Patient Ratio 0.50 0.32 1.65 Unit Level Average Worked Hours 0.07 0.05 1.07 Proportion of RN Worked Hours -1.40 2.20 0.87 Productivity/Utilization (beyond 85%) -0.24 0.30 0.78 Proportion of Nurses with BScN or Above -3.21 1.00 0.73 *
Prevalence of Violence at Unit 2.10 0.81 8.14 *
Proportion of Nurses Reporting Sick Leave 5.35 1.63 1.71 *
* p-value at 0.05 or less Notes: (1) For measurements of predictor and outcome variables, see Appendix F. (2) Odds ratios for proportion of RN worked hours, proportion of nurses with BScN or above, and proportion of nurses reporting sick leave are based on a 10% increase.
Evidence-based Staffing 108
Table 23: Hierarchical Logistic Regression for Quality of Nursing Care
Predictor Beta SE Odds Ratio
Nurse Level Education (ref: Diploma) 0.00 0.29 1.00 Work on Multiple Units -0.49 0.30 0.61 Full-Time Employment (ref: PT/Casual) 0.48 0.30 1.62 Overtime Hours 0.02 0.02 1.02 Clinical Expertise 0.58 0.22 1.79 * Unit Instability -0.04 0.35 0.97 Shift Change -0.69 0.30 0.50 * Interventions Not Done -0.59 0.48 0.56 Interventions Delayed -0.11 0.36 0.90 Effort and Reward Imbalance 0.33 0.35 1.40 Emotional Exhaustion -0.61 0.34 0.54 Autonomy 0.07 0.06 1.08 Nurse-Physician Relationship 0.22 0.09 1.25 * Physical Health 0.00 0.02 1.00 Mental Health 0.01 0.02 1.01 Satisfaction with Current Job (ref: Dissatisfied) 0.95 0.40 2.59 * Improved Quality of Patient Care (ref: Deteriorated) 1.95 0.36 7.06 * Nurse-Patient Ratio -0.69 0.45 0.50 Unit Level Average Worked Hours -0.12 0.07 0.89 Proportion of RN Worked Hours -1.66 2.63 0.85 Productivity/Utilization (beyond 85%) -0.25 0.35 0.78 Average Nurse-Physician Relationship -0.75 0.23 0.47 * Proportion of Nurses Rating Good Nursing Care
Quality 6.57 1.62 1.93 *
* p-value at 0.05 or less Notes: (1) For measurements of predictor and outcome variables, see Appendix F. (2) Odds ratios for proportion of RN worked hours and proportion of nurses rating good nursing care quality are based on a 10% increase.
Evidence-based Staffing 109
Table 24: Hierarchical Logistic Regression for Quality of Patient Care
Predictor Beta SE Odds Ratio
Nurse Level Education (ref: Diploma) 0.15 0.20 1.16 Work on Multiple Units 0.29 0.22 1.33 Full-Time Employment (ref: PT/Casual) -0.17 0.21 0.84 Overtime Hours -0.02 0.02 0.98 Clinical Expertise -0.84 0.18 0.43 * Unit Instability 0.23 0.27 1.26 Shift Change 0.33 0.20 1.39 Interventions Not Done -0.25 0.26 0.78 Interventions Delayed -0.62 0.23 0.54 * Effort and Reward Imbalance -0.44 0.29 0.64 Emotional Exhaustion 0.30 0.26 1.35 Autonomy 0.16 0.04 1.17 * Nurse-Physician Relationship 0.03 0.06 1.03 Physical Health 0.01 0.01 1.01 Mental Health 0.01 0.01 1.01 Satisfaction with Current Job (ref: Dissatisfied) 0.33 0.23 1.39 Good Quality of Nursing Care (ref: Deteriorated) 2.32 0.38 10.15 * Nurse-Patient Ratio -0.54 0.41 0.59 Unit Level Average Worked Hours -0.05 0.06 0.95 Proportion of RN Worked Hours -5.22 1.33 0.59 * Productivity/Utilization (beyond 85%) -0.11 0.47 0.89 Proportion of Nurses with BScN or Above 3.34 1.64 1.40 *
* p-value at 0.05 or less Notes: (1) For measurements of predictor and outcome variables, see Appendix F. (2) Odds ratios for proportion of RN worked hours and proportion of nurses with BScN or above are based on a 10% increase.
Evidence-based Staffing 110
Table 25: Hierarchical Logistic Regression for Absenteeism
Mental Health -0.02 0.01 0.98 Satisfaction with Current Job (ref: Dissatisfied) 0.01 0.27 1.01 Improved Quality of Patient Care (ref: Deteriorated) -0.50 0.28 0.60 Good Quality of Nursing Care (ref: Poor) 0.54 0.38 1.72 Nurse-Patient Ratio 0.38 0.29 1.47 Unit Level Average Worked Hours 0.06 0.05 1.07 Proportion of RN Worked Hours -0.25 1.84 0.97 Productivity/Utilization -10.32 4.96 n/a *
* p-value at 0.05 or less Notes: (1) For measurements of predictor and outcome variables, see Appendix F. (2) Odds ratio for proportion of RN worked hours is based on a 10% increase. (3) Productivity/utilization cut point is 79.7%.
Evidence-based Staffing 111
Table 26: Hierarchical Logistic Regression for Intent to Leave
Nurse-Physician Relationship 0.07 0.07 1.08 Physical Health 0.02 0.01 1.02
Mental Health -0.01 0.01 0.99 Satisfaction with Current Job (ref: Dissatisfied) -0.87 0.29 0.42 * Improved Quality of Patient Care (ref: Deteriorated) -0.35 0.26 0.71 Good Quality of Nursing Care (ref: Poor) 0.09 0.34 1.10 Nurse-Patient Ratio -0.08 0.36 0.92 Unit Level Average Worked Hours -0.01 0.06 0.99 Proportion of RN Worked Hours -1.24 1.97 0.88 Productivity/Utilization -12.71 5.00 n/a * Productivity/Utilization (Quadratic) 7.68 3.00 n/a * Proportion of Nurses Rating Good Nursing Care Quality -3.62 1.14 0.03 *
Notes: (1) For measurements of predictor and outcome variables, see Appendix F. (2) Odds ratios for proportion of RN worked hours and proportion of nurses rating good nursing care quality are based on a 10% increase. (3) Productivity/utilization cut point is 82.8%.
Evidence-based Staffing 112
Table 27: Hierarchical Linear Regression for Productivity/Utilization
Predictor Beta SE Odds Ratio
Patient Level Resource Intensity Weight 0.000 0.003 n/a Number of Nursing Diagnoses -0.003 0.005 n/a Nurse Level Education (ref: Diploma) 0.003 0.018 n/a Overtime Hours -0.001 0.001 n/a Interventions Not Done 0.024 0.024 n/a Interventions Delayed 0.000 0.020 n/a Autonomy 0.007 0.003 n/a * Physical Health 0.001 0.001 n/a Mental Health 0.001 0.001 n/a Nurse-Patient Ratio 0.045 0.007 n/a * More Time Needed 0.001 0.000 n/a * Unit Level Pure Cardiology (ref: Mix) -0.196 0.041 n/a * Proportion of RN Worked Hours 0.532 0.123 n/a * Proportion of Emotionally Exhausted Nurses -0.557 0.140 n/a * Proportion of Mentally Healthy Nurses -0.445 0.170 n/a *
* p-value at 0.05 or less Notes: (1) For measurements of predictor and outcome variables, see Appendix F.
Evidence-based Staffing 113
Table 28: Hierarchical Linear Regression for Cost per Resource Intensity Weight (Log Scale)
Predictor Beta SE Odds Ratio
Patient Level Pre-operative Clinics 0.241 0.056 n/a * Post-operative/-discharge Education 0.128 0.043 n/a * Emergency Admission (ref: Elective) -0.153 0.044 n/a * Number of Nursing Diagnoses 0.030 0.011 n/a * Physical Health at Admission 0.001 0.002 n/a Mental Health at Admission 0.006 0.002 n/a * Length of Stay 0.507 0.029 n/a * Nurse Level Education (ref: Diploma) 0.047 0.068 n/a Overtime Hours 0.004 0.009 n/a Clinical Expertise -0.163 0.052 n/a * Interventions Not Done 0.069 0.086 n/a Interventions Delayed -0.025 0.076 n/a Physical Health -0.011 0.004 n/a * Nurse-Patient Ratio -0.110 0.027 n/a * More Time Needed 0.000 0.004 n/a Unit Level Step Down Unit (ref: Other Types of Units) -2.262 0.681 n/a * Proportion of RN Worked Hours 0.090 0.558 n/a Productivity/Utilization -10.557 0.514 n/a * Productivity/Utilization (Quadratic) 5.901 0.290 n/a *
* p-value at 0.05 or less Notes: (1) For measurements of predictor and outcome variables, see Appendix F. (2) Productivity/utilization cut point is 89.5%.
Evidence-based Staffing 114
Table 29: Hierarchical Linear Regression for Worked Hours per Patient (Log Scale)
Predictor Beta SE Odds Ratio
Patient Level Resource Intensity Weight 0.000 0.002 n/a Number of Nursing Diagnoses 0.006 0.002 n/a * Physical Health at Admission 0.000 0.000 n/a Mental Health at Admission 0.000 0.000 n/a Length of Stay -0.001 0.015 n/a Nurse Level Education (ref: Diploma) 0.015 0.015 n/a Overtime Hours -0.002 0.002 n/a Interventions Not Done -0.012 0.020 n/a Interventions Delayed 0.018 0.017 n/a Physical Health -0.001 0.001 n/a Mental Health 0.000 0.001 n/a Nurse-Patient Ratio -0.010 0.005 n/a Unit Level Proportion of RN Worked Hours 0.597 0.180 n/a * Productivity/Utilization 11.872 0.353 n/a * Productivity/Utilization (Quadratic) -6.619 0.189 n/a * Proportion of Full-Time Employment -0.297 0.075 n/a * Average Clinical Expertise -0.260 0.043 n/a *
* p-value at 0.05 or less Notes: (1) For measurements of predictor and outcome variables, see Appendix F. (2) Productivity/utilization cut point is 89.7%.
Evidence-based Staffing 115
Table 30: Hierarchical Linear Models for Patient, Nurse, and System Outcomes on Congruence Between PRN Hours and Actual Worked Hours per Patient
System Outcome LOS Shorter than Expected LOS 0.0018 0.0040 0.6546 1.00 Interventions Not Done 0.0004 0.0024 0.8766 1.00 Interventions Delayed 0.0047 0.0027 0.0847 1.00 Improved Rating for Quality of Patient Care -0.0041 0.0026 0.1247 1.00 Good Rating for Quality of Nursing Care -0.0002 0.0019 0.9076 1.00 Absenteeism -0.0016 0.0023 0.4864 1.00 Intent to Leave 0.0055 0.0020 0.0067 * 1.01 Cost per Resource Intensity Weight -0.0093 0.0080 0.2433 n/a
* p-value at 0.05 or less Note: (1) For measurements of outcome variables, see Appendix F. (2) The predictor is the PRN hours less the worked hours per patient.
Evidence-based Staffing 116
Table 31: Summary Table of the Effect of Nursing Hours, Proportion of RN Worked Hours, Nurse-Patient Ratio, and Productivity/Utilization on Patient, Nurse and System Outcomes, in Odds Ratio, Coefficient, and Cut point
Odds ratio Nurse-Patient
Ratio
Worked Hours
Proportion of RN Worked Hours (10% Increase)
Productivity/ Utilization
(Cut point) Patient outcome Medical Consequences ns 1.13a ns ns Physical Health ns ns ns 80.0% Mental Health ns 0.94a ns ns OMAHA Knowledge ns ns 1.74 n/a OMAHA Behaviour ns ns ns 88.2% OMAHA Status ns ns ns n/a Nurse outcome Satisfaction ns 1.10b ns 80.0% Emotional Exhaustion ns ns ns ns Physical Health ns 0.90b 0.72 ns Mental Health ns 0.93b ns ns System outcome Length of Stay ns ns ns 91.4% Interventions Not Done ns ns ns ns Interventions Delayed ns ns ns ns Quality of Patient Care ns ns 0.59 ns Quality of Nursing Care Ns Ns Ns ns Absenteeism ns ns ns 79.7% Intent to Leave ns ns ns 82.8%
Coefficient
Nurse-Patient
Ratio
Average Worked
Hours
Proportion of RN Worked Hours (10% Increase)
Productivity/ Utilization
(Cut point) Nurse outcome
Relationship with Physician -0.37 ns 0.29 85%
Autonomy 0.67 ns ns 85% System outcome Productivity/Utilization 0.05 n/a 0.05 n/a Cost per RIW -0.11 n/a ns 89.5% Worked Hours per Patient ns n/a 0.60 89.7% a. Worked hours per patient. b. Average worked hours on unit. Notes: (1) Only significant predictors are presented for odds ratios and cut points. (2) "ns" stands for not significant. Predictors with ns have no impact on the outcome variables. (3) "n/a" stands for not applicable. (4) Cost per RIW and worked hours were modeled in logarithm scale, therefore by transforming back to the original scale, a 10% increase in proportion of RN worked hours would lead to an exponential increase of 0.60 (or 1.06 times) in the worked hours per patient which is a 6% increase in worked hours per patient.
Evidence-based Staffing 117
Appendix D. Instruments, Psychometric Properties, and Variables
at Individual and Unit Levels
Measure Description and Psychometric Properties
Inputs
Patient Characteristics:
Patient Inputs -age, sex, significant other support
These variables were collected from the patient’s kardex and chart. The actual values of these variables were used at the individual level of analysis.
Patient Input NANDA Form: Nursing Diagnoses1
Nursing diagnoses identify the conditions in patients that create the demand for nursing services. Content validity of the taxonomy of nursing diagnoses is inferred from the judgment and agreement of nurse experts meetings held bi-annually for several years1. The number of different nursing diagnoses the patient had over the hospital stay was used as an independent variable at the individual level.
Patient Input Medical Diagnoses
Patient medical condition was measured by the Case Mix Groups (CMGs) TM developed by the Canadian Institute for Health Information). The CMG methodology has been refined a number of times over the last several years to improve the content validity of the measure. The Resource Intensity Weight (RIW) assigned to an individual CMG was used in the analysis at the individual level. The average RIW was used where aggregation was applied.
Patient Input and Output OMAHA Problem Rating Scale2
Each nursing diagnosis selected is evaluated on three dimensions (knowledge, behaviour, and status) on a 5-point Likert scale at two points in time: at admission or when a new health problem is identified (Time 1), and when the health problem is resolved or at discharge (Time 2)2. Knowledge involves what a client knows and understands about a specific health-related problem. Behaviour involves what a client does - the client’s practices, performances, and skills. Status involves what a client is and how the client’s conditions or circumstances improve, remain stable, or deteriorate2. While this rating scale has been used primarily in the community setting, the actual measurement scale is non sectorial in nature and appropriate for use in the hospital environment. In a previous study, the inter-rater reliability for both nursing diagnoses and the OMAHA outcomes rating scale was maintained at 91% among nurse participants. The admission score ratings for knowledge, behaviour, and status were each entered as an independent variable in the analysis. When used as a dependent variable each variable was dichotomized as improved over hospital stay or as having no change or deteriorated over hospital stay.
Evidence-based Staffing 118
Measure Description and Psychometric Properties
Patient Input/Output, Outcomes Measure; Nurse Survey Outcome Measure; Medical Outcomes Study Short Form 12 measure of health status3
The Medical Outcomes Study SF-12®3 is a 12-item scale measuring 8 health domains: physical functioning, vitality, role functioning, physical problems, social functioning, bodily pain, mental health, and general health perceptions 4, 5, 6, 7. The SF12® has demonstrated excellent psychometric properties and is currently the most widely used generic measure of health status, having been employed in hundreds of studies across a broad spectrum of disease states5. When treated as a dependent variable, both physical health and mental health scores were dichotomized into healthy and not healthy using the average score for the US population as the cut point. When treated as a unit level independent variable, the proportion of nurses on the unit with physical and mental health scores over US population norm was used.
Nurse Characteristics:
Nurse Survey -age, sex, professional designation, education, years of experience (this unit, this hospital, nursing in general), usual shift rotation, usual number of units worked, etc.
These data were collected in the nurse survey. Each survey was assigned a code number which was known to the investigators only in order to link nurse characteristics to specific patient assignments. The variables created at the individual level were age, gender, number of occasions absent and number of shifts missed, professional designation, level of education, employment status, work on multiple units, clinical expertise, voluntary and involuntary overtime worked, job stability, prevalence of violence, frequency of shift change, planning to leave in the next 12 months intervention not completed on a shift and interventions delayed on a shift. Unit level variables created include proportions of: nurses on unit with a bachelors degree or higher, nurses reporting shift changes, nurses who work on more than one unit, nurses experiencing job insecurity, intending to leave in the next twelve months, nurses with interventions not completed or delayed, nurses absent from the unit daily, and full time positions on the unit. Unit level variables also included the mean age of nurses, mean years of experience, mean ratings of clinical expertise, prevalence of violence on the unit and average overtime hours.
System Characteristics:
System Characteristics Hospital Profile and Unit Profile
Number of beds in the unit, unit type (In Patient Unit, Critical Care Unit, Step Down Unit, and Day Surgery Unit), patient composition (pure cardiac or mix), and care delivery system were collected from the nurse manager for each unit. These data were used as independent variables at the unit level.
Evidence-based Staffing 119
Measure Description and Psychometric Properties
System Behaviours:
System behaviours Daily Unit Staffing Form
The nurse/patient ratio, the daily number of nursing personnel, daily patient census, admission and discharges, actual use of agency and relief staff were collected from the nurse manager or charge nurse on a daily basis. As a measure of continuity, average number of nurses per day over a patient’s hospital stay was used as an independent variable in the models. The actual worked hours per patient was estimated by total work hours divided by the number of patients at midnight census at unit on daily basis. The proportion of worked hours contributed by Registered Nurses was calculated. Number of patients per unit bed was computed as a measure of unit occupancy. The daily data were aggregated to either unit or individual level by taking the average in order to model their effect on outcome variables. The difference between PRN workload hours from actual worked hours per patient was computed in order to answer research question 2. When the actual worked hours at patient level was used as a dependent variable, a logarithm transformation was applied to assume normality.
Workload PRN8
This instrument lists 214 indicators or interventions that nurses complete on behalf of patients during a 24-hour period. Each indicator has a standard given point value which reflects the time involved to complete interventions for patients; each point represents five minutes8. A higher point value indicates greater amounts of nursing care required. The PRN methodology has had extensive testing and has gone through several iterations since it was first developed in 1972. Content validity was established by nurse experts during a series of meetings held over this time. In 1978, Chagnon, Audette, Lebrun, and Tilquin9 established the construct and predictive validity of the tool. Work measurement studies demonstrated that the time estimates predicted by the tool corresponded to the degree of work actually done. In this study the PRN estimates served as the gold standard for care required. In this study, every patient was rated every day using the PRN form in order to determine the direct care and time associated with direct care activities. The method proposed by Tilquin in1980, which is still in used today was used to determine total hours of care per patients (Charles Tilquin, personal communications, October, 2003).
Environmental complexity measures the push and pull that nurses experience in providing care to individual patients at the standard outlined in the nursing care plan. Factor analysis in a number of preliminary studies has revealed that the Environmental Complexity measure taps three main domains: unanticipated delays and re-sequencing of work in response to others, unanticipated delays due to changes in patient acuity, and characteristics and composition of the caregiver10. Factor analysis was completed for this study and again the same three factors emerged. The alpha reliabilities were 0.81, 0.84, and 0.84 respectively.
Intermediate System Outputs:
Worked hours, productivity/utilization
Worked hours were collected from the retrospective application of the workload measurement system used at the hospital. The daily unit productivity/utilization for each unit was computed by examining the workload of patients on the unit divided by worked hours. In the analysis of productivity/utilization, linear and quadratic terms were first tried to test the bell or U shape of the effect of productivity/utilization. If the bell or U shape was not supported by data, piecewise linear was tried next. If piecewise linear is significant, it means that the direction at a certain cut point will change. If both strategies failed, dichotomized productivity/utilization at various cut points was tried and the one shown significance was used in the final model. If all these failed, dichotomized productivity/utilization at 85% was tested.
Evidence-based Staffing 121
Measure Description and Psychometric Properties
Outputs
Patient Outcomes:
Patient Outcome Measure Medical Outcomes Study Short Form 12 measure of health status3
The psychometric properties of these measures are explained above. Patient SF-12® physical and mental health status was measured at admission and discharge. Patients’ individual admission scores were used as independent variables in many of the models. When treated as a dependent variable, improvement at discharge or no improvement at discharge was used for both physical health and mental health scores.
The Patient Data Form collected information about specific patients over their stay.
Patient medical consequences data were gathered from the patient’s chart on an ongoing basis, including deep or shallow post-operative wound infections, fall with injury, medication errors, urinary tract infections, bedsores, pneumonia were tracked on this form as well as death, transfers back to ICU and whether the patient was re-admitted with the same diagnoses within three months. Patient mortality was obtained from medical records. Since there were numerous medical consequences with very small frequencies, medical consequences including falls with injury, medication errors, death, and complications such as urinary tract infections, pneumonia, wound infections, bed sores, and thrombosis were summed for each patient and that value was used in the analysis. Data were collected about type of admission, presence of a family doctor, attendance at pre-operative clinics, bookings for post-operative or post-discharge education, referrals to home care and support in the home. These variables were used as patient-level independent variables in the analysis.
The Maslach10 Burnout Inventory has 25 items and measures 3 dimensions: emotional exhaustion (alpha = 0.90, test-retest reliability = 0.82), depersonalization (alpha = 0.79, test-retest reliability = 0 .60) and personal accomplishment (alpha = 0.71, test retest reliability = 0 .80). All coefficients were significant at p-value < 0.001. This measure has been used in numerous studies and has proven robust over time. In the current study, only the emotional exhaustion scores for nurses at the individual level and for the proportion of nurses with high levels of emotional exhaustion at the unit level were entered.
Evidence-based Staffing 122
Measure Description and Psychometric Properties
Nurse Survey Outcome Measure Siegrist’s Effort and Reward Imbalance11
The 17-item Effort and Reward Imbalance scale identifies the imbalance between high effort spent and low reward received at work, and is assumed to be particularly stressful as this imbalance violates core expectations about reciprocity and adequate exchange in a crucial area of social life.11 This measure has been used extensively over the past ten years in many work settings to measure the effect of an imbalance on the physical and mental health of workers and more recently in the nursing population. Combined variable odds ratios are reported as 8.241 and 95% confidence interval. At the individual level we entered the score for nurses, and the proportion of nurses at risk of effort and reward imbalance was used at the unit level.
Nurse Survey Process Variables Revised Nursing Work Index (Autonomy Control over Practice, Nurse-MD Relations)12
The Nursing Work Index, first developed by Kramer and Hafner12 has been used extensively in the US over the past ten years in research related to “magnet” hospitals, which are hospitals that are known to attract and retain nurses13,14,15,16 and to have better patient outcomes17. Work attributes that have been demonstrated as important to nurses include autonomy (7 items), control over the work environment (18 items) and nurse-physician relations (2 items). In the Aiken et al. (1994) mortality study using ANOVA, the mean difference in observed mortality between magnet and non-magnet hospitals was significantly different ( p = .01). Laschinger & colleagues recomputed the factor analysis on the scale and identified a 5 factor solution. The five factors were autonomy, control over practice, nurse physician relations, leadership, and resources. The alpha reliabilities of each of these new subscales were 0.69, 0.74, 0.83, 0.80, and 0.80 respectively. At the individual level, the scores on each of these subscales were entered into the model, while at the unit level the mean unit score for each variable was entered into the models.
System Outcomes:
System Outcomes -length of stay
These data were retrieved from medical records. The expected length of stay was derived from CIHI’s inpatient database. The actual length of stay or its logarithm transformation was used as an independent variable at the individual level. When used as a dependent variable, it was dichotomized as shorter than expected length of stay versus the same as, or longer than, the expected length of stay.
System Outcomes -cost per case
The actual cost per equivalent weighted case by hospital was extracted from the Ontario Case Costing Data Base and multiplying it by the RIW for each patient. The out of province hospital was not used in this analysis. Logarithm transformation was applied to assume normality when it was modeled as a dependent variable.
Evidence-based Staffing 123
References 1. Kim, M. J., McFarland, G.K., & McLane, A. M. (1991). Pocket guide to nursing diagnoses
(4th edition). St. Louis, MO: Mosby. 2. Martin, K. S., & Scheet, N. J. (1992). The OMAHA system: Application for community health
nursing. Philadelphia, PA: WB Saunders. 3. Ware, Jr., J. E, Kosinski, M., & Keller, A. D. (2002). SF-12®: How to score the SF-12®
physical and mental health summary scales (4th Ed.). Lincoln, RI: QualityMetric Incorporated.
4. McHorney, C. A., Ware, Jr., J. E., Rogers, W., & Raczek, A. E. (1992). The validity and relative precision of MOS Short and Long Term Status Scales and Dartmouth COOP. Medical Care, 30, 253-265.
5. Ware, Jr., J.E., & Sherbourne, C.D. (1992). The MOS 36-Item short form health survey (SF-36): Conceptual framework and item selection. Medical Care, 30, 473-483.
6. Ware, Jr., J. E., Snow, K., Kosinski, M., & Gandek, B. (1993). SF-36 Health survey manual and interpretation guide. Boston: The Health Institute.
7. Wu, A. W. (1991). A health status questionnaire using 30 items from the medical outcomes study: Preliminary validation in persons with early HIV infection. Medical Care, 29, 786.
8. Tilquin, C., Carle, J., Saulnier, D., Lambert, P., & Collaborators. (1981). PRN 80: Measuring the level of nursing care required. Equipe de Recherche Opérationnelle en Santé, Institut National de Systématique Appliquée, Université de Montréal: Montréal, QC.
9. Chagnon, M., Audette, L. M., Lebrun, L., & Tilquin, C. (1978). Validation of a patient classification through evaluation of the nursing staff degree of occupation. Medical Care, 16(6), 465-475.
10. O’Brien-Pallas, L. L., Irvine, D., Peereboom, E., & Murray, M. (1997). Measuring nursing workload: Understanding variability. Nursing Economics, 15(4), 172-182.
11. Maslach, C., & Jackson, S. E. (1982). Burnout in health professions: A social psychological analysis. In G. S. Snaders & J. Suls (Eds.), Social psychology of health and illness (pp. 227-251). Hillsdale: Lawrence Erlbaum Associates.
12. Siegrist, J. (1996). Adverse health effects of high-effort/low rewards conditions. Journal of Occupational Health Psychology, 1(1), 27-41.
13. Kramer, M., & Hafner, L. P. (1989). Shared values: Impact on staff nurse satisfaction and perceived productivity. Nursing Research, 38, 172-177.
14. McClure, M. L., Poulin, M. A., Sovie, M. D., & Wandelt, M. A. (1982). Magnet hospitals: Attraction and retention of professional nurses. Kansas City: American Academy of Nurses.
15. Kutzscher, L. I. T., Sabiston, J. A., Laschinger-Spence, H. K., & Nish, M. (1997). The effects of teamwork on staff perception and empowerment and job satisfaction. Healthcare Management Forum, 10(2), 12-17.
16. Kramer, M., & Schmalenberg, C. (1988). Magnet hospitals: Institutions of excellence, Parts I & II. Journal of Nursing Administration, 18(1), 13-24.
17. Kramer. M., & Schmalenberg, C. (1990). Job satisfaction and retention: Insights for the 90’s, Parts I and II. Nursing, 21, 2-7 & 9-13.
18. Aiken, L., Smith, H., & Lake, E.T. (1994). Lower Medicare mortality among a set of hospitals known for good nursing care. Medical Care, 32(8), 771-787.
For each patient, complete at time of: < admission (A) < discharge (D) < new nursing diagnoses after admission (N) < resolution of nursing diagnoses during care (R)
Hospital Day
Nursing Diagnosis
Time
Knowledge Ability of the patient to remember and interpret information
Behaviour Observable responses, actions or activities of the patient fitting the occasion or purpose
Status Condition of the patient in relation to objective and subjective defining characteristics
5. During the past week, how much did pain interfere with your normal work
(including both work outside the home and housework)?
Not at all A little bit Moderately Quite a bit Extremely
1 2 3 4 5
6. These questions are about how you feel and how things have been with you during
the past week. For each question, please give the one answer that comes closest to the way you have been feeling. How much of the time during the past week...
All of the
time
Most of the time
A good bit of the
time
Some of the time
A little of the time
None of the time
a) have you felt calm and peaceful?
1 2 3 4 5 6
b) did you have a lot of energy?
1 2 3 4 5 6
c) have you felt downhearted and blue?
1 2 3 4 5 6
7. During the past week, how much of the time has your physical health or emotional
problems interfered with your social activities (like visiting friends, relatives, etc.)?
DIRECTIVES: Les questions qui suivent portent sur votre santé, telle que vous la percevez. Vos réponses permettront de suivre l'évolution de votre état de santé et de savoir dans quelle mesure vous pouvez accomplir vos activités courantes. Veuillez répondre à toutes les questions en cochant une case. En cas de doute, répondez de votre mieux. 1. En général, diriez-vous que votre santé est:
Excellente Très bonne Bonne Passable Mauvaise
2. Les questions suivantes portent sur les activités que vous pourriez avoir à faire au cours d'une journée normale. Votre état de santé actuel vous limite-t-il dans ces activités? Si oui, dans quelle mesure? Mon état
de santé me limite beaucoup
Mon état de santé
me limite un
peu
Mon état de santé
ne me limite pas
du tout a) Dans les activités modérées comme déplacer
une table, passer l'aspirateur, jouer aux quilles ou au golf
3. Au cours de la dernière semaine, avez-vous eu l'une ou l'autre des difficultés suivantes au travail ou dans vos autres activités quotidiennes à cause de votre état de santé physique? OUI NON a) Avez-vous accompli moins de choses que
vous l'auriez voulu?
b) Avez-vous été limité(e) dans la nature de vos tâches ou de vos autres activités?
4. Au cours de la dernière semaine, avez-vous eu l'une ou l'autre des difficultés suivantes au travail ou dans vos autres activités quotidiennes à cause de l'état de votre moral (comme le fait de vous sentir déprimé(e) ou anxieux(se))?
OUI NON
a) Avez-vous accompli moins de choses que vous l'auriez voulu?
b) Avez-vous fait votre travail ou vos autres activités avec moins de soin qu'à l'habitude?
5. Au cours de la dernière semaine, dans quelle mesure la douleur a-t-elle nui à vos
activités habituelles (au travail comme à la maison)?
Pas du tout Un peu Moyennement Beaucoup Énormément
6. Ces questions portent sur de la dernière semaine. Pour chacune des questions suivantes, donnez la réponse qui s'approche le plus de la façon dont vous vous êtes senti(e). Au cours de la dernière semaine, combien de fois:
Tout le temps
La plupart
du temps
Souvent Quel-quefois
Rare-ment
Jamais
a) Vous êtes-vous senti(e) calme et serein(e)?
b) Avez-vous eu beaucoup d'énergie?
c) Vous êtes-vous senti(e) triste et abattu(e)?
7. Au cours de la dernière semaine, combien de fois votre état physique ou
moral a-t-il nui à vos activités sociales (comme visiter des amis, des parents, etc.)?
Tout le temps La plupart du temps
Parfois Rarement Jamais
Evidence-based Staffing 134
Nurse Survey Please circle the number of the appropriate response to each question or, where indicated, fill in the blanks.
A.
Questions About Your Work Life
A1
What is your current employment status at this hospital?
Full time................................ Part time............................... Casual....................................
RN......................................... RPN....................................... Other (specify):___________
1 2 3
A5
How many years have you worked: a) as an RN/RPN b) as an RN/RPN at your present hospital c) as an RN/RPN on your current unit d) as a casual worker
_____ years _____ months _____ years _____ months _____ years _____ months _____ years _____ months
A6
Is your immediate supervisor a nurse? If No, please specify the profession of your supervisor.
Yes......................................... No (specify):______________
1 2
A7
In the past year, how many hours per week did you work, on average: a) in this hospital for paid work? b) for any other paid work?
_______ hours per week _______ hours per week
A8
In the past year, how many hours per week, on average, did you work on units other than the one to which you are usually assigned? (that is, the one where you work the most hours):
_______ hours per week
A9
In the past year, how many hours a week, on average, did you work in this hospital the following types of overtime? a) Voluntary Paid b) Voluntary Unpaid c) Involuntary Paid d) Involuntary Unpaid
_______ hours per week _______ hours per week _______ hours per week _______ hours per week
Evidence-based Staffing 135
A10
In the past year, has the amount of overtime required of you:
Increased................................ Remained the same............... Decreased.............................. Not applicable........................
1 2 3 4
A11
In the past 2 weeks, how often did you change shifts? (e.g., from days to evenings, evenings to nights, nights to days, etc.)
None........................................ Once........................................ Twice....................................... Other (specify):____________
1 2 3 4
A12
In the past year, have you been required to permanently change nursing units due to restructuring/reorganization?
How satisfied are you with the following aspects of your current job?
Very Very Dissatisfied Satisfied
B1 Opportunities for social contact at work 1 2 3 4 5
B2 Opportunities for social contact with your colleagues after work 1 2 3 4 5
B3 Opportunities to interact with management/administration 1 2 3 4 5
B4 Your amount of responsibility 1 2 3 4 5
B5 On the whole, how satisfied are you with your present job? 1 2 3 4 5 B6 Independent of your present job, how satisfied are you with being 1 2 3 4 5 a nurse?
B7
Thinking about the next 12 months, how likely is it that you will lose your job?
Very Likely................................... Fairly Likely.................................. Not too likely................................ Not at all likely.............................
1234
B8
Do you plan to leave your present nursing job?
Yes, within the next 6 months....... Yes, within the next year............... No plans within the year...............
123
B9
If you were looking for another job, how easy or difficult do you think it would be for you to find an acceptable job in nursing?
Very easy................................ Fairly easy............................... Fairly difficult........................... Very difficult...........................
Do you have any dependent children/others living with you? a) children b) other dependents
Yes, how many children_____________ No......................................................... Yes, how many other dependents______ No.........................................................
1212
C4
What is your highest Nursing educational credential?
RPN Diploma......................................... RN Diploma........................................... BScN.................................................... MScN.................................................... PhD Nursing.......................................... Post RN Certificate Cardiac.................... Post RN Certificate Other (specify): _______________________________
1234567
C5
What is your highest Non-nursing educational credential?
Diploma................................................. Baccalaureate........................................ Masters................................................. PhD....................................................... Other (specify):___________________ Not applicable........................................
123456
C6
In the past year: a) On how many occasions (episodes) have you missed work due to illness/disability? b) How many shifts have been missed due to illness/disability?
_________ # occasions _________ # shifts
C7
In the past year, what is the most common reason you missed work? (Choose one only)
Physical illness....................................... Mental health day................................... Injury (work related)............................... Family illness/crisis/ commitment............. Unable to get requested day off.............. Other (specify):___________________
123456
Evidence-based Staffing 137
D.
Questions About Violence
In the last 5 shifts you worked, have you experienced any of the following while carrying out your responsibilities as a nurse:
D1
a) Physical assault b) If yes, indicate source of physical assault
The following descriptions are intended to represent levels of skill and ability in nursing roles and functions. Which one of the following would you say best describes the way in which you practice on your unit?
I am a nurse who... (circle only one response) 1) ...relies primarily on standards of care, unit procedures and physicians= and nurses= orders to guide patient care 2) ...has increased clinical understanding, technical and organizational skills and is able to anticipate the likely course of events 3) ...perceives the patient situation as a whole and responds appropriately as conditions change 4) ...is good at recognizing unexpected clinical responses and often provides an early warning of patient changes
1 2 3 4
Evidence-based Staffing 138
D2
a) Threat of assault b) If yes, indicate source of threat of assault
Yes..................................... No....................................... Source of threat of assault: Patient................................. Family/visitor........................ Physician............................. Nursing co-worker............... Other, specify:___________
12 12345
D3
a) Emotional abuse b) If yes, indicate source of emotional abuse
Which of the following tasks did you perform during your last shift? 1) Delivering/retrieving trays 2) Ordering, coordinating or performing ancillary services (e.g., physical therapy, ordering labs) 3) Starting IVs 4) Arranging discharge referrals and arranging transportation (including nursing homes) 5) Performing ECGs 6) Routine phlebotomy (venipunctures) 7) Transporting patients (including to nursing homes) 8) Housekeeping duties (e.g., cleaning patient rooms)
Circle all that apply 1 2 3 4 5 6 7 8
Evidence-based Staffing 139
E4
Which of the following situations occurred on your last shift due to time pressures? 1) Routine vital signs, medications or dressings not done 2) Routine vital signs, medications or dressings not on time 3) Routine mobilization or turns not done 4) Routine mobilization or turns not done on time 5) Delay in administering PRN pain medications 6) Delay in responding to patient bell
Circle all that apply 1 2 3 4 5 6
E5
Which of the following tasks were necessary but left undone during your last shift because you lacked the time to complete them? 1) Routine teaching for patients and families 2) Prepare patient and family for discharge 3) Comforting/talking with patients 4) Adequately documenting nursing care 5) Back rubs and skin care 6) Oral hygiene 7) Develop or update nursing care plan
Circle all that apply 1 2 3 4 5 6 7
Hospital _________ Date ________________________
Evidence-based Staffing 140
Evidence-based Standards for Measuring Nurse Staffing and Performance
Hospital Profile Interview Questions
1 What is the title of the nurse responsible for Operating Decisions?
2 What is the title of the nurse responsible for Standards of Practice?
3 If the hospital is structured by Programs, is there any central control of nurse staffing decisions?
4 Who determines the volume and skill mix for nursing?
5 Does your hospital have: a) Student nurses b) Student physicians c) Residents
Circle all that apply: a b c
6 Where are inpatient cardiovascular and cardiology services provided in your hospital? List the names and designations of nursing units.
7 How long do patients routinely stay in ICU?
8 Does your hospital have a formal preoperative process prior to elective cardiovascular surgery?
Yes.......................................................... No............................................................ If yes, please provide a description and indicate the proportion of annual cardiovascular patient surgical volume that attend________________________
1 2
9 Does your hospital have any policies for violence/abuse against nurses?
Yes, please provide copies...................... No............................................................
1 2
10 Does your hospital have advanced practice nurses for cardiovascular and/or
Evidence-based Standards for Measuring Nurse Staffing and Performance
Unit/Program Profile
1
Does your unit use Critical Pathways or Clinical Guidelines for common cardiovascular and cardiology diagnoses?
Yes, please provide copies................ No.......................................................
1 2
2
Does your unit use standard nursing care plans for common cardiovascular and cardiology diagnoses?
Yes, please provide copies................ No.......................................................
1 2
3
In your unit, do your policies and procedures for cardiovascular and cardiology patients allow nurses, during an emergency situation, to: a) Initiate an IV b) Defibrillate c) Initiate thrombolytic agents d) Initiate oxygen
Circle all that apply: a b c d
4
Is there a formal pre-op program for your patients?
Yes...................................................... No....................................................... Provide a description of program goals, length of program, the services provided and the criteria for inclusion
1 2
5
What is the post discharge follow-up procedure for patients?
Describe and provide an estimate of the percentage of patients that would be involved
6
Do you have a nurse educator: a) For the unit: b) For the program:
Yes, please provide details............... No.......................................................
1 2
8
What are the average daily hours of housekeeping support for this unit?
Hospital _________ Date ________________________
Evidence-based Staffing 142
9
Are there any current issues related to the physical environment that we should be aware of?
10
Determining turnover rate:
a) How many positions have been posted in the past year? ___________ b) How many positions have been budgeted for in the past year? ______
11
Determining vacancy rate:
a) How many days have been vacant in the past year? ______ b) How many budgeted FTEs in the past year? ______
12
Do you have access to the following allied health professionals and are they dedicated to the unit? a) Physiotherapists b) Occupational Therapists c) Social Workers d) Nutritionists/Dieticians e) Other(s):__________________________
Circle only per discipline: a) Access: Yes................................. No................................. Dedicated: Yes................................ No.................................. #FTEs dedicated to unit_________ b) Access: Yes................................. No................................. Dedicated: Yes................................. No................................. #FTEs dedicated to unit_________ c) Access: Yes................................ No................................. Dedicated: Yes................................. No................................. #FTEs dedicated to unit__________ d) Access: Yes.............................. No................................. Dedicated: Yes................................. No................................. #FTEs dedicated to unit__________ e) Access: Yes............................... No............................... Dedicated: Yes................................ No................................. #FTEs dedicated to unit__________
1 2 1 2 1 2 1 2 1 2 1 2 1 2 1 2 1 2 1 2
Evidence-based Staffing 143
Daily Unit Staffing Form
Patient Census by Shift Shifts # of Patients # Admissions or
Transfers In # Discharges or Transfers Out
days: 0730-1530
evenings: 1530-1930
evenings: 1930-2330
nights: 2330-0730
other: Number of Staff Working on Unit Shifts # RNs
FT PT Casual # RPNs/RNAs FT PT Casual
# other (UCPs) FT PT Casual
days: 0730-1530
evenings: 1530-1930
evenings: 1930-2330
nights: 2330-0730
other: Number of Agency Staff Shifts # of Agency Nurses # of Agency Non-Nurses (e.g., Sitters)
days: 0730-1530
evenings: 1530-1930
evenings: 1930-2330
nights: 2330-0730
other: Number of Overtime Hours
Hospital _________ Date ________________________
Evidence-based Staffing 144
Number of Staff Absent from Unit Due to Illness Shifts # RNs
FT PT Casual # RPNs/RNAs FT PT Casual
# other (UCPs) FT PT Casual
days: 0730-1530
evenings: 1530-1930
evenings: 1930-2330
nights: 2330-0730
other: Number of Staff Absent from Unit Due to Reasons Other than Illness Shifts # RNs
FT PT Casual#RPNs/RNAs FT PT Casual
# other (UCPs) FT PT Casual
days: 0730-1530
evenings: 1530-1930
evenings: 1930-2330
nights: 2330-0730
other:
Shifts # RNs FT PT Casual
# RPNs/RNAs FT PT Casual
# other (UCPs) FT PT Casual
days: 0730-1530
evenings: 1530-1930
evenings: 1930-2330
nights: 2330-0730
other:
Hospital _________ Date ________________________
Evidence-based Staffing 145
Number of Staff who Floated To Unit Shifts # RNs
FT PT Casual#RPNs/RNAs FT PT Casual
# other (UCPs) FT PT Casual
days: 0730-1530
evenings: 1530-1930
evenings: 1930-2330
nights: 2330-0730
other: Number of Staff who Floated From Unit Shifts # RNs
FT PT Casual#RPNs/RNAs FT PT Casual
# other (UCPs) FT PT Casual
days: 0730-1530
evenings: 1530-1930
evenings: 1930-2330
nights: 2330-0730
other: Number of Staff on Orientation (either formal or on-the-job training) Shifts # RNs
FT PT Casual#RPNs/RNAs FT PT Casual
# other (UCPs) FT PT Casual
days: 0730-1530
evenings: 1530-1930
evenings: 1930-2330
nights: 2330-0730
other:
Hospital _________ Date ________________________
Evidence-based Staffing 146
Number of Patient Falls or Medication Errors Shifts Patient Falls Medication Errors
days: 0730-1530
evenings: 1530-1930
evenings: 1930-2330
nights: 2330-0730
other: Unit Workload Data Patient Care Workload: GRASP Patient Care Hours or Medicus Patient Type ________________________________________ Non-patient Care Workload: GRASP Non-patient Care Hours or Medicus Non-patient care workload ________________________
Hospital _________ Date ________________________
Evidence-based Staffing 147
Number of Patients Assigned to RNs at Beginning of Day Shifts RN Code FT PT Casual
Hospital _________ Date ________________________
Evidence-based Staffing 148
Evidence-based Standards for Measuring Nurse Staffing and Performance
Daily Environmental Complexity Scale
For the following, please rate how each item influenced your ability to provide required care for patient(s) on this shift. Please reflect on the workload you anticipated prior to starting your shift and decide the nature of the influence of each item. Did the item increase anticipated workload, decrease anticipated workload or have no influence on anticipated workload? (i=increased work, d=decreased work, or s=same as usual/no change). Then, rate the extent of the item’s influence on a scale of 1 to 5 (1=low influence, 3=medium influence, 5=high influence).
Circle your responses. For those items not applicable to this shift please leave blank.
Incr
ease
d w
orkl
oad
Dec
reas
ed
wor
kloa
d
Sam
e as
usu
al/
No
chan
ge
Low
1 2
Med
ium
3 4 H
igh
5
Students:
1 Students on the unit today required supervision and assistance
i d s 1 2 3 4 5
2 Students wanted access to charts, equipment & supplies
i d s 1 2 3 4 5
Staffing:
3 Scheduled unit staff absent this shift (includes UM, RNs, RNAs, LVNs, clerical and assistive staff)
i d s 1 2 3 4 5
Nursing Team Functioning:
4 Staff unable to pull together to complete unit work i d s 1 2 3 4 5
Assignment:
5 Rushing to get work done i d s 1 2 3 4 5
Unanticipated Communication with Doctors:
6 More than the usual calls to doctors this shift i d s 1 2 3 4 5
7 Clarifying doctors' orders i d s 1 2 3 4 5
Unanticipated Delays:
8 Doctors not answering pages i d s 1 2 3 4 5
9 Multiple delays experienced on the unit i d s 1 2 3 4 5
10 Medication, supplies and narcotic keys missing i d s 1 2 3 4 5
Hospital _________ Date ________________________
Copyright L. O’Brien-Pallas Evidence-based Staffing 149
11 Language barrier with family and/or patient i d s 1 2 3 4 5
Unexpected Change in Patient Condition:
12 Agitated, confused, or restless patient(s) i d s 1 2 3 4 5
13 Unanticipated increase in patient acuity i d s 1 2 3 4 5 Unanticipated Time Consuming
Interventions for Patient and Family:
14 Stat blood work i d s 1 2 3 4 5
Incr
ease
d w
orkl
oad
Dec
reas
ed
wor
kloa
d
Sam
e as
usu
al/
No
chan
ge
Low
1 2 M
ediu
m
3 4
Hig
h
5
15 Extra vital signs i d s 1 2 3 4 5
16 Extra charting and paperwork i d s 1 2 3 4 5
17 Greater demand for routine patient teaching i d s 1 2 3 4 5
18 Greater demand for psychosocial support for patient i d s 1 2 3 4 5
19 Greater demand for psychosocial support for family i d s 1 2 3 4 5
Unanticipated and Time Consuming Non-Patient Care Activities:
20 Completing work of others (e.g. dietary, clerical staff, housekeeping, nursing administration)
i d s 1 2 3 4 5
21 Interruptions (e.g., called back to desk, phone) that influences time with patients and family
i d s 1 2 3 4 5
22 Participating in nursing research i d s 1 2 3 4 5
Please add and rate any other information regarding events that significantly influenced your ability to provide required care on this shift:
23
i d s 1 2 3 4 5
24
i d s 1 2 3 4 5
25
i d s 1 2 3 4 5
Hospital _________ Date ________________________
Copyright L. O’Brien-Pallas Evidence-based Staffing 150
Please rate the time available to deliver
care on THIS SHIFT compared to the last five shifts you have worked. CIRCLE ONLY ONE RESPONSE:
26
Less time than usual
About the same amount of time as usual
More time than usual
Approximately how much more time do you feel you need to give the type of care stated in the nursing care plan or your assessment of patient’s needs to day? CIRCLE ONLY ONE RESPONSE:
27
No more time needed
< 15 minutes
15-30 minutes
31-45 minutes
46-60 minutes
>60 minutes
Hospital __________ Unit __________ Patient __________
Evidence-based Staffing 151
PRN 80
Hospital __________ Unit __________ Patient __________
Evidence-based Staffing 152
Hospital __________ Unit __________ Patient __________
Evidence-based Staffing 153
PRN Daily Workload and Grasp Patient Care Hours Date Unit Nurse
Code Respiration Feeding Elimination Hygiene Communication Treatment Diagnostic GRASP
PCH
Hospital __________ Unit __________ Patient __________
Evidence-based Staffing 154
Evidence-based Standards for Measuring Nurse Staffing and Performance
Patient Data Form Please circle the number of the appropriate response to each question or, where indicated, fill in the blanks.
1 Date of admission dd/mm/yy _______________________
2 Date of discharge/transfer/death dd/mm/yy _______________________
3 Admission diagnosis
4 Other concurrent diagnosis
5 Sex Male....................................................... Female...................................................
1 2
6 Age __________years
7 Occupation
8 Highest level of education: Less than high school diploma............. High school diploma............................ Trade certificate/college/some university University degree.................................
1 2 3 4
9 Does the patient have a potential caregiver at home?
10 Does patient have a family physician? Yes............................................................ No..............................................................
1 2
11 Actual length of stay in ICU: _______ hours
12 Actual length of stay in hospital: _______ hours
13 Has the patient been transferred back to ICU?
Yes, number of hours in ICU___________ No...............................................................
1 2
14 Did patient attend pre-operative clinic? Yes............................................................. No...............................................................
1 2
Hospital __________ Unit __________ Patient __________
Evidence-based Staffing 155
15 Is patient booked for post-operative/post-discharge education?
17 Did patient have any falls: a) Resulting in injury: b) Not resulting in injury:
a)Yes, specify injury_______________ No..................................................... b) Yes..................................................... No......................................................
1 2 1 2
18 Did the patient develop any of the following: a) urinary tract infection b) pneumonia c) superficial incisional surgical site infection d) deep incisional surgical site infectione) bedsores f) thrombosis
Circle all that apply a b c d e f
19 Did patient get a referral for home care? Yes......................................................... No..........................................................
1 2
20 Was this a planned admission? Yes......................................................... No..........................................................
1 2
21 Was the patient hospitalized for the same condition in the past 3 months?
22 Were there any nurse medication errors with this patient?
Yes, with patient consequences, specify________________________ Yes, without patient consequences No medication errors
1 2 3
Evidence-based Staffing 156
Maslach=s Burnout Inventory This section contains statements of JOB-RELATED FEELINGS. If you have never had this feeling, circle the A0@ (zero) after the statement. Otherwise, indicate how often you feel like this by circling the number (from1 to 6) that best describes how frequently you feel that way.
How Often?
Never
A few times a year or
less
Once a month or less
A few times a month
Once
a week
A few times a week
Every day
1
I feel emotionally drained from my work
0
1
2
3
4
5
6
2
I feel used up at the end of the workday.
0
1
2
3
4
5
6
3
I feel fatigued when I get up in the morning and have to face another day on the job.
0
1
2
3
4
5
6
4
I can easily understand how my patients feel about things.
0
1
2
3
4
5
6
5
I feel I treat some patients as if they were impersonal objects.
0
1
2
3
4
5
6
6
Working with people all day is really a strain for me.
0
1
2
3
4
5
6
7
I deal very effectively with the problems of my patients.
0
1
2
3
4
5
6
8
I feel burned-out from my work.
0
1
2
3
4
5
6
9
I feel I=m positively influencing other people=s lives.
0
1
2
3
4
5
6
10
I=ve become more callous toward people since I took this job.
0
1
2
3
4
5
6
11
I worry that this job is hardening me emotionally.
0
1
2
3
4
5
6
12
I feel very energetic.
0
1
2
3
4
5
6
13
I feel frustrated by my job.
0
1
2
3
4
5
6
14
I feel I=m working too hard on my job.
0
1
2
3
4
5
6
15
I don=t really care what happens to some patients.
0
1
2
3
4
5
6
16
Working directly with people puts too much stress on me.
0
1
2
3
4
5
6
17
I can easily create a relaxed atmosphere with my patients.
0
1
2
3
4
5
6
18
I accomplish many worthwhile things in this job.
0
1
2
3
4
5
6
Evidence-based Staffing 157
Never
A few times a year or
less
Once a month or less
A few times a month
Once
a week
A few times a week
Every day
19 I feel exhilarated after working closely with my patients.
0 1
2
3
4
5
6
20
I feel like I=m at the end of my rope.
0
1
2
3
4
5
6
21
In my work, I deal with emotional problems very calmly.
0
1
2
3
4
5
6
22
I feel patients blame me for some of their problems.
0
1
2
3
4
5
6
Evidence-based Staffing 158
Effort-Reward Imbalance For each of the following statements, please indicate first whether you agree or disagree with it. If there is an arrow ⇒ behind your answer please also indicate how much you are generally distressed by this situation. Thank you for answering all statements.
I am very distressed 4 I am distressed 3 I am somewhat distressed 2 I am not at all distressed 1
1. I have constant time pressure due to a heavy work load. disagree
agree ⇒
1
2
3
4
2. I have many interruptions and disturbances in my job. disagree agree
⇒
1
2
3
4
3. I have a lot of responsibility in my job. disagree agree
⇒
1
2
3
4
4. I am often pressured to work overtime disagree agree
⇒
1
2
3
4
5. My job is physically demanding. disagree agree
⇒
1
2
3
4
6. Over the past few years, my job has become more and more demanding.
disagree agree
⇒
1
2
3
4
7. I receive the respect I deserve from my superiors. disagree agree
⇒
1 2 3 4
8. I receive the respect I deserve from my colleagues. disagree agree
⇒
1 2 3 4
9. I experience adequate support in difficult situations. disagree agree
⇒
1 2 3 4
10. I am treated unfairly at work. disagree agree
⇒
1
2
3
4
11. My job promotion prospects are poor. disagree agree
⇒
1
2
3
4
12. I have experienced or I expect to experience an undesirable change in my work situation.
disagree agree
⇒
1
2
3
4
13. My job security is poor. disagree agree
⇒
1
2
3
4
14. My current occupational position adequately reflects my education and training.
disagree agree
⇒
1 2 3 4
15. Considering all my efforts and achievements, I receive the respect and prestige I deserve at work.
disagree agree
⇒
1 2 3 4
16. Considering all my efforts and achievements, my work prospects are adequate.
disagree agree
⇒
1 2 3 4
17. Considering all my efforts and achievements, my salary /income is adequate.
disagree agree
⇒
1 2 3 4
Evidence-based Staffing 159
Nursing Work Index
For each item in this section, please indicate the extent to which you agree that the following items ARE PRESENT IN YOUR CURRENT JOB. Indicate your degree of agreement by circling the appropriate number.
The following are present in your current job . . .
Strongly Agree
Somewhat
Agree
Somewhat Disagree
Strongly Disagree
1
Adequate support services allow me to spend time with my patients.
1
2
3
4
2
Physicians and nurses have good working relationships.
1
2
3
4
3
A good orientation program for newly employed nurses.
1
2
3
4
4
A supervisory staff that is supportive of the nurses.
1
2
3
4
5
A satisfactory salary.
1
2
3
4
6
Nursing controls its own practice.
1
2
3
4
7
Active staff development or continuing education programs for nurses.
1
2
3
4
8
Career development/clinical ladder opportunity.
1
2
3
4
9
Opportunity for staff nurses to participate in policy decisions.
1
2
3
4
10
Support for new and innovative ideas about patient care.
1
2
3
4
11
Enough time and opportunity to discuss patient care problems with other nurses.
1
2
3
4
12
Enough registered nurses on staff to provide quality patient care.
1
2
3
4
13
A nurse manager or immediate supervisor who is a good manager and leader.
1
2
3
4
14
A senior nursing administrator who is highly visible and accessible to staff.
1
2
3
4
15
Flexible or modified work schedules are available.
1
2
3
4
16
Enough staff to get work done.
1
2
3
4
17
Freedom to make important patient care and work decisions.
1
2
3
4
18
Praise and recognition for a job well done.
1
2
3
4
Evidence-based Staffing 160
19
The opportunity for staff nurses to consult with clinical nurse specialists or expert nurse clinicians/educators.
1
2
3
4
20
Good working relationships with other hospital departments or programs.
1
2
3
4
21
Not being placed in a position of having to do things that are against my nursing judgement.
1
2
3
4
22
High standards of nursing care are expected by the administration.
1
2
3
4
23
A senior nursing administrator equal in power and authority to other top level hospital executives.
1
2
3
4
24
A lot of team work between nurses and physicians.
1
2
3
4
25
Physicians give high quality medical care.
1
2
3
4
26
Opportunities for advancement.
1
2
3
4
27
Nursing staff are supported in pursuing degrees in nursing.
1
2
3
4
28
A clear philosophy of nursing that pervades the patient care environment.
1
2
3
4
29
Nurses actively participate in efforts to control costs.
1
2
3
4
30
Working with nurses who are clinically competent.
1
2
3
4
31
The nursing staff participates in selecting new equipment.
1
2
3
4
32
A nurse manager or supervisor who backs up the nursing staff in decision-making, even if the conflict is with a physician.
1
2
3
4
33
Administration that listens and responds to employee concerns.
1
2
3
4
34
An active quality assurance program.
1
2
3
4
35
Staff nurses are involved in the internal governance of the hospital (e.g., practice and policy committees).
1
2
3
4
36
Collaboration between nurses and physicians.
1
2
3
4
37
A preceptor program for newly hired RNs.
1
2
3
4
38
Nursing care is based on a nursing rather than a medical model.
1
2
3
4
39
Staff nurses have the opportunity to serve on hospital and nursing committees.
1
2
3
4
Evidence-based Staffing 161
40
The contributions that nurses make to patient care are publicly acknowledged.
1
2
3
4
41
Nurse managers consult with staff on daily problems and procedures.
1
2
3
4
42
A work environment that is pleasant, attractive, and comfortable.
1
2
3
4
43
Opportunity to work on a highly specialized patient care unit.
1
2
3
4
44
Written up-to-date nursing care plans for all patients.
1
2
3
4
45
Patient care assignments that foster continuity of care (i.e., the same nurse cares for the patient from one day to the next).
1
2
3
4
46
Staff nurses do not have to float from their designated unit.
1
2
3
4
47
Staff nurse actively participate in developing their own working schedule (i.e., what days they work, days off, etc.).
1
2
3
4
48
Each patient care unit determines its own policies and procedures.
1
2
3
4
49
Working with experienced nurses who Aknow@ the hospital nurses.
1
2
3
4
Evidence-based Staffing 162
Appendix F. Methods
Methods
Methods: Multilevel Modeling and MLwin ............................................................................... 163
MLwin ..................................................................................................................................... 167 List of Tables
Table 1: Unit Characteristics Aggregated from Individual Nurse Level.................................... 164
Table 2: Dichotomy of Outcome Variables ................................................................................ 165
Evidence-based Staffing 163
Methods: Multilevel Modeling and MLwin Health science research often concerns problems that have a hierarchical structure, for example, when patients are nested within units, and units are nested within hospitals. In multilevel analysis, data structure of this nature is viewed as a multistage sample from a hierarchical population. By focusing on the level of hierarchy in the population, multilevel modeling enables researchers to understand where and how effects are occurring. It provides better estimates in answering simple questions for which single-level analyses were once used and in addition, allows more complex questions to be addressed. For example, how the effect of unit characteristics might affect the patient’s outcome? Or more specifically, patients spent more time in a unit with more full-time nurses would more likely result in a sooner discharge than in other units. Failing to recognize the existence of clustering will generally imply standard errors of regression coefficients for higher level variables to be underestimated, which also leads to a higher probability of type I error. For example, if standard errors were underestimated, it might be inferred that there was a real difference between a teaching hospital and a non-teaching hospital, which in fact could not be claimed due to the lack in number of hospitals included in the study.
Multilevel structures
Three sets of outcome variables, patient, nurse and system outcomes, were modeled in this study. In order to model patient and nurse outcomes, a three-level data structure was originally considered. Level 1 is the individual level, i.e., patient level for patient outcome or nurse level for nurse outcomes. Level 2 is unit and level 3 is hospital. Since there were a small number of hospitals (only 6) recruited in the study, any difference among hospitals would not be detected due to the limited sample size at hospital level. Thus, the hospital level was removed, and only unit level, individual patient and nurse levels were modeled. The removal of hospital level meant that the effect of the hospital level variables was not investigated on patient, nurse, and system outcomes, such as teaching hospital status, hospital size, etc. To study the effect of nurse’s characteristics and measures on patient outcomes and because one or more nurses may have cared for a patient during their hospital stay, information from all those nurses was aggregated to patient level as well as attached to each patient as patient level variables. Similarly, for those nurses who may have cared for multiple patients, information from those patients, during the study period, was aggregated as well as attached to each nurse as nurse level variables. Note that averaging or proportion was used in the aggregation of variables. Missing values were imputed using either regression imputation, cell mean imputation, or mean of nearby points (for daily data). Since patients have changed their units during their hospital stay, the proportion of days in the unit out of their total length of stay was assigned as weights to each unit they ever stay. For nurse outcomes, the unit indicated in the nurse survey form was used in the analyses. In total, there are
Evidence-based Staffing 164
24 units at unit level for either patient, nurse or system outcomes. There are 1198 patients in patient outcome models and there are 727 nurses for most of the nurse outcome models. For those nurse outcomes where patient characteristics have immediate impact on, only 555 direct care nurses, during the study period, were included in the models. To answer part of research question 1 and 3, daily productivity/utilization measurements were modeled in a multilevel framework as well. Level 1 is date and Level 2 is the unit. Again, hospital was not included as a level as it was excluded for other outcome models. The nurse and patient characteristics and measurements were aggregated by date and unit such that the impact of patient and nurse variables on the productivity/utilization at unit level can be studied. As a measurement of unit atmosphere or morale at unit, some of individual nurse measurements were aggregated to unit level as unit measurements. Most of them were proportions, such as proportion of full time nurses, proportion of satisfied nurses in the unit. Others were based on average within the unit, for example, nurse age on average. The following variables at unit level, Table 1, have been constructed and considered in models, though not necessary included in the final models.
Table 1: Unit Characteristics Aggregated from Individual Nurse Level Unit Characteristics Aggregated from Individual Nurse Level Average Age of Nurses Proportion of Nurses with BScN or Above Proportion of Nurses Work On Multiple Units Proportion of Full-time Employment Average Overtime Hours Average Clinical Expertise Proportion of Nurses Reporting Job Instability Proportion of Nurses Reporting Shift Changes Prevalence of Violence at Unit Proportion of Nurses with Interventions Not Done Proportion of Nurses with Interventions Delayed Proportion of Nurses with Risk at Effort and Reward Imbalance Proportion of Emotionally Exhausted Nurses Average Nurse Autonomy Average Nurse-physician Relationship Proportion of Nurses Reporting Sick Leave Proportion of Nurses Intending to Leave Current Job Proportion of Physically Healthy Nurses Proportion of Mentally Healthy Nurses Proportion of Satisfied Nurses Proportion of Nurses Rating Good Patient Care Quality Proportion of Nurses Rating Good Nursing Care Quality
Evidence-based Staffing 165
Variables Most of outcome variables were dichotomized and multilevel logistic regressions were used to model the effects of predictors. How each variable was constructed or dichotomized is shown in Table 2. Only productivity/utilization, averaged nursing hours, cost per RIW, autonomy and nurse-physical relationship were treated as continuous variables. Logarithm transformation was applied to averaged nursing hours and cost per RIW to assume the normality. Length of stay was also logarithm transformed as a control variable when nursing hours and cost were modeled. Only those measurements to answer research questions and predictors relevant conceptually or theoretically to the outcome variables were included in the models. Other predictors will be included in the final models if they are significantly associated with outcome variables.
Table 2: Dichotomy of Outcome Variables Predictor and Dependent Variable
Measurement
Patient variables Medical consequences Yes to any of the following: fall with injury, medication errors, death, or
complications such as UTI, pneumonia, superficial surgical site infection, deep surgical site infection, bedsores, and thrombosis; dichotomized as yes vs. no.
Length of stay Measured by the difference score between length of stay from medical record and expected length of stay from CIHI inpatient data for Ontario; dichotomized as shorter than expected length of stay vs. others
Patient’s physical health Measured with SF-12 scale at admission and discharge; Improved at discharge vs. others
Patient’s mental health Measured with SF-12 scale at admission and discharge; Improved at discharge vs. others
Omaha knowledge Increased at discharge or diagnosis resolved vs. others Omaha behaviour Improved at discharge or diagnosis resolved vs. others Omaha status Improved at discharge or diagnosis resolved vs. others Actual worked hours per
patient Total nursing hours divided by midnight census
Cost per RIW RIW*actual cost per equivalent weighted case Nurse variables Education Highest nursing educational credential; dichotomized as BScN or above vs.
diploma Work on Multiple Units Work on more than one units vs. one Clinical Expertise Average scores on 4-point scale on being a preceptor for another nurse, providing
clinical advice, level on expertise Unit Instability Reporting any of the following: Forced to change unit in past year, anticipate
forced change of units in next year or expect to lose job within the next year; dichotomized as yes vs. no
Shift Change Reporting more than one shift change in the past 2 weeks vs. none Prevalence of Violence Reporting any of the following: physical assault, threat assault, or emotional
abuse; dichotomized as yes vs. no.
Evidence-based Staffing 166
Predictor and Dependent Variable
Measurement
Interventions Not Done Reporting interventions not done on the last shift for the following interventions: vital sign/medications/dressings, mobilization/turns, patient/family teaching, discharge prep, comforting/talking with patients, documenting nursing care, back rubs/skin care, oral hygiene, or care plan; dichotomized as one or more interventions not done vs. none
Interventions Delayed Reporting interventions delayed on the last shift for the following: vital signs/medications/dressings, mobilization/turns, response to patient bell, or PRN pain medication; dichotomized as one or more interventions delayed vs. none
Effort and Reward Imbalance
Dichotomized as at risk of effort and reward imbalance (> 1) vs. not at risk (≤ 1)
Emotional Exhaustion Sum score of nine 7-point scale item; dichotomized as at risk (score > 27) vs. not at risk (score ≤ 27)
Autonomy Sum score of six autonomy items from NWI; the higher the score, the more autonomy nurses feel about work.
Nurse-Physician Relationship
Sum score of three nurse-physician relationship items from NWI; the higher the score, the more positive nurses feel about the nurse-physician relationship.
Absenteeism Number of occasions missing work due to illness and disability; dichotomized as one or more sick leaves vs. none
Intent to Leave Plan to leave within the next year vs. no Physical Health Physical health, measured with SF-12 Mental Health Mental health, measured with SF-12 Satisfaction with Current
Job Average score of 5-point scale on social contact at work, social contact after work, opportunities to interact with management, amount of responsibility, satisfaction with present Job, and satisfaction with a being a nurse; dichotomized as satisfied/very satisfied vs. dissatisfied/very dissatisfied.
Improved Quality of Patient Care
Quality of patient care in the unit in the past year; dichotomized as improvement vs. others
Good Quality of Nursing Care
Quality of nursing care in the last shift; dichotomized as excellent/good vs. fair/poor
Environmental Complexity Scale Re-sequencing of Work Re-sequencing of work in response to others Unanticipated Changes in
Patient Acuity Unanticipated changes in patient condition, unanticipated time consuming interventions for patient and family, and so on.
Composition & Characteristics of Care Team
Supervision and assistance of student nurses
More Time Needed Amount of more time needed to give the type of care stated in the nursing care plan
Unit variables Unit Occupancy Measured by midnight census divided by beds on unit Proportion of RN worked
hours Proportion of nursing hours contributed by RNs in the unit
Average worked hours Average worked hours provided to patients on unit Productivity/utilization Unit workload divided by total worked hours on unit
Evidence-based Staffing 167
MLwin MLwin beta version 2.0 was used to analyze the data. In MLwin, the hierarchical structure of the data is identified by variables which label the units at each level1. These are known as level or unit identifiers and must be declared when a model is being set up in the equations window or estimate tables. The data were sorted according to the data hierarchy to ensure MLwin functioned properly. The order of entry of variables was consistent with the theoretical framework at two levels. The level 1 variables were first entered and tested, then moved to the second level. RIGLS/IGLS estimation was used to generate coefficients and their standard errors. In the case of estimation failure from RIGLS/IGLS estimation, MCMC methods were used to continue the estimation. The -2 log likelihood value was used to make comparisons among different models. The test of significance for individual variables was conducted by using the “intervals and tests” facility in MLwin. Reference 1. Rasbash, J., Browne, W. Goldstein, H., et al. (2000). A user’s guide to MLWIN. Multilevel
Models Project [Computer software and manual], Institute of Education, University of London.
Evidence-based Staffing 168
Appendix G. Descriptive Analyses
List of Tables .............................................................................................................................. 169
1. System Characteristics .....................................................................................................................171
2. Patient Characteristics .....................................................................................................................173 2.1 Patient Demographics ...............................................................................................................................173 2.2 Medical Diagnoses....................................................................................................................................176 2.3 Nursing Diagnoses and OMAHA Scores at Admission............................................................................177 2.4 Health Status at Admission .......................................................................................................................178
3. Nurse Characteristics ....................................................................................................................... 180 3.1 Nurse Demographics.................................................................................................................................180 3.2 Professional and Employment Status........................................................................................................181 3.3 Education and Clinical Expertise ..............................................................................................................181 3.4 Experience ................................................................................................................................................182
4. System Behaviours............................................................................................................................ 184 4.1 Workload ..................................................................................................................................................184 4.2 Workload Variation by Patient Medical Diagnosis...................................................................................186 4.3 Overtime and Continuity of Care/Shift Change and Unit Instability ........................................................188 4.4 Non-Nursing Tasks ...................................................................................................................................190
5. Intermediate System Outputs ............................................................................................................ 190 5.1 Worked Hours...........................................................................................................................................190 5.2 Productivity/Utilization.............................................................................................................................193
7. Patient Outcomes.............................................................................................................................. 197 7.1 Medical Consequences..............................................................................................................................197 7.2 OMAHA Scores at Discharge and Change from Admission ....................................................................198 7.3 Health Status at Discharge and Change from Admission .........................................................................198
8. Nurse Outcomes................................................................................................................................ 199 8.1 Burnout and Effort & Reward Imbalance .................................................................................................199 8.2 Autonomy and Control .............................................................................................................................201 8.3 Job Satisfaction .........................................................................................................................................201 8.4 Health Status .............................................................................................................................................202 8.5 Violence at Work ......................................................................................................................................203
9. System Outcomes .............................................................................................................................. 204 9.1 Quality of Care..........................................................................................................................................204 9.2 Absenteeism..............................................................................................................................................205 9.3 Intent to Leave ..........................................................................................................................................206 References................................................................................................................................................. 207
Evidence-based Staffing 169
List of Tables Table 1: Hospital Characteristics............................................................................................... 171 Table 2: Unit Characteristics ..................................................................................................... 172 Table 3: Aspects of Care Process – Percent of Patients Reporting Yes to Items in the Table, by
Hospital..................................................................................................................... 173 Table 4: Percent of Surgical Patients who Attended Pre-op Clinic and Post-op Education, by
Hospital..................................................................................................................... 173 Table 5: Patient Demographics, by Hospital ............................................................................. 174 Table 6: Patient Age, by Gender and Hospital........................................................................... 174 Table 7: Percent Distribution of Patient Occupation, by Category, by Hospital....................... 175 Table 8: Patient Employment Status – Percent Distribution by Hospital .................................. 175 Table 9: Patient Educational Status – Percent Distribution by Hospital................................... 175 Table 10: Percent Distribution of the Number of CMGs, by Hospital ....................................... 176 Table 11: Mean of Number of Nursing Diagnoses, by Unit Type .............................................. 177 Table 12: OMAHA Scores at Time 1 (Admission and Appearance of New Diagnosis), by Hospital
................................................................................................................................... 178 Table 13: Patient Health Status at Admission, by Hospital........................................................ 179 Table 14: Patient Health Status at Admission, Percent Less than US Norm, by Hospital......... 179 Table 15: Patient Health Status at Discharge, by Hospital........................................................ 180 Table 16: Patient Health Status at Discharge, Percent Less than US Norm, by Hospital......... 180 Table 17: Nurse Demographics, by Hospital ............................................................................. 181 Table 18: Nurse Employment Status, by Hospital ...................................................................... 181 Table 19: Nurse Education and Expertise, by Hospital ............................................................. 182 Table 20: Nurse Experience, N and Percent of Total Respondents, by Hospital ....................... 182 Table 21: Mean (SD) of PRN Workload (in Minutes) by Category, by Hospital ....................... 185 Table 22: PRN Workload Category as Percent of Total PRN Workload, by Hospital .............. 185 Table 23: Comparison of PRN to GRASP/Medicus Workload (in Hours), by Hospital ............ 186 Table 24: Percent Distribution of Work (in Minutes) by Workload Category, by CMG Type... 187 Table 25: Percent of Nurses Reporting Overtime in Average Hours per Week, by Hospital..... 188 Table 26: Percent Change of Nurse Overtime Hours in the Past Year, by Unit Type ............... 188 Table 27: Percent of Overtime Unpaid or Involuntary, if Working Overtime, by Hospital ....... 189 Table 28: Continuity of Care and Amount of Change, by Hospital ........................................... 189 Table 29: Percent of Nurses Reporting Performing Non-Nursing Tasks for Items in the Table, by
Hospital..................................................................................................................... 190 Table 30: Actual Staffing Hours, by Unit, by Day...................................................................... 191 Table 31: Percent of Actual Staffing, by Unit, by Day ............................................................... 192 Table 32: Daily Patient Census, Admissions, and Discharges, by Unit..................................... 193 Table 33: Number of Days When Unit GRASP/Medicus is Greater than 85% and 93% of Total
Nurse Hours, by Unit ................................................................................................ 194 Table 34: Percent of Nurses Reporting Average Hours Worked Per Week in the Past Year, by
Hospital..................................................................................................................... 195 Table 35: Mean of Three Subscales from ECS, by Hospital....................................................... 196 Table 36: Percent of Nurses Reporting Additional Time Needed to Provide Quality of Care, by
Table 37: Medical Consequences – Percent Reporting Yes to the Items in the Table, by Hospital................................................................................................................................... 197
Table 38: OMAHA Scores at Time 2 (Resolution of Diagnosis or at Discharge), by Hospital . 198 Table 39: Differences in OMAHA Scores Between Time 1 and Time 2, by Hospital................. 198 Table 40: Change in Patient Physical Health Status (SF-12) from Admission to Discharge .... 199 Table 41: Change in Patient Mental Health Status (SF-12) from Admission to Discharge....... 199 Table 42: Burnout – Mean Scores of MBI Subscales, by Hospital............................................. 200 Table 43: Burnout – Percent of Nurses at Risk for Emotional Exhaustion and ERI, by Hospital
................................................................................................................................... 200 Table 44: Nurse Work Index Subscales, by Hospital.................................................................. 201 Table 45: Job Satisfaction – Percent of Nurses Dissatisfied, by Hospital ................................. 202 Table 46: Nurse Health Status, by Hospital ............................................................................... 202 Table 47: Nurse Health Status, Percent of SF-12 Scores Less than US Norm for Females, by
Hospital..................................................................................................................... 203 Table 48: Prevalence of Violence – Percent of Nurses Reporting Yes to the Items in the Table, by
Hospital..................................................................................................................... 203 Table 49: Source of Emotional Abuse, by Hospital.................................................................... 204 Table 50: Quality Issues – Percent of Nurses Reporting Yes to Items in the Table, by Hospital205 Table 51: Absenteeism – Percent of Episodes Absent and Mean Shifts per Episode in the Past
Year, by Hospital ...................................................................................................... 206 Table 52: Absenteeism – Most Common Reason to Miss Work in the Past Year, by Hospital .. 206 Table 53: Intent to Leave – Percent of Nurses Reporting Yes to the Items in the Table, by
Descriptive Analyses The results of descriptive analyses are presented at hospital or unit level. Hospital names are suppressed to ensure confidentiality. All comparisons between hospitals and units are merely crude rate comparisons that do not take into account differences in characteristics of patients, nurses, or organizations. 1. System Characteristics Tables 1 and 2 outline the profiles of six hospitals and 24 nursing cardiac and cardiovascular units. Six characteristics describe the hospitals. The total number of inpatient beds denotes the overall size of individual hospitals. Hospital 6 had the largest number of beds whereas Hospital 5 had the smallest. Four of the six hospitals were teaching hospitals. The survey period varied at each site because the volume of eligible patients in each hospital influenced the number of study days. Each hospital had a target of 200 patients. Due to staffing problems, Hospitals 1 - 5 agreed to extend their data collection period to ensure that a sufficient number of patients were included in the analysis. Hospital 6, however, was not able to participate fully and thus had fewer patients completing the survey form and finished the study in a much shorter period of time than the other hospitals. The ability to capture patient level data was limited in some organizations due to the length of time required each day to collect staff data from non computerized systems.
Table 1: Hospital Characteristics
Hospital 1 2 3 4 5 6 TotalNumber of Beds 567 778 507 777 121 1060 3243Teaching N Y N Y Y Y n/aSurvey Patients 189 243 259 195 285 59 1230Number of Study Days 136 121 114 184 136 64 755Patient Midnight Census 14 23 33 19 18 13 19Number of Units 3 3 2 5 6 5 24Note: Y=Yes, teaching hospital; N=No, non-teaching hospital; n/a=Not applicable Number of Beds=Total inpatient beds Surveyed Patients=Number of patients who completed Patient Data Form Patient Midnight Census=Average number of patients in surveyed units Hospitals in the sample provided cardiac and cardiology nursing care using a variety of organizational structures. Surgical patients generally received a portion of their care in a critical care unit (CCU) but pre- and post-operative care was provided on an inpatient (IP) unit. In some organizations (hospitals 1 and 6), step-down units (SDU) were used in addition to the CCU. Some patients also received care in a CCU or SDU but many patients did not use critical care services. The structure and organization of health delivery can affect patient, nurse, and system outcomes. For example, attendance at pre admission or post operative education may have an effect on the resources required during the hospital stay and on the overall length of stay.
Evidence-based Staffing 172
Table 2: Unit Characteristics
Hospital Unit Name Unit Type
Pure Cardiology*
Number of Beds
Number of Study
Patients 1 Coronary care unit
Step-down unit Cardiac post-surgery/pre-op
CCU SDU IP
Y Y Y
12 18 27
3948
1022 Intensive care unit
Coronary care unit Combined Cardiology/Cardiovascular
CCU CCU IP
N Y N
19 11 40
7134102
3 Critical care area Combined Cardiology/Cardiovascular
CCU IP
N Y
15 48
36223
4 6 Eaton South + 6 NU Cardiovascular intensive care units (2) Interventional short stay unit Inpatient cardiology
IP CCU DS IP
Y Y Y Y
56 19 29 26
19406670
5 Interventional cardiology unit Cardiac surgical unit/Recovery Coronary Care unit Cardiovascular Cardiology/surgical Cardiology
DS CCU CCU IP IP IP
Y Y Y Y N Y
17 16
6 28 27 33
3592
3879
1226 Coronary Care units (3)
Cardiology Cardiology Step-down
CCU IP SDU
Y Y Y
38 32 32
5171
Note: CCU = Critical Care Unit DS = Day Surgery IP = Inpatient SDU = Step-Down Unit *Pure cardiology = units that provide care exclusively for cardiac and cardiovascular patients as opposed to patients with other medical or surgical conditions. Tables 3 and 4 show various aspects of the care process in planned admission, pre-op and post-op clinics, referrals to home care, time in SDU, and transfer to ICU. On average, almost half of survey patients reported that their admission was a planned readmission. More than one-fifth (22%) of the patients attended a pre-op clinic and more than half (53%) had post-admission education. About one in ten patients (10.9%) were referred to home care. There were 11.3% of patients who spent time in a SDU. Only 2% of the patients were transferred back to ICU. Hospital 5 had the largest proportion of patients with planned admission (65.4%), which was almost six times that of Hospital 6 (11.9%). Hospital 1 had more surgical patients attending pre-operation clinics than all other hospitals, while Hospital 3 provided post-admission education for more cardiac and cardiovascular patients than any of the other hospitals. Hospital 2 referred 37.7% of patients to home care which was higher than other hospitals (4.3-7.7%). Hospitals 1 and 6 had a relatively larger proportion of patients spending time in SDU. Few if any patients were transferred back to ICU in Hospitals 2, 5, and 6.
Evidence-based Staffing 173
Table 3: Aspects of Care Process – Percent of Patients Reporting Yes to Items in the Table, by Hospital
Hospital 1 2 3 4 5 6 Total Number of cases 189 243 259 195 285 59 1230Planned admission 35.4 32.2 38.2 56.3 65.4 11.9 44.5 Referred to home care 4.3 37.7 6.5 6.6 7.1 7.7 10.9Spent time in SDU 28.0 6.2 7.6 10.0 0.5 28.3 11.3Transferred back to ICU 3.7 0.4 3.1 3.6 0.7 0.0 2.0Note: Due to missing values in each category the denominators to generate percentages are slightly different from N.
Table 4: Percent of Surgical Patients who Attended Pre-op Clinic and Post-op Education, by Hospital
Hospital 1 2 3 4 5 6 TotalNumber of cases 66 69 82 78 129 16 440Attended pre-op clinic 59.1 13.0 31.7 48.7 20.9 37.5 33.0Post-op education 65.2 10.1 72.0 70.5 63.6 43.8 57.5Note: Due to missing values in each category the denominators to generate percentages are slightly different from N. 2. Patient Characteristics Patient characteristics were captured from a variety of data sources.
1) Patients provided information about themselves and their care process in a survey. 2) Each hospital’s Health Records Department provided health records data that included
medical diagnosis at discharge, resource intensity weight, length of stay, admission type, etc.
3) Patients completed a SF-12 Health Survey indicating their functional status at the time of admission and discharge.
4) Data collectors collected nursing diagnoses (NANDA) and ratings of patient OMAHA knowledge, behaviour, and status concerning each nursing diagnosis from the chart, Kardex, and in consultation with the nurse.
In total, 1,230 patients were entered into the study.
2.1 Patient Demographics As shown in Tables 5 and 6, the average age of patients was 63.5 years and two-thirds were male (66.7%). Hospital 2 had the largest proportion of females, and Hospitals 1 and 6 had female proportions well below the average. Hospitals 2 and 3 had high proportions (40.2 and 40.0% respectively) of patients over the age of 70, whereas Hospital 4 has the highest proportion (24.6%) of patients under the age of 50. Patients at Hospitals 2 and 3 were less likely to have a caregiver at home. This may be explained by the higher average age of patients at these sites. On average, over 95% of patients had a family doctor.
Evidence-based Staffing 174
Table 5: Patient Demographics, by Hospital
Hospital 1 2 3 4 5 6 Total
Number of patients 189 243 259 195 285 59 1230 % Male 74.1 60.1 63.3 70.8 66.7 74.6 66.7 % Female 25.9 39.9 36.7 29.2 33.7 25.4 33.3 % Age >=70 30.7 40.2 40.0 29.2 37.0 33.9 35.9 % Age < 50 14.8 11.9 13.8 24.6 14.2 11.9 15.3 % Caregiver at home 87.3 79.1 75.9 85.1 84.2 83.1 82.0 % Family Physician 94.7 95.9 93.1 93.8 98.6 91.5 95.2 Note: The denominators used to generate percentages for each demographic may be slightly different from the number of patients presented in the table.
Table 6: Patient Age, by Gender and Hospital
Male Female Total Hosp N Mean SD N Mean SD N Mean SD
Total 821 62.4 12.44 409 65.6 13.85 1230 63.5 13.01 Patient occupation was originally collected as an open-ended question. Occupations were subsequently classified into 14 categories according to work environments, knowledge, skill, and level of control1 As seen in Table 7, the occupational distribution of patients varied greatly by hospital. Hospitals 4, 5 and 6 had higher proportions of patients reporting a professional occupation, whereas Hospital 1 had mostly service, outdoor physical, and professional occupations. Hospital 3 had a large proportion of housewives and patients with outdoor physical occupations. In contrast, Hospital 2 had an overall even distribution across all occupation categories.
Evidence-based Staffing 175
Table 7: Percent Distribution of Patient Occupation, by Category, by Hospital
Hospital 1 2 3 4 5 6 Total Number of Cases 176 152 220 153 276 57 1034 Self-employed 5.7 0.7 6.4 5.2 4.7 3.5 4.6 Professional 10.8 8.6 8.6 26.8 17.8 19.3 14.7 Outdoor Physical* 10.8 16.4 15.0 3.9 4.7 1.8 9.4 Healthcare Provider 5.1 3.9 1.8 2.6 6.5 3.5 4.2 Government 2.8 3.9 2.3 0.7 7.2 0.0 3.6 Housewife 8.0 8.6 18.6 7.8 5.8 8.8 9.8 Clerical 0.6 6.6 0.9 5.2 6.2 3.5 3.9 Management 8.5 6.6 5.9 5.2 13.4 10.5 8.6 Retail/Sales 3.4 5.3 5.5 3.3 4.3 7.0 4.5 Factory 9.1 7.9 6.4 8.5 7.2 14.0 8.0 Trades 5.1 5.3 3.2 3.3 1.8 12.3 4.0 Business 4.5 3.9 6.4 3.9 6.5 3.5 5.2 Service 23.3 11.2 12.7 16.3 12.3 10.5 14.6 Not working 2.3 11.2 6.4 7.2 1.4 1.8 4.9 *Mostly farmers for Hospital 2 and miners for Hospital 3 in the outdoor physical occupation. More than 60% of patients from Hospitals 1 and 5 were employed, but merely one-third of patients in Hospitals 2 and 3 were working at the time of the survey. Hospital 3 also had the largest proportion (20.0%) of patients not employed (Table 8). The not-employed group consists of housewives, disabled persons, and students. Hospital 2 had primarily retired patients (53.1%) as patients in Hospital 2 were much older than patients in other hospitals. In contrast, less than one-third of patients in Hospitals 1 and 5 fell into the retired group.
Table 8: Patient Employment Status – Percent Distribution by Hospital
Hospital 1 2 3 4 5 6 Total Employed 60.8 34.4 34.9 47.2 65.8 52.6 48.9 Not employed 9.5 12.5 20.0 11.4 6.1 7.0 11.7 Retired 29.6 53.1 45.1 41.5 28.1 40.4 39.4 Number of cases 189 224 255 193 278 57 1196 Note: “Not employed” includes not working and housewives categories in Table 7. Table 9 shows the educational status of the patients. The education level was lower in Hospitals 1 and 3, with less than one third reporting more than high school education. This may reflect the higher proportion of service and outdoor workers in Hospital 1 and the high proportion of housewives in Hospital 3.
Table 9: Patient Educational Status – Percent Distribution by Hospital
Hospital 1 2 3 4 5 6 Total More than high school 28.2 53.5 30.6 45.0 51.3 41.4 41.9
Number of cases 177 185 258 188 281 58 1147
Evidence-based Staffing 176
2.2 Medical Diagnoses
Table 10 shows the percent distribution of CMGs by hospital and the dominant CMG group in each hospital is bolded. As can be seen, “Percutaneous Transluminal Coronary Angioplasty without Cardiac Catheterization” accounts for the largest proportion for Hospitals 3, 4 and 5 whereas “Cardiac Catheterization without Specified Cardiac Condition” accounts for the largest proportion in Hospital 1, “Percutaneous Transluminal Coronary Angioplasty with Complicated Cardiac Condition” has the largest percentage for Hospital 6, and “Major Cardio Procedure no Pump no Catheterization” is the dominant CMG group for patients in Hospital 2.
Table 10: Percent Distribution of the Number of CMGs, by Hospital Hospital CMG
1 2 3 4 5 6 Total
PTCA WO CARD CATH 15.3 1.6 15.4 27.2 13.0 5.1 13.5 PERM PACE IMPL WO SPEC CARD C 6.3 5.3 11.6 18.5 12.6 8.5 10.7 C BYPASS W PUMP WO CARD CATH 11.1 6.6 9.7 5.1 13.0 0.0 8.9 PTCA W CARD COMP 4.2 9.9 8.9 4.6 8.1 22.0 8.1 C VALVE REP W PUMP WO CARDIAC 10.6 2.9 6.9 4.6 9.1 8.5 6.9 CARD CATH NO SPEC CARD COND 19.6 0.4 0.0 2.1 10.9 0.0 5.9 C BYPASS W PUMP W CARD CATH 5.3 11.1 2.7 3.6 5.6 5.1 5.7 MAJ CARDIO PR NO PUMP NO CATH 0.0 13.6 4.2 4.1 1.8 5.1 4.9 ARRTHYMIA 4.2 4.9 6.6 4.1 3.2 5.1 4.6 HEART FAILURE 2.6 3.7 4.6 1.5 3.2 3.4 3.3 AMI NO CARD CATH NO SPEC COND 2.1 4.9 4.2 1.0 1.4 10.2 3.2 OTHER CIRCULATORY DIAGNOSIS 0.0 4.9 5.0 4.1 1.8 1.7 3.2 CHEST PAIN 1.6 1.2 8.9 0.0 2.1 3.4 3.0 CARDIAC CATH W SECIFIED CARD 2.1 4.5 0.4 2.6 2.1 0.0 2.2 UNS ANGINA W CATH NO SPEC CON 1.1 3.7 1.9 1.0 1.4 1.7 1.9 AMI WITH CARD CATH NO SP COND 0.0 4.1 1.2 2.1 1.1 3.4 1.8 PERM PACEMAKER/SPEC CARD COND 0.5 2.1 0.4 3.1 2.8 1.7 1.8 AMI WO CARD C W CHF 1.1 3.3 1.2 1.0 0.4 3.4 1.5 UNSTABLE ANGINA WO CATH WO SP 0.5 3.7 1.9 0.5 0.4 0.0 1.4 UNS ANGINA W CATH NO CRD COND 2.6 0.0 1.2 0.0 2.1 0.0 1.1 CARDIAC CATH WITH VENT TACH 0.0 1.6 0.8 1.5 0.4 1.7 0.9 CRD VLV REP W PUMP W CRD CATH 1.1 0.4 0.4 0.5 2.1 0.0 0.9 AMI W CARD CATH W & WO ANGINA 0.0 1.6 0.8 0.5 0.4 1.7 0.7 SYNCOPE AND COLLAPSE 0.5 0.8 0.4 0.0 0.4 1.7 0.5 ANGINA PECTORIS 0.0 1.2 0.4 0.0 0.0 0.0 0.3 AMI NO CARD CATH W VENT TACH 0.0 0.8 0.4 0.0 0.0 0.0 0.2 AMI W CAD CATH WITH CHF 0.5 0.4 0.0 0.0 0.0 0.0 0.2 CAR CATH W CHF 0.5 0.0 0.0 0.0 0.4 0.0 0.2 CARD CATH W VENTR TACH 1.6 0.0 0.0 0.0 0.0 0.0 0.2 MAJOR CARDIO THORA PROCE WO P 1.1 0.0 0.0 0.0 0.0 0.0 0.2 OTHER CARDIOTORACIC PROC W PU 0.5 0.0 0.0 0.0 0.4 0.0 0.2 PROCEDURE CANCELLED MNRH 1.6 0.0 0.0 0.0 0.0 0.0 0.2 ATHEROSCLEROSIS MNRH 0.5 0.0 0.0 0.0 0.0 0.0 0.1 EXTNSIVE UNREL OR PROCESUDRE 0.5 0.0 0.0 0.0 0.0 0.0 0.1 PERRIPHERAL VASCULAR DISEASE 0.5 0.0 0.0 0.0 0.0 0.0 0.1 RENAL FAILURE NO DIALYSIS 0.0 0.0 0.0 0.0 0.4 0.0 0.1 UNS ANGINA W CATH W SPEC COND 0.0 0.4 0.0 0.0 0.0 0.0 0.1 Total 189 243 259 182 285 55 1213 Note: Data are sorted by the percent in the Total column.
Evidence-based Staffing 177
2.3 Nursing Diagnoses and OMAHA Scores at Admission Nursing diagnosis is a clinical judgment about an individual or family response to an actual or potential health problem or life process. Nursing diagnoses provide the basis for selecting nursing interventions to achieve outcomes for which nurses are responsible. Nursing diagnoses were recorded from admission until discharge. Table 11 shows that the number of nursing diagnoses averaged nearly five (SD=2.6) across all units. The highest mean number of diagnoses was observed in Hospital 5’s CCU (8.44). The lowest average numbers of nursing diagnoses were observed in the DS unit in Hospital 4 (2.58), the DS unit in Hospital 5 (3.42), and IP unit in Hospital 3 (3.47). (Note that only 1,189 patients were included due to missing nursing diagnoses for some patients.) It should be noted that patients could change units during their hospital stay. Because patients may be admitted to one unit and discharged from another, the number of patients admitted to a unit may be different from the number of patients discharged from that unit.
Table 11: Mean of Number of Nursing Diagnoses, by Unit Type
Total Number of Diagnoses Unit at Discharge
# of Patients Grouped by Unit at Discharge Mean SD
Hospital 1 CCU 20 5.55 2.31 IP 110 6.80 3.36 SDU 59 5.19 2.07 Hospital 2 CCU 105 6.48 3.06 IP 132 4.78 2.50 Hospital 3 CCU 18 4.44 1.89 IP 214 3.47 1.51 Hospital 4 CCU 17 5.12 3.55 DS 59 2.58 1.63 IP 115 4.46 1.96 Hospital 5 CCU 9 8.44 3.28 DS 53 3.42 1.71 IP 219 4.34 2.41 Hospital 6 CCU 45 5.27 1.51 IP 11 4.36 .81 SDU 2 6.50 .71 Total 1189 4.68 2.60 OMAHA Problem Scales for Outcomes is an evaluation tool developed by the Omaha Visiting Nurse Association2. The tool measures clinical progress of patients in relation to specific problems or nursing diagnoses at two points in time: at admission or when a new health problem was identified (time 1), and when the health problem was resolved or at discharge (time 2). The three essential dimensions, knowledge, behaviour, and status, are each rated on a 5-point Likert scale ranging from very negative to very positive. A mean score was computed for each person on each dimension and then averaged for the sample. Data about OMAHA at time 1 are presented in Table 12. The data for OMAHA at time 2 and difference scores are presented under section 7.2 in Patient Outcomes.
Evidence-based Staffing 178
Table 12 shows that for all survey patients at time 1, the mean scores were 3.4 (SD=0.75) for knowledge, 4.0 (SD=0.58) for behaviour, and 3.3 (SD=0.62) for status. Patients from Hospital 4 had the highest ratings across all three dimensions.
Table 12: OMAHA Scores at Time 1 (Admission and Appearance of New Diagnosis), by Hospital
Knowledge Behaviour Status Hospital N Mean SD Mean SD Mean SD
Total 1189 3.4 0.75 4.0 0.58 3.3 0.62 Note: Measured on a 5-point Likert scale for Knowledge (1=No knowledge and 5=Superior knowledge), Behaviour (1=Never appropriate in behaviour and 5=Consistently appropriate in behaviour), and Status (1=Extreme symptoms and 5=No symptoms).
2.4 Health Status at Admission The SF-12 is a widely used measure of general health. The questions tap eight health concepts that are reported in two categories: physical and mental health. The eight categories are physical functioning, role physical, bodily pain, general health, energy/fatigue, social functioning, role emotional, and mental health. Although the SF-12 is not quite as reliable and comprehensive as the SF-36, the results of the two measurement tools are highly correlated (r=0.95). Confidence intervals are largely determined by sample size; with large samples, the results will be almost the same regardless of the tool used3. Table 13 shows the two SF-12 subscales measured at admission at the interval level. The mean physical health score of 35.2 (SD=11.2) ranged from, 11.0 to 64.8. The mean mental health score of 48.2 (SD=11.0) ranged from 15.6 to 70.3. The least physically and mentally healthy patients were found in Hospitals 5 and 1 respectively.
Evidence-based Staffing 179
Table 13: Patient Health Status at Admission, by Hospital
Physical Health Scale Mental Health Scale Hospital N Mean SD Range Mean SD Range
Total 1176 35.2 11.2 11.0-64.8 48.2 11.0 15.6-70.3 These two SF-12 subscales can be dichotomized using US norms for the general population as the cut-point. Dichotomized data are presented in Table 14. Nearly nine in ten patients (87.0%) were below the US population norm in physical health upon admission. About half (49.2%) of patients had mental health scores below the US population norm. The percentage of patients that scored below the norm for physical and mental functional status varied across hospitals (χ2=14.8 and 15.2 respectively, df=5, p<0.05). Generally, patients in Hospital 3 were the least physically and mentally healthy, on average.
Table 14: Patient Health Status at Admission, Percent Less than US Norm, by Hospital
Total 87.0 49.2 1176US Norm3 Physically not healthy: < 50.12 Mentally not healthy: < 50.04 Tables 15 and 16 display two SF-12 subscale scores measured at discharge at the interval and dichotomous levels. Patients in Hospitals 2 and 5 tended to be the least physically healthy at discharge while patients in Hospitals 1 and 5 had the lowest average mental health scores at discharge. In contrast, the highest average physical and mental health scores for patients were observed in Hospitals 6 and 4 respectively. The comparison of changes in patient functional status from admission to discharge at the individual level will be presented in section 7.2.
Evidence-based Staffing 180
Table 15: Patient Health Status at Discharge, by Hospital
Physical Health Scale Mental Health Scale Hospital N Mean SD Range Mean SD Range
Total 92.6 51.9 1041US Norm3 Physically not healthy: PHYSICAL HEALTH SCALE < 50.12 Mentally not healthy: Mental Health Scale < 50.04 3. Nurse Characteristics The nursing information was collected from the Nurse Survey, and all the data are based on self report. The Nurse Survey was a very comprehensive survey, covering mental and physical health, job satisfaction, workload and violence during work using many reliable measures such as functional status of health (SF-12), Maslach Burnout Inventory (MBI), Revised Nursing Work Index (R-NWI), and Effort/Reward Imbalance (ERI). A total of 727 nurses participated in the study.
3.1 Nurse Demographics Table 17 demonstrates the gender and age distributions for nurses in each of the participating hospitals. The vast majority of nurses completing the survey were female (93.9%), which is consistent with the female to male ratio of the Canadian nursing workforce4. Only Hospital 1 reported a slightly higher proportion of males than the other sites. This site also reported the highest proportion of nurses less than 30 years of age and the lowest number over the age of 50. Hospitals 3 and 4 had higher proportions of nurses who were less than 30 than the remaining three hospitals but significantly less then Hospital 1. Unlike Ontario’s profile5, some of these organizations have more nurses under 30 than over 50.
Evidence-based Staffing 181
Table 17: Nurse Demographics, by Hospital
Hospital 1 2 3 4 5 6 Total Gender % Female 87.9 94.6 93.2 94.2 95.7 92.9 93.9 Number of Cases 58 186 74 86 210 112 726 Age % < 30 23.2 7.7 13.9 14.3 7.8 6.5 10.2 % > 50 5.4 12.1 11.1 11.9 9.8 17.6 11.6 Number of Cases 56 182 72 84 205 108 707
3.2 Professional and Employment Status Table 18 shows the percentages of nurse respondents who were employed full-time, employed on a permanent basis, and were Registered Nurses. The proportion of full-time nurses varied from 54.3% to 70.9%, with three of the hospital under 60% and three over 65%. Most nurses worked in permanent positions (97.8% on average), with the exception of Hospital 1 (89.8%). The percentage of full-time and/or permanent employees may have been inflated because full-time and/or permanent nurses were more likely to participate in the survey. In terms of nursing composition, respondents were comprised of Registered Nurses (96.6%), Registered Practical Nurses (0.8%), and charge nurses and other personal care workers such as orderlies, Registered Nurse Technicians, clinical leaders, and healthcare aids (2.5%). All respondents from Hospital 2 were Registered Nurses and the respondents from Hospital 3 were all in permanent positions.
3.3 Education and Clinical Expertise Table 19 gives a breakdown of the educational background of the nurses and their level of expertise, as measured by how often peers sought their advice, how often they filled the role of preceptor, and to what degree individuals possessed clinical expertise. The percentage of nurses with BScN and higher degree preparation varied across hospitals, ranging from 29.3% to 61.6%. Despite educational levels, a higher proportion of nurses in Hospital 6 acted as preceptors and 45.0% were frequently asked for clinical advice and considered themselves to be expert clinicians. Nurses at Hospital 1 reported the lowest levels of confidence in their clinical ability and fewer nurses were asked by their peers for clinical advice. Some of the variation in preceptor reporting may be due to variations in the number of student nurses at these hospitals or rate of staff nurse turnover. If turnover rates were high, larger number of staff nurses might be preceptors regardless of their knowledge or skill level.
Evidence-based Staffing 182
Table 19: Nurse Education and Expertise, by Hospital
Hospital 1 2 3 4 5 6 Total N 59 186 74 86 210 112 727 Education - % with BScN and higher 29.3 34.9 40.5 61.6 50.5 32.1 42.3
Table 20: Nurse Experience, N and Percent of Total Respondents, by Hospital
Hospital < 1 yr 1- 5 yrs 6 -10 yrs 11-15 yrs > 15 yrs Total Yrs as a nurse 0
0.0% 13
23.2%12
21.4%14
25.0%17
30.4% 56
100%Yrs in hospital
1
2.2% 19
42.2%8
17.8%9
20.0%8
17.8% 45
100%
1
Yrs on unit
6 14.3%
22 52.4%
7 16.7%
6 14.3%
1 2.4%
42 100%
Yrs as a nurse
0 0.0%
13 7.1%
23 12.5%
40 21.7%
108 58.7%
184 100%
Yrs in hospital
3 2.1%
37 26.2%
13 9.2%
45 31.9%
43 30.5%
141 100%
2
Yrs on unit
7 5.3%
50 38.2%
19 14.5%
34 26.0%
21 16.0%
131 100%
Yrs as a nurse
0 0.0%
8 11.1%
8 11.1%
21 29.2%
35 48.6%
72 100%
Yrs in hospital
1 2.2%
12 26.1%
4 8.7%
18 39.1%
11 23.9%
46 100%
3
Yrs on unit
1 2.3%
24 54.5%
4 9.1%
9 20.5%
6 13.6%
44 100%
Yrs as a nurse
2 2.4%
19 22.9%
14 16.9%
10 12.0%
38 45.8%
83 100%
Yrs in hospital
1 1.6%
25 41.0%
7 11.5%
15 24.6%
13 21.3%
61 100%
4
Yrs on unit
1 1.8%
35 63.6%
4 7.3%
11 20.0%
4 7.3%
55 100%
Yrs as a nurse
0 0.0%
22 10.6%
17 8.2%
49 23.7%
119 57.5%
207 100%
5
Yrs in hospital
2 1.4%
39 27.1%
16 11.1%
41 28.5%
46 31.9%
144 100%
Evidence-based Staffing 183
Hospital < 1 yr 1- 5 yrs 6 -10 yrs 11-15 yrs > 15 yrs Total Yrs on unit
6
4.3% 71
50.4%22
15.6%26
18.4%16
11.3% 141
100%Yrs as a nurse
2
1.9% 6
5.7%12
11.3%25
23.6%61
57.5% 106
100%Yrs in hospital
3
4.6% 11
16.9%7
10.8%21
32.3%23
35.4% 65
100%
6
Yrs on unit 5 8.3%
23 38.3%
11 18.3%
14 23.3%
7 11.7%
60 100%
Yrs as a nurse
4 0.6%
81 11.4%
86 12.1%
159 22.5%
378 53.4%
708 100%
Yrs in hospital
11 2.2%
143 28.5%
55 11.0%
149 29.7%
144 28.7%
502 100%
Total
Yrs on unit
26 5.5%
225 47.6%
67 14.2%
100 21.1%
55 11.6%
473 100%
Table 20 compares overall nursing experience of the nurses, their experience within the same institution and within the same unit. Hospital 1 nurses reported the least experience in all three categories. In all six hospitals, 53.4% of nurses reported more than 15 years of nursing experience. Years as a nurse varied more than years in hospital or years on the nursing unit. Nurses with greater than 15 years experience reported less years on unit than nurses with fewer years of experience. This may reflect hospital restructuring activities in recent years. However, Hospital 1 nurses worked the shortest time on unit compared to any of the other hospitals which may explain lower levels of expertise as reported in Table 19. Age and experience were highly correlated. The correlation coefficients between age and years worked as RN/RPN, years worked as RN/RPN at the current hospital and years worked as RN/RPN at current unit were 0.83, 0.61 and 0.45 respectively (p<0.001). Years worked as RN/RPN was highly associated with all three expert statuses: acting as a preceptor (F=5.27, p<0.05), providing clinical advice (F=39.75, p <0.001), and acting as a clinical expert (F=35.73, p <0.001). A nurse with more years experience as RN/RPN at the current hospital was more likely to be asked for clinical advice (F=23.65, p<0.001) or act as a clinical expert (F=8.51, p <0.01). However, greater years of experience in current hospital were not significantly related to acting as a preceptor. A similar association was found between years on current unit and expert status. A nurse with more years as RN/RPN on his/her current unit was more likely to be asked for clinical advice (F=12.94, p<0.001) or act as a clinical expert (F=42.97, p <0.001). However, more years on current unit was not significantly related to role as a preceptor. Higher education was positively associated with expert status. This association was only statistically significant nurses responded that other nurses sought their clinical judgment
Evidence-based Staffing 184
(χ2=4.26, p<0.05). The associations between education and the status of providing clinical advice or acting as a clinical expert were significant at the 0.1 level. 4. System Behaviours
4.1 Workload Workload data (measured by PRN 806) were collected for each study patient on each study day by the site data collectors. The PRN tool measures the volume of nursing work in minutes by selecting the tasks that need to be completed for that day. Each task is assigned a value based on studies completed by the PRN system in numerous facilities. Workload values are presented on the measurement tool in five minute increments. This value reflects the average time to complete the task, by an average nurse, on an average day, for an average patient. This methodology is referred to as an “average” time methodology. The PRN tool does not directly capture the workload associated with activities that are not patient specific, however, the PRN value can be adjusted to account for indirect patient care. The PRN 80 values for indirect care time provided by Tilquin were included to determine the total hours of care patients required in the next 24 hour period (Tilquin, personal communications, August, 2003). Patient care workload for each study patient was also recorded from the unit workload tool. Hospital 2 used MEDICUS while all other study hospitals used GRASP. Both workload tools measure nursing hours including direct and indirect services related to patients. These values were compared to the PRN workload value adjusted for indirect patient care. In this study, GRASP or MEDICUS hours were collected daily for study patients and for the unit as a whole, including non-study patients as well. The GRASP methodology captures workload using a “standard time” methodology. Each site develops a list of tasks based on the activities they perform, and times are assigned to each of these tasks. The times are based on time and/or frequency or are established by staff nurse consensus. These times reflect the average time to complete the task, by an average nurse, on an average day, for an average patient in the individual facility. This reflects the physical and organizational characteristics of the individual facility. The MEDICUS system captures workload by multiplying a pre-set relative value per level of care by the target hours per unit of workload. Table 21 shows PRN patient care time (in minutes) by workload category. Total workload for each day is the sum of seven categories of activity including respiration, feeding and hydration, elimination, hygiene and comfort, communication, treatment, and diagnostic procedures. The average total PRN value for six hospitals was 274.5 minutes, or about 4.5 hours, for each patient day, with wide variations (SD=227.1). In descending order, average minutes for PRN activities are as follows: diagnostic procedures (109.0), treatment (48.6), hygiene and comfort (42.6), communication (32.4), respiration (16.6), feeding and hydration (15.1), and elimination (10.2). Hospital 1 averaged the most PRN minutes in total by category, except for diagnostic procedures. Hospital 3 averaged the fewest PRN in total and tended to rank low across categories.
Evidence-based Staffing 185
Table 21: Mean (SD) of PRN Workload (in Minutes) by Category, by Hospital Hospital Resp. Feed. &
Hyd. Elim. Hyg. &
Comfort Comm. Treat-
ment Diag. Proc.
Total
1 42.3 (48.4)
21.2 (8.7)
16.6 (12.5)
66.6 (39.5)
66.7 (18.8)
58.5 (40.1)
132.4 (89.2)
404.2 (179.6)
2 15.3 (17.2)
17.5 (12.2)
12.2 (12.2)
62.0 (39.4)
14.1 (11.2)
42.9 (43.2)
154.9 (156.4)
318.9 (238.3)
3 9.6 (15.0)
13.0 (9.1)
6.5 (10.1)
26.3 (28.2)
31.8 (21.9)
46.3 (50.1)
49.9 (95.6)
183.5 (179.8)
4 9.3 (15.8)
14.4 (9.7)
8.6 (11.0)
30.0 (31.0)
38.0 (14.1)
53.4 (37.2)
96.4 (139.7)
249.7 (213.2)
5 15.0 (25.3)
12.2 (7.5)
8.2 (12.0)
31.4 (26.1)
28.9 (11.6)
48.5 (51.8)
90.3 (149.3)
234.6 (239.2)
6 11.8 (24.6)
10.9 (8.6)
10.2 (11.8)
32.5 (26.9)
39.2 (13.8)
43.1 (32.6)
171.1 (143.8)
318.3 (201.2)
Total 16.6 (27.2)
15.1 (10.2)
10.2 (12.1)
42.6 (36.8)
32.4 (21.9)
48.6 (45.4)
109.0 (140.0)
274.5 (227.1)
Note: Overall means based on daily patient data. Table 22 shows the total PRN minutes accounted for by each workload category. Diagnostic procedures comprised almost one-third (31.1%) of the total PRN minutes, followed by treatment and communication as the second and third highest proportions. Activities related to respiration, feeding and hydration, and elimination accounted for the smallest proportion, less than five percent, of total PRN patient care. Large amounts of variation were observed across hospitals. Hospitals 6 and 2 had the highest proportion of diagnostic procedures, whereas Hospital 3 has the smallest proportion. The proportion of treatment time was much higher in Hospitals 3 and 4 (23.9%) than in other hospitals (14.5%-20.7%). Hygiene and comfort in Hospital 2 was much higher (23.0%) than in other hospitals (10.4%-16.4%). The proportion of time spent in communication with patients was extremely low in Hospital 2 (6.7% vs. 17.3%-23.6% for other hospitals).
Table 22: PRN Workload Category as Percent of Total PRN Workload, by Hospital Hospital Resp. Feed. &
Total 4.6 8.0 3.6 16.4 17.3 19.0 31.1 100.0Note: Differences by hospital are statistically significant at p<0.000 Table 23 demonstrates the gap between patient care time PRN and patient workload measured in GRASP or MEDICUS across hospitals. The PRN scores in the last column of Table 21 were adjusted for indirect care time using the method developed by Charles Tilquin. Workload measured by GRASP or MEDICUS was on average 1.6 hours greater than workload measured by PRN. Hospital 2, which used MEDICUS, showed the largest workload value (10.77 hours) among all hospitals. With a mean PRN value of 6.78 hours, Hospital 2 had the largest discrepancy (3.99 hours) with PRN. The discrepancy is also large for Hospital 4 (2.09 hours).
Evidence-based Staffing 186
Hospital 1 was high in both GRASP and PRN scores, with only a small discrepancy (0.63 hours). The GRASP values, which were generally higher than PRN, were lower for Hospital 3 (-0.56 hours).
Table 23: Comparison of PRN to GRASP/Medicus Workload (in Hours), by Hospital
WL(GM) PRN WL(GM)-PRN Hospital N Mean SD N Mean SD N Mean SD
Total 8113 7.54 6.08 7997 5.92 4.48 7997 1.60 4.12 Note: (1) WL(GM) stands for workload measured by GRASP (for Hospitals 1, 3, 4, 5, 6) or MEDICUS (for Hospital 2). (2) Based on overall means using daily patient data.
4.2 Workload Variation by Patient Medical Diagnosis The variation in the distribution of work across various sites may be due to variations in the mix of patients at each site. Table 24 presents the distribution of work by Case Mix Groups (CMG) in descending order of average PRN workload in minutes. This analysis shows that PRN workload varies significantly by CMG. The workload for CMG “Extensive Unrelated Operating Room Procedure” and CMG group “Major Cardio-thoracic Procedures Without Pump” was nearly 10 hours (>588.8 minutes), the highest among all CMGs, and six times the size of workload for “Cardiac Catheterization with Congestive Heart Failure” (1.5 hours or 90 minutes). Table 24 also showed that not all CMGs had the same percentage distribution of workload category as total workload. For example, diagnosis procedures had a much higher percentage for CMG “Acute Myocardial Infarction with Cardiac Catheterization with Congestive Heart Failure” than for others CMG subgroups.
Evid
ence
-bas
ed S
taffi
ng
18
7
Tabl
e 24
: Per
cent
Dis
trib
utio
n of
Wor
k (in
Min
utes
) by
Wor
kloa
d C
ateg
ory,
by
CM
G T
ype
Perc
enta
ge D
istr
ibut
ion
of W
orkl
oad
CM
G
N*
Ave
rage
T
otal
W
orkl
oad
Res
p Fe
ed &
H
yd
Elim
. H
yg &
C
omfo
rt
Com
m.
Tre
atm ent
Dia
g.
Proc
.
EXTN
SIV
E U
NR
EL O
R P
RO
CES
UD
RE
14
596.
1 17
.35
4.06
2.
23
21.1
1 12
.33
17.4
4 25
.48
MA
JOR
CA
RD
IO T
HO
RA
PR
OC
E W
O P
38
58
8.8
7.35
4.
71
2.99
18
.08
13.4
0 15
.42
38.0
5 O
THER
CA
RD
IOTO
RA
CIC
PR
OC
W P
U
22
411.
4 15
.10
4.79
2.
30
14.9
2 16
.62
17.3
8 28
.88
C V
ALV
E R
EPLA
CE
W P
UM
P W
O C
AR
74
7 38
9.9
8.57
5.
74
3.48
15
.57
15.6
4 21
.50
29.4
2 M
AJ C
AR
DIO
PR
NO
PU
MP
NO
CA
TH
704
361.
1 4.
72
7.04
3.
32
19.1
0 11
.35
19.1
3 35
.35
AM
I W C
AD
CA
TH W
CH
F 13
35
1.5
4.28
5.
94
4.36
17
.97
12.1
4 11
.17
44.1
5 C
BY
PASS
W P
UM
P W
CA
RD
CA
TH
848
344.
4 5.
57
6.72
3.
00
17.1
5 14
.19
18.8
5 34
.64
C B
YPA
SS W
PU
MP
WO
CA
RD
CA
TH
993
341
6.97
6.
52
3.32
15
.88
17.1
3 21
.94
28.2
5 C
AD
CA
TH W
VEN
TR F
IB
22
313
4.94
6.
41
4.44
17
.68
19.8
7 11
.39
35.2
8 A
THER
OSC
LER
OSI
S M
NR
H
3 31
0 2.
10
5.29
1.
22
11.6
1 31
.53
19.0
7 29
.18
CA
R V
ALV
E R
EPL
W P
UM
P W
CA
RD
17
1 30
7.1
6.91
6.
86
4.34
17
.13
14.4
7 20
.00
30.2
9 A
MI W
O C
AR
D C
W C
HF
158
273.
1 4.
82
8.26
6.
23
20.5
7 13
.12
15.5
3 31
.46
AM
I W C
AR
D C
ATH
NO
SPE
C C
ON
D
168
272.
6 2.
89
8.39
3.
53
15.4
8 15
.79
15.9
5 37
.97
PRO
CED
UR
E C
AN
CEL
LED
MN
RH
5
259
6.16
3.
41
0.00
9.
51
30.4
9 27
.08
23.3
4 PE
RR
IPH
ERA
L V
ASC
ULA
R D
ISEA
SE
3 25
6.7
5.88
9.
80
10.4
9 17
.23
19.9
7 10
.56
26.0
7 PT
CA
W C
AR
D C
OM
P
505
247.
4 3.
55
8.47
3.
49
14.6
6 17
.63
17.7
7 34
.43
UN
STA
BLE
AN
GIN
A W
O C
ATH
WO
SP
78
234.
7 3.
12
9.38
3.
93
17.6
0 14
.98
14.7
1 36
.26
AM
I NO
CA
RD
CA
TH N
O S
PEC
CO
ND
26
4 22
9.7
2.48
9.
70
6.20
22
.32
13.2
9 14
.75
31.3
9 PT
CA
WO
CA
RD
CA
TH
579
212
1.94
9.
03
3.15
12
.38
22.2
8 20
.93
30.3
7 U
NS
AN
GIN
A W
CA
TH W
SPE
C C
ON
D
13
209.
2 1.
92
8.08
2.
79
18.2
5 5.
76
10.4
0 52
.79
AM
I NO
CA
RD
CA
TH W
VEN
T TA
CH
19
20
7.6
3.17
9.
69
3.46
19
.43
15.4
9 15
.67
33.0
8 C
AR
D C
ATH
WO
SPE
CIF
IED
CO
ND
ITI
228
205.
7 2.
63
9.78
3.
07
13.5
2 28
.11
16.6
7 26
.22
PER
M P
AC
E IM
PL W
O S
PEC
CA
RD
C
545
200.
1 2.
12
8.65
4.
17
14.3
8 22
.28
20.4
0 28
.10
AN
GIN
A P
ECTO
RIS
13
19
1.5
4.15
8.
22
5.36
19
.88
13.2
1 12
.84
36.3
4 H
EAR
T FA
ILU
RE
324
191.
3 4.
63
10.6
2 4.
85
19.0
0 18
.06
17.5
7 24
.95
AM
I W C
AR
D C
ATH
WIT
H A
NG
INA
53
18
6.9
1.79
9.
70
3.99
17
.67
18.5
5 15
.70
32.6
0 PE
RM
PA
CEM
AK
ER IM
PLA
NT
W
206
184.
3 2.
37
8.61
2.
92
15.4
7 18
.22
19.3
5 33
.06
UN
S A
NG
INA
W C
ATH
NO
CR
D C
ON
D
70
176.
4 4.
14
10.0
8 2.
59
14.6
9 23
.02
21.3
5 24
.12
CA
RD
IAC
CA
TH W
CH
F 8
176.
3 5.
86
7.03
0.
71
18.9
3 24
.58
11.3
5 31
.54
AR
RY
THM
IA
281
174.
4 3.
31
9.49
2.
73
15.1
4 20
.72
15.6
2 33
.00
OTH
ER C
IRC
ULA
TOR
Y D
IAG
NO
SIS
250
169
3.45
10
.43
5.00
20
.21
16.8
9 17
.52
26.5
2 C
AR
DIA
C C
ATH
W S
ECIF
IED
CA
RD
18
9 16
6.1
2.39
9.
92
3.50
18
.07
17.5
0 18
.52
30.1
0 C
AR
DIA
C C
ATH
WIT
H V
ENT
TAC
H
90
160.
7 1.
32
10.6
4 1.
91
17.2
0 18
.54
15.5
2 34
.87
UN
STA
BLE
AN
GIN
A W
CA
RD
CA
TH W
13
3 15
8.1
3.52
10
.40
2.32
18
.85
16.5
5 19
.93
28.4
3 C
HES
T PA
IN
124
138.
8 3.
15
11.4
7 1.
64
14.7
4 26
.01
16.7
0 26
.29
SYN
CO
PE A
ND
CO
LLA
PSE
21
130
8.60
9.
40
0.72
14
.26
19.5
0 13
.43
34.0
8 R
ENA
L FA
ILU
RE
NO
DIA
LYSI
S 2
97.5
0.
00
12.0
4 0.
00
12.0
4 29
.17
6.02
40
.74
Tota
l 79
04
274
4.60
8.
06
3.55
16
.48
17.3
0 18
.99
31.0
2 N
ote:
(1) B
ased
on
patie
nt d
aily
ent
ry d
ata
for 1
,198
pat
ient
s. (2
) Dat
a ar
e so
rted
by A
vera
ge T
otal
Wor
kloa
d.
Evidence-based Staffing 188
4.3 Overtime and Continuity of Care/Shift Change and Unit Instability Table 25 shows the worked overtime hours in three categories by hospital (on average, 7% of the nurses worked more than 40 hours per week in their own hospital; see Table 34). Close to half of the nurses (45.1%) in all the hospitals reported either no overtime or less than one hour overtime per week. Another 32.2% worked 1-4 hours of overtime per week. The rest of the nurses (22.7%) worked greater than four hours overtime per week. Within the latter category, the highest and lowest proportions were achieved by Hospitals 6 (38.5%) and 4 (16.7%).
Table 25: Percent of Nurses Reporting Overtime in Average Hours per Week, by Hospital
Table 26 presents the percent change in overtime in the past year by unit type. Nurses were asked whether the amount of overtime required had increased, remained the same, or decreased in the past year. For most nurses (64.3%), overtime work increased. The CCU in Hospital 4 reported the highest proportion of no change in overtime hours. Nurses in Hospitals 4 and 5 more frequently reported decreases in overtime in the past year than the nurses in the other institutions.
Table 26: Percent Change of Nurse Overtime Hours in the Past Year, by Unit Type Unit Type N Increased Remained Same Decreased Hospital 1 CCU 28 64.3 32.1 3.6 IP 18 72.2 22.2 5.6 SDU 3 100.0 0.0 0.0 Hospital 2 CCU 97 62.9 36.1 1.0 IP 37 89.2 10.8 0.0 Hospital 3 CCU 31 54.8 38.7 6.5 IP 35 68.6 28.6 2.9 Hospital 4 CCU 27 18.5 63.0 18.5 DS 5 80.0 20.0 0.0 IP 23 39.1 47.8 13.0 Hospital 5 CCU 52 38.5 40.4 21.2 DS 29 69.0 27.6 3.4 IP 70 54.3 41.4 4.3 Hospital 6 CCU 58 75.9 24.1 0.0 IP 11 63.6 27.3 9.1 SDU 15 60.0 40.0 0.0 Total 539 64.3 32.1 3.6 Note: Significance test is not available because of small N in some of the cells. The DS unit in Hospital 4 also had a very low number of nurses reporting an increase in levels of overtime while the other units in the same hospital had high numbers reporting a decrease (Table
Evidence-based Staffing 189
26). These nurses were more likely (51.4%) to report an average of less than one hour of overtime as compared to other hospitals (Table 25). Table 27 contrasts the prevalence of unpaid overtime and involuntary overtime. Unpaid overtime includes both voluntary and involuntary; involuntary includes both paid and unpaid overtime. Hospital 4 reported the highest percentage of unpaid overtime but below average involuntary overtime. Overtime may not by itself be a contributing factor to high stress levels, but rather the involuntary nature of overtime in some organizations may lead to high levels of stress. Some nurses choose to work overtime and therefore overtime may not be a source of stress. However, we hypothesize that when overtime is involuntary in nature it may serve as a source of stress.
Table 27: Percent of Overtime Unpaid or Involuntary, if Working Overtime, by Hospital
Total 383 26.7 22.8 Continuity of care was operationalized as the proportion of shift changes more frequent than once in the last two weeks as well as the proportion of nurses forced to change units in the past year and of those who anticipated forced changes in their unit in the coming year (Table 28). Nurses in Hospital 5 experienced higher levels of forced change in the last year, but Hospital 1 had the highest percentage anticipating a change in the next year. The nurses in Hospital 5 also reported the highest number of shift changes per week. Nurses who were forced to change unit in the past year had a higher nurse-patient ratio than nurses not experiencing a forced unit change (F=12.7, p<0.001). The proportion of shift changes and anticipation of forced changes in unit was associated with emotional exhaustion (measured by Maslach’s Burnout Inventory). Those who anticipated forced change of unit were more likely to rank high on the emotional exhaustion index (thus not healthy) than those who did not anticipated forced change of unit (F=8.7, p<0.01).
Table 28: Continuity of Care and Amount of Change, by Hospital
Hospital 1 2 3 4 5 6 Total % More than 1 shift change in the past 2 weeks 36.2 36.3 17.6 30.2 41.3 18.5 32.4N 58 182 74 86 206 108 714% Forced to change nursing units in the past year 10.3 8.7 0.0 2.4 13.8 4.5 8.0N 58 184 74 85 210 111 722% Anticipating forced change of unit 24.6 14.1 6.8 7.1 20.8 17.0 15.7N 57 184 73 85 207 112 718
Evidence-based Staffing 190
4.4 Non-Nursing Tasks Despite the nurse’s reports of poor quality nursing care and the high percentage of nurses reporting that essential nursing tasks are not being completed or are delayed, nurses continue to report a high volume of tasks that could be delegated to non-nursing personnel. Table 29 shows how likely a nurse is to perform these tasks. Among eight non-nursing tasks listed in Table 29, nurses more likely reported “ancillary service,” “venipunctures,” “housekeeping”, “delivering trays,” and “starting IVs.” Each hospital varied in which tasks were more likely to be performed by the nurse. Hospital 1 had the largest proportion of nurses who reported “delivering trays”, “venipunctures,” and “performing ECGs.” Hospital 2 was more likely to mention “transporting patients” than the others. Hospital 3 had the largest proportion reporting “housekeeping” and “arranging transportation.” Hospital 5 was most likely to report “starting IVs.” Hospital 6 had the largest proportion reporting “ancillary service.”
Table 29: Percent of Nurses Reporting Performing Non-Nursing Tasks for Items in the Table, by Hospital
Non nursing tasks 1 2 3 4 5 6 Total Number of Cases 58 184 73 86 210 111 722 Ancillary service 87.9 82.6 90.4 89.5 74.3 91.0 83.5 Venipunctures 82.8 72.3 11.0 64.0 73.8 62.2 64.8 Delivering trays 72.4 34.2 54.8 51.2 65.2 64.9 55.1 Housekeeping 63.8 44.6 87.7 47.7 64.3 35.1 55.1 Starting IVs 67.2 17.4 63.0 62.8 71.0 43.2 51.0 Performing ECGs 51.7 15.8 9.6 37.2 50.0 48.6 35.6 Transporting patients 22.4 42.4 24.7 20.9 26.2 36.0 30.7 Arranging transportation 32.8 27.2 38.4 30.2 23.3 31.5 28.7 Note: Non-nursing tasks are sorted by percent in the Total column 5. Intermediate System Outputs Staffing information was collected by the site data collectors for each day of the study and for each nursing unit. Data were collected by shift, by skill level, and by employment status. Data about unit staffing, patient census, and unit daily workload are displayed in Tables 30-34.
5.1 Worked Hours Table 30 shows that the actual staffing hours varied from hospital to hospital and from unit to unit. In general, CCUs had a higher average daily worked hours and workload with the highest for CCU in Hospital 3 (329.3) and lowest (88.0) for the DS unit in Hospital 4. The IP unit in Hospital 4 averaged the highest number of agency worked hours (23.9). In contrast, Hospital 3 used no agency worked hours. The SDU in Hospital 6 averaged the highest number of overtime hours (6.7) and absent hours (27.4).
Evidence-based Staffing 191
Table 30: Actual Staffing Hours, by Unit, by Day
Worked Hours All
Staff
Agency Worked Hours
Overtime Hours
Absent Hours
All GRASP Workload
Unit Type
N Mean (A)
N Mean (B)
N Mean (C)
N Mean (D)
N Mean (E)
Hospital 1 CCU 87 146.4 87 3.2 87 4.4 87 14.7 79 148.1 IP 117 160.2 117 3.5 117 1.4 117 8.4 103 149.6 SDU 87 104.9 87 0.0 87 1.3 87 5.4 81 101.1 Hospital 2 CCU 227 298.4 227 0.9 227 0.3 228 12.7 228 300.8 IP 122 206.0 122 5.2 122 0.8 122 9.1 122 213.5 Hospital 3 CCU 108 329.3 108 0.0 108 0.4 108 9.9 107 299.1 IP 112 264.5 112 0.0 112 5.4 112 5.6 112 200.7 Hospital 4 CCU 219 284.4 219 0.1 219 0.4 219 9.4 217 252.4 DS 109 88.0 109 0.1 110 0.1 109 4.8 107 77.2 IP 220 249.1 220 23.9 220 0.6 220 9.2 217 272.3 Hospital 5 CCU 200 203.5 200 0.1 200 2.7 200 7.4 200 171.9 DS 101 134.5 101 0.1 101 1.4 101 6.9 100 115.1 IP 229 143.4 228 2.3 228 0.7 229 6.3 226 141.0 Hospital 6 CCU 142 141.9 142 1.5 142 4.7 142 13.9 140 90.1 IP 62 136.2 62 1.7 62 3.6 62 13.2 60 88.6 SDU 19 222.9 18 7.6 18 6.7 18 27.4 19 107.1 Total 2161 206.1 2159 3.6 2160 1.6 2161 9.2 2118 190.9 Note: (1) N is the number of unit days. (2) Letters A, B, C, D, and E will be used in the following table. (3) GRASP hours are MEDICUS hours for Hospital 2. (3) Agency worked hours includes hours worked by agency nurses and/or agency non-nursing staff (e.g., sitters). The hospital workload measure, agency worked hours, overtime worked hours, and absent hours as a percent (or ratio) of total worked hours are displayed in Table 31. The hospital workload measure averaged 92.6% of total worked hours across all units and hospitals. Of 16 hospital units, four had ratios over 100% and three had ratios over 93%. Hospital 6 has the lowest ratio for all unit types (less than 65%). Units in Hospital 6, on the other hand, reported more overtime hours and absent hours than other units. Agency hours comprised 9.6% of worked hours on Hospital 4’s IP unit as compared to 3.4% or less for other units.
Evidence-based Staffing 192
Table 31: Percent of Actual Staffing, by Unit, by Day
WL(GM)/WH Agency/WH Overtime/WH Absent/WH Unit Type (E/A) (B/A) (C/A) (D/A)
Hospital 1 CCU 101.2 2.2 3.0 10.0 IP 93.4 2.2 0.9 5.2 SDU 96.4 0.0 1.2 5.1 Hospital 2 CCU 100.8 0.3 0.1 4.3 IP 103.6 2.5 0.4 4.4 Hospital 3 CCU 90.8 0.0 0.1 3.0 IP 75.9 0.0 2.0 2.1 Hospital 4 CCU 88.7 0.0 0.1 3.3 DS 87.7 0.1 0.1 5.5 IP 109.3 9.6 0.2 3.7 Hospital 5 CCU 84.5 0.0 1.3 3.6 DS 85.6 0.1 1.0 5.1 IP 98.3 1.6 0.5 4.4 Hospital 6 CCU 63.5 1.1 3.3 9.8 IP 65.1 1.2 2.6 9.7 SDU 48.0 3.4 3.0 12.3 Total 92.6 1.7 0.8 4.5
Notes: (1) WH denotes worked hours. (2) See Table 30 for designations of A-E. (3) Agency worked hours includes hours worked by agency nurses and/or agency non-nursing staff (e.g., sitters). As shown in Table 32, the overall daily averages per unit were 19.8 patients on census, 6.1 admissions, and 6.1 discharges. Patient census, daily admission, and daily discharge, however, varied greatly by unit type and by hospital. For all hospitals, IP units averaged the most patients, ranging from 15.5 to 49.7 patients per day, and the most admissions and discharges, except in the case of DS units. The IP unit in Hospital 3 averaged the highest number of patients, admissions, and discharges per day. The IP unit for Hospital 2 also tended to average a higher number of patients. The lowest and highest mean censuses were found in Hospitals 1 and 3 respectively.
Evidence-based Staffing 193
Table 32: Daily Patient Census, Admissions, and Discharges, by Unit
Midnight Census Daily Admissions Daily DischargesUnit Type N Mean N Mean N Mean
5.2 Productivity/Utilization Nursing unit productivity/utilization is measured as the ratio of GRASP/Medicus workload hours to worked hours. The maximum work capacity of any employee is 93%. Seven percent of worked hours are allocated to paid breaks during which time no workload is contractually expected. At 93% nurses are working flat out with no flexibility to meet unanticipated demands or rapidly changing patient acuity. This study hypothesized that a value of 85% is an appropriate productivity/utilization level to ensure high quality cost effective care. As shown in Table 33, in a large proportion of units, nurses were working beyond 93% productivity/utilization levels. On 61.5% of the study days, productivity/utilization levels were higher than 85%. Generally, IP units had higher productivity/utilization levels than CCUs, SDUs, and DS units. This finding is not unexpected since these units must staff differently to monitor patients. The productivity/utilization levels were lowest in Hospital 6. On 46.5% of the study days, productivity/utilization levels were higher than 93%. CCUs in Hospitals 1, 3, and 6 as well as IP units in Hospitals 2, 4, and 5 were most frequently above 93% productivity/utilization levels within their respective organizations.
Evidence-based Staffing 194
Table 33: Number of Days When Unit GRASP/Medicus is Greater than 85% and 93% of Total Nurse Hours, by Unit Unit Type Number of Days
Reported % Days with WL(GM)
> 85% of Total Nursing Hours
% Days with WL(GM) > 93% of
Total Nursing Hours Hospital 1 CCU 79 79.7 62.0 IP 103 63.1 49.5 SDU 81 67.9 58.0 Hospital 2 CCU 225 60.0 51.1 IP 121 99.2 90.1 Hospital 3 CCU 107 60.7 48.6 IP 112 29.5 11.6 Hospital 4 CCU 216 67.1 35.2 DS 99 48.5 34.3 IP 216 96.8 88.0 Hospital 5 CCU 199 41.2 21.6 DS 100 51.0 37.0 IP 226 86.7 63.7 Hospital 6 CCU 140 13.6 9.3 IP 60 10.0 8.3 SDU 19 5.3 0.0 Total 2103 61.5 46.5 Note: (1) WL(GM) stands for workload measured as GRASP (in Hospital 1, 3, 4, 5, 6) or Medicus (in Hospital 2). (2) Differences by unit are statistically significant (χ2=744.9, df=23, p<0.01) Table 34 displays worked hours of nurses in the study hospital and in other employment. Nearly two thirds of surveyed nurses worked between 31 to 40 hours a week in the past year, which is typical of full-time employee work time. One quarter of surveyed nurses reported working hours between 21 and 30 hours. On average, only 3.8% of nurses worked less than 20 hours a week. In addition, 7% of nurses averaged over 40 worked hours per week. Nearly one in four nurses (22.5%) reported paid work outside the study hospital. Hospital 1 had the highest proportion of nurses working full-time (71.9%), whereas the proportion of nurses working part-time (i.e., less than 30 work hours per week) was highest in Hospital 2 (35.8%) and 5 (38.0%). Hospital 2 also had a relatively high proportion of nurses (8.4%) working less than 20 hours weekly in the study hospital. Nurses in Hospitals 3 and 4 are vulnerable to strenuous work conditions: nearly one in nine (11.8%) nurses in Hospital 3, and one in six (15.9%) nurses in Hospital 4 worked the most overtime. In addition, nurses in Hospital 4 were most likely to hold paid employment outside the study hospital. Some of this variation may be due to the available supply of employment opportunities in individual locations.
Evidence-based Staffing 195
Table 34: Percent of Nurses Reporting Average Hours Worked Per Week in the Past Year, by Hospital
Total 705 3.8 26.4 62.3 7.0 186 22.5 6. Environmental Complexity The Environmental Complexity Scale (ECS) captures nurses’ ratings of how daily unit factors influence their ability to provide required care for patients. Twenty-two ECS items were administered daily to all nurses working day shift on participating study units. Missing data were imputed using individual and unit means. Three subscales were constructed to capture different dimensions of nurses’ work complexity: (1) Re-Sequencing of Work in Response to Others; (2) Unanticipated Changes in Patient Acuity; and, (3) Composition and Characteristics of the Care Team which considers students, staffing, and nurse team functioning. The values range between 0 and 10. As shown in Table 35, the means for the three subscales (resequence, change, team) were 6.1 (SD=0.88), 6.5 (SD=1.04), and 5.7 (SD=1.06), respectively, for all study hospitals. The differences by unit for all subscales are statistically significant at p<0.001, but there are no clear patterns by hospital or by unit type.
Evidence-based Staffing 196
Table 35: Mean of Three Subscales from ECS, by Hospital
Resequence Change Team Unit Type N* Mean SD Mean SD Mean SD
Hospital 1 CCU 519 5.9 0.75 6.6 1.17 5.8 1.14 IP 765 6.0 1.32 6.5 1.46 6.1 1.64 SDU 355 5.5 0.65 6.3 1.13 5.5 0.93 Hospital 2 CCU 2574 5.6 0.72 6.2 0.98 5.5 0.99 IP 1035 5.8 0.74 6.2 0.98 5.3 0.76 Hospital 3 CCU 438 6.1 0.97 6.7 1.26 5.3 0.81 IP 627 6.3 0.92 6.8 1.17 5.8 1.28 Hospital 4 CCU 531 5.7 0.92 6.7 1.18 5.6 1.58 DS 102 5.9 1.04 6.0 0.98 5.3 0.49 IP 242 6.1 0.81 6.9 1.05 6.3 1.02 Hospital 5 CCU 1673 6.8 0.52 6.7 0.77 5.7 0.46 DS 621 6.6 0.74 6.6 1.01 5.9 0.38 IP 1732 6.4 0.76 6.5 0.94 5.3 0.73 Hospital 6 CCU 827 6.3 0.66 6.7 0.80 6.6 1.09 IP 384 6.3 0.49 6.8 0.68 6.7 1.01 SDU 202 6.1 0.73 6.6 1.05 6.4 1.42 Total 12627 6.1 0.88 6.5 1.04 5.7 1.06 *N=Number of day entries by nurses. On average, 42.9% nurses on study units needed more time on their shift to provide the level of patient care specified in the nursing care plan. These results are presented by hospital unit in Table 36.
Table 36: Percent of Nurses Reporting Additional Time Needed to Provide Quality of Care, by Hospital Unit Unit Type
N*
no more time
needed % <15
min. % 15-30
min. % 31-45
min. % 46-60
min. % >60
min. Hospital 1 CCU 475 31.6 11.2 18.5 13.9 13.9 10.9 IP 702 28.5 15.8 27.4 14.1 7.0 7.3 SDU 304 30.3 5.3 28.6 13.8 9.2 12.8 Hospital 2 CCU 1976 60.7 5.1 12.9 7.9 6.1 7.3 IP 889 46.2 8.8 20.4 11.9 5.6 7.1 Hospital 3 CCU 393 49.6 7.9 16.0 8.9 9.2 8.4 IP 553 25.7 14.1 27.5 14.6 9.2 8.9 Hospital 4 CCU 478 55.9 5.0 12.8 8.4 9.0 9.0 DS 96 33.3 11.5 34.4 7.3 5.2 8.3 IP 217 27.6 3.7 21.2 17.1 14.7 15.7 Hospital 5 CCU 1655 85.1 0.8 6.3 3.3 3.3 1.2 DS 612 78.4 1.1 8.3 5.9 3.9 2.3 IP 1677 71.8 2.1 11.6 4.9 5.2 4.4 Hospital 6 CCU 576 51.9 3.3 16.3 13.0 8.3 7.1 IP 250 51.6 6.8 20.0 12.8 5.6 3.2 SDU 175 13.7 11.4 27.4 21.7 12.6 13.1 Total 11028 57.1 5.6 15.4 8.9 6.6 6.3 *N=Number of day entries by nurses.
Evidence-based Staffing 197
7. Patient Outcomes Patient outcomes in this section include medical consequences (from the Patient Data Form) and patient health status change (from the Patient SF-12 Health Status Survey).
7.1 Medical Consequences Data on medical consequences were collected by data collection staff via health records, who recorded the number of negative events and medical complications patients experienced during their hospital stay. Negative events included an unexpected return to the Intensive Care Unit (ICU), a fall with injury, a readmission within three months, and a recorded complication in the health record. Medical complications tracked included urinary tract infection, pneumonia, deep or superficial surgical wound infection, bedsore, and thrombosis. As shown in Table 37, medical consequences were rare for all six hospitals, although these tended to be somewhat higher for Hospitals 4 and 2 than for other hospitals. Hospital 4 had the highest incidences of medical complications. No hospitals reported medical errors with patient consequences except for Hospital 1 (one case reported). Nearly one-third (32%) of patients have been hospitalized for the same condition in the past 3 months. The readmission rate is the highest in Hospital 1 (39%) and lowest in Hospital 6 (12%), where the nurses had low workload to worked hours ratio. In addition, Hospital 1 reported higher incidences in “returned to ICU post-op” than other hospitals.
Table 37: Medical Consequences – Percent Reporting Yes to the Items in the Table, by Hospital
Admitted in past week with same diagnosis 1.6 1.6 1.2 6.0 0.4 1.9 1.6
Hospitalized for the same condition in the past 3 months
38.6
36.7
29.3
31.7
30.6
12.3
32.0
Evidence-based Staffing 198
7.2 OMAHA Scores at Discharge and Change from Admission Patient OMAHA scores at admission (or appearance of new diagnosis) were presented earlier in Table 12. Table 38 shows the mean OMAHA scores at time 2. For all study patients, the means were 3.8 (SD=0.67) for knowledge, 4.2 (SD=0.52) for behaviour, and 4.1 (SD=0.62) for status. Patients from Hospital 2 had the highest scores across all three dimensions. Patients from Hospital 1 ranked low for all dimensions at time 2, probably due to low scores at admission.
Table 38: OMAHA Scores at Time 2 (Resolution of Diagnosis or at Discharge), by Hospital
Knowledge Behaviour Status Hospital N Mean SD Mean SD Mean SD
Total 1189 3.8 0.67 4.2 0.52 4.1 0.62 Table 39 shows the mean change scores for each hospital for knowledge, behaviour, and status between time 1 (at admission or appearance of new diagnosis) and time 2 (at discharge or resolution of diagnosis).
Table 39: Differences in OMAHA Scores Between Time 1 and Time 2, by Hospital
Knowledge Behaviour Status Hospital N Mean SD Mean SD Mean SD
7.3 Health Status at Discharge and Change from Admission Patient physical and mental functional status at admission was presented earlier in Tables 13 and 14. Tables 40 and 41 show the changes in patient functional status from admission to discharge. As can be seen, more than 40% of patients had improved physical and mental health at discharge (41% for physical health and 42% for mental health) and about 45% of patients had physical and mental scores at discharge lower than at admission. For patients who reported an improvement in health, Hospital 1 had the highest change score among all hospitals (9.39 for physical health and 10.81 for mental health). For patients who had a decrease in the score, Hospital 3 had the smallest change (-7.37 for physical health and -4.53 for mental health).
Evidence-based Staffing 199
Table 40: Change in Patient Physical Health Status (SF-12) from Admission to Discharge
All hospitals 426 7.94 (7.64) 453 -7.93 (6.97) 129 Percent 42.3% 44.9% 12.8% 8. Nurse Outcomes This section presents results related to nurse burnout, job satisfaction, absenteeism, and intent to leave.
8.1 Burnout and Effort & Reward Imbalance Maslach’s Burnout Inventory (MBI) and the Effort-Reward Imbalance (ERI) questionnaire were included in the Nurse Survey to measure burnout. The MBI is a 22-item scale with three subscales: emotional exhaustion (EE), depersonalization (DP) and personal accomplishment (PA). A seven point categorical scale ranging from “never,” “a few times a year or less” to “everyday” is used to examine nurse’s feelings about their work and patients. Items are split amongst the EE (9 items), DP (5 items), and PA (8 items) subscales. Table 42 displays the means and standard deviations. The highest MBI subscale scores amongst Hospitals 3, 1, and 5 were associated with the three highest proportions of nurses who ranked below the US norms for mental health for females (Table 48). Table 42 shows nurses who worked at Hospital 3 averaged the worst job-related feelings of emotional exhaustion, while those at Hospital 1 scored highest on depersonalization aspects. The
Evidence-based Staffing 200
nurses who worked at Hospital 5 were least likely to claim that they had personal accomplishments.
Table 42: Burnout – Mean Scores of MBI Subscales, by Hospital
Total 689 22.7 10.5 697 6.0 5.2 677 12.2 6.8Note: EE=Emotional Exhaustion Index DP=Depersonalization Index PA=Personal Accomplishment Index Difference by hospital is statistically significant at p<0.05 for all three subscales. The Effort-Reward Imbalance (ERI) scale, a 17-item scale that measures the balance between nurses’ efforts and their rewards, was also used to assess burnout. The ERI uses a four point scale to measure the extent of stress, from “I am not at all distressed” to “I am very distressed.” The greater the ERI score, the greater the individual’s distress. To determine which proportions of nurses were at risk for ERI or MBI emotional exhaustion, the ERI and MBI (EE) variables were dichotomized. The ERI already has values of 0 or 1, while the MBI (EE) was dichotomized using values greater than 27 as per instrument guidelines. The proportion of nurses at risk is displayed in Table 43. Nurses in Hospital 3 were most at risk for emotional exhaustion (43.7% vs. 22.2%-36.2%). These results are consistent with the MBI EE scores in Table 42, as well as the mental health data in Table 48 where Hospital 3 had the largest proportion of nurses whose mental health was below the US population norm. Nurses in Hospital 3 were also more likely to feel imbalances in effort and reward than nurses in other hospitals (25.8% vs. 10%-22%).
Table 43: Burnout – Percent of Nurses at Risk for Emotional Exhaustion and ERI, by Hospital
Total 689 29.9 577 18 Note: ERI=Effort-Reward Imbalance (>1, at risk) MBI_EE=Maslach’s Burnout Inventory-Emotional Exhaustion (>27, at risk) Difference by hospital is not significant (χ2=6.8, df=5, p>.05)
Evidence-based Staffing 201
8.2 Autonomy and Control Table 44 shows the subscale response from the Revised Nursing Work Index (R-NWI). The NWI measures nurses’ job satisfaction and perception of quality of care. For each of the 41 items in the survey, the nurses responded on a 4-point forced choice Likert scale, with choice ranging from 1=strongly disagree to 4=strongly agree. No neutral response options are provided. Five subscales were created and listed by hospital. Higher scores reflect better working conditions and job satisfaction. Hospital 4 showed the best scores for all five subscales: autonomy, control over patient care, nurse-physician (NP) relationship, leadership, and resources available.
Table 44: Nurse Work Index Subscales, by Hospital
Autonomy Control NP Relation Leadership Resource Hospital N Mean
(SD) N Mean
(SD) N Mean
(SD) N Mean
(SD) N Mean
(SD) 1 55 16.2
(3.28) 58 17.0
(3.31) 59 7.4
(2.15) 52 28.2
(5.54) 58 9.7
(1.44) 2 173 16.4
(2.83) 181 18.5
(3.71) 182 8.6
(1.76) 167 30.1
(5.72) 184 10.2
(1.37) 3 69 15.2
(3.23) 73 18.1
(3.80) 73 8.1
(2.01) 69 28.7
(5.32) 73 9.5
(1.57) 4 81 17.6
(3.06) 83 20.6
(4.22) 85 9.2
(1.86) 79 32.7
(6.26) 84 10.4
(1.74) 5 203 15.6
(3.11) 204 19.0
(3.98) 208 8.1
(1.99) 201 27.5
(5.65) 206 10.0
(1.51) 6 101 14.7
(3.18) 108 17.5
(3.42) 110 8.4
(1.92) 104 26.2
(6.26) 108 9.9
(1.34) Total 682 15.9
(3.18) 707 18.6
(3.81) 717 8.4
(1.97) 672 28.8
(6.09) 713 10.0
(1.49) Note: Difference by hospital is statistically different at p<0.002 for all nurse work indices.
8.3 Job Satisfaction Table 45 shows the percent of dissatisfied nurses for each hospital. On average, 17.0% of the nurses were dissatisfied with their current jobs. Variation in dissatisfaction in present job across hospitals was minimal with the exceptions of Hospitals 1 (28.9%) and 4 (9.3%). Satisfaction with current job was only moderately correlated with satisfaction of being a nurse (r=0.474, p<0.001). In five hospitals, 37.6-49.0% of the nurses were dissatisfied with their opportunities to interact with management. The one notable exception was Hospital 6 with over 63% of nurses reporting this issue. In four of the six hospitals only 15.3-22.7% of nurses were dissatisfied with the amount of responsibility. Hospitals 1 and 3 reported notably higher scores at 43.9% and 42.3% respectively. In five hospitals, 11.0-15.1% of nurses were dissatisfied with opportunities for social contact at work and 19.2-27.9% with opportunities for social contact after work. The one exception was Hospital 2 where nurses appeared more satisfied with social opportunities.
Evidence-based Staffing 202
Table 45: Job Satisfaction – Percent of Nurses Dissatisfied, by Hospital
Hospital 1 2 3 4 5 6 Total Opportunities to interact w/ Mgmt 40.4 37.9 40.8 37.6 49.0 63.6 45.5
Amount of Responsibility 43.9 18.7 42.3 15.3 19.8 22.7 23.6
Social Contact - after work 26.3 16.6 19.2 27.9 20.2 22.0 20.9
Social Contact - work 12.3 4.9 13.9 15.1 11.0 13.6 10.7
Number of Cases 57 181 73 86 208 109 714
Note: (1) Items are sorted by percent in the Total column. (2) Number of valid responses varied slightly from item to item.
8.4 Health Status Table 47 shows the physical and mental health levels for nurses in each of the hospitals as measured by the SF-12. The average physical health score for nurses was 50.1, slightly above the US norm for females in the general population (49.11). However, the average mental health score (47.3) was below the US female norm (49.42). Hospital 4 had the highest mean physical health scores (53.0), and Hospital 6 had a slightly better mean mental health score than those of others hospitals (48.2). Since the SF-12 questionnaire was completed by both patients and nurses, comparisons are possible. The overall average mental health score for nurses (47.3) was lower than the average scores for patients, either at admission (48.2) or discharge (48.1) as noted in Tables 13 and 15.
Table 46: Nurse Health Status, by Hospital
Physical Health Scale Mental Health Scale Hospital N Mean SD Range Mean SD Range
Total 699 50.1 8.5 15.3-65.4 47.3 10.4 16.3-64.1 Table 48 gives the proportion of nurses in each hospital that scored below the norm for females in the general US population, and thus was not considered healthy. Only 34.8% of nurses scored below the population norm, indicating that, in general, nurses are physically healthier than the general US female population. Nearly half of nurses (49.2%) were categorized as not mentally
Evidence-based Staffing 203
healthy, which was comparable to the categorization of patients at admission (49.2%) and discharge (51.9%) as noted in Tables 14 and 16.
Table 47: Nurse Health Status, Percent of SF-12 Scores Less than US Norm for Females, by Hospital
Total 699 34.8 49.2 Norm for Female3 Physically not healthy: Physical Health Scale < 49.11 Mentally not healthy: Mental Health Scale < 49.42
8.5 Violence at Work Table 49 presents the prevalence of violence and abuse towards nurses. Among 720 nurses completing the survey, 24.9% experienced emotional abuse, 13.6% experienced the threat of assault, and 10.2% experienced physical assault. Hospital 6 reported the highest proportion of emotional abuse and threats of assault. Hospital 1 reported the highest percentage of physical assaults. The smallest proportion of nurses who reported emotional abuse and threats of assault were in Hospital 4. More than 97% of physical assault or threats of assault were from patients (data not shown).
Table 48: Prevalence of Violence – Percent of Nurses Reporting Yes to the Items in the Table, by Hospital
Hospital 1 2 3 4 5 6 TotalPhysical Assault 3.4 10.8 11.0 2.4 13.8 11.8 10.2Threats of Assault 8.5 15.7 13.9 5.9 13.9 18.2 13.6Emotional Abuse 25.4 17.4 27.4 25.9 26.8 30.9 24.9Number of cases 59 184 73 85 209 110 720Note: Statistically significant for physical assault (χ2=12.1, df=5, p<0.05), but not for threat assault or emotional abuse. The sources of emotional abuse varied as evidenced in Table 50. The major source of emotional abuse was from patients (31.1%), followed by abuse from other nurses (21.5%), and then from physicians or patients’ families.
9.1 Quality of Care Table 53 presents the quality of care and likelihood that tasks are delayed or accomplished. Quality of nursing care is shown as the percent of nurses reporting “fair/poor care delivered” to patients; quality of patient care is shown as the percent of nurses reporting “quality of care deteriorated.” Hospital 1 reports an overall high level of tasks not done or delayed whereas Hospital 4 tends to report low levels in almost all categories. When faced with a shortage of time, different decisions appear to be made about which tasks can be left undone or delayed. Nurses are more likely to complete tasks that are ordered by physicians such as vital signs, medication, and dressings. We hypothesize that delayed actions can also have negative consequences in terms of patient clinical outcomes, patient satisfaction, and system costs.
Evidence-based Staffing 205
Table 50: Quality Issues – Percent of Nurses Reporting Yes to Items in the Table, by Hospital
Hospital 1 2 3 4 5 6 Total Quality of Care Number of Cases 56 182 73 85 209 109 714Nursing Care: Fair/Poor Care Delivered 31.0 10.9 20.5 10.6 8.1 15.5 13.4Patient Care: Quality of Care Deteriorated 58.9 40.1 61.6 15.3 39.7 47.7 41.9Not Done Number of Cases 58 184 73 86 210 111 722Care Plan* 84.6 64.9 57.6 37.6 42.9 51.8 48.2Comforting/Talking 62.1 34.8 45.2 25.6 35.7 44.1 38.6Back/Skin Care 43.1 27.2 31.5 23.3 32.9 36.0 31.4Oral Hygiene 60.3 41.8 31.5 12.8 17.1 22.5 28.7Pt/Family Teaching 46.6 18.6 26.0 18.6 20.0 27.0 23.3Documentation 42.1 31.5 28.8 15.1 11.4 20.7 22.6Mobilization/Turns 19.0 13.0 13.7 9.3 6.2 27.0 13.3Discharge Prep 25.9 13.7 12.3 7.0 10.5 4.5 11.4VS/Meds/Dressings 6.9 5.4 2.7 3.5 1.0 7.2 4.0Mean # Tasks Not Done 3.19 1.97 2.35 1.52 1.78 2.38 2.06Delayed Number of Cases 58 184 73 86 210 111 722VS/Meds/Dressings 51.7 40.8 47.9 24.4 28.6 43.2 37.3Mobilization/Turns 17.2 40.2 35.6 20.9 27.1 31.5 30.5Call bell Response 53.4 20.7 30.1 19.8 25.2 23.4 25.9PRN pain meds 37.9 13.9 31.5 14.0 9.0 17.1 16.6# Tasks Delayed 1.58 1.14 1.43 .79 .90 1.14 1.09*For care plan, the valid number of cases is low for Hospitals 1 (N=13), 2 (N=37) and 3 (N=59). Note: Items are sorted by percent in the Total column
9.1 Absenteeism The Nurse Survey asked: “In the past year: a) On how many occasions (episodes) have you missed work due to illness/disability? b) How many shifts have been missed due to illness/disability?” Table 51 shows that the total number of missed work episodes from the six survey hospitals was 1,768. Individual nurses missed from 1 to 56 episodes (data not shown). Of the 683 nurses who reported missed occasions in the past year, 42.9% missed 1-2 episodes, 25.2% missed 3-4 episodes, and 15.5% missed more than four episodes. Another 16% indicated nil work episodes missed. Once the number of episodes was grouped into four categories, the pattern of distribution varied amongst hospitals. Hospitals 6, 2, 3, and 1 had the largest proportions in order of ascending categories from “0 episodes” to “>4 episodes”. On average, Hospital 6 averaged the highest missed shifts per episode (3.71; SD=7.7) shifts.
Evidence-based Staffing 206
Table 51: Absenteeism – Percent of Episodes Absent and Mean Shifts per Episode in the Past Year, by Hospital
Total 1768 683 16.4 42.9 25.2 15.5 547 2.42 (4.85) Table 52 presents the common reasons for nurse absenteeism. The primary reason was physical illness (71.4%). Other reasons were mental health days and injury. Nurses at Hospitals 2 and 3 indicated physical illness most frequently, while Hospital 1 nurses tended to report mental health day, injury, and other.
Table 52: Absenteeism – Most Common Reason to Miss Work in the Past Year, by Hospital
9.2 Intent to Leave Table 46 shows the percent of nurses who expected to lose their job or intended to leave within the next 6 months. Hospital 1 nurses not only reported the highest levels of dissatisfaction with their current job (Table 45), but also the highest levels of intent to leave. Surprisingly, nurses in this hospital were most likely to expect difficulties in finding a new job. Hospital 5 had the highest percent of nurses expecting to lose their jobs, while not a single nurse in Hospital 1 expected to lose theirs in the next 12 months.
Table 53: Intent to Leave – Percent of Nurses Reporting Yes to the Items in the Table, by Hospital
Hospital 1 2 3 4 5 6 Total Number of Cases 58 186 74 86 207 110 721 Expect to lose job 0 1.6 2.7 3.5 12.1 5.5 5.4 Plan to Leave – 6 months 10.3 3.8 6.8 3.5 5.3 3.6 5.0 Difficult finding job 14.0 1.6 2.8 2.3 10.6 3.6 5.7
Evidence-based Staffing 207
References 1. Karasek, R. & Theorell, T. (1990). Healthy Work: Stress, Productivity, and the Reconstruction
of Working Life. New York: Basic Books, Inc., Publishers. 2. Martin, K. S., & Scheet, N. J. (1992). The OMAHA System: Application for Community Health
Nursing. Philadelphia, PA: WB Saunders. 3. Ware, J., Kosinski, M. & Keller, S. (2002). SF-12: How to Score the SF-12 Physical and
Mental Health Summary Scales. Fourth Edition, QualityMetric Incorporated, Lincoln, Rhode Island, and Health Assessment Lab, Boston, Massachusetts.
4. Canadian Institute for Health Information. (2003). Workforce Trends of Registered Nurses in Canada, 2002. Ottawa, ON: Author.
5. O’Brien-Pallas, L., Thomson, D., Alksnis, C., Luba, M., Pagniello, A., Ray, K. L., & Meyer, R. (2003). Stepping to Success and Sustainability: An Analysis of Ontario's Nursing Workforce. Toronto, ON: Nursing Effectiveness, Utilization, and Outcomes Research Unit, University of Toronto.
6. Chagnon, M., Audette, L. M., Lebrun, L., & Tilquin, C. (1978). Validation of a patient classification through evaluation of the nursing staff degree of occupation. Medical Care, 16(6), 465-475.