54
Guidance on safe nurse staffing levels in the UK

Guidance on safe nurse staffing levels in the UK
Acknowledgements
This publication contains information, advice and guidance to help members of the RCN. It is intended for use within the UK but readers are advised that practices may vary in each country and outside the UK.
The information in this publication has been compiled from professional sources, but its accuracy is not guaranteed. Whilst every effort has been made to ensure the RCN provides accurate and expert information and guidance, it is impossible to predict all the circumstances in which it may be used.
Accordingly, to the extent permitted by law, the RCN shall not be liable to any person or entity with respect to any loss or damage caused or alleged to be caused directly or indirectly by what is contained in or left out of this information and guidance.
Published by the Policy Unit, Royal College of Nursing, 20 Cavendish Square, London, W1G 0RN or [email protected].
©2010 Royal College of Nursing. All rights reserved. Other than as permitted by law no part of this publication may be reproduced, stored in a retrieval system, or transmitted in any form or by any means electronic, mechanical, photocopying, recording or otherwise, without prior permission of the Publishers of a licence permitting restricted copying issued by the Copyright Licensing Agency, Saffron House, 6-10 Kirby Street, London, EC1N 8TS.
The paper was prepared by Jane Ball, Policy Adviser, Royal College of Nursing (RCN). If you have any queries please contact the Policy Unit.
We would like to thank the nurses, academics and RCN staff who contributed to the paper – whether in one-to-one interviews, discussion groups or by commenting on early drafts. We would particularly like to acknowledge the contribution of Gill Barker to reviewing the literature and tools.
3
ROyAL COLLEGE Of NURSING
1. Executive summary 4 2. Introduction and background 7
3. Context 9
3.1 Quality and regulation 9
3.2 UK nursing workforce – supply and demand 10
3.3 Economic context and efficiency drives 11
Key points 12
4. Why nurse staffing matters 14
4.1 Nurse staffing and patient outcomes and quality 14
4.2 Patient safety and nurse staffing 15
4.3 Impact of short staffing on nursing ‘outcomes’ 17
4.4 Safe staffing – regulation and responsibility 18
Key points 19
5. Current staffing levels/skill mix 20
5.1 Hospital ward staffing 20
5.2 Staffing in care homes 23
5.3 Staffing levels in the community 23
Key points 24
6. Planning nurse staffing 26
6.1 Workforce planning at different levels – the theory 26 6.1.1 How care is delivered – processes and roles 27
6.1.2 Where care is provided – setting and speciality 28
6.1.3 Other elements of nursing workload 28
6.1.4 from plan to reality 28
6.2 Approaches to planning at a local level 29
6.2.1 Outline of methods for planning nurse staffing 30
6.2.2 Problems with using staffing level ‘systems’ 33
6.2.3 Reviewing skill-mix 34
6.2.4 Mandated nurse: patient ratios 36
6.3 Staffing reviews – best practice principles 37
Key points 38
7. Conclusions and recommendations 39
Appendix 1. Some recommended staffing minimums in the UK 42
Appendix 2: Summary of staff planning tools 44
References 49
Guidance on safe nurse staffing levels in the UK
Contents
4
GUIdANCE ON SAfE NURSE STAffING LEvELS IN THE UK
Executive summary
Staffing levels: rights and responsibilitiesStaffing levels have always been an issue. “What is the optimal level and mix of nurses required to deliver quality care as cost-effectively as possible?” is a perennial question.
We have a duty to ensure staffing levels are adequate. Patients have a right to be cared for by appropriately qualified and experienced staff in safe environments. This right is enshrined within the National Health Service (NHS) Constitution, and the NHS Act 1999 makes explicit the board’s corporate accountability for quality. Nurses’ responsibilities regarding safe staffing are stipulated by the Nursing and Midwifery Council (NMC), covering every registered nurse in the UK. And in England, demonstrating sufficient staffing is one of the six essential standards that all health care providers (both within and outside of the NHS) must meet to comply with Care Quality Commission (CQC) regulation.
Documented consequences of short staffing Attention is now focussed more sharply than ever on staffing. Public expectation and the quality agenda demand that the disastrous effects of short staffing witnessed at NHS hospitals such as Mid Staffordshire should not be allowed to happen again. Time and again inadequate staffing is identified by coroners’ reports and inquiries as a key factor. The Health Select Committee 2009 report states: ‘inadequate staffing levels have been major factors in undermining patient safety in a number of notorious cases’. In one year the National Patient Safety Agency (NPSA) recorded more than 30,000 patient safety incidents related to staffing problems.
The business case for maintaining safe staffing levelsThe financial context means we need to ensure services are staffed cost-effectively. Many of the identified high impact actions and efficiency measures proposed rely on reducing costs by minimising the expense of avoidable complications such as dvTs (deep vein thrombosis), pressure ulcers and UTIs (urinary tract infections). But ‘avoidable complications’ are only avoidable if effective nursing care is consistently
delivered. This relies on having sufficient nurses with the right skills in place – which depends on robust planning in terms of nursing staff resources.
Why it matters – the impact on quality, patient outcomes and wellbeingQuality and patient safety have risen up the agenda in the last few years, with multiple initiatives across the UK aimed at raising standards of care. There has been a shift away from process indicators and audit and a movement towards assuring quality through tighter regulation of both the people and systems delivering care, and the monitoring of the effectiveness of that care through the measurement of patient outcomes. But while there are excellent examples of ‘real-time’ measures of patient outcomes/experience being used to shape services, in many parts of the UK there is currently a lack of good quality and comparable data to support quality and outcome measurement.
There is a growing body of research evidence which shows that nurse staffing levels make a difference to patient outcomes (mortality and adverse events), patient experience, quality of care and the efficiency of care delivery. for example, a systematic review in 2007 concluded that there was evidence of an association between increased Registered Nurse (RN) staffing and a lower rate of hospital related mortality and adverse patient events.
But most of the research evidence relates to hospital-based care – there is a paucity of equivalent research in primary and community care.
Short staffing compromises careShort staffing compromises care both directly and indirectly. Recurrent short staffing results in increased staff stress and reduced staff wellbeing, leading to higher sickness absence (needing more bank and agency cover), and more staff leaving. All of this impacts on the cost and quality of care provision.In a recent survey (Ball and Pike, 2009), two-fifths of nurses in the UK reported that care was compromised at least once a week due to short staffing. NHS nurses who regularly report that patient care is compromised are working on wards with twice as many patients per RN as those who report care is never compromised. On average wards that have a ratio of no more than six patients per RN on duty rarely or never report that care
1
5
ROyAL COLLEGE Of NURSING
is compromised due to short staffing. A ratio of eight or more patients per RN is associated with patient care on a ward regularly being compromised by short staffing (from once or twice a week to every shift).
What we know about current staffing levels – hospitalsNationally the number of nurses in the workforce has risen in recent years. But capacity increases in the NHS have absorbed much of this additional workforce. Bed occupancy and patient throughput has increased dramatically over the last 20 years. There is no evidence to suggest that NHS ward level staffing has improved. An ‘average’ NHS ward has 24 beds, 97 per cent of which are filled, and during the day is staffed with 3.3 RNs and 2.2 support workers (RCN survey 2009).
Skill-mix has become more dilute. In 2005 NHS wards typically had 65 per cent RNs – and this average became an RCN benchmark figure. But in 2009 the average skill-mix for wards had fallen to 60 per cent. Both the skill-mix and the number of patients per RN vary considerably between wards. Some of this variation is related to specialty (and differing service needs) but the RCN would question whether it is acceptable that care of the elderly and mental health wards should have such a dilute skill mix compared with other specialties.
What we know about current staffing levels – care homes and communityIn care homes there is an average ratio of 18 patients per registered nurse during the day, and 26 patients per RN at night. There is a real lack of data on nurse staffing levels in the community, and what data does exist needs to be treated with caution to ensure that like is being compared with like – definitions of both the numerators (in terms of staff) and denominators (in terms of populations served) can vary hugely.
Workforce planning in theory and the reality of staffing levelsWorkforce planning happens at different levels – nationally, regionally and locally. But ideally the results of systems used locally will form the basis of regional and national plans. Thus having a sound basis for planning staffing at local level is critical, and the separate tiers of planning should be integrated. Ensuring safe staffing levels relies on having the right
establishment. But a number of factors can ‘erode’ the planned staffing so that even with the ‘right’ establishment, daily staffing levels are insufficient to meet patient need safely. Safe staffing relies on good management so that budgeted posts are filled, and deployed effectively, and the staff employed are available to work.
Number of nurses needed depends on roles and processesTo make judgements about numbers of staff needed requires insight into the roles and competences of different staff groups (which may vary considerably locally). As well as taking into account ‘who does what’, staffing levels will also be affected by how things are done, in terms of the efficiency and effectiveness of processes used. for example, changes made to the way in which things are done through initiatives such as the productive series may alter the staffing levels needed to maintain the same quality of service.
Principles of approaches to planning nurse staffing locallyA range of methods exists that enables staffing to be planned at a local level. The basic principles are nothing new and this paper outlines the methods and looks at the context in which staffing level and skill-mix decisions are taken.
Most approaches to planning staffing rely on quantifying the volume of nursing care to be provided – on the basis of the size of population, mix of patients, and type of service – and relating it to the activities undertaken by different members of the team. The systems vary according to the amount of detail considered, from crude ‘top-down’ ratios that relate staffing to numbers of beds or total population, through to systems requiring detailed data on the nature and volume of care needs (patient dependency) and a breakdown of how nursing activity of different team members varies in relation to this.
How do the systems compare?There has not been a recent review of the systems/tools available for planning staffing and these have not been tested for their reliability or validity. It could be argued that the systems used for planning the most expensive element of health care – nurse staffing – should be subject to the same level of scrutiny that
6
GUIdANCE ON SAfE NURSE STAffING LEvELS IN THE UK
NICE applies to specific health care interventions, as both the financial and patient care costs of inappropriate staffing are massive.
The RCN recommends that government health departments undertake the work required to identify the prevalence and efficacy of approaches to planning nurse staffing. Effective and inexpensive systems need to be supported by health departments so that they are readily accessible to employers in all parts of the UK, and so reduce dependence on commercial systems of unknown provenance.
Best practice in planning nurse staffing Given the lack of proven reliability or recommendations about which systems to use, and the many different factors that determine staffing needs, triangulation is essential. Simple and easy to use systems to plan nurse staffing exist (and are outlined in this paper). The guidance reiterates the common-sense principles to ensure staff planning and reviews are successfully implemented. The key messages are that staffing reviews need to: • have board level commitment (with nursing director key) • involve staff and be transparent (decisions not taken in a vacuum) • use established approaches and apply them consistently • triangulate (for example, dependency scoring system to gauge workload, professional judgment and benchmark) • evaluate regularly (against patient and staffing outcomes data)• heed the results and implement consistently (no cherry picking).
Planning establishments is a beginning not an endAdequate establishments are a beginning. Having safe staffing levels on a daily basis relies on many other factors, to enable ‘planned’ staffing levels to be realised and ensure that staff are deployed in an effective way. All of this depends on good management and leadership.
In the current financial context there is a real danger that health care providers will look to reduce staffing as a means of achieving short-term savings – but without
consideration of the long-term costs or risk to patient care. fiscally-led changes to care delivery need to be risk assessed for the potential impact on staffing and patient care.
Good quality data (HR, quality and outcomes) is therefore the cornerstone of effective staff planning and review. Staffing decisions cannot be made effectively without having good quality data on: • patient mix (acuity/dependency) and service demands • current staffing (establishment, staff in post) • factors that impinge on daily staffing levels (absence, vacancies, turnover) • evidence of the effectiveness of staffing – quality patient outcomes/nurse-sensitive indicators.
This report sets out the range of different factors that influence the total demand for staff and highlights the variety of methods for planning or reviewing staffing. However, recognising the complexities and difficulties of ensuring that staffing levels are safe is not an excuse for inaction. Health care systems are without doubt complex; which provides more reason, not less, to have a rational system in place to ensure that staffing levels and mix are evidence based and patient safety is maintained.
7
ROyAL COLLEGE Of NURSING
Introduction and backgroundfollowing concerns raised by members about the lack of an objective and rational approach to planning nurse staffing, in 2003 the RCN produced Setting safe staffing levels in which it explored the issues and outlined available approaches. Seven years on and concerns about ensuring that our hospitals and communities are adequately staffed have intensified. In spring 2010 staffing levels were once again the focus of debate at RCN Congress when an emergency resolution was put forward to ensure staffing levels were safe.
Initiatives focussing on raising the quality of care in the NHS and ‘energising for excellence’ sit in stark juxtaposition to high profile cases of failing care and evidence that all too often health care organisations are breaking florence Nightingale’s principle: “The very first requirement in a hospital is that it should do the sick no harm”.
At the heart of many of these failures in care provision lie two recurring themes; firstly staffing levels that cannot sustain care standards, and secondly communication/governance failures that prevent organisations from hearing or responding to problems as these emerge.
More recently in 2006 the RCN produced guidance highlighting the range of planning approaches for adequate nurse staffing to meet care needs. This paper continues the trend of outlining the approaches and explores some of the considerations for choosing a suitable approach.
Tools to plan nurse staffing are not a new phenomenon – many have existed in the same or similar guises for decades. for example the system endorsed by the Association of UK University Hospitals (AUKUH) - which is being modified by Energising for Excellence and the NHS Institute for Innovation and Improvement to form the Safer Nursing Care Tool- is related to the Criteria for care/monitor system which has been operational since the late 1980s (Ball and Oreschnick, 1986).
Thus it is not the lack of a systematic approach to planning staff that is the root cause of staffing problems. Care crises occur when rational approaches to planning staffing are either not implemented or the results go unheeded. Enquiry findings – into the Mid
Staffordshire NHS Trust for example - health committees – including the House of Commons report on patient safety (2009), and coroners’ reports on patient safety and unnecessary mortalities suggest that there is an underlying failure to recognise the importance of ensuring that staffing levels are sufficient, and that nurses are deployed as effectively as possible.
The current financial context means that there is even greater risk of staffing decisions being made without a sound rational basis, but made arbitrarily in order to reduce costs, without assessing the risk to patient care.
The problem, and hence the solution, is not simply about ensuring that there were enough staff at the time when establishments were set. It is also about ensuring that the current and daily level of nurse staffing is adequate to meet the needs of today’s patients, and that the level of staffing required, as identified through robust and regular reviews, is maintained, even (and perhaps particularly) at times of financial pressure. In 2009 one in ten inpatients in NHS hospitals in England reported that there were never or rarely enough nurses available (CQC, 2010).
In outlining the challenges faced by the economic downturn, in 2009 the NHS Confederation England warned that measures taken in the past – across the board budget cuts, training cuts, and allowing waiting lists to grow – are not viable options and could be counterproductive.
The message running through much of the guidance on improving NHS productivity is that delivering services well and improving quality of care goes hand-in-hand with improving efficiency. High impact changes identified a focus on making improvements so that less time and money were spent on ‘fixing’ problems caused by poor care – such as pressure ulcers, dvTs, readmissions, complications – prevention being better (and more cost effective) than cure (NHS Institute for Innovation and Improvement, 2009)
The experience of Mid Staffordshire NHS foundation Trust (as illuminated by the inquiry chaired by Robert francis), serves as a bleak warning of the consequences of not having a rational, evidence-based strategy to planning nurse staffing. The inquiry reports that one of the underlying causes of the problems at
2
8
GUIdANCE ON SAfE NURSE STAffING LEvELS IN THE UK
the trust was a long term problem with insufficient staff (traced back to 1998). And yet further staff cuts and skill-mix changes were proposed in 2006 without sufficient supporting information, and were accompanied by a ‘superficial and inadequate assessment of risk’. The trust repeatedly failed to appreciate the impact of low staffing on patient care: even after it became apparent that a workforce review was urgently needed, it took the trust several years before it was undertaken and acted upon.
The focus of this paper and of many staffing/skill-mix reviews – is on nursing. However, to consider the volume and mix of nursing staff inevitably requires us to look at the roles played by the wider team. Whether in hospital settings or community care, the boundaries with other service providers are critical in planning nurse staffing – especially as many care provider roles are in a state of flux.
After considering the context, this paper starts by making explicit the evidence that nurse staffing matters – that there is an association between the number of nursing staff deployed and the quality and safety of care delivered and on patient outcomes. In Section 5 we present some benchmark data on ‘typical’ staffing patterns and summarise data on current staffing levels in different specialties, while Section 6 provides a review of the different approaches to determining the number of nurses needed to deliver care.
But a final note of caution in introducing this report. Throughout the literature on planning nurse staffing and skill-mix, the point is repeatedly made about the limitations of any particular ‘system’, and the fact that there is no universal solution to guaranteeing safe staffing, no ‘one size fits all’ optimum.
As Cherill Scott states in Setting safe nurse staffing levels (RCN, 2003): “There is no such thing as an ‘optimum’ skill mix. It is good management practice to undertake periodic reviews of staffing and skill. decisions should be informed by detailed knowledge…and once made, should be monitored for their impact on patient and staff outcomes.”
In summarising research relating staffing levels to patient outcomes, the National Nursing Research Unit Research (2009) concludes by noting that ‘whilst low
registered nurse staffing levels should be considered a risk factor for poor quality care, increasing nurse staffing may not be sufficient solution’. Achieving good quality safe care relies on staff in post being suitably deployed and well managed, with systems in place to ensure the quality of care being delivered and to monitor patients’ responses to care. All of this requires good management and leadership.
Key points• Staffing levels have always been an issue: “What is the optimal level and mix of nurses required to deliver quality care as cost-effectively as possible?” is a perennial question.• A range of methods to enable the ‘right’ staffing to be determined at a local level exist. The basic principles are nothing new. The different approaches and examples of each are outlined in Section 6 of this paper. • Attention is now focussed more sharply than ever on staffing. Public expectation and the quality agenda demand that the disastrous effects of short staffing witnessed at Mid Staffordshire should not be allowed to happen again. • In the current financial context there is a real danger that health care providers will look to reduce staffing as a means of short-term savings – but without appreciation of the long terms costs or risk to patient care. • In Section 4 this report presents the evidence on why ensuring adequate nurse staffing is critical to the safe delivery of care, and how having sufficient staff to meet demand avoids the unnecessary costs associated with lower quality of care, staff sickness absence, and high staff turnover. • While there are tools available to help ensure that staffing is well matched to service need and workload, and that levels are within a safe range, there are no instant solutions to ensuring safe staffing. There is no universal ‘one size fits all’ short cut.• Adequate establishments are only a beginning. Having safe staffing levels on a daily basis relies on many other factors, to enable ‘planned’ staffing levels to be realised and that staff are deployed in an effective way. All of this depends on good management and leadership.
9
ROyAL COLLEGE Of NURSING
Context
3.1 Quality and regulation The last few years have seen a shift in how quality and safety issues are addressed within health care. There is less emphasis on process orientated systems of quality control and quality assurance. Instead the focus has moved to ensuring quality through regulation and monitoring indicators of patient outcomes and experience. The introduction of multiple layers of regulation apply to both care providing organisations (such as CQC, Monitor in England, the Regulation and Quality Improvement Authority in Northern Ireland, and Health Inspectorate Wales) and staff within them (for example NMC and ISA for nurses and the present proposals to regulate managers), and have resulted in a complex and crowded regulatory landscape in health care.
The drive to improve quality and minimise risk to patients is reflected in the numerous strategies that focus on setting standards, measuring outcomes, and identifying appropriate quality and nursing sensitive indicators (Griffiths et al., 2008). In England High quality care for all (dH 2008) established the tone for a renewed focus on quality; it “sets out a vision for an NHS with quality at its heart”. This has been followed by the development of the National Quality Board, Quality accounts and work on nursing sensitive outcome indicators (Queen’s Nursing Institute 2010).
The department of Health’s ‘Nursing road map for quality’ (2010) reaffirms the importance of quality in nursing and acts as a sign-posting reference guide for nurses, categorising the resources and tools that are currently available that aim to raise quality of care and ensure better outcomes. The Northern Ireland Strategy for Nursing and Midwifery, launched in June 2010, shapes the future of nursing into four strategic priority areas: promoting person centred cultures; delivering safe and effective care; maximising resources for success; and supporting learning and development. The Welsh Assembly Government’s Realising the potential strategic nursing framework, in conjunction with the 2008 national initiative to strengthen ward level management (Free to lead, free to care), has shaped quality improvement in Wales. National monitoring of quality indicators for nursing has
recently been introduced (through a quality audit tool focussed on delivery of care fundamentals at ward level) although it is too early to tell whether or how this will influence policy development or the prioritisation of resources.
In Wales, the policy drive to move services from the acute sector to the community (which began with the publication of Designed for life in 2005) continues with the publication of the Rural health plan and the community nursing strategy in 2008. This is also in the context of a completed NHS reconfiguration that has considerably strengthened national performance management.
In december 2007 the Scottish Government published Better health, better care, which put quality at the heart of a ‘mutual’ NHS where public participation is seen as central to improvement. In response to this NHS Scotland’s strategy for nursing was refreshed and republished in 2009 as Curam. One of the central themes was to develop the role of the Senior Charge Nurse (SCN) and equip these clinical leaders with the information and tools they need to monitor and improve quality in their areas. Leading better care (2008) set out a national role framework for SCNs and identified clinical quality indicators for nursing. In addition, national workload and workforce planning tools have been developed (NHS Education for Scotland 2008) to support SCNs in their leadership role. The RCN has been influential in developing both these initiatives.
A Scottish Government review of the scrutiny functions within the public sector in Scotland reported in 2007. This led to a bill being taken through Scottish Parliament. The RCN took a position that health and social care should be regulated by the same body. The bill saw this as an aspiration for the future. As a result a new scrutiny body – Health Improvement Scotland - is being established from 2011 alongside a separate body for social work and social care.
In May 2010 the Scottish Government launched a new Healthcare quality strategy for NHS Scotland. This brings together all the existing strands of work around quality and patient safety and ‘sets out new ambitions for person-centred, safe and effective care for the people of Scotland’. There are significant concerns that
3
10
GUIdANCE ON SAfE NURSE STAffING LEvELS IN THE UK
the right information is not reaching health board executive teams, and a great deal of work is being undertaken to develop measurement frameworks which capture outcomes and patient experience as well as process measures. The RCN is actively engaged in the implementation of the strategy.
The RCN has been proactive in leading the quality agenda across the UK – developing a quality improvement hub (www.rcn-audit.org.uk), a safety climate tool (Currie and Watterson, 2010), and producing a set of Nursing Principles (RCN, 2010). But despite the policy and regulatory interest in assuring the quality and safety of care provided, relatively few organisations are using robust measures of quality or outcome. for example a ‘dire lack’ of information on the safety and effectiveness of much NHS care was reported by members of the NHS National Quality Board (West, 2010).
3.2 UK nursing workforce – supply and demandIncreasing life expectancy and advances in medical interventions, coupled with ever increasing public expectations about the range of services to be accessed and speed of delivery, mean that the overall volume of care being delivered – by the NHS and other health service providers – has never been so great. UK health ‘output’ (in terms of the volume of care provided) is reported by the Office for National Statistics (2010) as having increased by 69 per cent between 1995 and 2008.
fulfilling the pledge to reduce waiting times has also required an increase in health service capacity and a more rapid throughput of patients. for example in England, NHS hospital admissions rose from 11m to 13.5m over the last decade, at a time when the mean length of stay fell from 8.4 days to 5.7 days, and average age of inpatients went up from 45 to 50 (Hospital Episode Statistics 2009) . The result is that both in hospitals and within the community, patients’ needs have become more acute and the volume of care required has also increased.
Workforce planners were slow to recognise the impact such capacity changes would have on the demand for nursing staff. After a period of shortages, it was not until the late 1990s that steps were taken to increase
the nursing workforce – by increasing the number trained and by recruiting nurses from outside the UK. The rapid growth in the first half of the decade was curtailed by the deficits crises, impacting particularly in England, and the number of nurses working in the NHS flat-lined between 2005 and 2007 (Buchan and Seccombe, 2008). Since then numbers have increased in England, but less so in Scotland Wales and Northern Ireland (Buchan and Seccombe, 2009; NHS Information Centre, 2010; Statistics Wales).
While nursing workforce numbers have generally stabilised the ageing population profile of patients (particularly in the community) continues to pose a critical challenge. Scenario modelling suggests that significant growth will be required to meet future demand for nurses. for example modelling by the Workforce Review Team in 2008 forecast that maintaining the level of nurse training at its current level, would result in an overall decline in nursing numbers between 2007 and 2016. In spite of this, in Northern Ireland for example there is a reduction in pre and post registration nurse education budgets for 2010-11.
In order to forecast the workforce required to meet future care needs, workforce planning also needs to consider the changing balance between types of care and different modes of delivery to be anticipated. All four nations of the UK have well-established policies to shift care away from hospital provision and increase community based services, many of which are nurse led. But there is little evidence of this policy in reality, in terms of the size of workforce deployed or trained within the community. for example, in England and in Wales the proportion of nurses employed in community services has increased by two per cent or less in the last decade (to 16 per cent in 2008), which is the same percentage increase witnessed in this period in acute services (NHS Information Centre, 2009). Added to this, across the UK 27 per cent (Ball and Pike, 2009) of NHS community nurses are over 50 and will retire within the next 10 years.
The NHS Annual Operating framework for 2010/2011 in Wales sets out an increase of 10 per cent as the target for staff working in the community. development is being overseen by the implementation group of the Community Nursing Strategy. Profession or skill mix is
11
ROyAL COLLEGE Of NURSING
not specified and although module-based community nursing education has developed in recent years it is not clear that the number of nurses accessing this level of training has significantly increased.
There are clearly major workforce planning challenges to be confronted at the regional and national level. And outlined in Section 6 of this document, good workforce planning at the macro level is built in part on extrapolation from local data, which is based on the premise that current staffing levels are sufficient to provide care safely and to a good standard.
However, the 2007 Health Committee workforce planning report demonstrated the inadequacy of workforce planning in England. With 70 per cent of NHS funding spent on NHS staffing, the point is made that the effectiveness of its workforce determines the effectiveness of the health service. However, the committee considered that there has been ‘a disastrous failure of workforce planning’ in England.
The Centre for Workforce Intelligence (CWI) was launched in July 2010. It aims to bring together high quality evidence and intelligence to inform workforce planning and strengthen decision making at all levels in England. A new national operating system for workforce planning and education commissioning in England (dH 2010) was launched at the same time as the establishment for the CWI was announced.In Northern Ireland a report commissioned by dHSSPS from AGM, Horwath has identified deficiencies in the workforce planning process and RCN has called for these issues to be addressed.
In contrast, in Scotland local and national workforce planning and the mechanisms used are more centrally coordinated. following an Audit Scotland report in 2002 which noted how little was known about the way in which providers planned staffing, four working groups were established to ‘develop nationally agreed tools for workload measurement and planning in adult acute care, paediatrics and neonatal nursing, primary care and mental health and learning disabilities’ (Audit Scotland, 2007). The Nursing and Midwifery Workload and Workforce Planning Group embrace a ‘whole systems’ approach to developing, testing and piloting tools until they are fit for purpose and ready to be rolled out on a national basis. To date a suite of seven tools
for specific care settings has been developed and each tool is in use or is being refined with additional care area tools in development. Each of the tools takes a triangulation approach measuring activity, professional judgement and clinical quality indicators instead of measuring a single value.
All Scottish boards are committed to using the agreed tools in the annual workforce planning process. In addition, boards test their planning assumptions of future workforce against three central criteria of affordability, adaptability and availability (‘the three As’). Current pressure on budgets due to tightening expenditure on public services presents a challenge to the use of the nationally-agreed nursing workforce planning tools. This risks undermining the nationally coordinated approach to nursing workforce planning structures as individual boards attempt to remain in financial balance.
In Wales the quality of workforce planning was the subject of a The National Assembly Health and Social Services Committee Inquiry in 2008 (to which the RCN contributed substantially). All health organisations in Wales now submit annual workforce plans to the NLIAH workforce development unit and these feed into the education commissioning process. However, the quality of these plans is extremely variable.
In summary, workforce planning at national level presents a number of concerns:• it has generally not been done well across the UK and has led to ‘boom to bust’ scenarios • changes in demand (increasing capacity, move to community) and changes in supply (ageing workforce), and the relationship between the two are not well reflected in workforce plans• outside of Scotland, local and national workforce planning is not systematically integrated• effective workforce planning requires not only a commitment to matching supply to demand (with an accurate assessment of both) but the will and authority to translate the results of the agreed approach into workforce plans.
3.3 Economic context and efficiency drivesIn today’s financial climate, using precious resources wisely and minimising risk is imperative across all health sector employers and settings. The NHS in
12
GUIdANCE ON SAfE NURSE STAffING LEvELS IN THE UK
England is required to find savings of £15-20 billion over the next four years. A number of work steams have been identified to help respond to the financial challenges whilst attempting to improve services: for example, Quality, Innovation, Prevention, and Productivity (QIPP) in England (dH, 2010).
Over each of the next three years, it had been estimated that the public sector in Scotland will have to save £1billion each year (Independent Budget Review Panel 2010). Across Scotland, health boards are looking at ways to cut costs to balance their budgets in 2010-2011 – more than 1,500 WTE nursing and midwifery posts are already under threat (NHS Workforce Projections 2010-11), as part of health boards’ attempts to save around £250 million during 2010-2011.
Building on pledges in the Scottish Government’s NHS blueprint Better health, better care, the NHS Scotland Efficiency and Productivity Programme aims to “provide a supportive and enabling framework” to achieve efficiency and productivity targets and is intended to improve quality and reduce costs in a co-ordinated manner. Of the 20 potential productive opportunities identified, eight are classed as medium and/or high impact, with cash releasing saving opportunities to save more than £10 million each. These include key areas of clinical variation, admissions and infection rates and reduced staff sickness. It is worth noting that reviewing “variation in skill mix and opportunities from workforce benefit realisation plans” is identified only as a potential low impact opportunity for improved efficiency.
In England, the message regarding improvement and efficiency, which underlies many of the productivity improvements proposed, is that quality needs to be the organising principle of the NHS at the same time as efficiency savings are made. A number of the recommended interventions are identified as ‘potential high impact changes’, and they focus on financial savings delivered through improving the efficacy and efficiency of care (for example, enhancing recovery from elective surgery by improving pre-, intra-, and post-op care of patients).
Similarly, much of the discussion around ‘safer care’ (for example in the NHS 2010-15 five-year plan) centres on avoidable complications and adverse events. An
example given is that deep vein thromboses are responsible for 25,000 hospital deaths per year in England alone. High impact nursing and midwifery actions identified by the England CNO also focus on the savings and improvements that would result from preventing avoidable problems such as: pressure ulcers, UTIs, and falls (NHS Institute for Innovation and Improvement 2009).
In Wales the two-year 1000 Lives campaign, led by the National Leadership and Innovation Agency for Healthcare, enabled frontline staff to implement new ways of working to improve patient outcomes. This campaign had a high level of nursing engagement and it is estimated that 852 additional lives were saved more than 29,000 episodes of harm were averted. The campaign has now been transformed into a permanent programme of improvement.
So how does this relate to nurse staffing issues? The pertinent point to note is that a great many of these initiatives, widely recognised as not only improving care but also reducing costs rely on the provision of good quality nursing care. ‘Avoidable complications’ are only avoidable if effective nursing care is consistently delivered. To deliver these productivity gains requires nurses.
Staffing changes need a sound basis, to avoid short-sighted cuts that leave the service impaired and patient care at risk. While there are clearly difficult choices to be made, these choices need to be evidence based if they are to be sustainable. fiscal led changes to care delivery need to be risk assessed for the potential impact on staffing and patient care (for example, as suggested by NHS Scotland in setting up a national panel).
Key points • Quality and patient safety have risen higher on the agenda in the last few years, with multiple initiatives across the UK aimed at raising standards of care.• There has been a shift away from process indicators and audit, towards assuring quality through tighter regulation of the people and organisations providing care, and monitoring the effect of care through measures of patient outcome.
13
ROyAL COLLEGE Of NURSING
• The regulatory landscape is crowded and confusing, with potential for duplication and gaps. • While there are excellent examples of ‘real-time’ patient outcomes and experience data being used to shape services, overall there is a ‘dearth of data’ to support quality and outcome measurement. • The demand for nurse staffing has increased. fulfilling the pledge to reduce waiting times in the NHS has resulted in increased capacity and a more rapid throughput of patients through hospitals. Both in hospitals and within the community, patients’ needs have intensified and the volume of care required has also increased. • Meanwhile the nursing workforce is ageing. for example 27 per cent of NHS community nurses are over 50 and could retire in the next five to 10 years.• Although there are differences across the four nations, workforce planning in the past has generally not been adequate to ensure that supply matches demand. Instead we have seen a ‘boom to bust’ cycle. • The NHS initially responded to the need to make savings by identifying ‘high impact actions’ and efficiency/productivity improvements. Many of these improvements reduce costs by minimising the expense of avoidable complications (such as dvTs, pressure ulcers or UTIs) by providing a better standard of nursing care. • Many ‘avoidable complications’ are only avoidable if effective nursing care is consistently delivered. This requires nurse staffing to be well planned.• fiscal led changes to care delivery need to be risk assessed for the potential impact on staffing and patient care (for example, as suggested by NHS Scotland in setting up a national panel).
14
GUIdANCE ON SAfE NURSE STAffING LEvELS IN THE UK
Why nurse staffing matters
4.1 Nurse staffing and patient outcomes and qualityTen years ago the evidence making explicit the association between nurse staffing and patient outcomes was sparse. few studies had been published and most of these were US studies (for example Aiken et al., 2002 and Needleman et al., 2002) using hospital level data to explore the association between RN staffing and mortality rates.
In 2005 Lankshear published a systematic review of international research since 1990 that looked at relationships between nurse staffing and patient outcomes. Across the 22 studies covered the report stated that, ”[The results] strongly suggest that higher nurse staffing and richer skill mix (especially of registered nurses) are associated with improved patient outcomes, although the effect size cannot be estimated reliably. The association appears to show diminishing marginal returns”.
In the UK Rafferty (2007) reported a 26 per cent higher mortality for patients in hospitals that had the highest patient: nurse ratios (in other words, poorer nurse staffing levels). Nurses in these hospitals also showed higher burnout rates and were approximately twice as likely to be dissatisfied in their job. They were also more likely to report low/deteriorating quality of care on their ward/in their hospital.
The research in this field has continued to develop. Studies are exploring the link between nurse staffing and patient outcomes at the unit level (as opposed to hospital wide), controlling for a wider range of other factors and making use of a wider range of nurse sensitive outcome measures. More research is being conducted beyond the USA. for example, an EU funded three-year research study known as ‘N4Cast’ is currently underway is exploring the association between nurse staffing and patient outcomes in 15 countries, in order to inform workforce planning approaches.
Kane’s (2007) systematic review provides a good overview of the research on the links between registered nurse staffing and patient outcomes.
Overall, 28 of the 96 studies examined in the meta-analysis reported differences in patient outcome in relation to level of registered nurses (relative to patient numbers) and met the reviewers’ inclusion criteria. The review concluded that the studies show an association between increased RN staffing and lower rate of hospital related mortality and adverse patient events.
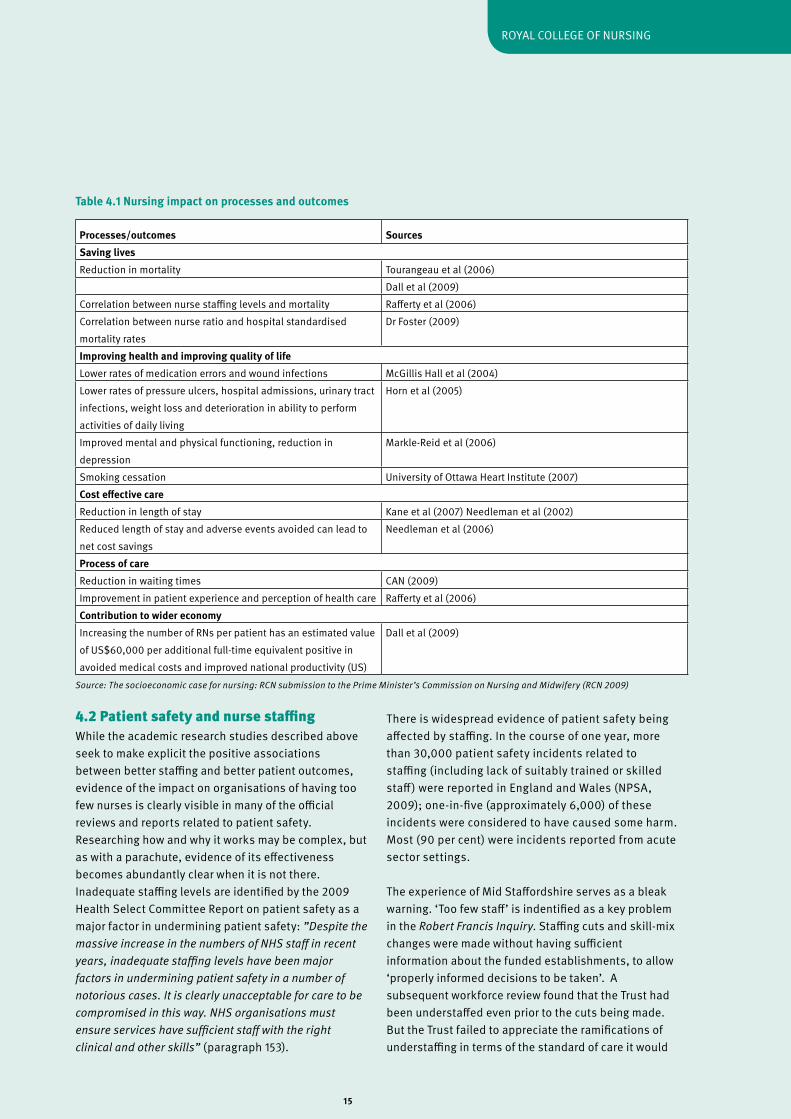
Table 4.1 overleaf summarises some of the research evidence on the impact nursing has on quality of care and outcomes.
There is a distinct paucity of research evidence relating nursing inputs to patient outcomes from primary/community care. This is in part because so much of the research has come from the US, where there is less focus on primary and community care. A recent analysis of secondary data suggests that within the UK, general practices employing more nurses perform better across a number of different clinical areas, as measured by the Quality and Outcomes Framework (Griffiths et al., 2010).
4
15
ROyAL COLLEGE Of NURSING
4.2 Patient safety and nurse staffing While the academic research studies described above seek to make explicit the positive associations between better staffing and better patient outcomes, evidence of the impact on organisations of having too few nurses is clearly visible in many of the official reviews and reports related to patient safety. Researching how and why it works may be complex, but as with a parachute, evidence of its effectiveness becomes abundantly clear when it is not there.Inadequate staffing levels are identified by the 2009 Health Select Committee Report on patient safety as a major factor in undermining patient safety: ”Despite the massive increase in the numbers of NHS staff in recent years, inadequate staffing levels have been major factors in undermining patient safety in a number of notorious cases. It is clearly unacceptable for care to be compromised in this way. NHS organisations must ensure services have sufficient staff with the right clinical and other skills” (paragraph 153).
There is widespread evidence of patient safety being affected by staffing. In the course of one year, more than 30,000 patient safety incidents related to staffing (including lack of suitably trained or skilled staff) were reported in England and Wales (NPSA, 2009); one-in-five (approximately 6,000) of these incidents were considered to have caused some harm. Most (90 per cent) were incidents reported from acute sector settings.
The experience of Mid Staffordshire serves as a bleak warning. ‘Too few staff’ is indentified as a key problem in the Robert Francis Inquiry. Staffing cuts and skill-mix changes were made without having sufficient information about the funded establishments, to allow ‘properly informed decisions to be taken’. A subsequent workforce review found that the Trust had been understaffed even prior to the cuts being made. But the Trust failed to appreciate the ramifications of understaffing in terms of the standard of care it would
Processes/outcomes SourcesSaving livesReduction in mortality Tourangeau et al (2006)
dall et al (2009) Correlation between nurse staffing levels and mortality Rafferty et al (2006)Correlation between nurse ratio and hospital standardised mortality rates
dr foster (2009)
Improving health and improving quality of lifeLower rates of medication errors and wound infections McGillis Hall et al (2004)Lower rates of pressure ulcers, hospital admissions, urinary tract infections, weight loss and deterioration in ability to perform activities of daily living
Horn et al (2005)
Improved mental and physical functioning, reduction in depression
Markle-Reid et al (2006)
Smoking cessation University of Ottawa Heart Institute (2007)Cost effective careReduction in length of stay Kane et al (2007) Needleman et al (2002)Reduced length of stay and adverse events avoided can lead to net cost savings
Needleman et al (2006)
Process of careReduction in waiting times CAN (2009)Improvement in patient experience and perception of health care Rafferty et al (2006)Contribution to wider economyIncreasing the number of RNs per patient has an estimated value of US$60,000 per additional full-time equivalent positive in avoided medical costs and improved national productivity (US)
dall et al (2009)
Table 4.1 Nursing impact on processes and outcomes
Source: The socioeconomic case for nursing: RCN submission to the Prime Minister’s Commission on Nursing and Midwifery (RCN 2009)
16
GUIdANCE ON SAfE NURSE STAffING LEvELS IN THE UK
be possible to deliver. Whilst the inquiry acknowledged the financial pressure the trust was under, it concluded, ‘it is by no means clear that the only way of finding the necessary savings was to implement a workforce reduction programme’ (RfI, p.227).
Repeatedly, the same set of contributory factors are identified repeatedly in high profile care crises. The Healthcare Commission in its investigation reports on outbreaks of C. Difficile at Stoke Mandeville hospital and at Maidstone and Tunbridge Wells reveal a number of similarities between the trusts. Both had undergone difficult organisational mergers (which impinged on systems for clinical governance and risk assessment), were pre-occupied with finances, had poor environments, and had very high bed occupancy levels. And as at Mid Staffordshire, financial pressures led to the trusts reducing further already low numbers of nurses. The effect in all three cases, apparent from patient and staff comments, was that too frequently basic nursing care was not provided, putting patients’ safety and lives at risk.
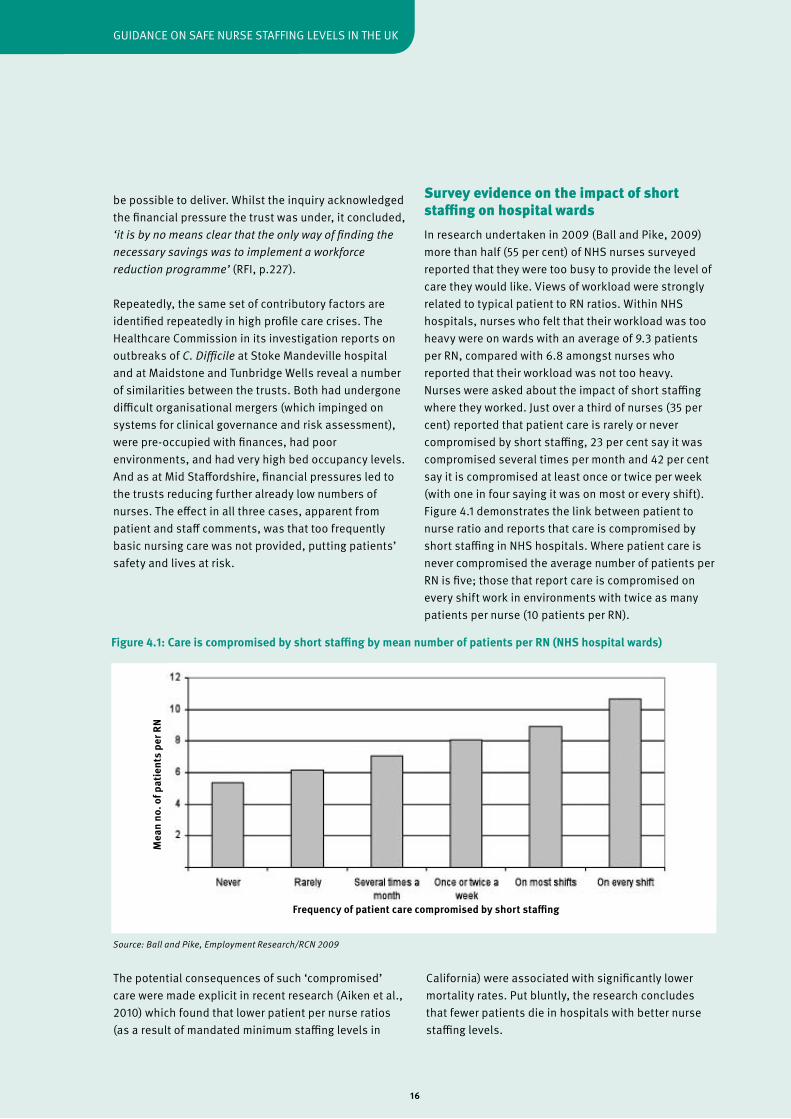
Survey evidence on the impact of short staffing on hospital wards In research undertaken in 2009 (Ball and Pike, 2009) more than half (55 per cent) of NHS nurses surveyed reported that they were too busy to provide the level of care they would like. views of workload were strongly related to typical patient to RN ratios. Within NHS hospitals, nurses who felt that their workload was too heavy were on wards with an average of 9.3 patients per RN, compared with 6.8 amongst nurses who reported that their workload was not too heavy. Nurses were asked about the impact of short staffing where they worked. Just over a third of nurses (35 per cent) reported that patient care is rarely or never compromised by short staffing, 23 per cent say it was compromised several times per month and 42 per cent say it is compromised at least once or twice per week (with one in four saying it was on most or every shift). figure 4.1 demonstrates the link between patient to nurse ratio and reports that care is compromised by short staffing in NHS hospitals. Where patient care is never compromised the average number of patients per RN is five; those that report care is compromised on every shift work in environments with twice as many patients per nurse (10 patients per RN).
Figure 4.1: Care is compromised by short staffing by mean number of patients per RN (NHS hospital wards)
Source: Ball and Pike, Employment Research/RCN 2009
The potential consequences of such ‘compromised’ care were made explicit in recent research (Aiken et al., 2010) which found that lower patient per nurse ratios (as a result of mandated minimum staffing levels in
California) were associated with significantly lower mortality rates. Put bluntly, the research concludes that fewer patients die in hospitals with better nurse staffing levels.
Frequency of patient care compromised by short staffing
Mea
n no
. of p
atie
nts
per R
N
17
ROyAL COLLEGE Of NURSING
4.3 Impact of short staffing on nursing ‘outcomes’ The previous sections looked at the evidence of an association between staffing levels and patient outcomes and safety of care. But there is a wealth of evidence that shows the effect that inadequate staffing levels have on nurses and nursing. Having insufficient nursing staff relative to the nursing workload to be delivered leads to increased pressure, stress, higher levels of burnout, lower job satisfaction (Sheward et al., 2005) and a greater inclination to leave (described as nurse ‘outcomes’ in some of the literature). This creates a downward spiral as morale declines and sickness absence increases; leaving fewer staff available to work and creating even more pressure on existing staff. Nurses under more pressure are more likely to want to leave, taking with them valuable experience of working in that specific area for that particular employer; thus leaving a skills gap which can be difficult and costly to fill, and which ultimately results in service impairment.
A large scale survey of RCN members exploring nurse wellbeing (Ball et al., 2006) found that on average nurses score more poorly on the Health and Safety Executive (HSE) stress exposure scale than the benchmark average. Nurses with the worst stress scores were more likely to have lower job satisfaction, and were most likely to want to leave their jobs.
This downward spiral is not only costly to the individual nurses caught in the cycle, but is costly to the health service in terms of: • sickness absence costs • turnover costs• ill-health retirement• agency and back cover staff absence and unfilled vacancies.
The Chartered Institute of Personnel and development’s absence management survey estimates that 10 million working days a year are lost to the NHS due to sickness absence at a total cost of £1.7 billion a year (see page 27 of the NHS health and wellbeing interim review report, August 2009). On average sickness absence in the NHS in England varies between 4-4.7 per cent depending on the time of year (NHS Information Centre, 2010). Interestingly the highest levels of sickness absence are recorded in specialties
such as elderly and general medicine, which have lowest levels of RN staffing relative to patients (CBI, 2007). Research commissioned by the HSE in 2002 identified staff shortages and high workloads (due to insufficient administrative support and high levels of patient demand) as key sources of stress for NHS employees.
The final report from the NHS health and wellbeing review (led by Steve Boorman) in November 2009 reiterated the business case for change. It flagged the cost of sickness absence to the NHS and made recommendations to improve NHS staff wellbeing. It is estimated that it costs more than £4,500 to fill a vacancy (and more for senior staff). Additionally, spending on agency staffing is related to the level of sickness absence and staff turnover and on average NHS trusts spend 3.85 per cent of their wage bill on agency staff (costing £1.45 billion) (see the NHS health and wellbeing interim review report, August 2009). Aside from the financial imperative to reduce work-related stress, employers have a legal duty to identify the causes of stress and take implement measures to reduce these causes (RCN, 2009). The HSE has developed standards to help employers meet this duty, one of which –demand – relates specifically to manageable workloads.
Inevitably the quality of care provided suffers. Not just as a direct consequence of there being too few staff relative to the volume care to be delivered (missed episodes of care, increased falls and adverse events, less timely analgesia, and so forth), but also indirectly as a consequence of the effect that short staffing has on nurses themselves. If the level and mix of staffing is not well matched to what is needed, it is not just the volume of care that is affected, but the quality of each and every nursing action or interaction is potentially threatened by the impact that excessive workloads have on the individual nurses. As a consequence, care in these circumstances is being provided by nurses who:• feel ‘stretched to the limits’• report that they have insufficient time to deliver care properly • have higher levels of stress (which impairs functioning) (Ball et al., 2006)• are not refreshed and rested (often skipping breaks and working overtime to fill staffing gaps)• have had less professional development/updates (Ball and Pike, 2009).
18
GUIdANCE ON SAfE NURSE STAffING LEvELS IN THE UK
Quotes from staff at Mid Staffordshire reported in Mid Staffordshire foundation Trust Inquiry chaired by Robert francis QC – known as the Robert francis Inquiry (RfI) –exemplify this:
“I remember at the time when our staffing levels were cut and we were just literally running around. Our ward was known as Beirut from several other wards. I heard the unit nicknamed that. ITU used to call us Beirut” (RfI, p.197).
“I felt that I would have to be in about 10 places at once. Because both sides, like the medical side, the drugs side, the blood transfusions, the basic nursing care, they are both important for a person… I mean some ways I feel ashamed because I have worked there and I can tell you that I have done my best, and sometimes you go home and you are really upset because you can’t say that you have done anything to help…There was not enough staff to deal with the type of patient that you needed to deal with, to provide everything that a patient would need. You were doing – just skimming the surface and that is not how I was trained” (RfI, p.203).
Analysis presented in the interim NHS Health and well-being review – known as the Boorman report – demonstrated the relationship between staff wellbeing and absence, turnover, agency spend, patient satisfaction, MRSA rates (in acute trusts) and mortality rates. The report concludes: “Healthier staff, teams that are not disrupted by sickness, or where staff are not under undue stress, and lower turnover rates all contribute both to the quality of care given to patients and to patient satisfaction. By contrast, where staff are unhappy and unhealthy, where there are high sickness rates, high turnover and high levels of stress, there are likely to be poorer outcomes and poorer patient experience” (p.49).
4.4 Safe staffing – regulation and responsibility The previous sections have presented evidence of the association between nurse staffing and patient safety, patient outcomes, quality of care and nurse wellbeing. Unsurprisingly, staffing is flagged as a critical determinant of care quality and standards by bodies that regulate, advise or monitor care provision, and is referred to in legislation.
Patients’ rights to quality of care in England are now enshrined within the NHS Constitution, which stipulates that patients, ‘have the right to be treated with a professional standard of care, by appropriately qualified and experienced staff, in a properly approved or registered organisation that meets levels of safety and quality’ (p.6).
The NMC Code sets out a nurse’s responsibility to report staffing levels they believe put patient care at risk: • you must act without delay if you believe that you, a colleague or anyone else may be putting someone at risk • you must inform someone in authority if you experience problems that prevent you working within this Code or other nationally agreed standards • you must report your concerns in writing if problems in the environment of care are putting people at risk.
But care providers also have a duty to patient safety. This was made explicit in the NHS Act 1999 (outlined for nurses by the NMC), which introduced corporate accountability for clinical quality and performance, placing a duty of quality on NHS organisations.
The Care Quality Commission (CQC) is the body within England that has responsibility for the regulation of care providers. In order to have a legal licence to operate, care providers (both in NHS and outside) are required to register with CQC; the system is being introduced (in stages) from April 2010. CQC guidance on compliance sets out essential standards of quality and safety (CQC, 2010). Item 22 stipulates that in order to safeguard the health, safety and welfare of service users, care providers ‘must take appropriate steps to ensure that, at all times, there are sufficient numbers of suitably qualified, skilled, and experienced persons employed for the purposes of carrying on the regulated activity’.
Care providers regulated by CQC are expected to be able to demonstrate that they have carried out a needs analysis and risk assessment as the basis for deciding sufficient staffing levels, and to demonstrate that they have the appropriate systems in place to enable effective maintenance of staffing levels. Staffing is key, and is listed as one of the six outcomes of essential standards of quality and safety. However, there are two points to note regarding CQC compliance guidance. firstly, although staffing is identified as being key,
19
ROyAL COLLEGE Of NURSING
there is little detail in the guidance on how providers should ensure that it is adequate or on how the regulator will review whether or not it is adequate. Secondly, the guidance makes clear that the responsibility to determine what ‘sufficient’ staffing is rests with providers of care and is not empirically reviewed by regulators.
The consequences of not assessing the impact of staffing changes on quality and patient safety are evident from Mid Staffordshire. The Healthcare Commission investigation at Mid Staffordshire concluded: ‘The trust was galvanised into radical action by the imperative to save money and did not properly consider the effect of reductions in staff on the quality of care. It took a decision to significantly reduce staff without adequately assessing the consequences’ (p.11).
The Mid Staffordshire Inquiry Report included several recommendations aimed at strengthening the quality of leadership and governance in NHS Trusts. In response the NHS Chief Executive (Sir david Nicholson) announced that the government was looking to develop a new system of professional accreditation for senior managers as proposed by the National Leadership Council, and commended The Healthy NHS Board to board members.
despite the importance of listening to staff, the 2009 NHS staff survey (covering 290,000 staff) reports that many staff feel excluded from decision making and that there is a strong view that senior managers did not act on their feedback. Less than half of staff think that clinical and managerial staff worked well together. In response to the points made above, the RCN considers that nursing directors and boards have a responsibility to ensure that:• staffing is rationally planned • that the number and mix of staff is adequate to meet patient needs without adverse effect on staff or patients • adequacy of staffing is regularly reviewed• quality and safety of care is monitored using nursing sensitive indicators and reported at board level• data on patient outcomes, patient experience and quality of care are regularly reported to frontline service managers, to enable them to identify and respond to problems as they arise • there is a climate/culture that promotes patient safety and ensures that there are mechanisms in
place to respond to staff feedback about the quality of care and concerns raised• problems identified by clients/patients or staff are addressed• changes made to staffing are evidence based.
Key points • There is a growing body of research evidence which shows that nurse staffing levels make a difference to patient outcomes (mortality and adverse events), patient experience, quality of care, and the efficiency of care delivery. • Most of this evidence relates to hospital based care – there is a paucity of equivalent research in primary and community care.• Short staffing compromises care both directly and indirectly. Recurrent short staffing results in a downward spiral of increased staff stress, reduced staff wellbeing, leading to higher sickness absence (needing more bank and agency cover), and more staff leaving. All of this impacts on the costs and quality of care provision.• Two-fifths of nurses in the UK report that care is compromised at least once a week due to short staffing. Nurses who regularly report that patient care is compromised are working on wards with twice as many patients per RN as those who report care is never compromised. • In one year the NPSA recorded more than 30,000 patient safety incidents related to staffing problems.• Time and again inadequate staffing is identified by coroners’ reports and inquiries as a key factor in patient safety incidents. Health Select Committee report in 2009 says: ‘Inadequate staffing levels have been major factors in undermining patient safety in a number of notorious cases.’ • The patient’s rights to be cared for by appropriately qualified and experienced staff in a safe environment is recognised in the law (for example, the NHS Constitution), and the NHS Act 1999 makes explicit the corporate accountability for quality. • Nurses’ responsibilities regarding safe staffing are stipulated by the NMC, covering every registered nurse in the UK.• In England, demonstrating sufficient staffing is one of the six essential standards that all health care providers (both within and outside of the NHS) must meet to comply with CQC regulation.
20
GUIdANCE ON SAfE NURSE STAffING LEvELS IN THE UK
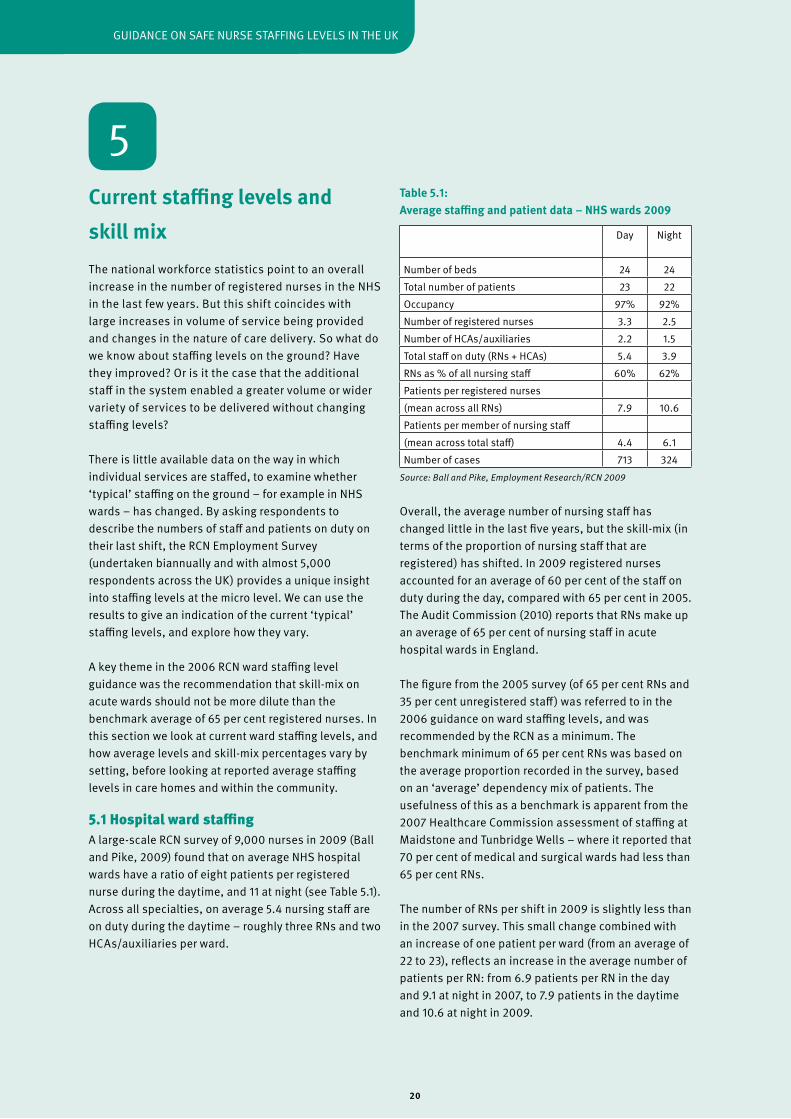
Current staffing levels and skill mix The national workforce statistics point to an overall increase in the number of registered nurses in the NHS in the last few years. But this shift coincides with large increases in volume of service being provided and changes in the nature of care delivery. So what do we know about staffing levels on the ground? Have they improved? Or is it the case that the additional staff in the system enabled a greater volume or wider variety of services to be delivered without changing staffing levels?
There is little available data on the way in which individual services are staffed, to examine whether ‘typical’ staffing on the ground – for example in NHS wards – has changed. By asking respondents to describe the numbers of staff and patients on duty on their last shift, the RCN Employment Survey (undertaken biannually and with almost 5,000 respondents across the UK) provides a unique insight into staffing levels at the micro level. We can use the results to give an indication of the current ‘typical’ staffing levels, and explore how they vary.
A key theme in the 2006 RCN ward staffing level guidance was the recommendation that skill-mix on acute wards should not be more dilute than the benchmark average of 65 per cent registered nurses. In this section we look at current ward staffing levels, and how average levels and skill-mix percentages vary by setting, before looking at reported average staffing levels in care homes and within the community.
5.1 Hospital ward staffingA large-scale RCN survey of 9,000 nurses in 2009 (Ball and Pike, 2009) found that on average NHS hospital wards have a ratio of eight patients per registered nurse during the daytime, and 11 at night (see Table 5.1). Across all specialties, on average 5.4 nursing staff are on duty during the daytime – roughly three RNs and two HCAs/auxiliaries per ward.
Table 5.1: Average staffing and patient data – NHS wards 2009
Source: Ball and Pike, Employment Research/RCN 2009
Overall, the average number of nursing staff has changed little in the last five years, but the skill-mix (in terms of the proportion of nursing staff that are registered) has shifted. In 2009 registered nurses accounted for an average of 60 per cent of the staff on duty during the day, compared with 65 per cent in 2005. The Audit Commission (2010) reports that RNs make up an average of 65 per cent of nursing staff in acute hospital wards in England.
The figure from the 2005 survey (of 65 per cent RNs and 35 per cent unregistered staff) was referred to in the 2006 guidance on ward staffing levels, and was recommended by the RCN as a minimum. The benchmark minimum of 65 per cent RNs was based on the average proportion recorded in the survey, based on an ‘average’ dependency mix of patients. The usefulness of this as a benchmark is apparent from the 2007 Healthcare Commission assessment of staffing at Maidstone and Tunbridge Wells – where it reported that 70 per cent of medical and surgical wards had less than 65 per cent RNs.
The number of RNs per shift in 2009 is slightly less than in the 2007 survey. This small change combined with an increase of one patient per ward (from an average of 22 to 23), reflects an increase in the average number of patients per RN: from 6.9 patients per RN in the day and 9.1 at night in 2007, to 7.9 patients in the daytime and 10.6 at night in 2009.
5
day Night
Number of beds 24 24Total number of patients 23 22Occupancy 97% 92%Number of registered nurses 3.3 2.5Number of HCAs/auxiliaries 2.2 1.5Total staff on duty (RNs + HCAs) 5.4 3.9RNs as % of all nursing staff 60% 62%Patients per registered nurses(mean across all RNs) 7.9 10.6Patients per member of nursing staff (mean across total staff) 4.4 6.1Number of cases 713 324
21
ROyAL COLLEGE Of NURSING
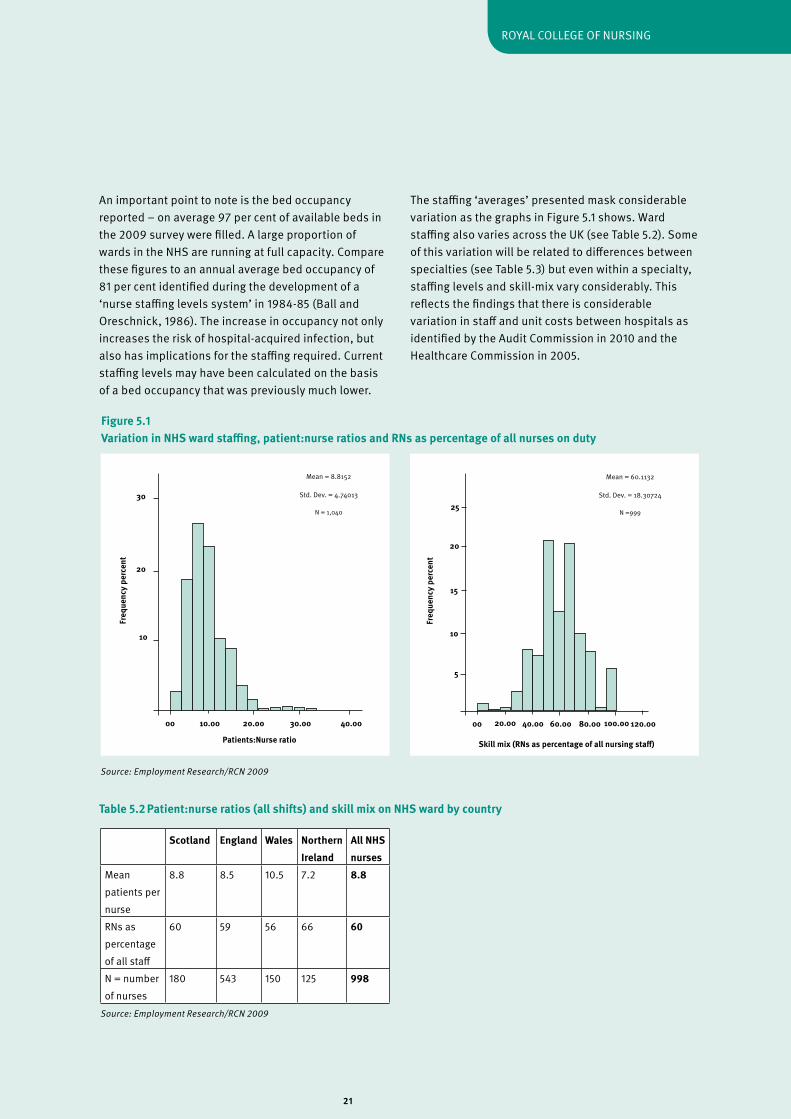
An important point to note is the bed occupancy reported – on average 97 per cent of available beds in the 2009 survey were filled. A large proportion of wards in the NHS are running at full capacity. Compare these figures to an annual average bed occupancy of 81 per cent identified during the development of a ‘nurse staffing levels system’ in 1984-85 (Ball and Oreschnick, 1986). The increase in occupancy not only increases the risk of hospital-acquired infection, but also has implications for the staffing required. Current staffing levels may have been calculated on the basis of a bed occupancy that was previously much lower.
The staffing ‘averages’ presented mask considerable variation as the graphs in figure 5.1 shows. Ward staffing also varies across the UK (see Table 5.2). Some of this variation will be related to differences between specialties (see Table 5.3) but even within a specialty, staffing levels and skill-mix vary considerably. This reflects the findings that there is considerable variation in staff and unit costs between hospitals as identified by the Audit Commission in 2010 and the Healthcare Commission in 2005.
Freq
uenc
y pe
rcen
t
Patients:Nurse ratio
10
20
30
00 10.00 20.00 30.00 40.00
Mean = 8.8152
Std. dev. = 4.74013
N = 1,040
Freq
uenc
y pe
rcen
t
Skill mix (RNs as percentage of all nursing staff)
5
10
15
00 20.00 40.00 60.00 80.00
Mean = 60.1132
Std. dev. = 18.30724
N =999
20
25
100.00 120.00
Scotland England Wales Northern Ireland
All NHS nurses
Mean patients per nurse
8.8 8.5 10.5 7.2 8.8
RNs as percentage of all staff
60 59 56 66 60
N = number of nurses
180 543 150 125 998
Source: Employment Research/RCN 2009
Table 5.2 Patient:nurse ratios (all shifts) and skill mix on NHS ward by country
Figure 5.1 Variation in NHS ward staffing, patient:nurse ratios and RNs as percentage of all nurses on duty
Source: Employment Research/RCN 2009

22
GUIdANCE ON SAfE NURSE STAffING LEvELS IN THE UK
Older people Mental health Adult general Paediatric general All specialtiesNumber of beds 27 19 26 20 24Total number of patients 25 17 25 15 23Occupancy 95% 88% 99% 80% 95%Number of registered nurses 2.5 2.1 3.1 3.6 3.1Number of HCAs/auxiliaries 2.7 2.2 2.0 .8 2.0Total staff on duty (RNs + HCAs)
5.2 4.3 5.1 4.3 4.9
RNs as % of all nursing staff 48% 50% 62% 83% 61%Patients per registered nurses(mean across all RNs) 11.3 9.2 9.1 4.6 8.7Patients per member of nursing staff (mean across total staff)
5.2 4.1 5.4 3.8 4.9
Number of cases 103 76 451 124 1011
Patients per RN Patients per nursing staff
2 4 6 8 10 12 14 16 18 20
Independent hospital ward
NHS ward: paediatric general
NHS ward: adult general
NHS ward: mental health
NHS ward: older people
Care home
Table 5.3 Average staffing and patient data – NHS wards by specialty (all shifts)
Figure 5.2 Number of patients per registered nurse/nursing staff by care setting
Source: Employment Research/RCN 2009
Source: Employment Research/RCN 2009
Table 5.3 and figure 5.2 show how ward staffing varies by specialty and by care setting. Paediatric wards have on average a richer skill-mix (83 per cent on duty are RNs compared to 61 per cent across all specialties), and care for fewer patients per RN (an average of 4.6 versus. 8.7 across all specialties). At the opposite end of the spectrum, RNs make up just 48 per cent of the
nursing staff on elderly care wards, and the average ratio is 11 patients per RN. On mental health wards the mix of RNs to all nursing staff is also lower than average, at 50 per cent. In adult on general wards 62 per cent of all nursing staff are RNs and, as in mental health, each RN is responsible for an average of nine patients.
23
ROyAL COLLEGE Of NURSING
A key finding from the survey was the relationship between the number of patients per RN and quality of care (see Section 4.2). On wards with a ratio of six patients or fewer per RN on duty, respondents report that care is rarely or never compromised due to short staffing. But where the ratio is eight or more patients per RN, patient care is described as being regularly compromised by short staffing (at least once or twice a week, if not every shift).
5.2 Staffing in care homes
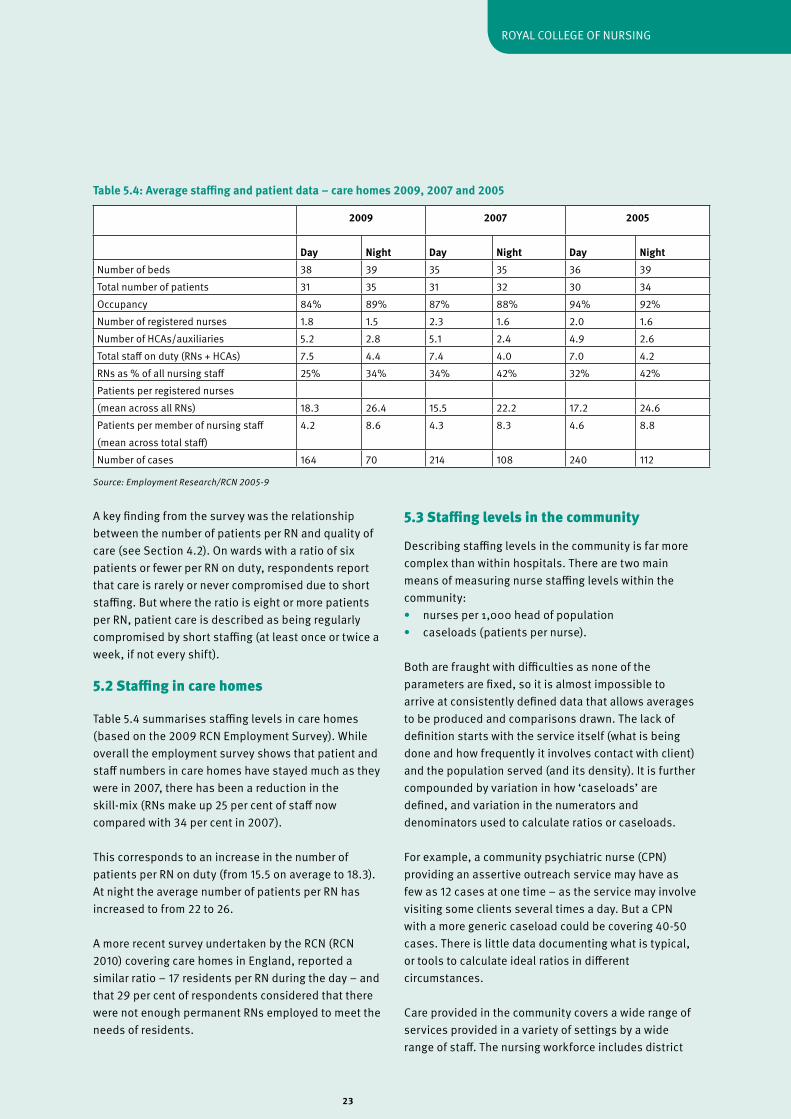
Table 5.4 summarises staffing levels in care homes (based on the 2009 RCN Employment Survey). While overall the employment survey shows that patient and staff numbers in care homes have stayed much as they were in 2007, there has been a reduction in the skill-mix (RNs make up 25 per cent of staff now compared with 34 per cent in 2007).
This corresponds to an increase in the number of patients per RN on duty (from 15.5 on average to 18.3). At night the average number of patients per RN has increased to from 22 to 26.
A more recent survey undertaken by the RCN (RCN 2010) covering care homes in England, reported a similar ratio – 17 residents per RN during the day – and that 29 per cent of respondents considered that there were not enough permanent RNs employed to meet the needs of residents.
5.3 Staffing levels in the community
describing staffing levels in the community is far more complex than within hospitals. There are two main means of measuring nurse staffing levels within the community:• nurses per 1,000 head of population• caseloads (patients per nurse).
Both are fraught with difficulties as none of the parameters are fixed, so it is almost impossible to arrive at consistently defined data that allows averages to be produced and comparisons drawn. The lack of definition starts with the service itself (what is being done and how frequently it involves contact with client) and the population served (and its density). It is further compounded by variation in how ‘caseloads’ are defined, and variation in the numerators and denominators used to calculate ratios or caseloads.
for example, a community psychiatric nurse (CPN) providing an assertive outreach service may have as few as 12 cases at one time – as the service may involve visiting some clients several times a day. But a CPN with a more generic caseload could be covering 40-50 cases. There is little data documenting what is typical, or tools to calculate ideal ratios in different circumstances.
Care provided in the community covers a wide range of services provided in a variety of settings by a wide range of staff. The nursing workforce includes district
2009 2007 2005
Day Night Day Night Day NightNumber of beds 38 39 35 35 36 39Total number of patients 31 35 31 32 30 34Occupancy 84% 89% 87% 88% 94% 92%Number of registered nurses 1.8 1.5 2.3 1.6 2.0 1.6Number of HCAs/auxiliaries 5.2 2.8 5.1 2.4 4.9 2.6Total staff on duty (RNs + HCAs) 7.5 4.4 7.4 4.0 7.0 4.2RNs as % of all nursing staff 25% 34% 34% 42% 32% 42%Patients per registered nurses(mean across all RNs) 18.3 26.4 15.5 22.2 17.2 24.6Patients per member of nursing staff (mean across total staff)
4.2 8.6 4.3 8.3 4.6 8.8
Number of cases 164 70 214 108 240 112
Table 5.4: Average staffing and patient data – care homes 2009, 2007 and 2005
Source: Employment Research/RCN 2005-9
24
GUIdANCE ON SAfE NURSE STAffING LEvELS IN THE UK
nurses, school nurses, health visitors, nurse practitioners, practice nurses, community psychiatric nurses, occupational health nurses and specialist nurses, amongst many others. Most community based nurses are working in complex multidisciplinary teams alongside a wide variety of support staff – hence the boundaries between roles and skill-mix can vary considerably from place to place, or depending on the nature of the service being provided.
At a national level, the workforce is not clearly mapped through government statistics. Census statistics capture the decline in health visitor and district nursing numbers over the past decade across the UK. But the data collection categories lag behind the changes both in nursing provision outside of hospitals and variety in nursing roles, so that there is no comprehensive overview of the numbers of nurses that constitute the community nursing workforce, let alone how these relate to population or client numbers. Added to this, national statistics mask the wide variation in recruitment and retention issues between different areas/PCTs (Storey et al., 2007).
Thus there is a real lack of data on nurse staffing levels in the community, and the data that does exist needs to be treated with caution to ensure that like is compared with like. With this in mind, the following outline some of the statistics reported:• health visitor caseloads vary greatly – in 2009 the Community Practitioners and Health visitors Association reported that around one-in-five health visitors have a caseload of more than 1,000 families and recommended that caseloads should be between 250-350 per health visitor, depending on client need and level of support • school nurses – the 2009 RCN member survey reported that school nurses in the state sector across the UK covered an average of seven or eight schools each, and 2,590 pupils • practice nurses – according to a report in 2004 from the Royal College of General Practitioners, the absence of accurate workforce data made it nigh on impossible to undertake meaningful workforce planning.
The Cumberlege Report (dH, 1986) called for more intelligent and informed community nurse workforce
planning. yet a quarter of a century on, workforce experts report that within the community: “Workforce size and mix are historical and irrational at best. Moreover, the number of variables that influence staffing is growing, thereby complicating workforce planning” (p.757, Hurst 2006). This paper describes work in 2002 to establish a single database, pooling workforce data from 43 separate databases, to enable primary and community care mangers in to evaluate the size and mix of their workforce, and relate this to changing service demands (by profiling the demographics, morbidity/mortality, and socio-economic variables in 304 English PCTs). The paper puts forward an integrated set of primary and community care workforce planning and development variables and related data which can easily be interrogated for benchmarking and operational and strategic management purposes.
Key points • While at a national level the number of RNs in the NHS has risen, capacity increases would appear to have absorbed this additional workforce and ward level staffing recorded in the RCN employment surveys has not increased. • An ‘average’ NHS ward has 24 beds, 97 per cent of which are filled, and is staffed with 3.3 RNs and 2.2 support workers (RCN 2009 survey).• Bed occupancy and patient throughput has increased dramatically over the last 20 years. • In 2005 the RCN Employment Survey established that the average skill mix ratio on general hospital wards was 65 per cent registered nurses, 35 per cent unregistered, and this was taken up by the RCN as a benchmark minimum in its 2006 guidance. • Skill-mix on acute hospital wards has become more dilute – on average RNs made up 60 per cent of total nursing staff on duty during the day in NHS wards in the UK in 2009 (compared with 65 per cent in 2005). • Both the skill-mix and the number of patients per RN vary considerably. Some of this variation is related to specialty (and differing services needs) but the RCN would question whether it is acceptable that care of the elderly and mental health wards should have such a dilute skill mix. • On average wards that have a ratio of no more than six patients per RN on duty rarely or never report
25
ROyAL COLLEGE Of NURSING
that care is compromised due to short staffing. A ratio of eight or more patients per RN is associated with patient care regularly being compromised by short staffing (from once or twice a week to every shift).• In care homes there is an average ratio of 18 patients per registered nurse during the day, and 26 patients per RN at night. • There is a real lack of data on nurse staffing levels in the community, and what data does exist needs to be treated with caution to ensure that like is being compared with like – definitions of both the numerators (in terms of staff) and denominators (in terms of populations served) can vary hugely.
26
GUIdANCE ON SAfE NURSE STAffING LEvELS IN THE UK
Planning nurse staffing 6.1 Workforce planning at different levels – the theory
This section considers the different approaches taken to setting staffing levels and planning the mix needed to deliver nursing care. To put these approaches into context and make sense of each, we need to consider the parameters that underpin workforce planning generally. Workforce planning is undertaken at different levels – national, regional or local – and can be categorised by level/purpose into three main types of activity: • workforce modelling – using a prediction of future care needs (based heavily on current provision) to anticipate the likely demand for nursing staff. Calculations of the anticipated flow into and out of the profession/labour market are used to predict the number of nurses required to meet demand (in order to inform workforce training plans).• establishment setting – determining or reviewing the funded establishment of nursing posts required for a specific service. This is the focus of many of the tools/approaches available (and outlined later), that typically seek to identify the nursing posts needed to staff a particular ward, unit, home or community.• daily planning/rostering – matching the staff deployed to variation in workload. focus is on regular review of the patient mix (as a predictor of associated nursing workload) to ensure that the nursing staff scheduled to work is adequate relative to demand for care anticipated at particular time of the week/year, or for particular shift (see, for example, the NHS Employers’ 2007 guide on electronic rostering).
While associated with different approaches, these three types of staff planning are strongly related to one another. Ideally, the data used to relate workload to staffing required per shift on a daily basis would also be used to determine the funding an establishment needs to provide the required daily staffing across the year. And aggregating the funded staffing establishments across a region would provide a measure of the total volume of service needed against which future workforce plans could be titrated (modelling to take into account anticipated changes in demand and supply variables).
Generally workforce planning at the different levels is not well integrated, although steps have been taken to remedy this situation in Scotland. A report by Audit Scotland in 2002 identified the need for better integration of workforce development systems in NHS Scotland. Little was known about how NHS provider organisations plan staffing, and it was reported that there was ‘significant variation in the availability of information at trust and ward level, limiting the ability of Trusts and ward managers to establish whether their use of nursing staff is cost effective’ (Audit Scotland, 2002). The Nursing and Midwifery Workload and Workforce Planning group was established to develop a ‘whole systems’ approach to workforce planning; to develop and jointly agree tools for different settings that could be rolled out nationally. Use of the tools and workforce planning has been supported by a ‘learning toolkit’ (NHS Education for Scotland, 2008) aimed at senior charge nurses and other clinical leaders/mangers at local level.
At all three levels – whether planning the workforce for a country or the staffing needed to provide a service on a day of the week – there is common goal, which is to try and quantify the volume of nursing work to be provided, and then translate this into the number of people with the right skills. This is the fundamental principle underlying many of the approaches to setting staffing levels that are outlined later in this chapter.
Predicting the number of staff required to provide safe care to an agreed standard cannot simply be based on the number of patients/clients requiring care, or even on a measure of workload related to patient need or ‘dependency’. The volume of care required may be the primary factor in determining staffing, but it is not the only one. A host of factors affect the nurse staffing and skill mix needed, as the model in figure 6.1 illustrates.
We consider some of these in greater detail before moving on to look at the ways in which nurse staffing is planned and the systems available to support planning.
6
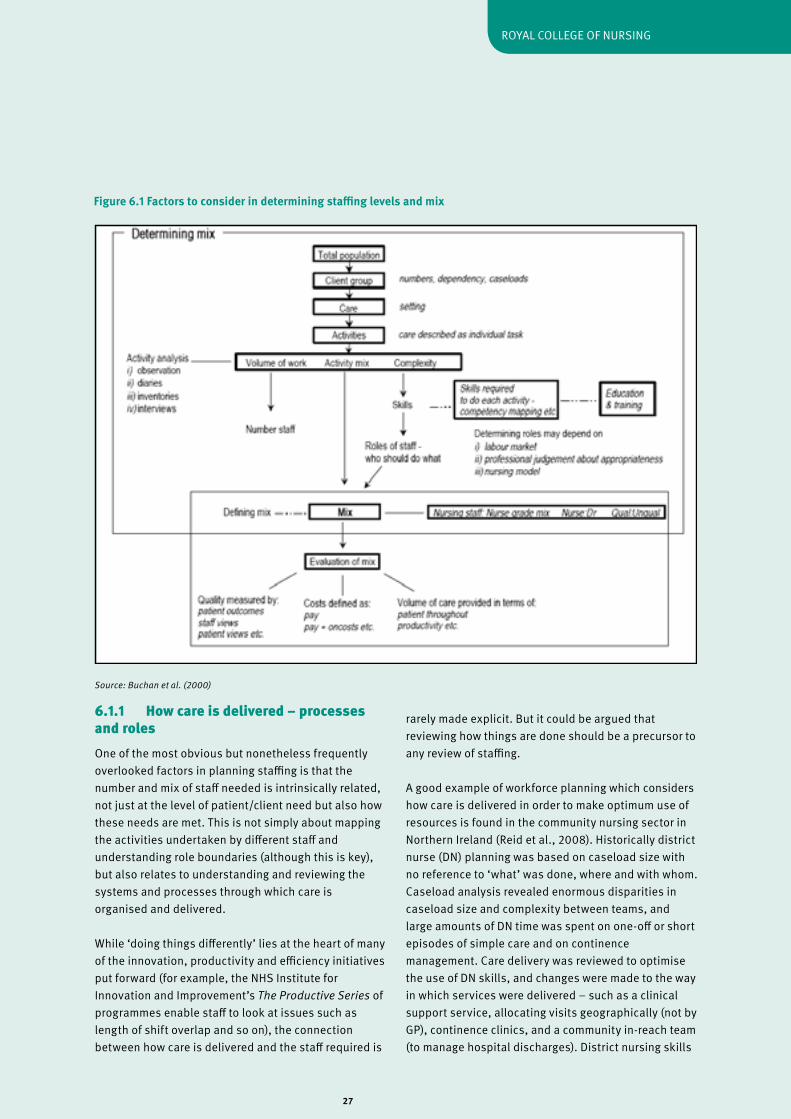
27
ROyAL COLLEGE Of NURSING
6.1.1 How care is delivered – processes and roles One of the most obvious but nonetheless frequently overlooked factors in planning staffing is that the number and mix of staff needed is intrinsically related, not just at the level of patient/client need but also how these needs are met. This is not simply about mapping the activities undertaken by different staff and understanding role boundaries (although this is key), but also relates to understanding and reviewing the systems and processes through which care is organised and delivered.
While ‘doing things differently’ lies at the heart of many of the innovation, productivity and efficiency initiatives put forward (for example, the NHS Institute for Innovation and Improvement’s The Productive Series of programmes enable staff to look at issues such as length of shift overlap and so on), the connection between how care is delivered and the staff required is
rarely made explicit. But it could be argued that reviewing how things are done should be a precursor to any review of staffing.
A good example of workforce planning which considers how care is delivered in order to make optimum use of resources is found in the community nursing sector in Northern Ireland (Reid et al., 2008). Historically district nurse (dN) planning was based on caseload size with no reference to ‘what’ was done, where and with whom. Caseload analysis revealed enormous disparities in caseload size and complexity between teams, and large amounts of dN time was spent on one-off or short episodes of simple care and on continence management. Care delivery was reviewed to optimise the use of dN skills, and changes were made to the way in which services were delivered – such as a clinical support service, allocating visits geographically (not by GP), continence clinics, and a community in-reach team (to manage hospital discharges). district nursing skills
Figure 6.1 Factors to consider in determining staffing levels and mix
Source: Buchan et al. (2000)
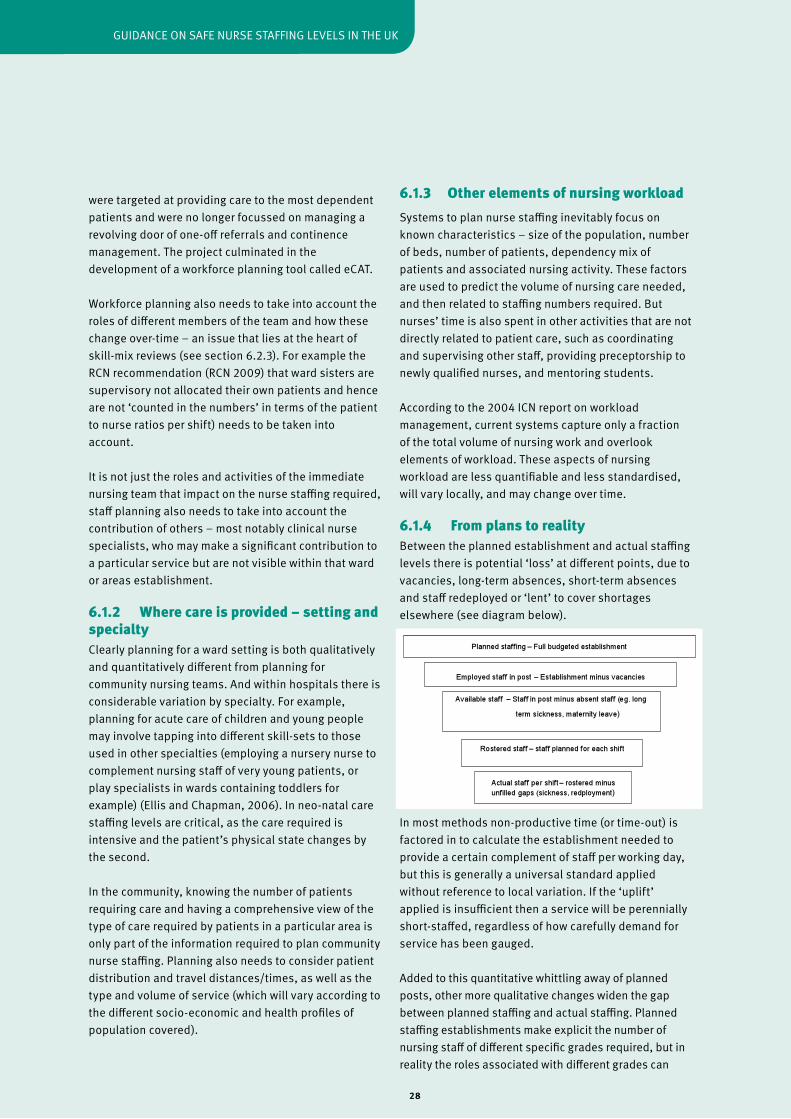
28
GUIdANCE ON SAfE NURSE STAffING LEvELS IN THE UK
6.1.3 Other elements of nursing workloadSystems to plan nurse staffing inevitably focus on known characteristics – size of the population, number of beds, number of patients, dependency mix of patients and associated nursing activity. These factors are used to predict the volume of nursing care needed, and then related to staffing numbers required. But nurses’ time is also spent in other activities that are not directly related to patient care, such as coordinating and supervising other staff, providing preceptorship to newly qualified nurses, and mentoring students.
According to the 2004 ICN report on workload management, current systems capture only a fraction of the total volume of nursing work and overlook elements of workload. These aspects of nursing workload are less quantifiable and less standardised, will vary locally, and may change over time.
6.1.4 From plans to realityBetween the planned establishment and actual staffing levels there is potential ‘loss’ at different points, due to vacancies, long-term absences, short-term absences and staff redeployed or ‘lent’ to cover shortages elsewhere (see diagram below).
In most methods non-productive time (or time-out) is factored in to calculate the establishment needed to provide a certain complement of staff per working day, but this is generally a universal standard applied without reference to local variation. If the ‘uplift’ applied is insufficient then a service will be perennially short-staffed, regardless of how carefully demand for service has been gauged.
Added to this quantitative whittling away of planned posts, other more qualitative changes widen the gap between planned staffing and actual staffing. Planned staffing establishments make explicit the number of nursing staff of different specific grades required, but in reality the roles associated with different grades can
were targeted at providing care to the most dependent patients and were no longer focussed on managing a revolving door of one-off referrals and continence management. The project culminated in the development of a workforce planning tool called eCAT.
Workforce planning also needs to take into account the roles of different members of the team and how these change over-time – an issue that lies at the heart of skill-mix reviews (see section 6.2.3). for example the RCN recommendation (RCN 2009) that ward sisters are supervisory not allocated their own patients and hence are not ‘counted in the numbers’ in terms of the patient to nurse ratios per shift) needs to be taken into account.
It is not just the roles and activities of the immediate nursing team that impact on the nurse staffing required, staff planning also needs to take into account the contribution of others – most notably clinical nurse specialists, who may make a significant contribution to a particular service but are not visible within that ward or areas establishment.
6.1.2 Where care is provided – setting and specialtyClearly planning for a ward setting is both qualitatively and quantitatively different from planning for community nursing teams. And within hospitals there is considerable variation by specialty. for example, planning for acute care of children and young people may involve tapping into different skill-sets to those used in other specialties (employing a nursery nurse to complement nursing staff of very young patients, or play specialists in wards containing toddlers for example) (Ellis and Chapman, 2006). In neo-natal care staffing levels are critical, as the care required is intensive and the patient’s physical state changes by the second.
In the community, knowing the number of patients requiring care and having a comprehensive view of the type of care required by patients in a particular area is only part of the information required to plan community nurse staffing. Planning also needs to consider patient distribution and travel distances/times, as well as the type and volume of service (which will vary according to the different socio-economic and health profiles of population covered).
29
ROyAL COLLEGE Of NURSING
gradually shift – as new responsibilities or activities are added or subtracted. Thus, the planned establishment no longer provides the expected mix of roles.
And the planned establishment itself can become distorted as piecemeal changes are introduced. for example, vacant posts may be lost from the establishment (due to funding constraints or in response to recruitment difficulties) or individual posts are downgraded, without a review of overall staffing requirement. Hence the need for regular review to ensure that the planned complement of nursing staff is adequate to meet patient need.
But regardless of the system used to plan staffing levels, good rostering is essential to ensure that staffing levels on each shift are sufficient to meet patient demand. Electronic rostering is used by many organisations and the commercial systems claim to be cost-efficient, although as yet there is little independent evidence of their effectiveness.
6.2 Approaches to planning at local level In its report on ward staffing the Audit Commission (2001) recommended that establishment setting, regardless of the method, must be simple, transparent, integrated, benchmarked and linked to ward outcome measures (p.8). The Standing Committee position paper (2002) on key issues for nursing skills mix in the context of workforce planning noted the enormous literature around workforce planning offering a ‘bewildering choice’ of methods/approaches, commenting that this whole area needed refinement.
In this section we outline the different approaches that can be used to plan nurse staffing. Most of the methods are aimed at setting the establishments required to deliver a particular service (and most commonly staffing for acute wards). The level of detail – both in terms of the data input and the results produced – vary greatly. At one end of the spectrum are crude nurse to population ratios (a ‘top down’ method) whilst at the other are systems that take into account patient mix and dependency, the nature of activity undertaken for different types of patients by different staff, and the layout of a ward, in order to calculate both the level and mix of nursing staff required (so-called ‘bottom-up’ approaches).
All systems described below have strengths and weaknesses; some are simple, others complex; some are time/resource hungry others are less time consuming, but rely on less locally specific data and so are less ‘customised’. Many use complex equations/ calculations and supporting spreadsheets/technology.
There are two broad types of approach to workforce planning: top-down and bottom-up. While they can be used in isolation of one another, they are best considered as complementary approaches.
Top-down planning involves the use of existing health care data to calculate staffing levels based on a formula. These methods are generally based on inter-hospital comparison (benchmarking) and population need. Staffing ratios are an example of a top-down methodology, for example using the number of occupied beds as a measurement of service capacity, and then relating this to the number nurses per bed. Hurst (2006) argues that the increased public availability of large detailed data sets and the publication of health service provider ‘league tables’ have fuelled a revival in benchmarking and top-down perspectives on nurse staffing. This approach can be useful as a first stage to determine the likelihood that staffing locally requires review or can be a useful adjunct to bottom up methods.
Bottom-up methods of planning are based on identifying and quantifying the factors which influence a nurse’s workload. for example taking into account how unwell patients are (or their ‘acuity’), their level of dependence on nursing interventions and the work associated with likely activity (for example, number of patients going to theatre), in order to calculate staffing levels. The two key factors considered in this approach are patient dependency/acuity and nursing workload.
Top-down methods are more remote and used by workforce planners in health care management, whereas bottom-up methods are frequently associated with planning at local or ward level. Within these two main approaches there is a subset of methods which are used to plan demand/set establishment levels.
Hurst’s report of 2002 is the most recent comprehensive review of nurse workforce planning systems to have been undertaken. He identifies five key
30
GUIdANCE ON SAfE NURSE STAffING LEvELS IN THE UK
demand side workforce planning methods which appear most often in the literature as: • professional judgement (Telford) approach• nurses per occupied bed (NPOB)• acuity-quality• timed-task/activity approaches• regression based systems
Although there has not been a recent review of which methods are used across the NHS, these appear to be the most frequently used methods of assessing staff needs, and they form the basis of the Nuffield Nursing Workforce Planning Tool. Set up and maintained by Keith Hurst of the Health and Social Care Centre, University of Leeds, the tool presents spreadsheets to enable ward staffing to be calculated using one of three methods: professional judgement (a generic tool applicable to all settings), nurses per occupied bed (using specialty-specific multipliers based on best practice wards) and the acuity-quality method (using locally-determined patient dependency data). Using the different methods allows calculations to be triangulated and ‘what if’ scenarios to be undertaken. Advice, details and support documents (including a review of approaches to staff planning) can be found at the Skills for Health Healthcare Workforce portal at www.healthcareworkforce.nhs.uk.
6.2.1 Outline of methods for planning nurse staffing The main approaches to planning staffing are outlined below. details of the specific tools referred to are presented in Appendix 2.
Incremental approaches (top-down)This is a relatively simple way of estimating future need based simply on adding an incremental percentage to the current establishment to reflect, for example, waiting list targets, or theatre targets. The disadvantage of this approach is that it does not consider ‘actual’ needs or demographic change, neither does it allow for the fact that the current staffing establishment may be incorrectly calibrated.
Benchmarking (top-down) for example the Maternity Matters databaseMuch patient and workforce-related data is collected in the course of running a trust and this can be used to make inter-trust comparisons. This approach
challenges the use of historical staffing patterns. However, care must be taken in using benchmarking as ‘norms’, as often data collected for other purposes may not be valid and reliable for use in this way. Historically there has been an issue with sporadic and inconsistent data collection in health care settings (Buchan and dal Poz, 2002). There is also an issue with staff buy-in as there is no workforce involvement in this method.
The resurgence in top-down methods means that more sophisticated data collection systems are available – for example dr foster, the Care Quality Commission, the NHS Benchmarking database, and the National Workforce Project’s hospital workforce planning database (Hurst, 2006). The latter uses data from comparative work areas/wards to examine the effects of high and low quality/numbers of ward staffing. This may be used as a starting point to gain a ‘ball-park’ of staffing requirements, or to gauge how staffing in one place relates to the average for a matched comparator group. for example, using benchmark data, the number of beds per nurse is examined for a failing hospital and is shown to be well below the benchmark average of 1.47 beds per nurse, compared to a benchmark of 1.41 (Hurst, 2010). But a major caveat here is the quality and reliability of the data used to form ‘benchmarks’. Thus it is recommended that top-down benchmarks should be complemented by other approaches which take account of patient dependency/acuity/local variations in workload (Hurst, 2006).
Population and health needs based methods (top-down) – district nursingThis approach is based on demographic data reflecting social, economic and environmental determinants of health. In England, this kind of data is available by PCT for download from www.healthcareworkforce.org.uk. The data can be used to assess skill mix/numbers of staff needed and comparisons (benchmarking) can be made with other PCTs. It is particularly useful for dN workforce planning, as socio-economic data is included and can be used to estimate concentration of chronic illness in certain areas. A Scottish Health Executive report (2004) noted that this was the most common dN workforce planning approach and one which most dNs support the use of in the future. Workforce planning in Scotland is being further developed to refine the assessment of different populations, using multi-dimensional analysis to identify districts with similar profiles.
31
ROyAL COLLEGE Of NURSING
Staffing ratio approaches (top-down) – for example, the RN/RPN utilization toolkit in CanadaThis is the calculation of demand based on some measurement service capacity, for example the number of occupied beds (NPOB – see below). Often set at the ‘minimum’ staff required, rather than an aspirational figure. Again, a simplistic approach and it does not consider that there are many interrelating factors which impact on service demand. Staff ratios also tend to consider particular roles in isolation (for example number of RNs to occupied beds), rather than taking a holistic approach of patient care which considers the whole team. Ratios are also time specific in that they do not allow for any changes in working practice or new technology.
Nurse per occupied bed method (using benchmarking data for actual worked establishments)This is a simple method using a standard formula (broken down by nursing grade) based on ‘actual’ establishment figures rather than funded (because actual encompasses variables such as overtime, agency and bank hours). It deals with indirect care, associated work and leave/absence by building in ‘time-out- and ‘overhead’ allowances to the formula.
The method is useful to benchmark wards and to verify professional judgement results. Its key feature is its ability to adjust nursing establishments due to ward bed complement changes. Staffing and grade mix formulas use data which is collected systematically (for example, bed occupancy, payroll and so forth) and formulas are speciality specific.
A major disadvantage is that this method relies on the assumption that baseline staffing has been rationally determined. The system is not good when there are patient dependency/ acuity changes or a high bed throughput. formulas are expensive to update and routinely collected data may be prone to error as there is no built-in ‘sanity check’. finally, the approach does not cater for local variation in deployment.
Professional judgement/consultative approach (bottom-up) – TelfordA popular consensus method which has stood the test of time; in a 2003 survey (Waters and Andalo, 2003) this approach was reported as being used by 16 per cent of trust managers. An experienced nurse uses
professional judgement to assess the number and mix of a nursing team, converting duty rosters into full time equivalent staff (fTE) using a simple formula. The three stages are as follows:• an experienced nurse judges the acceptable levels/ mix of staff per shift• this is converted into fTE using a simple formula • a percentage allowance is added in to cover leave/ absence.
The key advantages of this method are its simplicity and low cost. It is also quick to use and applies to a range of specialities. It can be easily adjusted to account for any changes in role capacity, technology and policy (Hurst, 2006; Hurst, 2002). This is a fluid, flexible approach which is easy to review on a regular basis and is popular at ward level. In hospitals, the professional judgement of ward sisters is seen as pivotal to effective resource management (RCN 2009).
While the approach does not formally incorporate a measure of quality, nurses use their professional judgement and experience to determine the staffing requirement to provide care to the agreed standard. But the development of nursing metrics and nursing sensitive indicators provides scope for more systematic monitoring of quality alongside professional judgement. As with many of the establishment setting tools, the method does not account for daily fluctuations in patient numbers or acuity/ dependency. It is recommended that when using this method another is used to complement it – in order to triangulate. Similar results from two or more approaches would provide greater confidence for decision making.
Workload measurement based approaches (bottom-up)Calculation of staffing needs based on examination of patient demands (acuity/dependency). Many different systems have been developed and used since the 1960s and continue to evolve today. These are good at involving staff and taking account of local factors. Most workload measurement approaches involve an element of professional judgement. The following two methods are workload measurement based approaches:
32
GUIdANCE ON SAfE NURSE STAffING LEvELS IN THE UK
a) Acuity-quality method – for example, Nursing Workforce Planning Tool, AUKUH, eCAT, GOSHman PANDA
The full title is dependency-Activity-Quality Method. The method evaluates size/mix of nursing teams to match ward activity (based on assessment of patient dependency). Its big strength is that it takes into consideration specialty variation and local variation in staff activity/deployment patterns. It can be particularly useful in areas where patient needs fluctuate considerably, and staffing needs regular reviews.
Patients are categorised using dependency scores, and the amount of nursing time needed for each patient within a category is calculated. This method gives the nursing workload per bed (bed acuity) and number of hours required by dependency level (WLI or Workload Index). Once the direct time care for all patients is calculated then a percentage is factored in to cover mealtimes/breaks and an allowance (typically 22 per cent) is added in to reflect leave (paid/unpaid/training time out and so on).
When undertaken from scratch, this is a time-consuming method but one which overcomes many weaknesses of the previous two methods. A key advantage is that it ensures staff can be deployed where need is greatest, thus making workloads equitable and ensuring value for money. Once the system is set up staff can be calculated for individual shifts, and the information may also be used to provide nursing performance indicators/benchmarks (for example, nursing cost per occupied bed). As a result the tool holds appeal for non-clinical management as it is good for comparable and budgetary purposes; it also appeals to clinical staff as it involves staff in the process.
The method may be reversed to examine ward occupancy/patient dependency based on available nursing resources – thus supporting important decisions on ward capacity. The method can add to nurse workload as it is data hungry in terms of patient information and requires nurse observers (usually two for several days) when capturing/verifying new data. It is not recommended for
long-term forecasting. Another weakness, although one that applies to the other systems as well, is that it does not capture the psychological element of patient needs.
AUKUH (Smith et al., 2009) is based on this method, but uses generic ‘multipliers’ to calculate staffing related to patient dependency (based on the dataset managed by Keith Hurst that underpins the Nuffield Nursing Workforce Planning Tool) as opposed to specialty specific or locally-defined data.
It could be argued that the acuity-quality method in the Nuffield Nursing Workforce Planning Tool offers the best compromise – it does not require any new activity data to be captured (which is the most time consuming aspect of the method) but uses a well established dataset based on observation at a large number of units (all of which meet quality assessment criteria), to provide specialty specific ‘multipliers’ to calculate staffing on the basis of patient dependency mix. It also allows for local adjustments to the percentages allowed for meal breaks, and time out (sickness absence). b) Timed-task/activity method – for example, The Brighton Method, GRASP, Birthrate+
This approach considers the number of variables which impact on nurses’ time. In its basic form it is a patient care plan with added nursing minutes required per activity/ intervention; this then generates the number of nursing hours needed. Each patient’s daily direct nursing care needs are recorded from a locally developed checklist of timed interventions. An overhead is added to account for indirect care and breaks are deducted.
The advantage over the acuity-quality method is that it is based on activity related to the specific mix of patient needs, rather than categorising patients into dependency groups with fixed parameters of what constitutes each dependency level (1, 2, 3 or 4 for example).
This method is easily computerised and can form part of a nursing information system - an example of this is GRASP - enabling staffing to meet fluctuations in workload. However this method is
33
ROyAL COLLEGE Of NURSING
time hungry and time spent on maintenance of detailed care plans may add considerably to the overall nursing workload. Off-the-shelf systems are expensive and time consuming to set up and implement; however this tends to be a capital financial/time cost. The system does not lend itself to application across a variety of ward settings and does not accommodate diversity within a ward well. finally, nurse buy-in may be hampered because of the ‘work-study’ nature of the approach.
Formulae/activity-based/regression analysis method (bottom-up) – for example TeamworkAn example of this is Teamwork (developed by NW Regional Health Authority in the late 1980s) was a favoured approach in the 1980s; its statistical analysis (based on multiple regression) approach uses predictors (independent variables or Ivs) such as bed occupancy, planned admissions and day surgery to forecast number/mix of staff needed (dependent variables dvs) for particular time periods (shifts, weekends, days, and so forth). Again, this is time/situation specific. Teamwork replaced the Criteria for Care and Brighton methods in the 1980s, having fallen out of favour following a review by a team of nurses, operational research analysis and health service managers which judged these to be unsuitable (Baghurst et al., 1988).
While a report by the Audit Commission in 1992 identified Teamwork as a quick cost-effective solution, there were concerns that this method might replicate historically based patterns of staffing: ’The outcomes of regression models tend to be corroborated with independent evidence. Consequently staffing formulas are judged valid, reliable and also more usable than the detailed and expensive acuity-quality and timed-task/activity methods’ (Hurst 2002, p.13).
The method is good for situations where prediction is possible – for example day surgery – and is cross-speciality friendly. disadvantages are that it is complex to set up and it is wise to employ a professional statistician do this. Once set up, however, it is simple to maintain and use, and all that needs to be known is the Iv value in order to predict the number of staff. So the key work required here is in the set up of the base data and the system. Because regression analysis is not necessarily a linear relationship, it should not be used to extrapolate from say 20 bed wards to 30 bed
wards. Its complexity and lack of nurse involvement at inception may translate to a low buy-in from staff members.
6.2.2 Problems with using staffing level ‘systems’Ownership/commerciality: many tools appear to have started life as in-house remedies to staffing problems (for example, eCAT, the Brighton Method, GOSHman PANdA). This can present issues of ownership – sometimes the originators of the tool appear to have transferred the development rights and the tool has then become a costly capital expense for organisations wishing to buy it off the shelf. The extent of this as a problem is difficult to determine without a more in-depth review; however as an example, the Scottish Executive comments that it successfully piloted the GOSHman PANdA tool with a recommendation to roll-out on a national basis, but that this was not enacted due to it becoming a commercial tool.
Information/accessibility: information about many of the tools’ development and use is often difficult to find and patchy at best. Even with relatively well known tools, accessing the tool or a guide as to how it works and what it does can be a problem. There needs to be a more transparent way or a ‘one stop shop’ that allows service providers to review the tools on offer and access information about these more easily.
Consistency/reliability: limited independent research means there is little or no guidance on the validity and reliability of the tools. Much of what is available is written by the tool developers, sponsors or commercial owners, all of whom have vested interests. do the different systems produce similar results? Are they equally effective at planning staffing? for commercial tools, do they offer good value for money or are freely available systems just as effective?
Data issues: users need to be made aware of the limitations/impact/ parameters of data used – what you put in is what you get out.
Lack of clear recommendation/validation: unlike Scotland, there is no single approach or set of approaches recommended by department of Health for use in England. Tools are ‘out there’ and there is no one document/site which gives complete information on what’s available, how it works, strengths and
34
GUIdANCE ON SAfE NURSE STAffING LEvELS IN THE UK
weaknesses and how to access it, or any cross referencing of the relationship between different but similar systems (such as Safer Nursing Care tool, AUKUH, and the Nursing Workforce Planning Tool).
Evaluation of effectiveness: the scattergun approach to the development of planning tools means that there is little organised, sophisticated and independent evaluation. The problem has been that there is little independent review of the systems that exist. Outside of Scotland tools have rarely been validated and there is no national guidance regarding best approaches to determining nurse staffing required. Given that nurses deliver the majority of all health care provided and represent the largest cost of care delivery, this is a major omission. Workload tools and approaches to planning nurse staffing to ensure safe and effective care should be reviewed and scrutinised as rigorously as individual medical interventions and procedures are, through systems such as NICE.
6.2.3 Reviewing skill-mixWorkload measurement tools may capture workload demands in order to plan staffing levels, but few give a clear idea of mix of employees or skills needed to deliver safe, quality and effective patient care.
Skill-mix reviews are prompted by different drivers for change, for example in response to staff shortages, quality issues or cost containment. The different ‘drivers’ and contexts within which skill-mix reviews take place lead to different responses. It is argued that skill-mix review or change is not always the appropriate or effective course of action, and other interventions should be considered either prior to or alongside any action (Buchan and dal Poz, 2002).
There are broad contextual issues to consider before selecting an approach, and workforce planners need to consider the assessment of patient care needs, staff capacity and work setting. for a useful implementation checklist see McGillis Hall and Buch (2009), specifically Table 4 (p.28) which was adapted from ANA (1999). This checklist covers factors to consider:• factors to consider prior to implementing a change in skill mix• selecting an approach for a change in skill mix to address various drivers• specific indicators to consider (patient/staff/health care setting or institution).
Eight distinct approaches to determining skill-mix, mostly at the local level, are identified in a WHO discussion paper (2000); as outlined in Table 6.2.
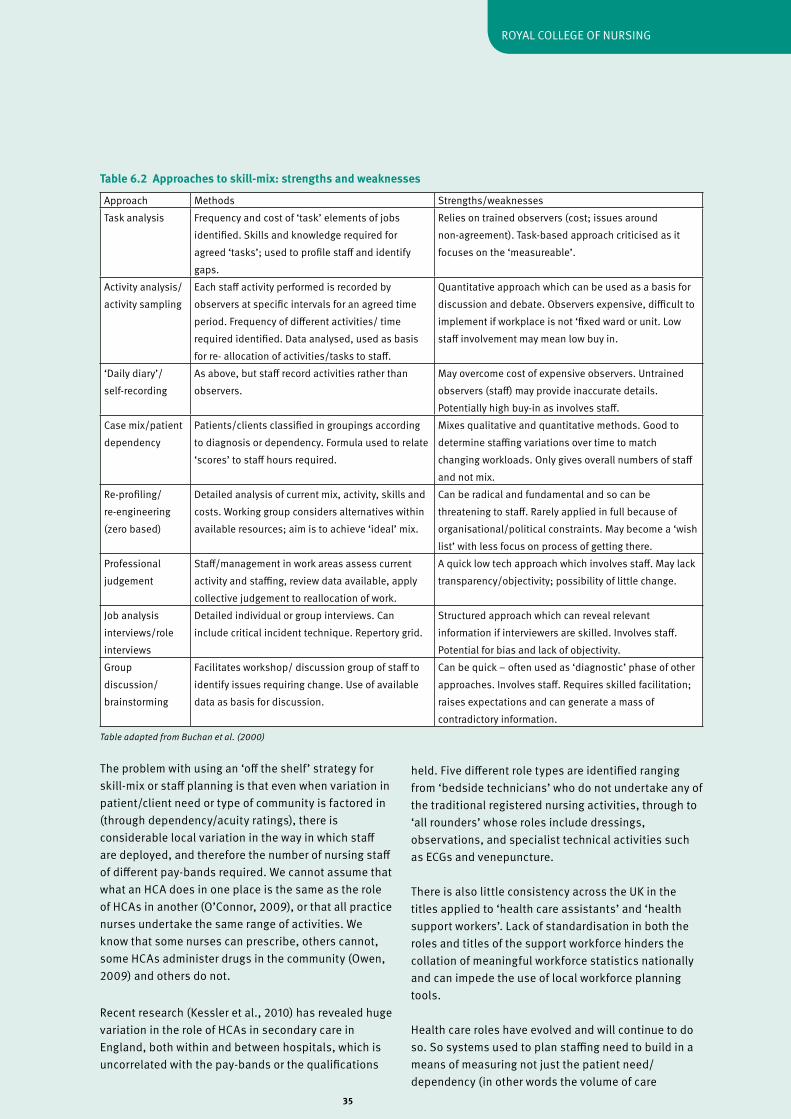
35
ROyAL COLLEGE Of NURSING
Table adapted from Buchan et al. (2000)
The problem with using an ‘off the shelf’ strategy for skill-mix or staff planning is that even when variation in patient/client need or type of community is factored in (through dependency/acuity ratings), there is considerable local variation in the way in which staff are deployed, and therefore the number of nursing staff of different pay-bands required. We cannot assume that what an HCA does in one place is the same as the role of HCAs in another (O’Connor, 2009), or that all practice nurses undertake the same range of activities. We know that some nurses can prescribe, others cannot, some HCAs administer drugs in the community (Owen, 2009) and others do not.
Recent research (Kessler et al., 2010) has revealed huge variation in the role of HCAs in secondary care in England, both within and between hospitals, which is uncorrelated with the pay-bands or the qualifications
held. five different role types are identified ranging from ‘bedside technicians’ who do not undertake any of the traditional registered nursing activities, through to ‘all rounders’ whose roles include dressings, observations, and specialist technical activities such as ECGs and venepuncture.
There is also little consistency across the UK in the titles applied to ‘health care assistants’ and ‘health support workers’. Lack of standardisation in both the roles and titles of the support workforce hinders the collation of meaningful workforce statistics nationally and can impede the use of local workforce planning tools.
Health care roles have evolved and will continue to do so. So systems used to plan staffing need to build in a means of measuring not just the patient need/dependency (in other words the volume of care
Approach Methods Strengths/weaknessesTask analysis frequency and cost of ‘task’ elements of jobs
identified. Skills and knowledge required for agreed ‘tasks’; used to profile staff and identify gaps.
Relies on trained observers (cost; issues around non-agreement). Task-based approach criticised as it focuses on the ‘measureable’.
Activity analysis/activity sampling
Each staff activity performed is recorded by observers at specific intervals for an agreed time period. frequency of different activities/ time required identified. data analysed, used as basis for re- allocation of activities/tasks to staff.
Quantitative approach which can be used as a basis for discussion and debate. Observers expensive, difficult to implement if workplace is not ‘fixed ward or unit. Low staff involvement may mean low buy in.
‘daily diary’/self-recording
As above, but staff record activities rather than observers.
May overcome cost of expensive observers. Untrained observers (staff) may provide inaccurate details. Potentially high buy-in as involves staff.
Case mix/patient dependency
Patients/clients classified in groupings according to diagnosis or dependency. formula used to relate ‘scores’ to staff hours required.
Mixes qualitative and quantitative methods. Good to determine staffing variations over time to match changing workloads. Only gives overall numbers of staff and not mix.
Re-profiling/re-engineering (zero based)
detailed analysis of current mix, activity, skills and costs. Working group considers alternatives within available resources; aim is to achieve ‘ideal’ mix.
Can be radical and fundamental and so can be threatening to staff. Rarely applied in full because of organisational/political constraints. May become a ‘wish list’ with less focus on process of getting there.
Professional judgement
Staff/management in work areas assess current activity and staffing, review data available, apply collective judgement to reallocation of work.
A quick low tech approach which involves staff. May lack transparency/objectivity; possibility of little change.
Job analysis interviews/role interviews
detailed individual or group interviews. Can include critical incident technique. Repertory grid.
Structured approach which can reveal relevant information if interviewers are skilled. Involves staff. Potential for bias and lack of objectivity.
Group discussion/ brainstorming
facilitates workshop/ discussion group of staff to identify issues requiring change. Use of available data as basis for discussion.
Can be quick – often used as ‘diagnostic’ phase of other approaches. Involves staff. Requires skilled facilitation; raises expectations and can generate a mass of contradictory information.
Table 6.2 Approaches to skill-mix: strengths and weaknesses
36
GUIdANCE ON SAfE NURSE STAffING LEvELS IN THE UK
required), but a means of measuring which type of care is delivered by which staff groups.This becomes increasingly pertinent as new roles develop, such as the ‘assistant practitioner’ and other roles at Band 4. To plan the number of registered nurses needed requires a clear understanding of the activities being undertaken by other members of the team and level of support that they require.
6.2.4 Mandated staffing levels (nurse:patient ratios) In the UK, while there are some national staffing recommendations related to particular specialist areas such as intensive care, midwifery and acute paediatric care (see Appendix I), nurse staffing levels are not mandated in law. Standardised and mandatory nurse to patient ratios were introduced in California, USA and victoria, Australia in response to staffing crises.
USA – CaliforniaLegislation introduced in 1999 was implemented in 2004 and California became first state to have mandated minimum licensed nurse: patient ratios in acute care hospitals (set by specialty – for example, a minimum of 1:5 on medical/surgical wards). A patient classification system (PCS) was established as part of the legislative requirement (Buchan, 2004).
Although it might be expected that minimum RN: patient ratios would have increased costs, there is no research evidence that this is the case (McGillis Hall and Buch, 2009). Initial research (donaldson et al., 2005; Bolton et al., 2007) did not find evidence of an impact on patient outcomes, or a reduction in adverse events. However, research published in 2010 by Aiken reports that Californian hospital nurses typically cared for one patient less than nurses in other states, and that the lower caseload was significantly related to lower patient mortality.
Australia – VictoriaLegally mandated in the public sector, in 2001 minimum nurse: patient ratios were introduced (for example 1:4 plus one in charge on medical/surgical wards), in order to improve workforce via increased recruitment and retention of staff. Hospitals not meeting these conditions could face closure. In 2004 the nurse: patient ratio was modified to 5:20. This adjustment focuses staffing at the ward/unit level rather than on individual case-loads, and aims to give more flexibility
in terms of distribution of resources. It also allows for sudden changes, for example if there is an emergency. The Australian Nursing federation (ANf) has been very positive about the introduction of nurse: patient ratios. They report that this along with a government recruitment drive has brought 2,650 nurses back into victoria’s public health system and has been responsible for a substantial increase in numbers of student nurses (Buchan, 2004). The reported benefits are: • beds not kept open unless sufficient staffing present• adequate numbers of nurses on the roster six weeks in advance• directors of Nursing have fully funded budget to provide safe staffing levels• reduce reliance on agency staff• minimums are compulsory but there is room for professional judgement and flexibility in determining appropriate levels of care• better patient care • better ability to recruit and retain nurses during a global ‘nursing shortage’• build a strong, stable nursing workforce in the short and long term• increased job satisfaction for nurses, more stability, and reduced stress.
The ANf commissioned two surveys (in 2003 and 2006) to explore the impact of ratios on nurses in victoria. According to the researchers (Gordon et al., 2008) the studies document that ratios have ‘helped foster a renaissance in the profession’ (p.148) and almost all nurses surveyed (96 per cent) considered that ratios were essential for ensuring manageable workloads.
Buchan summarises the pros and cons of adopting nurse: patient ratios in the UK, as presented in Table 6.3.
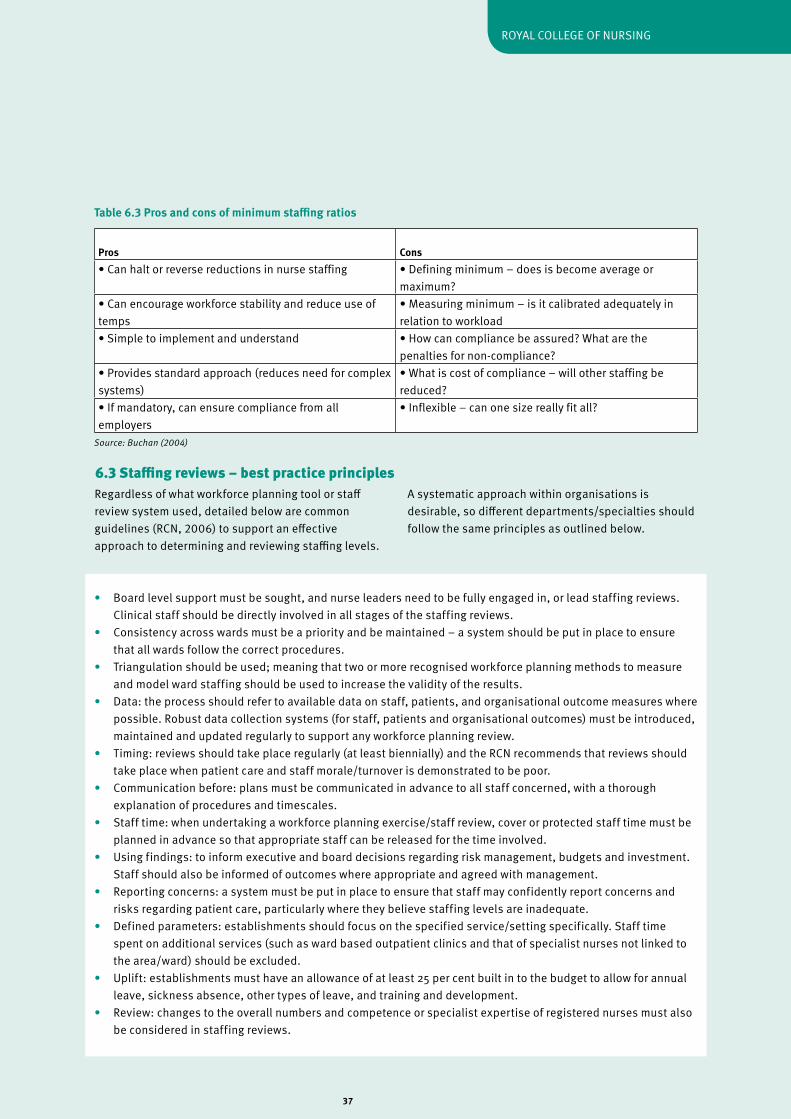
37
ROyAL COLLEGE Of NURSING
Table 6.3 Pros and cons of minimum staffing ratios
Source: Buchan (2004)
Pros Cons• Can halt or reverse reductions in nurse staffing • defining minimum – does is become average or
maximum?• Can encourage workforce stability and reduce use of temps
• Measuring minimum – is it calibrated adequately in relation to workload
• Simple to implement and understand • How can compliance be assured? What are the penalties for non-compliance?
• Provides standard approach (reduces need for complex systems)
• What is cost of compliance – will other staffing be reduced?
• If mandatory, can ensure compliance from all employers
• Inflexible – can one size really fit all?
Regardless of what workforce planning tool or staff review system used, detailed below are common guidelines (RCN, 2006) to support an effective approach to determining and reviewing staffing levels.
A systematic approach within organisations is desirable, so different departments/specialties should follow the same principles as outlined below.
• Board level support must be sought, and nurse leaders need to be fully engaged in, or lead staffing reviews. Clinical staff should be directly involved in all stages of the staffing reviews. • Consistency across wards must be a priority and be maintained – a system should be put in place to ensure that all wards follow the correct procedures.• Triangulation should be used; meaning that two or more recognised workforce planning methods to measure and model ward staffing should be used to increase the validity of the results. • data: the process should refer to available data on staff, patients, and organisational outcome measures where possible. Robust data collection systems (for staff, patients and organisational outcomes) must be introduced, maintained and updated regularly to support any workforce planning review.• Timing: reviews should take place regularly (at least biennially) and the RCN recommends that reviews should take place when patient care and staff morale/turnover is demonstrated to be poor.• Communication before: plans must be communicated in advance to all staff concerned, with a thorough explanation of procedures and timescales.• Staff time: when undertaking a workforce planning exercise/staff review, cover or protected staff time must be planned in advance so that appropriate staff can be released for the time involved. • Using findings: to inform executive and board decisions regarding risk management, budgets and investment. Staff should also be informed of outcomes where appropriate and agreed with management.• Reporting concerns: a system must be put in place to ensure that staff may confidently report concerns and risks regarding patient care, particularly where they believe staffing levels are inadequate.• defined parameters: establishments should focus on the specified service/setting specifically. Staff time spent on additional services (such as ward based outpatient clinics and that of specialist nurses not linked to the area/ward) should be excluded.• Uplift: establishments must have an allowance of at least 25 per cent built in to the budget to allow for annual leave, sickness absence, other types of leave, and training and development.• Review: changes to the overall numbers and competence or specialist expertise of registered nurses must also be considered in staffing reviews.
6.3 Staffing reviews – best practice principles
38
GUIdANCE ON SAfE NURSE STAffING LEvELS IN THE UK
Key points
• Workforce planning happens at different levels – nationally, regionally and locally. But ideally the results of systems used locally will form the basis of regional and national plans. Thus having a sound basis for planning staffing at local level is critical, and the separate tiers of planning should be integrated. • Ensuring safe staffing levels relies on having the right establishment. But a number of factors can ‘erode’ the planned staffing, so that even with the ‘right’ establishment, daily staffing levels are insufficient to meet patient need safely. Safe staffing relies on good management so that budgeted posts are filled, and the staff employed are available to work, and deployed effectively. • To make judgements about numbers of staff needed requires insight into the roles and competences of different staff groups (which may vary considerably locally). Need to know who does what, before you can judge how many of each is needed.• Staffing requirements will also depend on the efficiency and effectiveness of processes used – for example, changes made through ‘productive’ series may alter staffing levels needed to maintain same quality of service. • Most approaches to planning staffing rely on quantifying the volume of nursing care to be provided – on the basis of the size of population, mix of patients, type of service – and relating it to the activities undertaken by different members of the team.• The systems vary according to the amount of detail considered – from crude ‘top-down’ ratios that relate staffing to numbers of beds or total population, through to systems requiring detailed data on the nature and volume of care needs (patient dependency) and a breakdown of how nursing activity of different team members varies in relation to this. • There is insufficient independent evidence of the approaches to planning nurse staffing, to ensure that the systems are reliable and robust, and produce consistent results to one another. • Given the lack of proven reliability or recommendations about which systems to use – triangulation is essential. In other words, use several different approaches to determine staffing from different angles.
• Regardless of the system used, a focus on and consistent approach to the way in which staffing reviews are undertaken is essential and the RCN has detailed guidelines on best practice. In summary, reviews require: board level commitment, nursing director involvement and sign-off, consistency in approach, transparency in process and in the communication of results, staff involvement, timeliness of review and implementation, and regular evaluation (using patient and staffing outcomes data).
39
ROyAL COLLEGE Of NURSING
Conclusions and recommendationsWe have no choice over whether to take responsibility for safe staffing. As individual nurses or as health care providers the responsibilities and accountabilities for ensuring patients are treated in an environment with safe staffing levels are made explicit in law and in regulation. Boards must be able to take full responsibility for the appropriate number and mix of staff, ensuring expected patient outcomes can be delivered. Nursing directors are key players in workforce reviews and any changes to the workforce need their sign off. To do this healthcare providers need accurate information to continually reassess how effectively the current staffing is meeting demand.
Good quality data (HR, quality and outcomes) is therefore the cornerstone of effective staff planning and review. Staffing decisions cannot be made effectively without having good quality data on: patient mix (acuity/dependency), current staffing (establishment, staff in post), factors that impinge on daily staffing levels (absence, vacancies, turnover), and evidence of the effectiveness of staffing - quality/patient outcomes/nurse sensitive indicators.
Simple and easy to use systems to plan nurse staffing exist (and are documented here), and this guidance reiterates the common sense principles to ensure staff planning or reviews are successfully implemented. The key messages are that staffing reviews need to: involve staff (decisions are not taken in a vacuum), use established and consistent approaches, triangulate (for example dependency scoring system to gauge workload, professional judgment and benchmarking), and that the results are heeded and changes implemented (without cherry picking).
Ensuring that there are enough nurses with the right skills and experience is fundamental to care delivery. But the twin drivers of care crises on the one hand (related to insufficient nursing staff), and rising aspirations as to the quality and cost effectiveness of care, have renewed the focus on ‘getting staffing levels right’ – and this is reflected in regulatory requirements such as those set by the CQC.
At a time when resources are scarce and we face the biggest funding challenges of our generation, health
service providers need to know that they are deploying staff appropriately to get the maximum benefit from their skills. Staffing needs to be well planned to maximise the health benefits and minimise the cost of avoidable complications. The research evidence of the association between nurse staffing levels and patient outcomes is compelling. Better nurse staffing is associated with reduced risk of complications and lower mortality rates. Evidence of the negative effect of inadequate staffing is even more striking – as the experience of Mid Staffordshire so painfully demonstrates.
In NHS hospitals, wards where nurses report that care is often compromised due to short staffing, have twice as many patients per RN as wards in which care is said to rarely or never be compromised.
Aside from the effect on care quality, staffing levels that are not well matched to service needs do waste resources, more obviously in overstaffed areas. But understaffing also has a direct effect on costs. Untenable workloads result in increased sickness absence, higher levels of bank/agency cover, and increased turnover – all of which impinge on the cost-effectiveness of care delivery.
But we know very little about the extent to which nurse staffing is being proactively planned using robust systems. Are changes proposed to nurse staffing (as a result of financial pressures) being based on rational evidence of how staffing should be distributed in line with patient needs and workload?
There has not been a recent review of the systems/tools available for planning staffing and they have not been tested for their reliability or validity. The systems used for planning the most expensive element of health care – staffing – should be subject to the same level of scrutiny that NICE applies to specific health care interventions, as both the financial and patient care costs of inappropriate staffing are massive.
The RCN recommends that government health departments undertake the work required to identify the prevalence and efficacy of approaches to planning nurse staffing. Effective and inexpensive systems need to be supported by health departments so that they are readily accessible to employers, and so reduce dependence on commercial systems of unknown provenance.
7
40
GUIdANCE ON SAfE NURSE STAffING LEvELS IN THE UK
This report has set out the range of different factors that influence the total demand for staff and highlighted the variety of methods for planning or reviewing staffing. But recognising the complexities and difficulties of ensuring that staffing levels are safe is not an excuse for inaction. Health care systems are without doubt complex; which is more reason, not less, to have a rational system in place to ensure that staffing levels and mix are evidence based and patient safety is maintained.
The approaches to workforce planning are categorised as ‘top-down’ or ‘bottom up’ – but it is not a question of using one or the other. We need consistent, cohesive workforce planning that integrates local planning (using agreed validated tools) to inform regional and national workforce needs.
Many of the approaches to planning staffing are focussed purely on the numbers of nurses needed, and this paper reflects the focus on staffing levels. However, any assessment of the number of staff needed must be based on a full understanding of the skills and roles of those delivering care. Given the variation in the roles of staff across the nation and in different settings/employers, and the way in which role boundaries are constantly shifting, it is not possible to determine staffing through a generic formula. Employers need to take responsibility for ensuring that the roles of staff are appropriate to the training and skills they hold.
But a precursor to thinking about ‘who’ should be delivering care and the numbers needed, is a review of the processes through which care is being delivered and ensuring that these are effective. Changing staffing without thinking about processes is flawed; changing processes without thinking about staffing is flawed. The ‘how’ care is delivered and ‘who’ delivers it go hand in hand.
While benchmarks are referred to throughout the report, the RCN does not advocate a universal nurse-to-patient ratio. This would be meaningless given the range of factors that clearly influence the number and mix of nursing staff needed, and which need to be considered locally to determine staffing.
However, we know that in practice an establishment that has been systematically determined can become inappropriate as the context of care alters – either in terms of the nature or volume of care delivered, or supply side changes related to the labour market conditions and way in which staff are deployed. for example, recruitment problems or budget constraints can result in the planned establishment gradually being eroded, as vacant posts are ‘lost’ or are replaced with staff of different grades. Hence the planned complement of staff is gradually altered due to circumstance and ‘tinkering at the edges’ rather than proactive planning. This results in services being provided using staff numbers that are no longer sufficient to cover the service and meet patient/client needs throughout the week and throughout the year.
In the current climate there is a real danger that pressure to find savings may result in staffing changes being made without a sound evidence base or impact assessment. So how do providers, planners, commissioners, regulators, or staff working in an area make a judgement about whether or not the staffing for a particular service is adequate?
We would argue that an obvious starting point is to use key human resources and outcome indicators, and review variation internally (through score-cards and dashboards), as well as benchmarking externally against suitable comparators. This is not about identifying minimums and maximums. But about using appropriate data to identify how close to the ‘norm’ staffing in a particular place is, and pick up on the effectiveness of staffing by looking at patient outcome/nursing sensitive indicators. Benchmarks, when used appropriately (with well matched comparators), can be a useful means of highlighting areas which require further attention, or as one of several approaches contributing to triangulation.
The RCN has indentified the following as key indicators that we believe need to be routinely monitored by providers, commissioners/purchasers, and regulators:
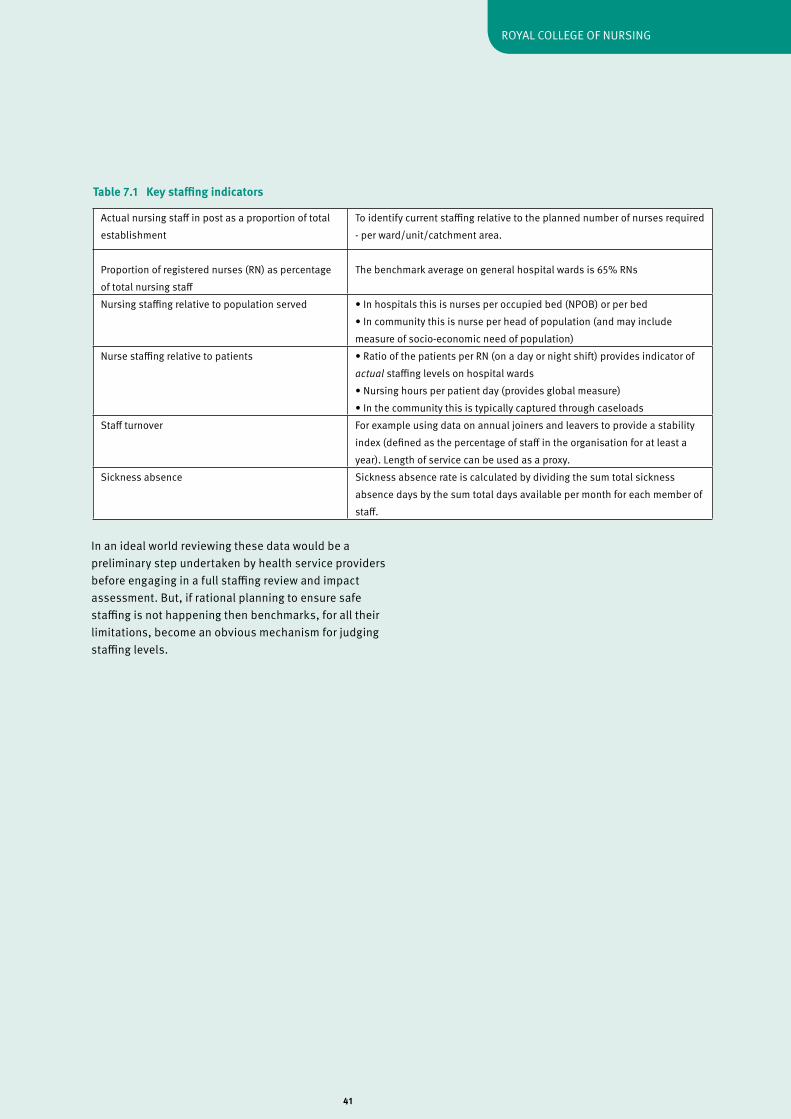
41
ROyAL COLLEGE Of NURSING
In an ideal world reviewing these data would be a preliminary step undertaken by health service providers before engaging in a full staffing review and impact assessment. But, if rational planning to ensure safe staffing is not happening then benchmarks, for all their limitations, become an obvious mechanism for judging staffing levels.
Actual nursing staff in post as a proportion of total establishment
To identify current staffing relative to the planned number of nurses required - per ward/unit/catchment area.
Proportion of registered nurses (RN) as percentage of total nursing staff
The benchmark average on general hospital wards is 65% RNs
Nursing staffing relative to population served • In hospitals this is nurses per occupied bed (NPOB) or per bed• In community this is nurse per head of population (and may include measure of socio-economic need of population)
Nurse staffing relative to patients • Ratio of the patients per RN (on a day or night shift) provides indicator of actual staffing levels on hospital wards• Nursing hours per patient day (provides global measure)• In the community this is typically captured through caseloads
Staff turnover for example using data on annual joiners and leavers to provide a stability index (defined as the percentage of staff in the organisation for at least a year). Length of service can be used as a proxy.
Sickness absence Sickness absence rate is calculated by dividing the sum total sickness absence days by the sum total days available per month for each member of staff.
Table 7.1 Key staffing indicators
42
GUIdANCE ON SAfE NURSE STAffING LEvELS IN THE UK
Appendix 1
Some recommended staffing minimums in the UK
Note: in virtually every case, minimum staffing ratio recommendations made by specialist bodies are accompanied by guidance that staffing levels should be locally determined to take into account the level of clinical need and local factors that influence staffing requirement (such as range of services, unit/ward layout, team mix). Some bodies recommend specific tools be used to enable staffing levels to be planned in relation to workload and clinical needs (for example, ‘birthrate’ in maternity care).
Adult intensive care ‘Gold standard’ ratio of one registered nurse: one patient was set in 1967. This continued to be the standard for decades but revised 2009 guidance produced jointly by three key bodies (the BACCN, British Association of Critical Care, and the RCN) highlights the complexity of teams and need for staffing to be planned to map local variation (in patient mix, unit/bed layout and team mix).
General recommendations regarding staffing numbers:• every patient in critical care unit to have access to a registered nurse with post registration qualification in the specialty• ventilated patients should have one nurse: one patient• nurse patient ratio of an unit should not fall below one nurse: two patients• supernumerary clinical co-ordinator (senior critical care qualified nurse) for units of six beds or more.
Children and young people’s community nursing To enable every child and young person to have right to be cared for at home unless hospital admission is required, in 2009 the RCN (A child’s right to care at home) recommended that an average sized district with 50,000 children requires a minimum of 20 WTE community children’s nurses.
Children’s wards and departments
Minimum registered nurse: child ratios (RCN, 2003)
General:• under 2 years of age 1: 3• other ages – day 1:4 • other ages – night 1:5. Neonatal services Guidance states that staffing should be based on the level of clinical care each baby requires.
DH guidance in 2003, in line with British Association of Perinatal Medicine (2001) recommended that there should be a minimum RN:infant ratios of:• special care 1: 4• high dependency 1:2• intensive care 1:1.Department of Health 2009 best practice guidance on neonatal staffing:• nurse coordinator on every shift (in addition to those providing direct clinical care)• units have minimum of two registered staff on duty at all times (one of which holding qualification in specialty).Minimum nurse staff: infant ratios:• special care 1: 4 nurse staff, minimum 70 per cent registered. Unregistered staff (for example, assistant practitioner or nursery nurse) should have a minimum of NvQ level 3/foundation degree, and work under supervision of registered staff.• high dependency 1:2 registered nurses with qualification in specialised neonatal care (or in training and under supervision)• intensive care 1:1 registered nurses with qualification in specialised neonatal care (or in training and under supervision).
Children’s intensive care and high dependency servicesMinimum nurse:patient ratios (Paediatric Intensive Care Society)Level 1 (high dependency) 0.5: 1 (1:1 in cubicles)Level 2 1.5: 1Level 3 1.5: 1Level 4 2:1
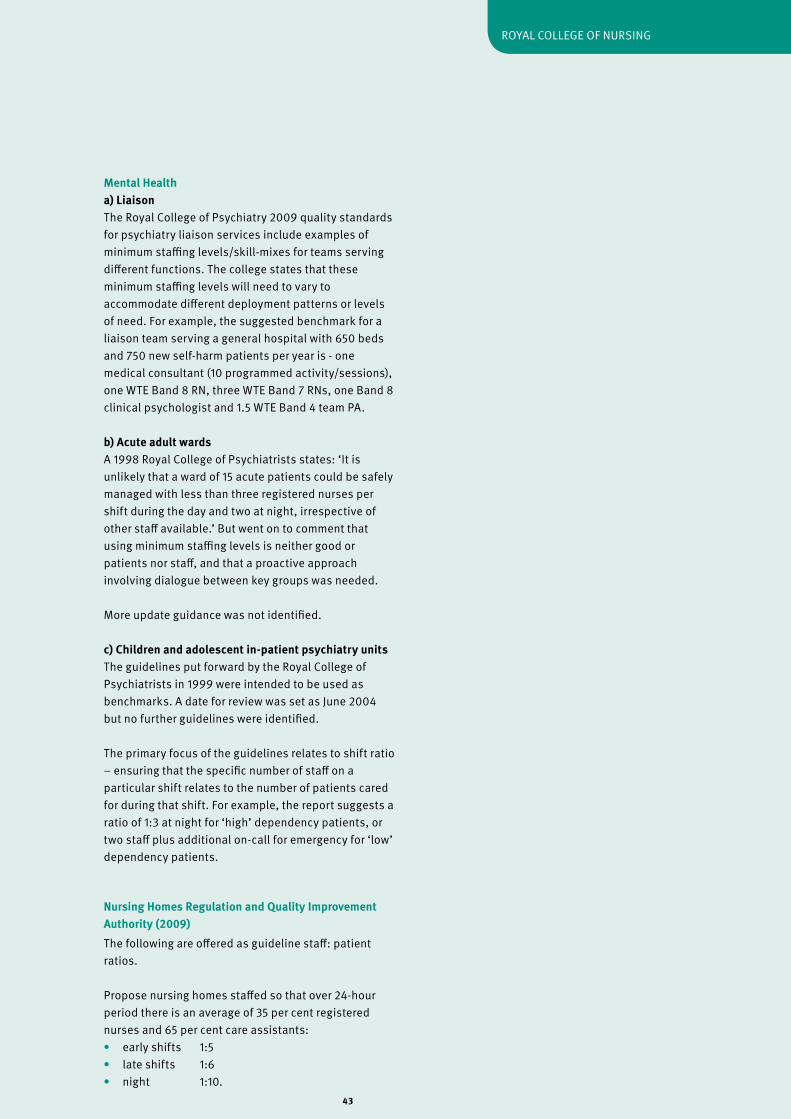
43
ROyAL COLLEGE Of NURSING
Mental Healtha) LiaisonThe Royal College of Psychiatry 2009 quality standards for psychiatry liaison services include examples of minimum staffing levels/skill-mixes for teams serving different functions. The college states that these minimum staffing levels will need to vary to accommodate different deployment patterns or levels of need. for example, the suggested benchmark for a liaison team serving a general hospital with 650 beds and 750 new self-harm patients per year is - one medical consultant (10 programmed activity/sessions), one WTE Band 8 RN, three WTE Band 7 RNs, one Band 8 clinical psychologist and 1.5 WTE Band 4 team PA.
b) Acute adult wardsA 1998 Royal College of Psychiatrists states: ‘It is unlikely that a ward of 15 acute patients could be safely managed with less than three registered nurses per shift during the day and two at night, irrespective of other staff available.’ But went on to comment that using minimum staffing levels is neither good or patients nor staff, and that a proactive approach involving dialogue between key groups was needed.
More update guidance was not identified.
c) Children and adolescent in-patient psychiatry unitsThe guidelines put forward by the Royal College of Psychiatrists in 1999 were intended to be used as benchmarks. A date for review was set as June 2004 but no further guidelines were identified.
The primary focus of the guidelines relates to shift ratio – ensuring that the specific number of staff on a particular shift relates to the number of patients cared for during that shift. for example, the report suggests a ratio of 1:3 at night for ‘high’ dependency patients, or two staff plus additional on-call for emergency for ‘low’ dependency patients.
Nursing Homes Regulation and Quality Improvement Authority (2009)The following are offered as guideline staff: patient ratios.
Propose nursing homes staffed so that over 24-hour period there is an average of 35 per cent registered nurses and 65 per cent care assistants:• early shifts 1:5• late shifts 1:6• night 1:10.
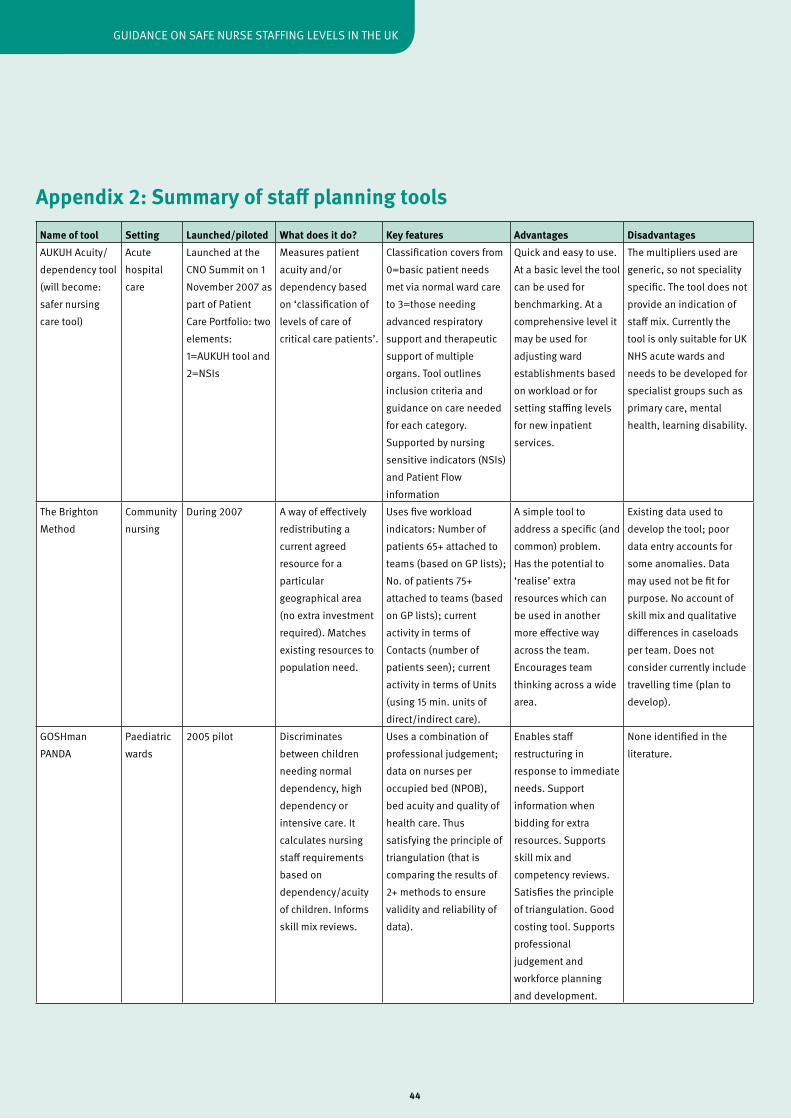
44
GUIdANCE ON SAfE NURSE STAffING LEvELS IN THE UK
Appendix 2: Summary of staff planning toolsName of tool Setting Launched/piloted What does it do? Key features Advantages DisadvantagesAUKUH Acuity/dependency tool (will become: safer nursing care tool)
Acute hospital care
Launched at the CNO Summit on 1 November 2007 as part of Patient Care Portfolio: two elements: 1=AUKUH tool and 2=NSIs
Measures patient acuity and/or dependency based on ‘classification of levels of care of critical care patients’.
Classification covers from 0=basic patient needs met via normal ward care to 3=those needing advanced respiratory support and therapeutic support of multiple organs. Tool outlines inclusion criteria and guidance on care needed for each category. Supported by nursing sensitive indicators (NSIs) and Patient flow information
Quick and easy to use.At a basic level the tool can be used for benchmarking. At a comprehensive level it may be used for adjusting ward establishments based on workload or for setting staffing levels for new inpatient services.
The multipliers used are generic, so not speciality specific. The tool does not provide an indication of staff mix. Currently the tool is only suitable for UK NHS acute wards and needs to be developed for specialist groups such as primary care, mental health, learning disability.
The Brighton Method
Community nursing
during 2007 A way of effectively redistributing a current agreed resource for a particular geographical area (no extra investment required). Matches existing resources to population need.
Uses five workload indicators: Number of patients 65+ attached to teams (based on GP lists); No. of patients 75+ attached to teams (based on GP lists); current activity in terms of Contacts (number of patients seen); current activity in terms of Units (using 15 min. units of direct/indirect care).
A simple tool to address a specific (and common) problem. Has the potential to ‘realise’ extra resources which can be used in another more effective way across the team. Encourages team thinking across a wide area.
Existing data used to develop the tool; poor data entry accounts for some anomalies. data may used not be fit for purpose. No account of skill mix and qualitative differences in caseloads per team. does not consider currently include travelling time (plan to develop).
GOSHman PANdA
Paediatric wards
2005 pilot discriminates between children needing normal dependency, high dependency or intensive care. It calculates nursing staff requirements based on dependency/acuity of children. Informs skill mix reviews.
Uses a combination of professional judgement; data on nurses per occupied bed (NPOB), bed acuity and quality of health care. Thus satisfying the principle of triangulation (that is comparing the results of 2+ methods to ensure validity and reliability of data).
Enables staff restructuring in response to immediate needs. Support information when bidding for extra resources. Supports skill mix and competency reviews. Satisfies the principle of triangulation. Good costing tool. Supports professional judgement and workforce planning and development.
None identified in the literature.
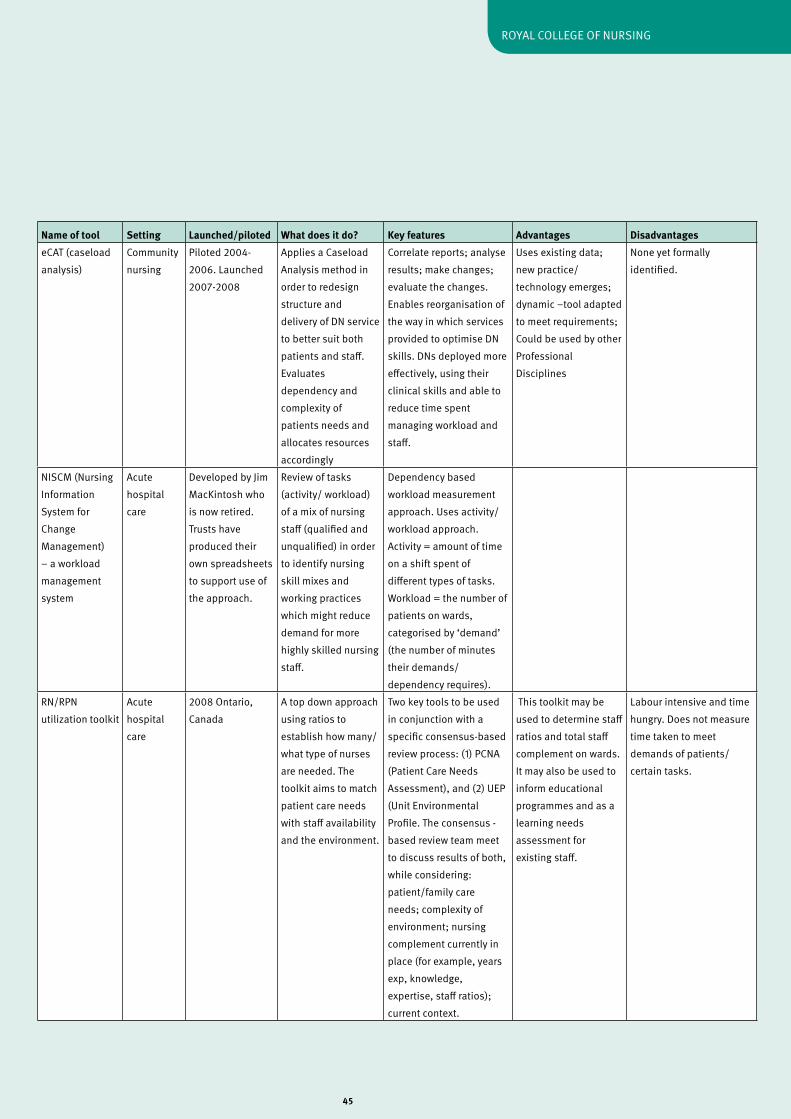
45
ROyAL COLLEGE Of NURSING
Name of tool Setting Launched/piloted What does it do? Key features Advantages DisadvantageseCAT (caseload analysis)
Community nursing
Piloted 2004-2006. Launched 2007-2008
Applies a Caseload Analysis method in order to redesign structure and delivery of dN service to better suit both patients and staff. Evaluates dependency and complexity of patients needs and allocates resources accordingly
Correlate reports; analyse results; make changes; evaluate the changes. Enables reorganisation of the way in which services provided to optimise dN skills. dNs deployed more effectively, using their clinical skills and able to reduce time spent managing workload and staff.
Uses existing data; new practice/technology emerges; dynamic –tool adapted to meet requirements; Could be used by other Professional disciplines
None yet formally identified.
NISCM (Nursing Information System for Change Management) – a workload management system
Acute hospital care
developed by Jim MacKintosh who is now retired. Trusts have produced their own spreadsheets to support use of the approach.
Review of tasks (activity/ workload) of a mix of nursing staff (qualified and unqualified) in order to identify nursing skill mixes and working practices which might reduce demand for more highly skilled nursing staff.
dependency based workload measurement approach. Uses activity/workload approach. Activity = amount of time on a shift spent of different types of tasks. Workload = the number of patients on wards, categorised by ‘demand’ (the number of minutes their demands/dependency requires).
RN/RPN utilization toolkit
Acute hospital care
2008 Ontario, Canada
A top down approach using ratios to establish how many/what type of nurses are needed. The toolkit aims to match patient care needs with staff availability and the environment.
Two key tools to be used in conjunction with a specific consensus-based review process: (1) PCNA (Patient Care Needs Assessment), and (2) UEP (Unit Environmental Profile. The consensus - based review team meet to discuss results of both, while considering: patient/family care needs; complexity of environment; nursing complement currently in place (for example, years exp, knowledge, expertise, staff ratios); current context.
This toolkit may be used to determine staff ratios and total staff complement on wards. It may also be used to inform educational programmes and as a learning needs assessment for existing staff.
Labour intensive and time hungry. does not measure time taken to meet demands of patients/certain tasks.
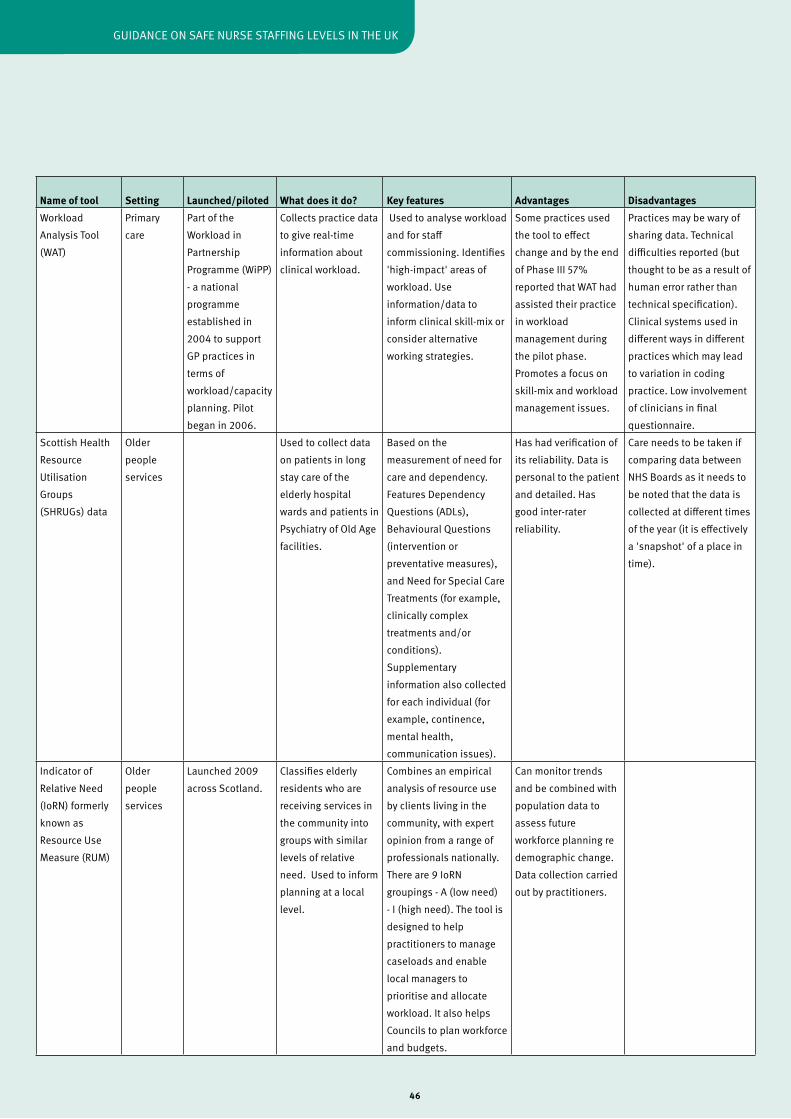
46
GUIdANCE ON SAfE NURSE STAffING LEvELS IN THE UK
Name of tool Setting Launched/piloted What does it do? Key features Advantages DisadvantagesWorkload Analysis Tool (WAT)
Primary care
Part of the Workload in Partnership Programme (WiPP) - a national programme established in 2004 to support GP practices in terms of workload/capacity planning. Pilot began in 2006.
Collects practice data to give real-time information about clinical workload.
Used to analyse workload and for staff commissioning. Identifies 'high-impact' areas of workload. Use information/data to inform clinical skill-mix or consider alternative working strategies.
Some practices used the tool to effect change and by the end of Phase III 57% reported that WAT had assisted their practice in workload management during the pilot phase. Promotes a focus on skill-mix and workload management issues.
Practices may be wary of sharing data. Technical difficulties reported (but thought to be as a result of human error rather than technical specification). Clinical systems used in different ways in different practices which may lead to variation in coding practice. Low involvement of clinicians in final questionnaire.
Scottish Health Resource Utilisation Groups (SHRUGs) data
Older people services
Used to collect data on patients in long stay care of the elderly hospital wards and patients in Psychiatry of Old Age facilities.
Based on the measurement of need for care and dependency. features dependency Questions (AdLs), Behavioural Questions (intervention or preventative measures), and Need for Special Care Treatments (for example, clinically complex treatments and/or conditions). Supplementary information also collected for each individual (for example, continence, mental health, communication issues).
Has had verification of its reliability. data is personal to the patient and detailed. Has good inter-rater reliability.
Care needs to be taken if comparing data between NHS Boards as it needs to be noted that the data is collected at different times of the year (it is effectively a 'snapshot' of a place in time).
Indicator of Relative Need (IoRN) formerly known as Resource Use Measure (RUM)
Older people services
Launched 2009 across Scotland.
Classifies elderly residents who are receiving services in the community into groups with similar levels of relative need. Used to inform planning at a local level.
Combines an empirical analysis of resource use by clients living in the community, with expert opinion from a range of professionals nationally. There are 9 IoRN groupings - A (low need) - I (high need). The tool is designed to help practitioners to manage caseloads and enable local managers to prioritise and allocate workload. It also helps Councils to plan workforce and budgets.
Can monitor trends and be combined with population data to assess future workforce planning re demographic change. data collection carried out by practitioners.
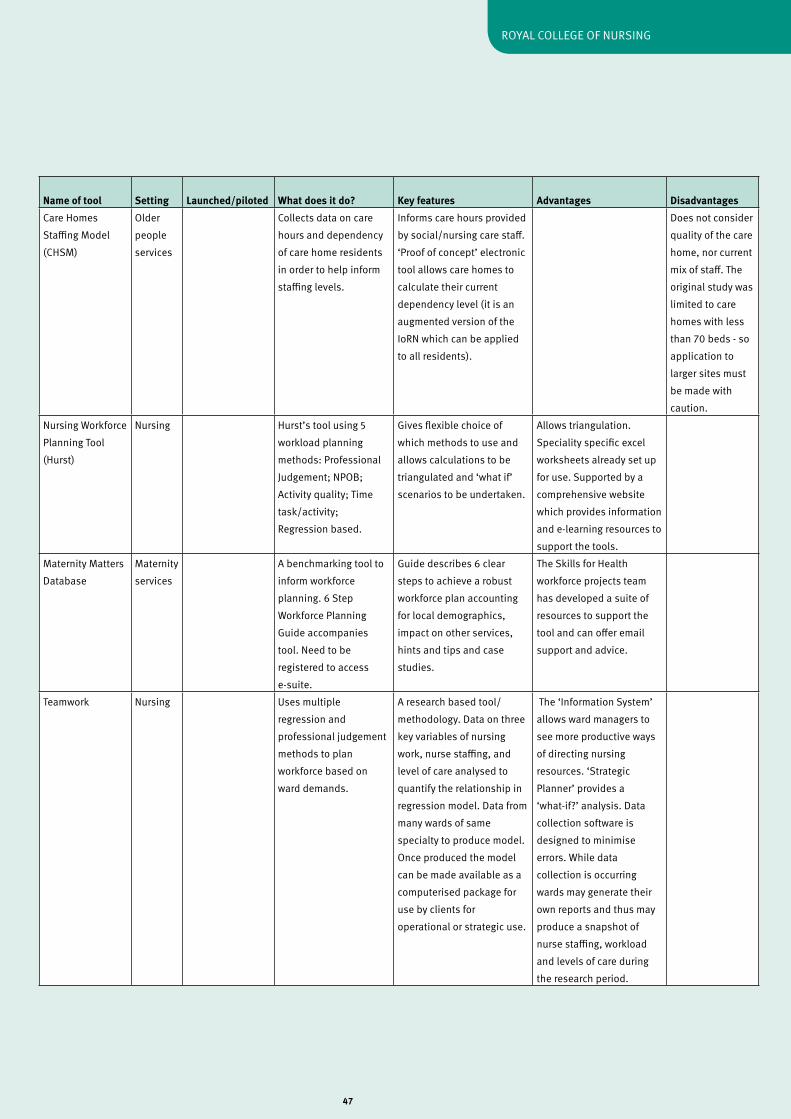
47
ROyAL COLLEGE Of NURSING
Name of tool Setting Launched/piloted What does it do? Key features Advantages DisadvantagesCare Homes Staffing Model (CHSM)
Older people services
Collects data on care hours and dependency of care home residents in order to help inform staffing levels.
Informs care hours provided by social/nursing care staff. ‘Proof of concept’ electronic tool allows care homes to calculate their current dependency level (it is an augmented version of the IoRN which can be applied to all residents).
does not consider quality of the care home, nor current mix of staff. The original study was limited to care homes with less than 70 beds - so application to larger sites must be made with caution.
Nursing Workforce Planning Tool (Hurst)
Nursing Hurst’s tool using 5 workload planning methods: Professional Judgement; NPOB; Activity quality; Time task/activity; Regression based.
Gives flexible choice of which methods to use and allows calculations to be triangulated and ‘what if’ scenarios to be undertaken.
Allows triangulation. Speciality specific excel worksheets already set up for use. Supported by a comprehensive website which provides information and e-learning resources to support the tools.
Maternity Matters database
Maternity services
A benchmarking tool to inform workforce planning. 6 Step Workforce Planning Guide accompanies tool. Need to be registered to access e-suite.
Guide describes 6 clear steps to achieve a robust workforce plan accounting for local demographics, impact on other services, hints and tips and case studies.
The Skills for Health workforce projects team has developed a suite of resources to support the tool and can offer email support and advice.
Teamwork Nursing Uses multiple regression and professional judgement methods to plan workforce based on ward demands.
A research based tool/methodology. data on three key variables of nursing work, nurse staffing, and level of care analysed to quantify the relationship in regression model. data from many wards of same specialty to produce model. Once produced the model can be made available as a computerised package for use by clients for operational or strategic use.
The ‘Information System’ allows ward managers to see more productive ways of directing nursing resources. ‘Strategic Planner’ provides a ‘what-if?’ analysis. data collection software is designed to minimise errors. While data collection is occurring wards may generate their own reports and thus may produce a snapshot of nurse staffing, workload and levels of care during the research period.
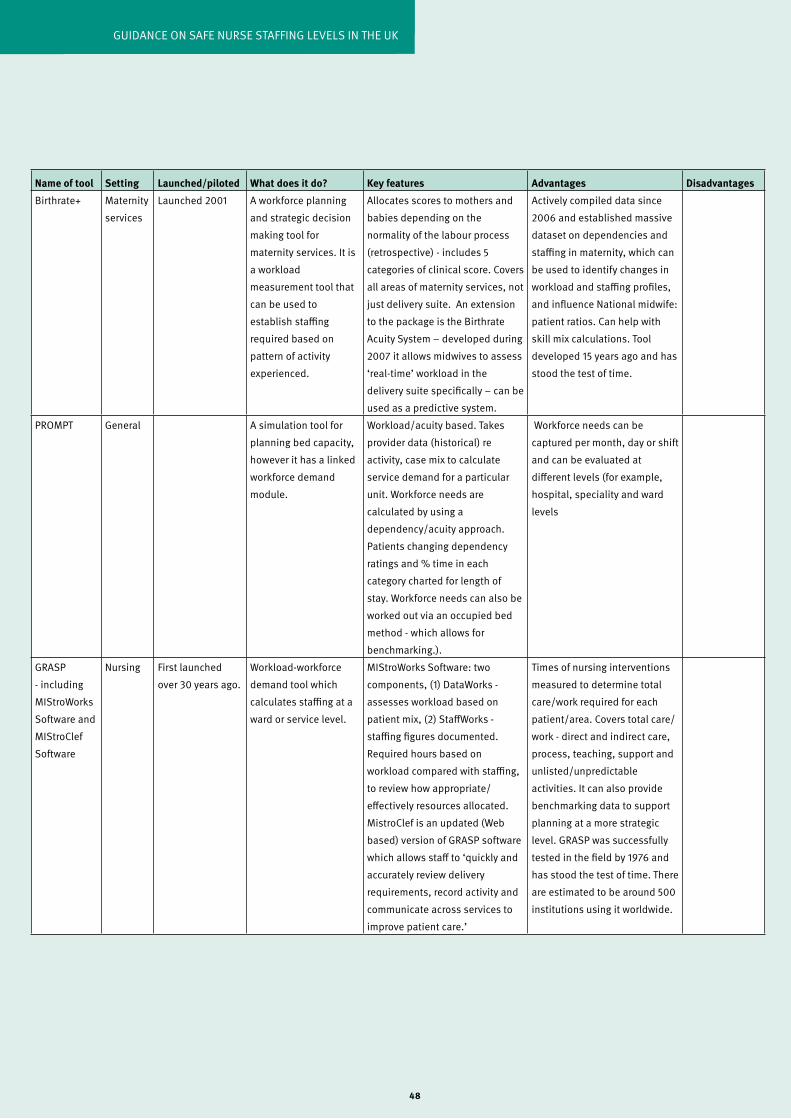
48
GUIdANCE ON SAfE NURSE STAffING LEvELS IN THE UK
Name of tool Setting Launched/piloted What does it do? Key features Advantages DisadvantagesBirthrate+ Maternity
servicesLaunched 2001 A workforce planning
and strategic decision making tool for maternity services. It is a workload measurement tool that can be used to establish staffing required based on pattern of activity experienced.
Allocates scores to mothers and babies depending on the normality of the labour process (retrospective) - includes 5 categories of clinical score. Covers all areas of maternity services, not just delivery suite. An extension to the package is the Birthrate Acuity System – developed during 2007 it allows midwives to assess ‘real-time’ workload in the delivery suite specifically – can be used as a predictive system.
Actively compiled data since 2006 and established massive dataset on dependencies and staffing in maternity, which can be used to identify changes in workload and staffing profiles, and influence National midwife: patient ratios. Can help with skill mix calculations. Tool developed 15 years ago and has stood the test of time.
PROMPT General A simulation tool for planning bed capacity, however it has a linked workforce demand module.
Workload/acuity based. Takes provider data (historical) re activity, case mix to calculate service demand for a particular unit. Workforce needs are calculated by using a dependency/acuity approach. Patients changing dependency ratings and % time in each category charted for length of stay. Workforce needs can also be worked out via an occupied bed method - which allows for benchmarking.).
Workforce needs can be captured per month, day or shift and can be evaluated at different levels (for example, hospital, speciality and ward levels
GRASP - including MIStroWorks Software and MIStroClef Software
Nursing first launched over 30 years ago.
Workload-workforce demand tool which calculates staffing at a ward or service level.
MIStroWorks Software: two components, (1) dataWorks - assesses workload based on patient mix, (2) StaffWorks - staffing figures documented. Required hours based on workload compared with staffing, to review how appropriate/effectively resources allocated. MistroClef is an updated (Web based) version of GRASP software which allows staff to ‘quickly and accurately review delivery requirements, record activity and communicate across services to improve patient care.’
Times of nursing interventions measured to determine total care/work required for each patient/area. Covers total care/work - direct and indirect care, process, teaching, support and unlisted/unpredictable activities. It can also provide benchmarking data to support planning at a more strategic level. GRASP was successfully tested in the field by 1976 and has stood the test of time. There are estimated to be around 500 institutions using it worldwide.
49
ROyAL COLLEGE Of NURSING
Aiken LH, Clarke SP, Sloane dM, Sochalski J and Silber JH (2002) Hospital nurse staffing and patient mortality, nurse burnout, and job dissatisfaction, Journal of the American Medical Association, 288 (16), pp.1987-1993.
Aiken L, Sloane dM, Cimiotti JP, Clarke SP, flynn L, Seago JA, Spetz J and Smith HL (2010) Implications of the California nurse staffing mandate for other states, Chicago: Health Research and Educational Trust.
Association of UK University Hospitals (2009) Patient Care Portfolio. AUKUH acuity/dependency tool: implementation resource pack, London: AUKUK. Tool and related literature are available for download from www.aukuh.org.uk.
Audit Commission (1992) Caring systems: a handbook for managers of nursing and project managers, London: Audit Commission Publications.
Audit Commission (2001) Ward staffing: review of national findings, London: Audit Commission Publications.
Audit Commission (2010) Making the most of frontline staff in the NHS, London: Audit Commission Publications.
Audit Scotland (2002) Planning ward nursing – legacy or design? Edinburgh: Audit Scotland.
Audit Scotland (2007) Planning ward nursing – legacy or design? A follow-up report, Edinburgh: Audit Scotland.
Bagust A, Prescott J and Smith A (1988) Numbering the nurses, Health Service Journal, July 7, pp.766-777.
Ball J (2009) School nursing in 2009: results from a survey of RCN members working in schools in 2009, London: RCN. Available at www.rcn.org.uk (Internet).
Ball J and Oreschnick R (1986) Balanced formula, Senior Nurse, 5 (5/6), pp.30-32.
Ball J and Pike G (2009) Past imperfect, future tense: nurses’ employment and morale in 2009, London: RCN.
Ball J, Pike G and Bradley M (2006) At breaking point? A survey of wellbeing and working lives of nurses in 2005, London: RCN.
Bolton LB, Aydin CE, donaldson N, Brown dS, Sandhu M, fridman M, and Aronow HU (2007) Mandated nurse staffing ratios in California: a comparison of staffing and nursing-sensitive outcomes pre and post regulation, Policy, Politics, and Nursing Practice, 8 (4), pp. 238-250.
British Association of Critical Care Nurses (2009) Standards for nurse staffing in critical care – determined by the BACCN, Critical Care Networks National Leads and RCN Critical Care forum (updated 2010), Newcastle upon Tyne: BACCN. Available at www.baccn.org.uk (Internet).
Buchan J (2004) A certain ratio? Minimum staffing ratios in nursing: a report for the Royal College of Nursing, London: RCN
Buchan J, Ball J and O’May f (2000) Determining skill mix: practical guidelines for managers and health professionals, Geneva: WHO (Issues in health service delivery: discussion paper three).
Buchan J and dal Poz MR (2002) Skill mix in the health care workforce: reviewing the evidence, Bulletin of the World Health Organisation, 80, pp.575-580, Geneva: WHO.
British Association of Perinatal Medicine (2001) Standards for hospitals providing neonatal intensive and high dependency care (2nd edition) and categories of babies requiring neonatal care, London: PABM.
Care Quality Commission (2010) Supporting briefing note: issues highlighted by the 2009 survey of patients in NHS hospitals in England
Care Quality Commission (2009) About the Care Quality Commission, London: CQC. Available at www.cqc.org.uk (Internet).
Care Quality Commission (2010) Guidance about compliance: essential standards of safety and quality, London: CQC.
References
50
GUIdANCE ON SAfE NURSE STAffING LEvELS IN THE UK
Care Quality Commission (2010) NHS staff survey 2009, London: CQC.
Currie L and Watterson L (2010) Measuring the safety climate in NHS organisations, Nursing Standard 24 (february), pp.35–38.
Cox T, Randall R and Griffiths A (2002) Interventions to control stress at work in hospital staff, HSE Contract Research Report 435/2002, Sudbury: HSE Books.
department of Health (2003) Report of the neonatal intensive care services review group, London: dH.
department of Health (2008) High quality care for all: NHS next stage review, London: dH.
department of Health (2009) NHS 2010-2015: from good to great – preventative, people-centred, productive, London: dH.
department of Health (August 2009) NHS health and well-being review – interim report [The Boorman Report], London: dH (Lead reviewer: S Boorman).
department of Health (November 2009) NHS health and well-being review – final report [The Boorman Report], London: dH (Lead reviewer: S Boorman).
department of Health (2009) The NHS constitution: the NHS belongs to us all, London: dH. Available at www.dh.gov.uk (Internet).
department of Health (2009) Toolkit for high-quality neonatal services, London: dH. Available at www.dh.gov.uk (Internet).
department of Health (2010) Planning and developing the NHS workforce: a national framework, London: dH.
department of Health (2010) The nursing roadmap for quality: a signposting map for nursing, London: dH.
department of Health and Social Security (1986) Neighbourhood nursing – a focus for care (Cumberlege Report), London: HMSO (Chair: J Cumberlege).dixon A, firth J and Buchan J (2009) Proposals for a centre of excellence for workforce strategy and planning, London: The King’s fund.
donaldson N, Burnes Bolton L, Aydin C, Brown d, Elashoff Jd, and Sandhu M (2005) Impact of California’s licensed nurse-patient ratios on unit-level nurse staffing and patient outcomes, Policy, Politics, and Nursing Practice, 6(3), pp.198-210.
Ellis J and Chapman S (2006), Nurse staffing requirements, Nursing Management UK, 13(4), pp.30-33.
Gordon S, Buchanan J and Bretherton T (2008) Safety in numbers: nurse-to-patient ratios and the future of health care, New york: Cornell University Press.
Griffiths P, Jones S, Maben J and Murrells T (2008) State of the art metrics for nursing: a rapid appraisal, London: King’s College National Nursing Research Unit.
Griffiths P, Murrells T, Maben J, Jones S and Ashworth M (2010) Nurse staffing and quality of care in UK general practice: cross-sectional study using routinely collected data, British Journal of General Practice, 60(570), pp.e36-e48(13).
Healthcare Commission (2005) Ward staffing, London: Healthcare Commission
Healthcare Commission (2007) Investigation into outbreaks of Clostridium difficile at Maidstone and Tunbridge Wells NHS Trust, London: Healthcare Commission.
House of Commons Health Committee (2007) Workforce planning: fourth report of session 2006-07, vol. 1, London: TSO.
House of Commons Health Committee (2009) Patient safety: Care Quality Commission, Monitor, and Professor Sir Ian Kennedy’s responses to the committee’s sixth report of session 2008-09, London: TSO.
House of Commons Health Committee (2009) Patient safety: sixth report of session 2008–09, London: TSO (HCI51-I July 3 2009).
House of Commons Housepaper (2010) The Mid Staffordshire NHS Foundation Trust inquiry. Independent inquiry into the care provided by Mid Staffordshire NHS Foundation Trust, January 2005–March 2009, Vols. I and II (HC375-1), London: TSO (Chairman: R francis QC).
51
ROyAL COLLEGE Of NURSING
Hurst K (2002) Selecting and applying methods for estimating the size and mix of nursing teams, London: dH.
Hurst K (2006) Nursing by numbers, Nursing Standard, 21(7), pp.22-25.
Hurst K (2006) Primary and community care workforce planning and development, Nursing and Healthcare Management and Policy, pp.757–769.
Hurst K (2010) Compare and contrast, Nursing Standard, 24 (38), pp.62-63.
International Council of Nurses (2004) Workload measurement in determining staffing levels: a literature review, Geneva: ICN.
Kane R, Shamliyan, Mueller C, duval S and Wilt T (2007) The Association of Registered Nurse Staffing Levels and Patient Outcomes: systematic review and meta-analysis, Medical Care, 45(12), pp. 1195-1204.
Kessler I, Heron P, dopson S, Magee H and Swain d (2010) The nature and consequences of support workers in a hospital setting. Final report. NIHR Service Delivery and Organisation programme; 2010, London: HMSO.
King’s College National Nursing Research Unit (2009) RN+RN = better care. What do we know about the association between Registered Nurse staffing levels and patient outcomes?’ (Policy+ briefing document, September 2009), London: King’s College National Nursing Research Unit.
Lankshear A, Sheldon T and Maynard A (2005) Nurse staffing and health care outcomes: a systematic review of the international research evidence, Advances in Nursing Science, 28(2), pp.163-74.McGillis Hall L and Buch E (2009) Skill mix decision-making for nursing, International Centre for Human Resources in Nursing, Geneva: ICN.
National Patient Safety Agency (2009) Quarterly data summary issue 13; learning from reporting – staffing – how do staffing issues impact on patient safety, London: NPSA. Available at www.nris.npsa.nhs.uk (Internet).
Needleman J, Buerhaus P, Soeren Mattke RN, Steward M and Zelevinsky K (2002) Nurse-staffing levels and the
quality of care in hospitals, The New England Journal of Medicine, 346(22), pp.1715-1722.
NHS benchmarking database and benchmarking tool can be accessed at www.healthcareworkforce.nhs.uk (Internet).
NHS Education for Scotland (2008) Nursing and midwifery workload and workforce planning - learning toolkit, Edinburgh: NES. Available at www.nes.scot.nhs.uk (Internet).
NHS Employers (2007) Electronic rostering: helping to improve workforce productivity. A guide to implementing electronic rostering in your workplace, London: NHS Employers.
NHS Information Centre (2009), Hospital episode statistics: a decade in view, Leeds: HES. Available at www.hesonline.nhs.uk (Internet).
NHS Information Centre (2009) NHS non-medical staff 1998-2008, Leeds: NHS IC. Available at www.ic.nhs.uk (Internet).
NHS Information Centre (2010), Sickness absence rates in the NHS: October-December 2009, experimental statistics, Leeds: NHS IC. Available at www.ic.nhs.uk (Internet).
NHS Institute for Innovation and Improvement (2009) High impact actions for nursing and midwifery, November 2009. Resources available for download at www.institute.nhs.uk (Internet).
NHS Institute for Innovation and Improvement’s The productive series of programmes is available to view at www.institute.nhs.uk (Internet).
NHS Scotland (2004) Nursing and midwifery workload and workforce planning project, Edinburgh: Scottish Executive.
Nightingale f (1863) Notes on hospitals (3rd edition), London: Longman.
Nursing and Midwifery Council (2008) The code: standards of conduct, performance and ethics for nurses and midwives, London: NMC.
52
GUIdANCE ON SAfE NURSE STAffING LEvELS IN THE UK
Nursing Workforce Planning Tool is available for download at www.healthcareworkforce.nhs.uk (Internet).
O’Connor J (2009) HCA in the community (day in the life), British Journal of Health care Assistants, 3(11), p.561.
Office for National Statistics (2010) UK Centre for the Measurement of Government Activity - Public service output, inputs and productivity: health care, London: ONS. Available at www.statistics.gov.uk (Internet).
Owen M (2009) Insulin administration in the community: a project, British Journal of Healthcare Assistants, 3(11), pp.546-550.
Queen’s Nursing Institute, Nurse sensitive outcome indicators for NHS provided care: version 2 (March 2010), London: QNI. Available at www.qni.org.uk (Internet).
Rafferty AM, Clarke SP, Coles J, Ball J, James P, McKee M and Aiken LH (2007) Outcomes of variation in hospital nurse staffing in English hospitals: cross-sectional analysis of survey data and discharge records, International Journal of Nursing Studies, 44(2), pp.175-182.
Reid B, Kane K and Curran C (2008) district nursing workforce planning: a review of the methods, British Journal of Community Nursing, 13(11), pp.525-530.
Royal College of Nursing (2003) Defining staffing levels for children’s and young people’s services, London: RCN.Royal College of Nursing (2006) Setting appropriate ward nurse staffing levels in NHS acute trusts: an exploration of the issues, London: RCN (Policy guidance 15/2006).Royal College of Nursing (2009) The socioeconomic case for nursing: RCN submission to the Prime Minister’s Commission on Nursing and Midwifery, 26 August 2009, London: RCN.
Royal College of Nursing (2009) Work-related stress: a good practice guide for RCN representatives, London: RCN.
Royal College of Nursing (2009) Breaking down barriers, driving up standards. The role of the ward
sister and charge nurse. London: RCN.Royal College of Nursing (2010) Care homes under pressure – an England report, London: RCN (Policy briefing 04/2010).
Royal College of Nursing (2010) Nursing Principles, London: RCN.
Scott C (2003) Setting safe nurse staffing levels, London: RCN.
Scottish Government (2007) Better health, better care: action plan, Edinburgh: TSG. Available at www.scotland.gov.uk (Internet).
Scottish Government (2007) Report of the independent review of regulation, audit, inspection and complaints handling of public services in Scotland, Edinburgh: Scottish Executive. Available at www.scotland.gov.uk (Internet).
Scottish Government (2008) Leading better care: report of the senior charge nurse review and clinical quality indicators project, Edinburgh: Scottish Executive. Available at www.scotland.gov.uk (Internet).
Scottish Government (2009) Curam, Edinburgh: Scottish Executive. See www.scotland.gov.uk (Internet).
Scottish Government (2009) NHS Scotland efficiency and productivity programme: delivery framework, Edinburgh: Scottish Executive.
Scottish Government (2010) NHS Scotland quality strategy, Edinburgh: Scottish Executive. Available at www.scotland.gov.uk (Internet).
Scottish Government (2010) NHS workforce projections 2010-11, Edinburgh: Scottish Executive.
Scottish Government (2010) The independent budget review: initial call for contributions (Issued by the Independent Budget Review Panel), Edinburgh: Scottish Executive.
Sheward L, Hunt J, Hagen S, Macleod M and Ball J (2005) The relationship between UK hospital nurse staffing and emotional exhaustion and job dissatisfaction, Journal of Nursing Management,13, pp.51-60.
53
ROyAL COLLEGE Of NURSING
Smith S, Casey A, Hurst K, fenton K and Scholefield H (2009) developing, testing and applying instruments for measuring rising dependency-acuity’s impact on ward staffing and quality, International Journal of Health Care Quality Assurance, 22(1), pp.30-39.
Standing Nursing & Midwifery Advisory Committee (2002) Balancing the shift – a position paper exploring key issues for nursing skill mix within the context of workforce planning, London: dH.
Storey C, ford J, Cheater f, Hurst K and Leese B (2007) Nurses working in primary and community care settings in England: problems and challenges in identifying numbers, Journal of Nursing Management, 15, pp.847-852.
Waters A and Andalo d (2003) Mix and match, Nursing Standard, 18(1), pp.12-17.
Welsh Assembly Government (2004) Realising the potential: a strategic framework for nursing, midwifery and health visiting in Wales into the 21st century – briefing paper 6: achieving the potential through research and development. Cardiff: WAG. Available at www.wales.gov.uk (Internet).
Welsh Assembly Government (2008) Free to lead, free to care. Final report of the empowering ward sisters/charge nurses ministerial task and finish group, Cardiff: WAG. Available at www.wales.gov.uk (Internet).
West d (2010) dearth of NHS performance data threatens quality improvement, Health Service Journal, 15 April 2010.
Workforce Review Team (2008) Assessment of workforce priorities, WRT: South Central SHA.

The RCN represents nurses and nursing, promotes excellence in practice and shapes health policies
December 2010
RCN Onlinewww.rcn.org.uk
RCN direct www.rcn.org.uk/direct0345 772 6100
Published by the Royal College of Nursing20 Cavendish Square London W1G 0RN
020 7409 3333
Publication code: 003 860
ISBN: 978-1-906633-60-8


