Safe staffing : Understanding the “size and shape” of the nursing workforce Health economics, decision making under uncertainty and workforce epidemiology…. Peter Griffiths @workforcesoton @wessex_clahrc Health Work Research Group
Transcript
Safe staffing : Understanding the “size and shape” of
the nursing workforce Health economics, decision making under uncertainty and workforce epidemiology….
Peter Griffiths @workforcesoton@wessex_clahrc
Health Work Research Group
• This presentation contains the results and analysis derived from projects supported by the NIHR including the Health Services & Delivery Research programme (including projects 14/194/21 & 13/114/17), NHS Improvement and the National Institute for Health and Care Excellence (NICE).
• The views expressed are those of the author(s) and not necessarily those of the NICE, the Department of Health and Social Care, arm’s length bodies or other government departments.
2
3@WorkforceSoton
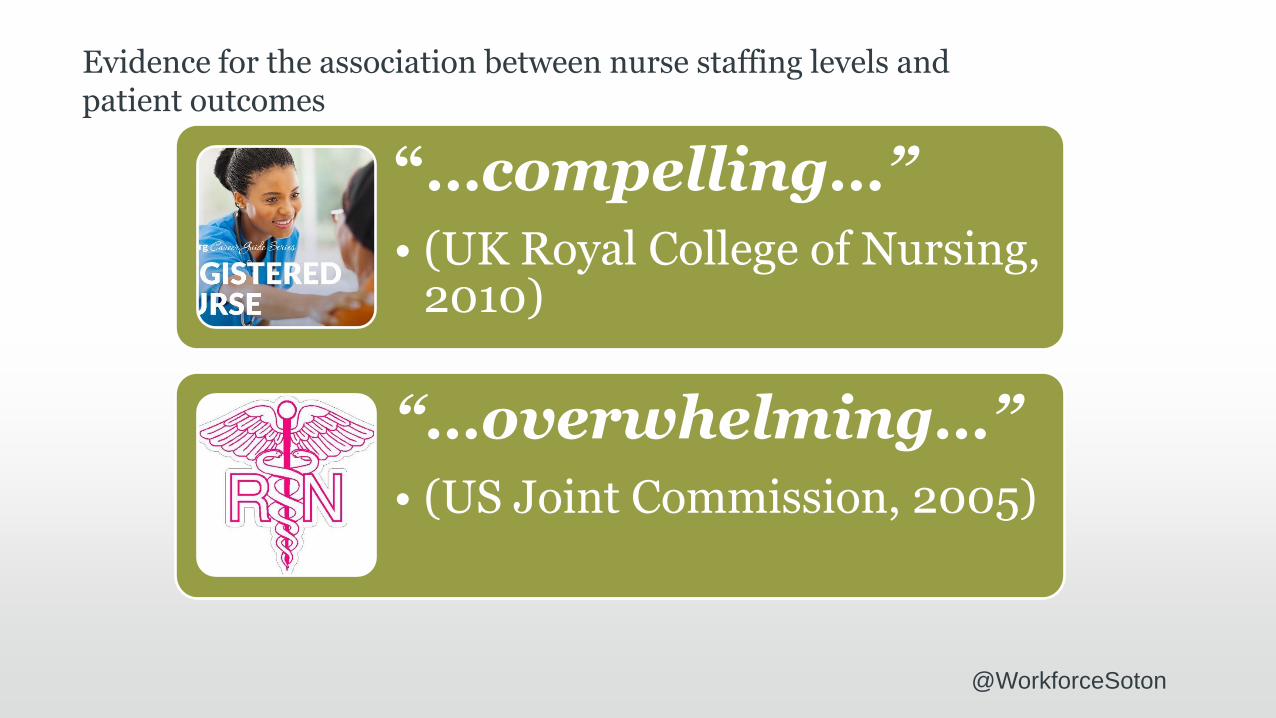
“…compelling…”
• (UK Royal College of Nursing, 2010)
“…overwhelming…”
• (US Joint Commission, 2005)
@WorkforceSoton
Evidence for the association between nurse staffing levels and patient outcomes
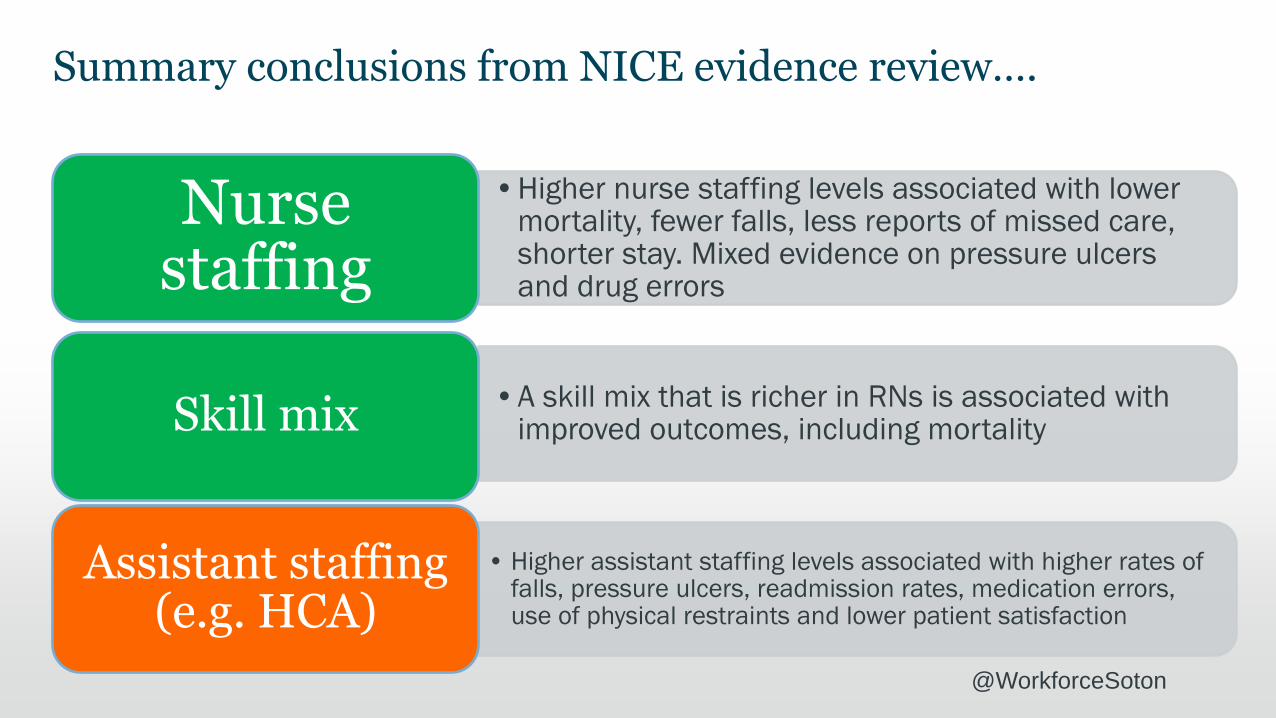
Summary conclusions from NICE evidence review….
•Higher nurse staffing levels associated with lower mortality, fewer falls, less reports of missed care, shorter stay. Mixed evidence on pressure ulcers and drug errors
Nurse staffing
•A skill mix that is richer in RNs is associated with improved outcomes, including mortalitySkill mix
• Higher assistant staffing levels associated with higher rates of falls, pressure ulcers, readmission rates, medication errors, use of physical restraints and lower patient satisfaction
Assistant staffing (e.g. HCA)
@WorkforceSoton
“There is a lack of high-quality studies exploring and quantifying the relationship between registered nurse and healthcare assistant staffing levels and skill mix and any outcomes”
(NICE Safe staffing guideline (SG1) 2014)
@WorkforceSoton
NICE evidence review 2014
From 1993 hundreds of studies and several reviews looking at nurse staffing, skill mix and outcomes…
Many very large studies
Most had significant limitations
All studies observational, most cross-sectional
Average staffing over a period of time
Outcomes over that period
@WorkforceSoton
Nurse staffing, missed vital signs and mortality
One NHS Trust
Three years 32 general
(med / surg) wards
33,000 ward X days of staffing
138,000 patients
3,367,000 sets of vital
signs observations
8Griffiths et al BMJ Quality and Safety DOI: 10.1136/bmjqs-2018-008043Griffiths et al Health Services & Delivery Research Journal 2018 6, (38)
“To my knowledge, it has not been proven that cigarette smoking causes cancer…there is, you know, in scientific terms, there are hurdles related to causation, and at this time there is no evidence that - they have not been able to reproduce cancer in animals from cigarette smoking” (William Campbell, then President and CEO of Phillip Morris quoted in the NYT December 6,