29
Technical briefs: Sharing the lessons learned in Northern Nigeria 2006-2014 EVIDENCE FOR ACTION
Technical briefs:
Sharing the lessons learned in Northern Nigeria
2006-2014 EVIDENCE FOR ACTION

The writing of this set of Technical Briefs has drawn on the work of all the PRRINN-MNCH employees and consortium members, and the commitment and contribution of health workers and communities at LGA, state and federal levels. For this we are extremely grateful. The writers and editors of the set include Andrew McKenzie, Cathy Green, Paula Quigley, Sally Findley, Jan Hofman, Michael Siebert, Adetoro Adegoke, Anthony Aboda, Ahmad Abdulwahab, Fatima Adamu, Solomon Mengiste, Godwin Afenyadu, Gary Forster and Farsight Media. Design by Atyeo Linklater. Photographs largely supplied by Okikiola Akinkugbe.

Contents: Governance and systems
Addressing human resources – 1 of 5Retaining skilled birth attendants – 2 of 5Bringing primary health care under one roof – 3 of 5Public financial managment systems strengthening – 4 of 5Influencing policy and fast-tracking implementation – 5 of 5
Health service deliveryReducing the gap between uptake of ANC and SBA – 1 of 1
Community engagementCommunity interventions to improve MNCH access – 1 of 5Adjusting health strategies – 2 of 5Community emergency transport – 3 of 5Working with volunteers – 4 of 5Young women’s support groups – 5 of 5
Evidence for decision-makingThe Nahuche HDSS – 1 of 3Baseline to endline changes – 2 of 3Changes in key MNCH outcomes – 3 of 3

OverviewThis set of Technical Briefs highlights key achievements from the PRRINN-MNCH programme in Northern Nigeria under one of four streams of work: Governance and systems; Health service delivery; Community engagement and Evidence for decision-making. This is part of a package of materials including a Final Report and a set of Knowledge Summaries.
Covering a population of over 19 million, PRRINN-MNCH was an innovative DFID/Norwegian Government funded programme (2006-2014), established to address these health issues. The consortium managing PRRINN-MNCH consisted of three partners (Health Partners International as lead partner, with GRID Consulting Ltd and Save the Children) as well as several associates.
The programme combined health systems strengthening with routine immunisation and maternal, newborn and child health interventions, merging horizontal and vertical approaches simultaneously. PRRINN-MNCH aimed to revitalize Primary Health Care and improve the availability, quality and utilization of maternal, newborn and child health services, including ante-, peri- and post- natal care, emergency obstetric newborn care, essential care for newborns and infants, young child feeding and nutrition, and routine immunisation against preventable diseases.
PRRINN-MNCH assisted each state (Katsina, Zamfara, Jigawa, Yobe) to achieve significant improvements in health indicators, by supporting many federal, state and local government health systems strengthening and service delivery initiatives, in combination with community engagement efforts.
Independently verified Evidence of significant programme impact includes dramatic reductions in the infant mortality rate, reduced from 90 to 56 per 1000 live births, while the under five year mortality rate was reduced from 160 to 90 per 1000 live births. There was a significant increase in fully immunised children coverage from 2.2% to 19.3% and births attended by skilled birth attendants increased from 11.2% to 26.8%.
Some communities in Katsina are now celebrating two years of no maternal mortality, results that can be directly attributed to the work of PRRINN-MNCH.
PRRINN-MNCH has consistently exceeded expectations and the programme ‘made outstanding achieve-ments in a very difficult environment’1.
1. Duby, Fiona (August 2012) PRRINN-MNCH Annual Review 2011: DFID Report

This documenT is one of a series of Technical briefs ThaT draw on The acTiviTies, resulTs and lessons learned from The Prrinn-mnch Programme
Technic al Brief 1 0f 3 EVIDENCE FOR ACTION
The Nahuche health and demographic surveillance system
Key messages: Accurate health data is crucial for making the right decisions on resource allocation.
1 The Nahuche health and demographic surveillance system (HDSS) established by PRRINN-MNCH has helped to fill an enormous gap in availability of local information in Northern Nigeria.
2 This has enabled more precise tracking of health services coverage and health outcomes in local populations, which in turn allows more appropriate resource allocation and targeting to areas most in need.
3 The system has the potential to track causal links between interventions and health outcomes, and to monitor progress in the achievement of the Millennium Development Goals.
The challenge: inaccurate health dataObtaining accurate data on critical health indicators is often difficult in resource-constrained environments. In Northern Nigeria, this problem is even worse because of cultural factors which restrain married women from being interviewed by men, low levels of educational attainment resulting in largely male-dominated fieldworker teams, and age distortions and other biases in the recall of information.
Lack of accuracy in health indicators for specific regions hampers effective planning and means that sufficient resources may not be allocated to places where they are most needed.
The response: HDSS monitors health and population changesIn 2009, PRRINN-MNCH established the Nahuche health and demographic surveillance system (HDSS) site to support studies aimed at assessing the wider progress and impact of strengthening health systems by longitudinal monitoring health and demographic events of populations at risk. The Nahuche HDSS site is 32 kilometres from the state capital, Gusau, and covers six districts: Bella, Gada, Karakai, Nahuche Keku, Nahuche Ubandawaki, and Rawayya.
Virtually all members in the study area are Hausa by ethnicity, traders, and practise subsistence farming. Within Nahuche, compounds or dwelling units are grouped into clusters. This provides an important opportunity to deploy selected
interventions within selected clusters to allow for comparison. In Nahuche there are 100 demarcated clusters.
The key objectives of the Nahuche HDSS site are to:
■ Monitor health and population changes
■ Study links between maternal, newborn and child health service strategies and survival
■ Monitor and evaluate the impact of health and related interventions
The results: better planning for resource allocationThe following results were achieved between 2010 and 2013:
A full baseline census for all six districts of the study area conducted between September and December 2010 (Round 0).
Nahuche was chosen to ensure a population large enough to detect events, such as neonatal deaths, within short
intervals of time. The baseline census questionnaire collected information on names of household members, relation-ship to head of household, residence status, sex, date of birth, ethnicity, marital status, education, survival status of parents and household characteristics.
The fieldworkers interviewed the head of the household or a designated adult. After a maximum of three revisits, a non-response was recorded. A baseline population of 125,149 in 19,193 households was identified with an average 6.5 persons per household ranging from 5.6 in Karakai to 6.9 each in Nahuche-Ubandawaki and Rawayya.
About half (49.9%) of the population was female, representing a sex ratio (males/females) of almost unity. About 51% of the total population was under 15 years of age while 3% was 65 years or older. The average age was 19.6 years.
Four ‘rounds’ (two rounds annually: January-June and July-December) of data collection.

This is to update events (ie information on births, deaths, migration, pregnancies and marriage) including collection of information on maternal and child health indicators. From January 2011, trained interviewers visited compounds within Nahuche in 120-day work cycles (a ‘round’), recorded events in registers, and reported data to the Nahuche computer centre for processing. As of October 2012, the population under surveillance had grown to 137,823 individuals in 20,914 households.
Collection of verbal autopsy information from relatives of individuals reported dead from the surveillance population.
Analysis of data from round 1 provides evidence-based information on maternal mortality in Northern Nigeria. Further, the study complements some of the previous maternal mortality ratio (MMR) figures which have generally been speculative with reference to MMR being ‘over 1,000 deaths per 100,000 live births’1.
Fig 1: Nahuche baseline census information, 2010
Selected characteristics of 125,149 individuals.
Characteristics Number
Usual population size* 125,149
Male 62,760
Female 62,389
Ratio male to female 1.01
Number of households 19,193
Mean household size (based on usual population) 6.5
% under five years 20.4
% under fifteen years 50.9
% sixty five + years 3.0
Mean age years 19.6
Median age years (minimum age is 0, maximum is 115) 14.0
* Usual population: the permanent population plus temporary migrants. These are people who usually stay in the household for 3 or more months each year.
Fig 2: Basic health indicators of Nahuche population
Selected vital statistics from the Nahuche HDSS site – 2012
Indicators Statistics
Infant mortality rate 59.8 per 1000 live births
Child mortality rate 175.5 per 1000 children
Under-five mortality rate 224.8 per 1000 live births
Crude death rate 19.8 per 1000 midyear population
Total fertility rate 7.4 births per woman
Life expectancy (females) 55.2 years
Life expectancy (males) 54.3 years
Life expectancy (both sexes) 54.7 years
Maternal mortality ratio 1,049 deaths per 100,000 live
births
Accurate and complete data allows for more effective health care planning.
Maternal mortality estimates
As part of round 1 (Jan-Jun 2011) activities, data were collected from women of reproductive age in 17,173 households using a questionnaire which focused on maternal and child health-seeking behaviour topics as well as sisterhood questions. A maternal death was defined as the death of a woman during pregnancy, childbirth, or in the 42 days after delivery.
Results from the maternal mortality analysis shows that a total of 17,087 respondents reported 38,761 maternal sisters of reproductive age (15-49 years). Out of the 38,761 sisters, 3,592 were reported dead and 1,261 of those dead were maternal deaths. The total lifetime risk of maternal death was 8% and using 7.5 as the total fertility rate for Zamfara state, the estimated maternal mortality ratio (MMR) for the surveillance site was 1,049 deaths per 100,000 live births (95% confidence intervals: 1,021-1,136).

Peer-reviewed scientific publications: Doctor HV, Olatunji A, Findley SE, Afenyadu GY, Abdulwahab A, and Jumare A. 2012a. “Maternal mortality in Northern Nigeria: findings from a health and demographic surveillance system in Zamfara State.” Tropical Doctor 42(3): 140-143.
Doctor HV, Olatunji A, and Jumare A. 2012b. “Bridging the Communication Gap: Successes and Challenges of Mobile Phone Technology in a Health and Demographic Surveillance System in Northern Nigeria” Online Journal of Public Health Informatics, Vol. 4, No. 3.
Doctor HV, Findley SE, and Jumare A. 2011. “Evidence-based health programme planning in northern Nigeria: Results from the Nahuche Health and Demographic Surveillance System pilot census.” Journal of Rural and Tropical Public Health 10: 21–28.
Studies conducted in Nahuche:
■ Baseline, midterm, and endline MNCH household surveys
■ ‘Bringing MNCH services to the door step’ cluster of studies:
Outreach services pilot in Yobe
Community-based service delivery (CBSD) pilot in Jigawa
Mobile primary health care (PHC) in Katsina
■ Performance-based financing (PBF) studies
Demand side in Jigawa, Yobe and Zamfara
Supply side in Katsina
■ Midwife recruitment and retention scheme (MRRS) pilot studies
■ Emergency transport scheme (ETS) studies (social support and funding mechanisms) – all four states
■ Universal anaesthesia machine (UAM) – tested in three facilities – one each in Katsina, Zamfara and Kano states
The Nahuche HDSS site has been accepted as a member of the international network for the demographic evaluation of populations and their health (INDEPTH Network: www.indepth-network.org) in November 2012. Initiatives to sustain the centre, such as the strategic MOU with Usmanu Danfodiyo University, Sokoto, represent an important achievement, as the state government alone cannot sustain the centre.
Policy implicationsThe availability of data that is more accurate for specific locations than that obtained in national surveys is extremely useful for more effective planning and resource allocation. It also allows health planners to target resources to where they are most needed.
Users of the data can establish causal links between interventions and health outcomes. This is extremely important in monitoring activities to verify if they are really leading to the desired results.
Besides the ‘direct’ health-related indices, the HDSS site has the capacity to collect information on other MDG indicators (see Fig 3)
ConclusionThe Nahuche HDSS is monitoring health and demographic dynamics under exceed-ingly complex circumstances. Despite these essential difficulties, information continues to be recorded, edited and reported on population dynamics in a large population. The Nahuche HDSS baseline census and update round activities have demonstrated the replication of surveillance technology in a resource-constrained environment and become a model for other longitudinal health and demographic research projects in Nigeria and northern states in particular.
Nahuche has not only demonstrated a capacity for conducting detailed research; it has developed a platform for testing feasible interventions as we draw closer to the Millennium Development Goals.
Fig 3: HDSS capacity and Millennium Development Goals
Millennium Development Goals Capacity of HDSS to produce data
MDG 1, Target 2:Prevalence of underweight children under five years
Routine collection of nutrition indicators for children aged 5 years and below
MDG 2, Target 3Net enrolment ratio in primary education
Routine updates on educational status of all members aged 6 years and above
Proportion of pupils starting grade 1 who reach grade 5
Routine follow-up on all school-age children
MDG 4, Target 5Child and infant mortality rates
Routine monitoring of death events among children aged 5 years and below
MDG 5, Target 6Maternal mortality ratio
Routine monitoring of maternal-related deaths among women of reproductive age
% of births attended by skilled health personnel
Routine collection of antenatal care and delivery data for all new births
1. This is far greater than the national average of 545 as reported in the 2008 Nigeria Demographic & Health Survey.

The PRRINN-MNCH programme works with federal, state and local governments and local communities to improve the quality and availability of maternal, newborn and child health services.
www.prrinn-mnch.org Email: [email protected]
The PRRINN-MNCH programme is funded and supported by UK aid from the UK Government and the State Department of the Norwegian Government. The programme is managed by a consortium of Health Partners International, Save the Children and GRID Consulting, Nigeria.

This documenT is one of a series of Technical briefs ThaT draw on The acTiviTies, resulTs and lessons learned from The Prrinn-mnch Programme
Baseline to endline changes in maternal health outcomes
Key messages: PRRINN-MNCH intervention in Northern Nigeria led to significant improvements in practically all maternal health outcomes.
1 In Northern Nigeria the maternal mortality ratio (MMR) is estimated to be appreciably higher than the national average with recent estimates for the north over 1,200 deaths per 100,000 live births, compared to MMR estimates for the southern region below 300 deaths per 100,000 live births.
2 The combined health system and community changes contributed to the improvements between 2009 and 2013 (the PRRINN-MNCH years).
3 The net impact of these changes in the intervention communities was a decline in the maternal mortality ratio from about 1,300 to 1,057 deaths per 100,000 live births.
Results from the 2013 Endline Household Survey
The challenge: Northern Nigeria has very poor maternal health outcomesMaternal health outcomes in Nigeria are among the worst in the world, with Nigeria second only to India in the number of maternal deaths1, 2. In Northern Nigeria the maternal mortality ratio (MMR) is estimated to be appreciably higher than the national average3 with recent estimates for the north over 1,000 deaths per 100,000 live births, compared to MMR estimates for the southern region below 300 deaths per 100,000 live births4.
In Northern Nigeria, the rise in maternal mortality has been accompanied by a decline in use of antenatal care (ANC) and deliveries with a skilled birth attendant (SBA). According to the 2003 and 2008 Nigeria Demographic and Health Surveys (DHS), between 2003 and 2008, the percentage of women who received any ANC services for births in the previous five years dropped from 36.9% to 31.1% in the North West (including Katsina and Zamfara states) and from 47.3% to 43.0% in the North East (including Yobe state). Similarly, the percentage of women with skilled assistance at delivery, declined from 12% to 8.9% in the North West and from 19.8% to 13.1% in the North East5. Contraceptive use was also lowest in these regions, 2.8% and 4.0% in the North West and North East respectively, with unmet need for family planning among currently married women at 18-21%5.
The response: the broad-based PRRINN-MNCH programmeIn the face of this evidence of stagnation or decline in maternal health in the North West and North East, the Partnership for Reviving Routine Immunisation in Northern Nigeria (PRRINN) was established in 2006, and expanded in 2008 to include maternal, newborn and child health (MNCH), becoming PRRINN-MNCH (hereafter ‘the programme’). The programme is comprehensive, encompassing multiple aspects of the health system including human resources, health governance, health information, strengthening of clinical services and community engagement to reduce maternal, newborn and child mortality.
The programme adopted the cluster approach and implemented the intervention cluster by cluster, each year adding more clusters to the intervention group. This allowed the programme
to use an implementation research approach to assessing the impact of its combined strategies. About one-third of the total clusters were implemented in the first year of the programme, and in each successive year approximately 20-25% of the remaining clusters joined the programme. By 2012 all the planned intervention clusters were participating.
The assessment of the impact of the PRRINN-MNCH programmes uses a quasi-experimental design with pre and post-intervention household surveys in the intervention and control communities. The pre-intervention or Baseline Household Survey (BHS) was conducted in spring 2009 and the post-intervention household survey, the Endline Household Survey (EHS) was conducted in spring 2013.
The evaluation of the impact of the integrated MNCH package takes into account both availability of programme and actual individual participation in any of the programme’s community-
Technic al Brief 2 0f 3 EVIDENCE FOR ACTION

based service activities. Availability was assessed by comparing intervention and control areas. Initially, Jigawa state was not included in the MNCH programme intervention, so the BHS did not include Jigawa. As the BHS was entirely pre-intervention, all responses in the BHS were considered control. However, for comparison purposes the BHS was subdivided into intervention (receiving the intervention starting in 2009), and control (not yet receiving any intervention).
By 2013 virtually all the state LGAs in the original sample had received statewide interventions eg training of health care workers or facility upgrades, but not all had received the community engagement package. Therefore, in the EHS the control areas were those which had not yet received the integrated community engagement package, including any LGAs not in the original sample but which had begun to be included in the basic intervention. Individual exposure to the programme was assessed by each woman’s responses to questions eliciting sources of information or health care advice and her explicit response to questions about observing or participating in activities introduced by the programme.
The study was approved by State Ethics Review Committees in each of the states. These ethics review committees are certified by the Nigerian Federal Government’s National Health Research Ethics Committee to review and approve health research protocols for their states.
Sampling methodologyThe sampling plan was a stratified two-stage cluster sample, with over-sampling of individuals in the MNCH intervention clusters using a ratio of 2:1. This was because MNCH clusters cover a significantly lower proportion of the population of each state. Oversampling therefore provided a sufficient sample in the intervention areas to assess the impact of key elements within the intervention package on the key MNCH outcomes.
The primary sampling unit was the Local Government Area (LGA) – 24 in the BHS and 51 in the EHS. For the EHS, the same intervention LGAs as the BHS were included, with the
exception of LGAs of the state capitals (considered not an appropriate control for the largely rural intervention), and the addition of the Jigawa intervention LGAs and any previously control LGAs which had the full intervention extended to their locality. The LGAs comprising the state capitals were included only during the baseline to assess the differences in services provided to residents patronising urban versus rural facilities. This enabled the team to devise appropriate strategies for referral from rural to urban facilities. The state capitals were excluded in the analyses reported here. The number of households selected per LGA was proportional to the size of the LGA.
Fig 1: Percentage of women who had ANC or an SBA for their last pregnancy and delivery
0.000000%
16.666667%
33.333333%
50.000000%
0.000000%
16.666667%
33.333333%
50.000000%
Before After
48.8%
24.9%
11.2%
23.9%
ANC SBA
The study was designed with an 80% power to detect a 2.5% change in the percentage of women delivering with the assistance of skilled birth attendants between the BHS and the EHS. The BHS was designed to be representative of all ever-married women in the household and required a sample of 5,560 households, while the EHS was designed to be representative only of ever-married women with a birth in the previous five years, with a minimum sample requirement of 2,310 households.
Oversampling was used to increase the number of intervention community respondents to provide additional power for behaviours with a lower frequency
but which were of particular interest to the programme, such as receiving advice from a community health worker. Because stratified sampling was used with differential sampling proportions for the intervention and control strata, weights are used in the analysis.
Within the LGA, the sample of households was allocated to intervention and control communities in proportion to the size of the community or village. The sampling fraction for each community was determined by information on the total households from the community leadership. Households within each selected community were randomly sampled using a procedure similar to that used in the WHO-EPI (World Health Organization Expanded Programme on Immunization) cluster surveys, namely by numbering then sampling households according to the community sampling fraction along randomly selected paths leading out from the centre of the village.
The household was the ultimate sampling unit. In compounds of one to three households, one household was randomly chosen for interviews; in compounds with four to six households, two were surveyed; in compounds with seven or more households, three were surveyed. Within each randomly selected household in the BHS, all ever-married women of childbearing age (15-49 years) were inter-viewed, whereas in the EHS only one ever-married woman with at least one child born in the last five years was selected for interview. The inclusion criteria were changed for the midterm and endline surveys because of the need to focus on women with pregnancies and births during the intervention. The completed interviews were 6,842 in the BHS and 4,612 in the EHS.
The surveysInterviewers who had completed secondary school or higher were trained to visit the selected women at home with a questionnaire that included translation of key concepts and terms in the local languages (eg Hausa, Kanuri). Most of the interviewers were females, responding to cultural expectations and beliefs that encourage female interviewers to interview female respondents. The questionnaires were

standardised across the three survey rounds and used close-ended questions from the 2008 Demographic and Health Survey to allow comparisons of results with other national or state-level data.
The question topics covered age, parity, economic status, literacy in any language, wife rank, antenatal care and delivery characteristics, source of health advice for the woman or the baby during last pregnancy, experience of labour and delivery complications, knowledge of maternal and newborn danger signs and how to respond to them, actual response to danger signs of infant and child illness, and infant and child mortality.
Questions and/or their response codes were modified in line with the programme goals to focus on the specific components included in the PRRINN-MNCH programme. In addition, the EHS respondents were asked to give feedback on several of the programme interventions, such as what improvements they had noticed in the clinic in the past year or whether they had observed anyone using specific programme components.
At the analysis stage, the inclusion
criteria for both surveys was narrowed to ever-married women, aged 15-49 years, with a birth in the previous five years. The data from the BHS and EHS were merged into one combined data set, using one uniform variable format. Respondents were assigned to the control or intervention groups based on the level of PRRINN-MNCH programme intervention at the time of the survey. The dependent variables are the key health behaviours pertaining to maternal, newborn care and care of sick children. Infant and child mortality rates were calculated using standard demographic estimation methods. The infant and child mortality rates were calculated using the retrospective reports of births and deaths in the previous 12 months and five years, per the standardised format of the Demographic and Health Surveys. Rates were calculated separately for each survey period, aggregating the reported births and deaths per household. We first verified the number of births and deaths for the appropriate reference period (one or five years) using the built-in cross-referencing between questions, excluding implausible values (eg deaths of children under five exceeding births,
after controlling for children moving in and out of the household), and then calculated the mortality rates using the appropriate births denominator.
The bi-variate analyses of the two sets of survey data were conducted using sampling weights based on different sampling fractions in the intervention and control areas. We examined changes in the proportion with the designated MNCH behaviour or outcome, contrasting all pre-intervention responses (all BHS) versus the post-intervention responses from the EHS, intervention versus control.
Because the intervention was implemented in stages across clusters, some of the respondents received the intervention only in the year prior to the EHS, and they could not be considered to have fully experienced the intervention. Therefore, the comparisons by intervention include those with only one year of exposure in the control group. We assessed the degree to which the intervention and control groups differed using the Chi-square statistic. Analyses were performed using Stata 12.0 (Statacorp, College Station, TX).
Table 1: Comparison of key reproductive health outcomes, Baseline 2009 (BHS) to Endline 2012 (EHS), PRRINN-MNCH states of Katsina, Yobe, and Zamfara
Key maternal health indicators
BHS EHS EHS Control
EHS Intervention
BHS v EHS
Intervention v Control
Maternal mortality ratio /100,000 live births*
>1271 1190 1262 1057 NA NA
% births attended by a skilled birth attendant 11.2 23.9 23.6 26.8 <.001 .012
% women aged 15-49 who have 2+ TT doses 71.8 86.2 86.5 86.0 <.001 .793
% caesarian section rates 0.74 1.54 1.55 1.53 .019 .957
% women receiving ANC by trained person 24.9 48.8 44.6 53.0 <.001 <.001
% women with standing permission to take child to health centre
40.2 82.7 82.7 82.8 <.001 .248
% women who know 4 maternal danger signs 10.2 21.7 14.0 29.4 <.001 <.001
* MMR includes Jigawa. t-test is used for the mortality and c-section rates, while chi-square is used for all other comparisons

The results: changes in behaviours and outcomes
Key outcomes The maternal mortality ratio (MMR) at the baseline was at least 1,270 per 100,000 live births, which was the ratio calculated using the sisterhood method in the PRRINN-MNCH midterm survey of 2011,6 and considered conservative given other estimates for MMR in Northern Nigeria averaging 2,420.7 Using the sisterhood method with data from the EHS, the MMR is estimated to have gone down to 1,190. It had barely gone down, to 1,260, in the control communities, but went down considerably to 1,057 in the intervention communities with the full community engagement set of interventions.
Improvements were seen in the proportions of women having a skilled birth attendant (SBA), which increased from 11.2% to 23.9%, having two or more anti-tetanus vaccinations from 71.8% to 86.2%, and delivery with a caesarean section, which increased from 0.74% to 1.54%. The proportion of women having at least one antenatal care visit (ANC) doubled from 24.9% to 48.8% (see Fig 1).
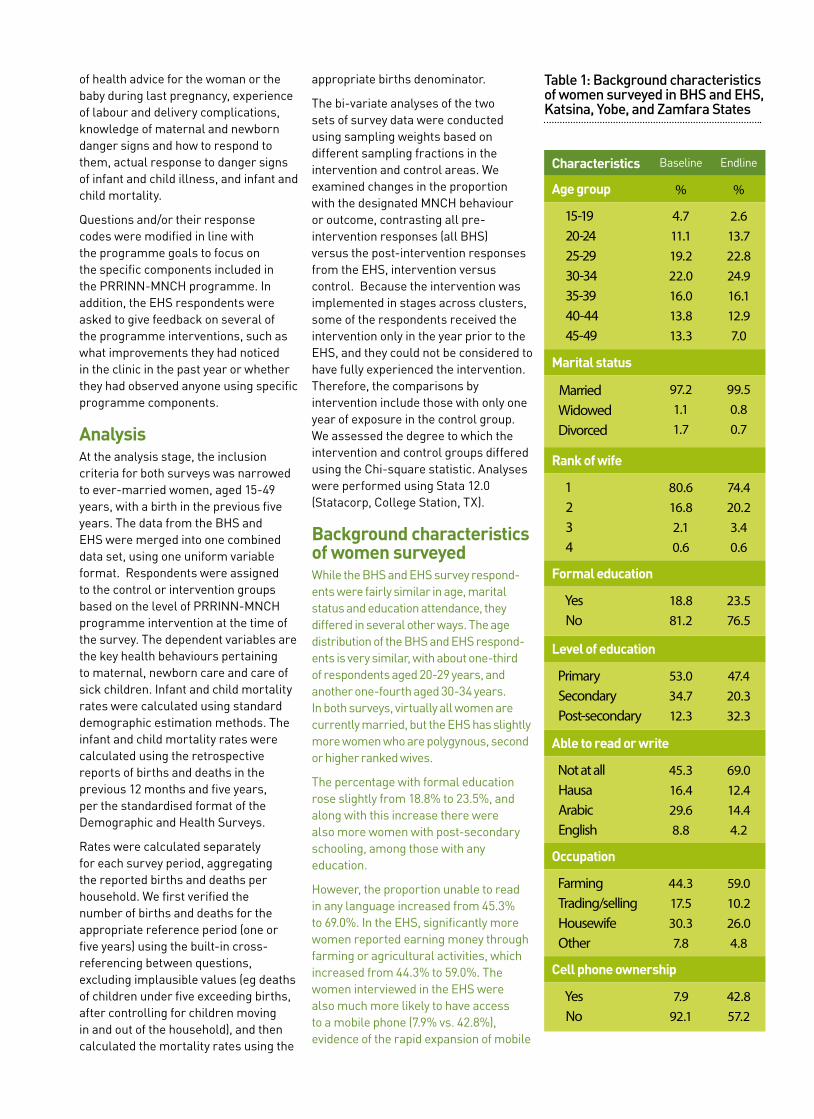
Background characteristics of women surveyedWhile the BHS and EHS survey respond-ents were fairly similar in age, marital status and education attendance, they differed in several other ways. The age distribution of the BHS and EHS respond-ents is very similar, with about one-third of respondents aged 20-29 years, and another one-fourth aged 30-34 years. In both surveys, virtually all women are currently married, but the EHS has slightly more women who are polygynous, second or higher ranked wives.
The percentage with formal education rose slightly from 18.8% to 23.5%, and along with this increase there were also more women with post-secondary schooling, among those with any education.
However, the proportion able to read in any language increased from 45.3% to 69.0%. In the EHS, significantly more women reported earning money through farming or agricultural activities, which
increased from 44.3% to 59.0%. The women interviewed in the EHS were also much more likely to have access to a mobile phone (7.9% vs. 42.8%), evidence of the rapid expansion of mobile phone access nationwide in the last five years. These differences reflect the transformations to these communities as more and more women are being drawn into the labour force to complement the meagre family income.
Antenatal care The majority of women (64.5%) consider it very important or essential to obtain their husband’s permission prior to going for an ANC visit, and another 22.9% consider it advisable. Consistent with these views on husband’s permission, most women responding to the EHS had obtained their husband’s permission to be seen, bringing the percentage from 40.2% up to 82.7% (see Table 1).
In 2009, virtually all ANC visits were provided by the doctor, nurse or midwife. After the efforts to increase the number of midwives at primary health care facilities and to provide CHEWs (community health extension workers) in the facilities with training on ANC visits, by 2013 over one-third of women received ANC from a CHEW in the facility or in the community, as part of her community rounds (see Fig 2).
Fig 2: Source of antenatal care for last pregnancy in previous 5 years
Before After
67.4%
21.7%
41.9%
25.2%
2.8%0.4%
6.5%
33.6%
0.6%0.0%
None CHEWFacility
Doctor, Nurse orMidwife
CHEW In The
Community
TBA
In addition to a doubling between 2009
Table 2: Background characteristics of women surveyed in BHS and EHS, Katsina, Yobe, and Zamfara States
Characteristics Baseline Endline
Age group % %
15-19 20-24 25-29 30-34 35-39 40-44 45-49
4.711.119.222.016.013.813.3
2.613.722.824.916.112.97.0
Marital status
Married Widowed Divorced
97.21.11.7
99.50.80.7
Rank of wife
1 2 3 4
80.616.82.10.6
74.420.23.40.6
Formal education
Yes No
18.881.2
23.576.5
Level of education
Primary Secondary Post-secondary
53.034.712.3
47.420.332.3
Able to read or write
Not at all Hausa Arabic English
45.316.429.68.8
69.012.414.44.2
Occupation
Farming Trading/selling Housewife Other
44.317.530.37.8
59.010.226.04.8
Cell phone ownership
Yes No
7.992.1
42.857.2

and 2013 in the percentage of women making any ANC visits, there was a greater understanding about ANC visits. By 2013, 62% of the women said they knew when to start with ANC visits. However, only 44.2% correctly specified the first trimester as recommended timing for the first ANC visit.
Fig 3: Timing of first ANC visit for those with any ANC
0%
22%
44%
66%
0%
22%
44%
66%
Before After
36.4%
25.2%
10.7%13.2%
61.7%
52.9%
FirstTrimester
SecondTrimester
ThirdTrimester
As shown in Fig 3, the percentage of ANC visits in the first trimester increased from 25.2% in 2009 to 36.4% in 2013. Half of all women who had any ANC (55%) did so in the first trimester of their pregnancy in the intervention communities, compared to only 41% in the control communities (chi-square=28.3, p=0.002). The majority of women surveyed (87.2%) knew that they should have a minimum of four ANC visits. Along with this change in knowledge, the proportion who had four or more ANC visits increased from 66.3% to 77.6% of all women with any ANC visits for their most recent pregnancy (chi-square=195.4, p<.001). Significantly more women had four or more ANC visits in the intervention than control communities (80.0% vs. 74.6%, chi-square=42.8, p<.001).
Women reported receiving more complete ANC services in 2013, compared to 2009 (see Fig 4). By the time of the EHS, 80% or more of the women received the basic package of ANC services: weighed and assessed the infant’s growth, blood pressure
taken, given supplements and anti-malarials and advised to sleep under a bed net, advised on exclusive breastfeeding and on newborn care. The only element of ANC which did not increase significantly from BHS to EHS was education about danger signs, which was received at ANC by only 66% of the women with any ANC.
Knowledge of maternal danger While only two-thirds of women heard about danger signs of pregnancy and delivery during their ANC visits, this was one of the most important reasons women gave for an antenatal consultation, with 42.4% of the women saying this was one of the main benefits of an ANC visit, about the same percentage who value learning about their baby’s growth (44.0%) (see Fig 5). Fewer than one-fifth rated the other ANC activities as an important reason for the visit.
Nonetheless, knowledge of maternal danger significantly increased between 2009 and 2013. As was seen in Table 1, there was a doubling in the percentage of women knowing at least four maternal danger signs (10.2% to 21.7%). In the inter-vention communities, 29.4% of women knew at least four maternal danger signs, compared to 14.0% in the control communities (p<0.001). Significantly more women knew specific danger signs, and with few exceptions, those in the interven-tion communities knew more of the danger signs of pregnancy and delivery (see Table 3). Each maternal danger sign was known by one-fourth or more of the women, and in the intervention communities, 30% or more knew the following danger signs: severe headache, swollen hands, severe bleeding, high fever and foul discharge, and labour lasting 12 hours or more.
As shown in Table 4, many more women were seeking advice about their health during pregnancy in 2013 compared to 2009. Importantly, there is a shift away from simply asking friends and family or the traditional birth attendant (TBA) for advice towards seeking advice from trained health workers, including the community volunteers or village health worker.
In 2013, the majority of women (92.7%) received advice about their pregnancy or future baby. More received information from the midwife, nurse or doctor
(from 5.7% to 19.8%), but importantly an additional half of women received advice from the CHEW in the facility or community or from the community volunteer. The programme-developed jingles aired on the radio were a source of information for 5% of women who otherwise had no information from a health care worker or volunteer. Thus, fewer women were relying on the TBAs or friends and family as their main source of advice about their pregnancy and delivery.
Part of the programme’s strategy to promote ANC was to encourage women to make preparations for their delivery. In 2009, only 37.8% of women made any preparation for their delivery, most commonly by setting aside money and preparing for a home delivery with a clean razor blade to cut the umbilical cord and clean clothes to wrap the baby. Only 4.6% had arranged for transport to a facility for delivery.
Between 2009 and 2013, after expanding the sources of information about maternal danger signs and the importance of birth preparations, more women were making preparations that included being ready for maternal emergencies (see Table 5). One-third reported learning maternal danger signs, and 16.4% had identified someone who would monitor labour to watch for danger signs. One-fourth had obtained standing permission from their husband to be transported to a facility for delivery, and 10.4% had already identified the ETS driver.
Well over half, 60.4%, had saved money for the delivery, and 14.3% had informed their family about community savings available to help defray costs if needed. Almost all of these preparations were more likely in the intervention communities, where the radio jingles reaching all communities in the state were complemented by community dialogues led by the community volunteers.
As shown in Table 1, the proportion of women delivering at home dropped from 89.4% to 76.1%, with significantly fewer having home deliveries in the intervention than the control communities. In 2009, 54.7% of deliveries were attended by a traditional birth

attendant, while in 2013 traditional birth attendants assisted at only 39.1% of deliveries. Between 2009 and 2013, the proportion of deliveries attended by a doctor, nurse, midwife, or trained CHEW at the facility rose from 11.2% to 23.9%.
Perhaps because of greater awareness and vigilance for danger signs, the percentage of women who reported serious complications rose from 2.14% in 2009 to 12.7% in 2013, with the most common complications being prolonged labour of more than 12 hours (33.9%), severe bleeding (31.7%), high fever (24.2%), and severe headache (23.1%).
Family planning and contracep-tion In 2013, the last segment of questions concerned views on birth spacing, a topic not included in the BHS. As shown in Table 6, two-thirds of women (69.4%) were unaware of methods to space births. Of those familiar with methods to space births, 71.2% knew about contraceptive pills and 9.5% knew about injectables, with virtually no awareness of other methods. Awareness of contraceptive pills was greater in the intervention than in the control commu-nities (73.4% vs. 68.1%.).
Only 8.4% of the women reported ever using any contraceptive methods, and among those who had used a contracep-tive method, the main methods used were contraceptive pills and injectables. Current use, however, shows an increase in implants, particularly in the control communities, where among current users, implants account for 18.5% of all contraceptive methods.
The last panel of Table 6 shows that there is an unmet demand for contraception. While 5.6% of women admitted that their current pregnancy was not wanted, 13.2% said that they did not want another child after the current pregnancy, with 16.8% expressing this sentiment in the intervention communities. Among those not currently pregnant, 15.7% indicated that they do not want another child.
Women’s experience of their local health clinic In 2013, the women were asked to comment on the overall quality of the services they had received at the facility, and whether they had seen improvements
in the past five years, namely since the programme had begun operation. Half of the respondents (52.2% or 2,418 out of 4,624 respondents) had visited their primary health clinic within the previous six months. Those in the intervention communities were significantly more likely to have made a clinic visit in the previous six months, 54.6% versus 49.9% in the control communities (chi-square=10.36, p=0.001).
Two-thirds (67.6%) had noticed at least one of ten different improvements to
the services provided at their closest clinic, with the following noticed by 25% or more: more equipment in the clinic (42.8%), staff more welcoming (26.6%), open more often (25.8%), and staff can handle more problems easily (24.6%). About 20% also noticed more women staff (19.3%) and that the clinic was less costly (19.0%).
When asked what they liked the most about their health clinic, 23% said the friendliness of the health workers, 21% said they gave the care we need, and
Fig 4: Services received during ANC visits for those with any ANC visits
Fig 5: Most important reason for ANC visits by BHS and EHS
Measure baby’s growth 44%
Hear about maternal danger signs 42.4%
Get anti-malarial medication 20.8%
Get pills to prevent anaemia 19.4%
Tetanus immunisation 18.8%
Learn how to prepare for a healthy baby 14.3%
Learn how to care for newborn 8.0%%
Blood pressure taken 96.4%
72.9%Weighed
93.6% 68.9%
Given vitamins/iron/anti-malarial 92.7%
68.1%Advised on newborn care
81.9% 56.6%
Advised on breast feeding 81.0%
47.2%Educated about danger signs
66.5% 64.0%
Before
After

Table 3: Knowledge of pregnancy or delivery danger signs for most recent pregnancy in the past 5 years, BHS-2009 vs EHS-2013 by intervention group (%)
Danger sign Baseline Endline EHS Control
EHS Intervention
Intervention v Control (p)
None 24.3 25.9 28.8 23.6 67.67(p<0.001)
Severe headache 42.6 51.3 48.1 53.9 20.3(p<0.001)
Swollen face or hands 2.2 33.9 31.6 35.7 11.26(p=0.001)
Convulsions or ‘fitting’ 1.4 26.4 23.5 28.6 20.32(p<0.001)
Severe bleeding 0.3 46.5 43.6 48.7 15.83(p<0.001)
High fever 25.9 30.4 28.0 32.3 13.26(p<0.001)
Foul-smelling discharge 6.4 30.4 28.0 32.3 13.26(p<0.001)
Baby’s hand or foot coming first 14.1 22.7 22.1 23.3 1.22 (p=0.270)
Labour >12 hours 38.7 41.6 40.3 42.6 3.520(p=0.061)
Placenta not out in 30 mins 22.1 27.1 26.2 27.8 1.944(p=0.163)
Number 2,473 6,130 2,715 3,415
Table 4: Source for women who sought advice about the health of themselves or their future baby during their most recent pregnancy in the past 5 years, BHS vs EHS (%)
Source BHS EHS EHS Control
EHS Intervention
No-one 74.9 7.30 7.91 6.70
Midwife, nurse or doctor 5.7 19.8 20.2 19.3
CHEW facility 0 24.0 19.1 28.8
CHEW community 0 3.96 5.25 2.71
Traditional birth attendant 2.5 0.17 0.22 0.13
Community volunteer, friends or family 0 8.88 8.88 8.69
Radio NA 5.10 5.26 4.94
Number 2,360 4,590 2,262 2,328
17% said that drugs were available. Their overall satisfaction with the care at their clinic was rated as good by 63.4% of the respondents, and 76.6% considered the relation between the community and the clinic to be good.
In addition to noticing improvements in the quality of service at their clinic, 75.2% had been aware of or participated in at least one of the community-based health promotion activities introduced by the programme, with significantly more in the intervention than control communities, 79.8% versus 64.6% (chi-
square=130.5, p<0.001).
ConclusionsBetween 2009 and 2013, there was significant improvement in practically all maternal health outcomes. By 2013, the majority of women (82.7%) had standing permission from their husband to go to the health centre, and health care use went up. The proportion of women having a skilled birth attendant (SBA) increased from 11.2% to 23.9%, and the proportion of women having at least one antenatal care (ANC) visit
doubled from 24.9% to 48.8%.
More women started ANC early in their pregnancy (36% in the first trimester), up from only 25% in 2009, and the percentage completing four or more ANC visits rose from 66% to 78%. Antenatal care was increasingly being provided by trained CHEWs at the primary health centre, who provided ANC to 34% of all women with recent pregnancies in 2013. The quality of ANC care also improved during this period. In 2009, only 60% received four out of six key services of ANC, and by 2013, 80% or more had received five of the six

Table 5: Type of birth preparation in most recent pregnancy, EHS 2013 (%)
Birth preparation EHS EHS Control
EHS Intervention
Intervention vs Control
Learn danger signs 34.70 29.50 38.90 58.45 (<0.001)
Save money 60.40 48.00 62.30 11.48 (0.001)
Family informed about community savings 14.25 12.71 15.47 9.45 (0.002)
Someone to identify danger signs 16.40 15.21 17.36 5.11 (0.024)
Obtaining standing permission from husband 22.40 10.56 24.67 22.73 (<.001)
ETS identified 10.43 10.28 10.55 0.119 (0.730)
Blood donor identified 9.27 8.25 10.08 0.119 (0.730)
key services of ANC.
These improvements in women’s use of the care available at the health facilities reflect the two-pronged approach of PRRINN-MNCH. The PRRINN-MNCH programme invested in upgrading facilities, assuring that they were staffed, supplied and equipped, and that the staff were well trained. These improvements were noticed by two thirds of those interviewed in the EHS. While more women noticed improvements in the intervention than control communities (71.7% versus 63.5%), the improvements were experienced throughout the states. Hence, many of the improvements, particularly those relating to care delivered at the facility did not always differ by intervention community.
Improved maternal awareness and behaviour Almost all the maternal awareness and behaviour indicators improved between 2009 and 2013, and most of them showed a greater improvement in the intervention than control communities. In 2013, two times more women (22%) knew at least four maternal danger signs than in 2009, when only 10% knew four or more danger signs. By 2013, the majority of women (92.7%) had received advice about their pregnancy or future baby, and there was an increase in advice from health workers, including from the trained CHEW in the facility or from the community volunteer in the intervention communities.
The programme-developed jingles aired on the radio were a source of information for 5% of women who otherwise had no information from a health care worker or volunteer. More women were making preparations that included being ready for maternal emergencies. Almost all of these preparations were more likely in the intervention communities, where the radio jingles reaching all communities in the state were complemented by community dialogues led by the community volunteers.
Because only half the women made any ANC visits in their most recent pregnancy, these changes in maternal awareness and preparations reflect the combined influence of consultations with health care workers at the clinic and with the community health workers, volunteers, and other community mobilisation activities facilitated by the programme.
Communities helping each otherThe intervention communities were engaged in a wide variety of community mobilisation, education and health promotion activities that aimed at overcoming fears and misunderstandings and building confidence in the health care system, along with the use of creative and participatory mechanisms for educating men and women throughout the community about healthy pregnancies and preparations for safe deliveries.
In addition, community support systems were established that helped women obtain the services they needed, such as free emergency transport services for women in labour, community savings groups, and community blood donor groups. The majority of women (80%) in the intervention communities reported being aware of or participating in at least one of the many different community engagement activities and the changes in maternal care and behaviours observed in 2013 reflect this high level of participation.
The combined health system and community changes contributed to the changes observed in the proportion of women with a skilled birth attendant for their most recent pregnancy, which doubled from 11% to 24%. Fewer women gave birth alone, and, as noted above, more women asked one of their family members to watch for danger signs and were prepared to take them to the clinic for delivery if complications emerged.
Net impactsThe net impact of these changes in the intervention communities was a decline in the maternal mortality ratio from about 1,300 to 1,057 deaths per 100,000 live births. There was virtually no change to the MMR in the control communities, suggesting that the critical elements may have been the intense efforts of the community engagement activities on saving mothers’ lives.
Implementation of the integrated

Table 6: Views on birth spacing 2013 by intervention group (%)
EHS EHS Control
EHS Intervention
Chi-square (p)
What methods can couples use to space births?
NoneMethod, if any knownContraceptive pillsInjectables
n=4,626
69.4n=1,463
71.29.5
n=2,275
73.5n=627
68.19.9
n=2,351
65.3n=836
73.49.2
58.45 (<0.001)
43.0 (<0.001)
What methods have you used to space births?NonePillsInjectablesNumber
91.62.63.8
4,625
91.32.44.4
2,275
91.82.83.2
2,351 19.5 (0.052)
What methods do you use now (among users)
PillsInjectablesImplantChi-square (p)
n=1120.746.910.8
n=5413.053.718.5
n=5728.140.43.5
22.41 (0.002)
Estimate of unmet needs for contraception
Current pregnancy not wanted nowDo not want another child after this pregnancyDo not want another child, not pregnant n=3,675
Pregnant now = 924
5.613.215.7
Pregnant now = 456
3.79.5
18.2
Pregnant now = 468
6.916.813.3
0.618 (0.432)9.86 (0.002)
16.60 (<0.001)
maternal care initiatives to strengthen EmOC services in the target clusters, support midwifery skill enhancement, facilitate access to these obstetric care services through emergency transport schemes, and continued expansion of the community engagement efforts to promote birth preparedness and planning, also appear to have contributed to the maternal mortality reductions.
The sisterhood method of calculating the MMR is based on the history of maternal death for the woman’s sisters; the historical reference period is likely to go back more than five years. Hence, it is likely that the actual levels of change in the MMR could be greater than what was estimated by the sisterhood method.
While it is likely that most of the changes observed in the intervention communities relate to programmes introduced through the partnership, initiatives sponsored by other agencies or programmes, such as the child
nutrition programme implemented by Save the Children or other Safe Motherhood initiatives, could have independently raised health outcomes in both the intervention and control areas.
In addition, intervention activities and particularly the community demand-generation activities were rolled out by cluster, and by the time the EHS was conducted, the vast majority of the LGAs had some exposure to the intervention. Not all the intervention areas had received the intervention throughout the intervening period between the BHS and EHS. Therefore, some of the EHS intervention communities might have been less ‘intervention’ and more ‘control’. We have minimised this potential effect by excluding from the intervention any community which had received the intervention in the year before the survey date.
In summary, after four years, there were significant improvements in maternal health outcomes. This is seen
most clearly in the comparison of the outcomes for the intervention versus control communities, suggesting that the work of the programme through local communities and primary health care services had a measurable impact. Statewide improvements after implementing the complex, integrated, and multi-level set of interventions have nonetheless contributed to improvements in the control communities.

The PRRINN-MNCH programme works with federal, state and local governments and local communities to improve the quality and availability of maternal, newborn and child health services.
www.prrinn-mnch.org Email: [email protected]
The PRRINN-MNCH programme is funded and supported by UK aid from the UK Government and the State Department of the Norwegian Government. The programme is managed by a consortium of Health Partners International, Save the Children and GRID Consulting, Nigeria.
References
1. UNICEF. The state of the world’s children 2009. New York: United Nations Children’s Fund, 2009.
2. World Health Organization. Cause-specific mortality and morbidity, maternal mortality ratio. World Health Statistics, Global Health Observatory Repository Data. Available at: http://apps.who.int/ghodata; Accessed 31 October 2011.
3. Federal Ministry of Health of Nigeria, Save the Children and ACCESS. Saving newborn lives in Nigeria: newborn health in the context of the integrated maternal newborn and child health strategy. Abuja, Nigeria: Federal Ministry of Health, Save the Children and ACCESS, 2009.
4. National Population Commission [Nigeria] and ICF Macro. Nigeria Demographic and Health Survey 2008 Preliminary Report. Abuja, Nigeria and Calverton, Maryland: National Population Commission and ICF Macro, 2009.
5. National Population Commission (NPC) [Nigeria] and ORC Macro. Nigeria Demographic and Health Survey 2003. Calverton, Maryland: National Population Commission and ORC Macro, 2004.
6. Doctor HV. Maternal mortality in northern Nigeria: findings of a health and demographic surveillance system in Zamfara State, Nigeria. Trop Doctor. 07 2012;42(3):140-143.
7. Ezeanochie M, Olagbuji B, Agholor K, Okonofua F. Attaining MDG5 in northern Nigeria: Need to focus on skilled birth attendance. Afr J of Repro Health. 2010;14(2):9-11.

This documenT is one of a series of Technical briefs ThaT draw on The acTiviTies, resulTs and lessons learned from The Prrinn-mnch Programme
Changes in key maternal, newborn and child health outcomes
Key messages: PRRINN-MNCH intervention in Northern Nigeria led to significant improvements in practically all maternal health outcomes.
1 All health indices, but particularly those for mothers and children, are worse in Northern Nigeria.
2From baseline to endline, there was significant improvement in every maternal, newborn, and child health outcome.
3 The four states are on track to meet the 2015 MDG4 target of a two-thirds reduction in the under-five mortality rate.
Results from the 2013 Endline Household Survey
The challenge: poor maternal, newborn and child health indicesMaternal health outcomes in Nigeria are among the worst in the world, with Nigeria second only to India in the number of maternal deaths. In Northern Nigeria the maternal mortality ratio (MMR) is higher than the national average with recent estimates for the north over 1,200 deaths per 100,000 live births, compared to below 300 deaths per 100,000 live births in the south.
In Northern Nigeria, the rise in maternal mortality has been accompanied by a decline in antenatal care (ANC) and deliveries with a skilled birth attendant (SBA). According to the 2003 and 2008 Nigeria Demographic and Health Surveys, between 2003 and 2008, the percentage of women who received any ANC services for births in the previous five years dropped from 36.9% to 31.1% in the North West (including Katsina and Zamfara states) and from 47.3% to 43.0% in the North East (including Yobe state). Similarly, the percentage of women with skilled assistance at delivery declined from 12% to 8.9% in the North West and from 19.8% to 13.1% in the North East.
Along with these changes in maternal care patterns, there has been less progress in improving infant and child survival and primary care. As of 2008, the North West and North East regions had the highest proportions of children 12-23 months who had never
been vaccinated, 48.7% and 33.9%, respectively, and fewer than 15% had a vaccination card. Vaccination coverage rates in Zamfara, Katsina, Jigawa and Yobe were all 5.4% and below. When they became sick with pneumonia, malaria or diarrhoea, under half of all sick children were taken to a health facility for treatment. Infant mortality rate (IMR) was 139 and 126 deaths per 1,000 live births, while under-five mortality was 217 and 222 deaths per 1,000 live births, respectively.
The response: the broad-based PRRINN-MNCH programmeIn the face of this evidence of stagnation or decline in maternal and child health in the North West and North East, the Partnership for Reviving Routine Immunisation in Northern Nigeria (PRRINN) was established in 2006, and expanded in 2008 to include maternal, newborn and child health (MNCH), becoming the PRRINN-MNCH programme.
The assessment of the impact of the PRRINN-MNCH programmes uses a quasi-experimental design with pre and post-intervention household surveys in the intervention and control communities. The pre-intervention or Baseline Household Survey (BHS) was conducted in spring 2009 and the post-intervention household survey, the Endline Household Survey (EHS) was conducted in spring 2013.
The evaluation of the impact of the integrated MNCH package takes into account both availability of the programme and actual individual participation in any of the programme’s community-based service activities. Availability of the programme was assessed by comparing intervention and control areas. Initially, Jigawa state was not included in the MNCH programme intervention, so the BHS did not include Jigawa. As the BHS was entirely pre-intervention, all responses in the BHS were considered control. However, for comparison purposes the BHS was subdivided into intervention (receiving the intervention starting in
Technic al Brief 3 0f 3 EVIDENCE FOR ACTION

2009), and control (not yet receiving any intervention).
By 2013 virtually all the state LGAs in the original sample had received statewide interventions, eg training of health care workers or facility upgrades, but not all had received the community engagement package. Therefore, in the EHS the control areas were those which had not yet received the integrated community engagement package, including any LGAs not in the original sample but which had begun to be included in the basic intervention. Individual exposure to the programme was assessed by each woman’s responses to questions eliciting sources of information or health care advice and her explicit response to questions about observing or participating in activities introduced by the programme.
The study was approved by State Ethics Review Committees in each of the states. These ethics review committees are certified by the Nigerian Federal Government’s National Health Research Ethics Committee to review and approve health research protocols for their states.
Sampling methodologyThe sampling plan was a stratified two-stage cluster sample, with oversampling of individuals in the MNCH intervention clusters using a ratio of 2:1. This was because MNCH clusters cover a significantly lower proportion of the population of each state. Oversampling therefore provided a sufficient sample in the intervention areas to assess the impact of key elements within the intervention package on the key MNCH outcomes.
The primary sampling unit was the Local Government Area (LGA) – 24 in the BHS and 51 in the EHS. For the EHS, the same intervention LGAs as the BHS were included, with the exception of LGAs of the state capitals (considered not an appropriate control for the largely rural intervention), and the addition of the Jigawa intervention LGAs and any previously control LGAs which had the full intervention extended to their locality. The LGAs comprising the state capitals were included only during the baseline to assess the differences in services provided to
residents patronising urban versus rural facilities. This enabled the team to devise appropriate strategies for referral from rural to urban facilities. The state capitals were excluded in the analyses reported here. The number of households selected per LGA was proportional to the size of the LGA.
The study was designed with an 80% power to detect a 2.5% change in the percentage of women delivering with the assistance of skilled birth attendants between the BHS and the EHS. The BHS was designed to be representative of all ever-married women in the household and required a sample of 5,560 households, while the EHS was designed to be representative only of ever-married women with a birth in the previous five years, with a minimum sample requirement of 2,310 households.
Oversampling was used to increase the number of intervention community respondents to provide additional power for behaviours with a lower frequency but which were of particular interest to the programme, such as receiving advice from a community health worker. Because stratified sampling was used with differential sampling proportions for the intervention and control strata, weights are used in the analysis.
Within the LGA, the sample of households was allocated to intervention and control communities in proportion to the size of the community or village. The sampling fraction for each community was determined by information on the total households from the community leadership. Households within each selected community were randomly sampled using a procedure similar to that used in the WHO-EPI (World Health Organization Expanded programme on Immunization) cluster surveys, namely by numbering then sampling households according to the community sampling fraction along randomly selected paths leading out from the centre of the village.
The household was the ultimate sampling unit. In compounds of one to three households, one household was randomly chosen for interviews; in compounds with four to six households, two were
surveyed; in compounds with seven or more households, three were surveyed. Within each randomly selected household in the BHS, all ever-married women of childbearing age (15-49 years) were inter-viewed, whereas in the EHS only one ever-married woman with at least one child born in the last five years was selected for interview. The inclusion criteria were changed for the midterm and endline surveys because of the need to focus on women with pregnancies and births during the intervention. The completed interviews were 6,842 in the BHS and 4,612 in the EHS.
Fig 1: Infant and under-5 mortality rates (per 1,000 live births)
Before After
63
90
160
102
InfantMortality
Under-5Mortality
The surveysInterviewers who had completed secondary school or higher were trained to visit the selected women at home with a questionnaire that included translation of key concepts and terms in the local languages (eg Hausa, Kanuri). Most of the interviewers were females, responding to cultural expectations and beliefs that encourage female interviewers to interview female respondents. The questionnaires were standardised across the three survey rounds and used close-ended questions from the 2008 Demographic and Health Survey to allow comparisons of results with other national or state-level data.
The question topics covered age, parity, economic status, literacy in any language, wife rank, antenatal care and delivery characteristics, source
of health advice for the woman or the baby during last pregnancy, experience of labour and delivery complications, knowledge of maternal and newborn danger signs and how to respond to them, actual response to danger signs of infant and child illness, and infant and child mortality.
Questions and/or their response codes were modified in line with the programme goals to focus on the specific components included in the PRRINN-MNCH programme. In addition, the EHS respondents were asked to give feedback on several of the programme interventions, such as what improvements they had noticed in the clinic in the past year or whether they had observed anyone using specific programme components.
AnalysisAt the analysis stage, the inclusion criteria for both surveys was narrowed to ever-married women, aged 15-49 years, with a birth in the previous five years. The data from the BHS and EHS were merged into one combined data set, using one uniform variable format. Respondents were assigned to the control or intervention groups based on the level of PRRINN-MNCH programme intervention at the time of the survey. The dependent variables are the key health behaviours pertaining to maternal, newborn care and care of sick children. Infant and child mortality rates were calculated using standard demographic estimation methods. The infant and child mortality rates were calculated using the retrospective reports of births and deaths in the previous 12 months and five years, per the standardised format of the Demographic and Health Surveys.
Rates were calculated separately for each survey period, aggregating the reported births and deaths per household. We first verified the number of births and deaths for the appropriate reference period (one or five years) using the built-in cross-referencing between questions, excluding implausible values (eg deaths of children under five exceeding births, after controlling for children moving in and out of the household), and then calculated the mortality rates using the
appropriate births denominator.
The bi-variate analyses of the two sets of survey data were conducted using sampling weights based on different sampling fractions in the intervention and control areas. We examined changes in the proportion with the designated MNCH behaviour or outcome, contrasting all pre-intervention responses (all BHS) versus the post-intervention responses from the EHS, intervention versus control. Because the intervention was implemented in stages across clusters, some of the respondents received the intervention only in the year prior to the EHS, and they could not be considered to have fully experienced the intervention. Therefore, the comparisons by intervention include those with only one year of exposure in the control group. We assessed the degree to which the intervention and control groups differed using the Chi-square statistic. Analyses were performed using Stata 12.0 (Statacorp, College Station, TX).
Background characteristics of women surveyedWhile the BHS and EHS survey respond-ents were fairly similar in age, marital status and education attendance, they differed in several other ways. The age distribution of the BHS and EHS respond-ents is very similar, with about one-third of respondents aged 20-29 years, and another one-fourth aged 30-34 years. In both surveys, virtually all women are currently married, but the EHS has slightly more women who are polygynous, second or higher ranked wives.
The percentage with formal education rose slightly from 18.8% to 23.5%, and along with this increase there were also more women with post-secondary schooling, among those with any education.
However, the proportion unable to read in any language increased from 45.3% to 69.0%. In the EHS, significantly more women reported earning money through farming or agricultural activities, which increased from 44.3% to 59.0%. The women interviewed in the EHS were also much more likely to have access to a mobile phone (7.9% vs. 42.8%), evidence of the rapid expansion of mobile
Table 1: Background characteristics of women surveyed in BHS and EHS, Katsina, Yobe, and Zamfara States
Characteristics Baseline Endline
Age group % %
15-19 20-24 25-29 30-34 35-39 40-44 45-49
4.711.119.222.016.013.813.3
2.613.722.824.916.112.97.0
Marital status
Married Widowed Divorced
97.21.11.7
99.50.80.7
Rank of wife
1 2 3 4
80.616.82.10.6
74.420.23.40.6
Formal education
Yes No
18.881.2
23.576.5
Level of education
Primary Secondary Post-secondary
53.034.712.3
47.420.332.3
Able to read or write
Not at all Hausa Arabic English
45.316.429.68.8
69.012.414.44.2
Occupation
Farming Trading/selling Housewife Other
44.317.530.37.8
59.010.226.04.8
Cell phone ownership
Yes No
7.992.1
42.857.2

phone access nationwide in the last five years. These differences reflect the transformations to these communities as more and more women are being drawn into the labour force to complement the meagre family income.
The results: improving health indices
Key outcomes From baseline to endline, there was significant improvement in every targeted maternal, newborn, and child health outcome. Under-five mortality per 1,000 live births declined from 160.0 to 102.2 and infant mortality from 90.0 to 63.0. The maternal mortality ratio (MMR) at the baseline was at least 1,270 per 100,000 live births, which was the ratio calculated using the sisterhood method in the PRRINN-MNCH midterm survey of 2011,1 and considered conservative given other estimates for MMR in Northern Nigeria averaging 2,420.2 Using the sisterhood method with data from the EHS, the MMR is estimated to have gone down to 1,190. It had barely gone down, to 1,260, in the control communities, but went down considerably to 1,057 in the intervention communities with the full community engagement set of interventions.
Fig 2: Women who had ANC or a SBA for their last pregnancy and delivery (%)
0.000000%
16.666667%
33.333333%
50.000000%
0.000000%
16.666667%
33.333333%
50.000000%
Before After
48.8%
24.9%
11.2%
23.9%
ANC SBA
Improvements were seen in the proportions of women having a skilled
birth attendant (SBA), which increased from 11.2% to 23.9%, having two or more anti-tetanus vaccinations from 71.8% to 86.2%, and delivery with a caesarean section, which increased from 0.74% to 1.54%. The proportion of women having at least one antenatal care visit (ANC) doubled from 24.9% to 48.8% (see Fig 2).
Childhood vaccination rates also rose significantly, with the proportion of one-year-olds with measles vaccine rising from 20.1% to 46.0%, polio3 from 25.7% to 68.2%, and DPT3 from 5.1% to 83.3%. The proportion of one-year-olds fully vaccinated according to documentation on the child’s vaccination card and by maternal self-report rose from 2.2% to 19.3%, while the proportion fully vaccinated among children who have vaccination cards rose from 16.0% to 36.0% (see Fig 3).
There was a doubling in the percentage of women knowing at least four maternal danger signs (10.2% to 21.7%) as well as a very large increase in the proportion of women knowing the number of visits required for a child to complete the vaccination series, from 7.7% to 44.2%. The proportion of women with standing permission to take a child to the health clinic also increased from 40.2% to 82.7%.
Disaggregating the EHS results into the intervention and control communities shows that the achievements observed overall between the baseline and midterm are primarily in the intervention communi-ties (Table 2, columns 3-4). While the under-five mortality rates and IMRs declined in the control areas, the decline was much greater in the intervention areas, where the under-five mortality rate dropped to 95.2 and the IMR declined to 50.8. For several of the maternal and child health care utilisation indicators, the improvements in the intervention areas outpaced those of the control areas: any ANC from trained personnel (53.0% vs 44.6%, p<0.001), percentage of one-year-olds who have the measles vaccination (49.9% vs 41.4%, p=.001) and who are fully immunised according to doses reported by the mother and on vaccination cards (21.7% vs. 16.4%, p=.007).
Half of all women who had any ANC (55%) did so by the fourth month of their pregnancy in the intervention
communities, compared to only 41% in the control communities (chi-square=28.3, p=0.002). In the intervention communities, 29.4% of women knew at least four maternal danger signs, compared to 14.0% in the control communities (p<0.001). In the intervention communities, 47.5% of the mothers of infants knew the number of visits required to fully immunise their child, compared to only 41.4% in the control communities (p=0.066).
Fig 3: One-year-old vaccination rates by antigen, (based on maternal self report or card notation)
Before After
20.1%25.7%
46%
68.2%
19.3%
2.2%5.1%
82.3%
16%
36%
Measles DPT 3Polio 3 FIC FIC By Card
Key outcomes by stateBecause of a smaller number of respondents in the states, we cannot calculate robust estimates of maternal, infant and child mortality, so these are omitted from the state outcomes. For each state, we summarise the major changes in MNCH health outcomes and behaviours from baseline to endline survey for that state and then we assess the significance of the difference between the intervention and control areas. In addition, because there was no baseline survey conducted in Jigawa in 2009, the EHS results for Jigawa are compared to those for all three states together in 2009.
Jigawa: Compared to the baseline 2009 results for all states (used as the baseline for Jigawa), there were significant improvements in all key MNCH outcomes with the exception of

knowledge of maternal danger signs (Table 3.1). Overall, the rates more than doubled, and for some outcomes they tripled. The proportion of women having any ANC rose from 24.9% to 84.6%, delivery with an SBA from 11.2% to 27.0%), and 2+ anti-tetanus vaccinations from 18.6% to 76.1%.
Childhood vaccination rates also rose significantly, with the proportion having measles by age one rising from 20.1% to 63.6%, those with polio 3 rising 25.7% to 78.0%, and those with the third DPT dose from 5.1% to 79.0%. In all,
the proportion of one-year-olds fully vaccinated rose from 2.2% to 31.1%, based on all doses reported by the mother and the card.
For those with a card, the proportion fully vaccinated rose from 16.0% to 24.5%. There was a nine-fold increase in the proportion of women knowing the number of visits required for a child to complete the vaccination series, from 7.7% to 44.0%. The proportion of women with standing permission to take a child to the health clinic more than doubled from 40.2% to 94.5%. There was no change in the
percentage of women knowing at least four maternal danger signs, 10.2%.
Disaggregating the EHS into the intervention and control communities shows that the achievements were greater in the intervention than control communities for all the MNCH outcomes except most childhood vaccination coverage rates (Table 3.1, columns 3-5). The prevalence of the appropriate behaviour is significantly greater in the intervention than control community according to five key indicators: deliveries with SBAs (33.0% vs 21.3%,
Table 1: Comparison of key MNCH outcomes, Baseline 2009 (BHS) to Endline 2012 (EHS), PRRINN-MNCH states of Katsina, Yobe, and Zamfara
Key maternal health indicators
BHS EHS EHS Control
EHS Intervention
BHS v EHS
Intervention v Control
Under-5 mortality rate /1,000 live births
160.0 102.2 116.8 95.2 7.74(<0.001) 1.86(0.062)
Infant mortality rate /1,000 live births
90.0 63.0 88.6 50.8 2.31(0.019) 2.23(0.026)
Maternal mortality ratio /100,000 births*
>1271 1190 1262 1057 NA .NA
% births attended by a skilled birth attendant
11.2 23.9 24.2 23.5 210.6(<0.001) 0.295(0.587)
% women aged 15-49 who have 2+ TT doses
71.8 86.2 86.5 86.0 28.25(<0.001) 0.069(0.793)
% caesarian section rates 0.74 1.54 1.55 1.53 5.51(0.019) 0.003(0.957)
% women receiving ANC by trained person
24.9 48.8 44.6 53.0 153.2(<0.001) 32.05(<0.001)
% 1-year-olds immunised against measles
20.1 46.0 41.4 49.9 13.44(<0.001) 4.970(<0.001)
% 1-year-olds that have received OPV3 (polio3)
25.7 68.2 69.3 67.4 25.38(<0.001) 0.671(<0.413)
% 1-year-olds that have received DPT3
5.1 83.3 84.0 82.7 65.4(<0.001) 0.447(<0.504)
% 1-year-olds fully immunised (maternal self report)
2.2 19.3 16.4 21.7 11.60(<0.001) 7.402(<0.007)
% 1-year-olds fully immunised (vaccination cards)
16.0 36.0 38.4 34.0 13.98(<0.001) 3.472(<0.062)
% women with standing permission to take child to a health centre
40.2 82.7 82.7 82.8 860.2(<0.001) 2.786(<0.248)
% women who know 4 maternal danger signs
10.2 21.7 14.0 29.4 230.0(<0.001) 161.03(<0.001)
% mothers of children under 2 years who know number of visits needed
7.7 44.2 41.4 47.5 163.0(<0.001) 3.379(<0.066)
* MMR includes Jigawa. t-test is used for the mortality and c-section rates, while chi-square is used for all other comparisons
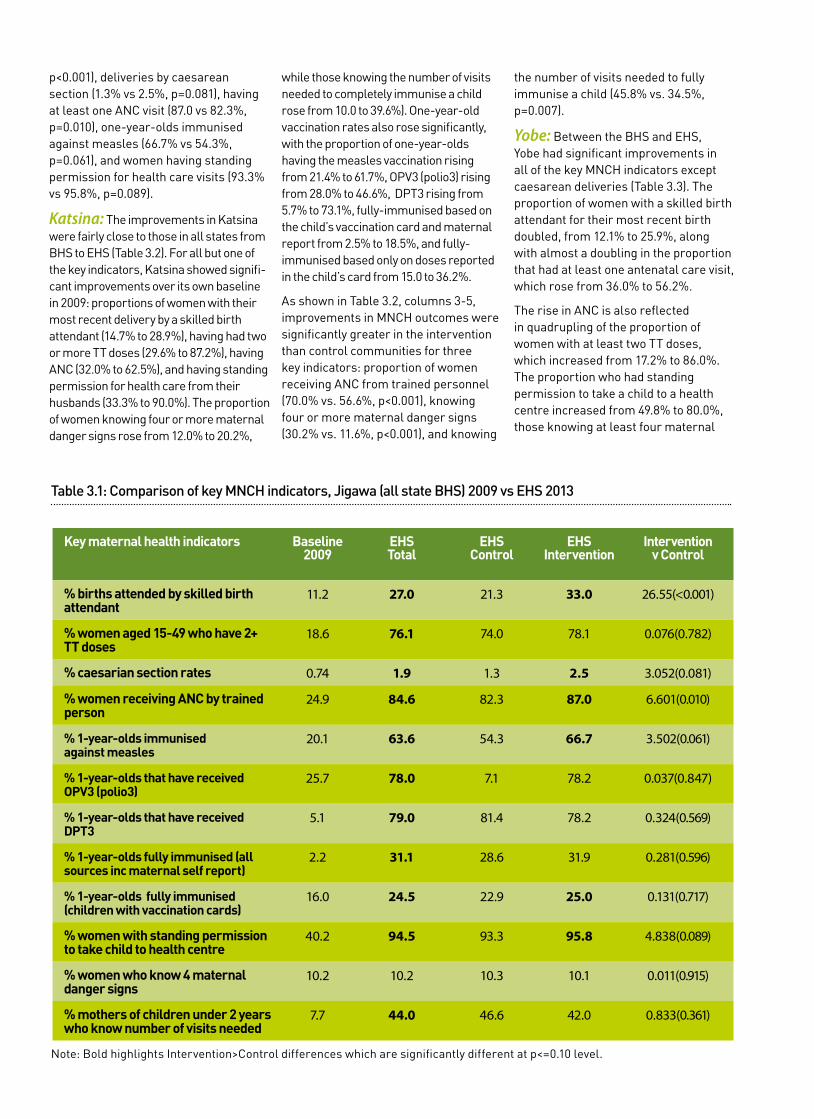
p<0.001), deliveries by caesarean section (1.3% vs 2.5%, p=0.081), having at least one ANC visit (87.0 vs 82.3%, p=0.010), one-year-olds immunised against measles (66.7% vs 54.3%, p=0.061), and women having standing permission for health care visits (93.3% vs 95.8%, p=0.089).
Katsina: The improvements in Katsina were fairly close to those in all states from BHS to EHS (Table 3.2). For all but one of the key indicators, Katsina showed signifi-cant improvements over its own baseline in 2009: proportions of women with their most recent delivery by a skilled birth attendant (14.7% to 28.9%), having had two or more TT doses (29.6% to 87.2%), having ANC (32.0% to 62.5%), and having standing permission for health care from their husbands (33.3% to 90.0%). The proportion of women knowing four or more maternal danger signs rose from 12.0% to 20.2%,
while those knowing the number of visits needed to completely immunise a child rose from 10.0 to 39.6%). One-year-old vaccination rates also rose significantly, with the proportion of one-year-olds having the measles vaccination rising from 21.4% to 61.7%, OPV3 (polio3) rising from 28.0% to 46.6%, DPT3 rising from 5.7% to 73.1%, fully-immunised based on the child’s vaccination card and maternal report from 2.5% to 18.5%, and fully-immunised based only on doses reported in the child’s card from 15.0 to 36.2%.
As shown in Table 3.2, columns 3-5, improvements in MNCH outcomes were significantly greater in the intervention than control communities for three key indicators: proportion of women receiving ANC from trained personnel (70.0% vs. 56.6%, p<0.001), knowing four or more maternal danger signs (30.2% vs. 11.6%, p<0.001), and knowing
the number of visits needed to fully immunise a child (45.8% vs. 34.5%, p=0.007).
Yobe: Between the BHS and EHS, Yobe had significant improvements in all of the key MNCH indicators except caesarean deliveries (Table 3.3). The proportion of women with a skilled birth attendant for their most recent birth doubled, from 12.1% to 25.9%, along with almost a doubling in the proportion that had at least one antenatal care visit, which rose from 36.0% to 56.2%.
The rise in ANC is also reflected in quadrupling of the proportion of women with at least two TT doses, which increased from 17.2% to 86.0%. The proportion who had standing permission to take a child to a health centre increased from 49.8% to 80.0%, those knowing at least four maternal
Table 3.1: Comparison of key MNCH indicators, Jigawa (all state BHS) 2009 vs EHS 2013
Key maternal health indicators Baseline 2009
EHS Total
EHS Control
EHS Intervention
Intervention v Control
% births attended by skilled birth attendant
11.2 27.0 21.3 33.0 26.55(<0.001)
% women aged 15-49 who have 2+ TT doses
18.6 76.1 74.0 78.1 0.076(0.782)
% caesarian section rates 0.74 1.9 1.3 2.5 3.052(0.081)
% women receiving ANC by trained person
24.9 84.6 82.3 87.0 6.601(0.010)
% 1-year-olds immunised against measles
20.1 63.6 54.3 66.7 3.502(0.061)
% 1-year-olds that have received OPV3 (polio3)
25.7 78.0 7.1 78.2 0.037(0.847)
% 1-year-olds that have received DPT3
5.1 79.0 81.4 78.2 0.324(0.569)
% 1-year-olds fully immunised (all sources inc maternal self report)
2.2 31.1 28.6 31.9 0.281(0.596)
% 1-year-olds fully immunised (children with vaccination cards)
16.0 24.5 22.9 25.0 0.131(0.717)
% women with standing permission to take child to health centre
40.2 94.5 93.3 95.8 4.838(0.089)
% women who know 4 maternal danger signs
10.2 10.2 10.3 10.1 0.011(0.915)
% mothers of children under 2 years who know number of visits needed
7.7 44.0 46.6 42.0 0.833(0.361)
Note: Bold highlights Intervention>Control differences which are significantly different at p<=0.10 level.

danger signs rose from 10.2% to 32.0%, and those knowing the number of visits needed for a child to be fully immunised increased from 6.9% to 45.1%.
One-year-old vaccination rates also went up substantially, from 24.4% to 41.5% for measles, 22.9% to 77.3% for OPV3 (polio3), 9.2% to 78.0% for DPT3, and all recommended vaccinations (all sources) from 3.8% to 19.2%. Including only one-year-olds with vaccination cards, the proportion fully immunised rose from 7.2% to 55.0%.
In Yobe, there were greater improvements in the intervention areas relative to the control communities for four key MNCH indicators. In the intervention communities, more women had ANC for their last pregnancy (66.1% vs 48.0%, p<0.001), had standing permission to take a child to a health
centre (83.0% vs 77.3%, p=0.008), and knew at least four danger signs (47.1% vs 19.4%, p<0.001).
Zamfara: As in the other states, Zamfara showed significant improvement from BHS to EHS for all but one of the key MNCH outcomes (Table 3.4). The proportion of women with ANC doubled, from 13.1% to 26.1%, and the proportion with a skilled birth attendant for their last birth quadrupled, from 4.2 to 16.6%. Along with the rise in ANC, the proportion with two or more anti-tetanus vaccinations rose from 9.4% to 84.5%. When compared to the baseline survey, all measures of immunisation status among one-year-olds showed significant improvements: measles vaccinations (14.8% to 26.1%), OPV3 (23.6% to 68.6%), DPT3 (0.8% to 96.9%), fully immunised according to maternal report and the child’s
vaccination card (0.2% to 11.5%), and fully immunised according to the child’s vaccination card (if they had a card) (0.1% to 24.7%). Three times more women knew at least four maternal danger signs (4.4% to 12.2%) while twice as many had standing permission from their husbands to take the child to the health centre (47.5% to 78.2%). By the time of the EHS, half (51.1%) of the mothers of children under age two knew the number of visits needed to fully immunise a child, up from 3.0% at the beginning of the programme.
In Zamfara improvements in the control and intervention communities were about the same, with a few exceptions. Compared with the control communities, in the intervention communities women were significantly more likely to have had ANC (27.8% vs 23.7%, p=0.078) and to know at least
Table 3.2: Comparison of key MNCH indicators, Katsina BHS 2009 vs EHS 2013
Key maternal health indicators Baseline 2009
EHS Total
EHS Control
EHS Intervention
Intervention v Control
% births attended by skilled birth attendant
14.7 28.9 27.1 30.9 2.603(0.107)
% women aged 15-49 who have 2+ TT doses
29.6 87.2 87.5 86.9 0.048(0.826)
% caesarian section rates 9.1 2.6 2.4 3.0 0.408(0.523)
% women receiving ANC by trained person
32.0 62.5 56.6 70.0 27.03(<0.001)
% 1-year-olds immunised against measles
21.4 61.7 68.3 59.8 1.445(0.229)
% 1-year-olds that have received OPV3 (polio3)
28.0 46.6 55.0 44.3 2.170(0.141)
% 1-year-olds that have received DPT3
5.7 73.1 71.7 73.5 0.082(0.775)
% 1-year-olds fully immunised (all sources inc maternal self report)
2.5 18.5 21.7 17.4 0.687(0.444)
% 1-year-olds fully immunised (children with vaccination cards)
15.0 36.2 46.7 33.3 3.625(0.057)
% women with standing permission to take child to health centre
33.3 90.0 89.6 90.7 0.904(0.636)
% women who know 4 maternal danger signs
12.0 20.2 11.6 30.2 83.64(<0.001)
% mothers of children under 2 years who know number of visits needed
10.0 39.6 34.5 45.8 7.171(0.007)
Note: Bold highlights Intervention>Control differences which are significantly different at p<=0.10 level.

four maternal danger signs (13.8% vs 10.0%). The proportion of one-year-olds who were fully immunised according to all sources was 16.0% in the intervention communities, double the proportion in the control communities (8.5%). For all the other indicators the proportions exhibiting the recommended MNCH outcome were equal or greater in the control than intervention communities.
ConclusionsThe study reports on changes in maternal and child health care and outcomes for the period 2009 to 2013. Specifically, the objective of this study was to assess the extent to which improvements in MNCH health outcomes or behaviours were significantly greater from baseline to endline, across all states and by state. From baseline to endline, there was signif-icant improvement in every maternal,
newborn, and child health outcome. As measured by several indicators, women knew and followed the recommended MNCH practices. Half of all women (48.8%) had at least one ANC visit for their last pregnancy, and one-fourth (23.9%) delivered at a facility with a skilled birth attendant. In the intervention communi-ties, the MMR was estimated to decline to 1,057, down from almost 1,300 per 100,000 live births at baseline. Their children were much more likely to receive recommended vaccinations before age two, and at the end of the programme, the immunisation rate for those with vaccination cards had risen from 16% to 36%.
Significant changesThe reduction in the MMR from 1,260 to 1,057 per 100,000 live births is an encouraging sign, reflecting the combined effect of both the facility
and community demand generation activities. Several maternal care measures suggest that there is an increase in birth preparedness, with an increase in ANC consultations, knowledge of at least four maternal danger signs and having standing permission to go to the health centre. Implementation of the integrated maternal care initiatives to strengthen emergency obstetric care services in the target clusters, support midwifery skill enhancement, facilitate access to these obstetric care services through emergency transport schemes, and continued expansion of the community engagement efforts to promote birth preparedness and planning appear to have contributed to the maternal mortality reductions.
Accompanying these changes, child mortality dropped by about one-third,
Table 3.3: Comparison of key MNCH indicators, Yobe BHS 2009 vs EHS 2013
Key maternal health indicators Baseline 2009
EHS Total
EHS Control
EHS Intervention
Intervention v Control
% births attended by skilled birth attendant
12.1 25.9 26.2 25.4 0.142(0.706)
% women aged 15-49 who have 2+ TT doses
17.2 86.0 87.4 83.2 0.898(0.343)
% caesarian section rates 2.7 1.0 1.2 0.8 0.412(0.521)
% women receiving ANC by trained person
36.0 56.2 48.0 66.1 52.18(<0.001)
% 1-year-olds immunised against measles
24.4 41.5 44.6 38.1 1.349(0.245)
% 1-year-olds that have received OPV3 (polio3)
22.9 77.3 75.3 79.6 0.818(0.366)
% 1-year-olds that have received DPT3
9.2 78.0 75.3 81.0 1.448(0.229)
% 1-year-olds fully immunised (all sources inc maternal self report)
3.8 19.2 18.7 19.7 0.056(0.813)
% 1-year-olds fully immunised (children with vaccination cards)
7.2 55.0 59.6 49.7 3.136(0.077)
% women with standing permission to take child to health centre
49.8 80.0 77.3 83.0 9.660(0.008)
% women who know 4 maternal danger signs
10.2 32.0 19.4 47.1 138.5(<0.001)
% mothers of children under 2 years who know number of visits needed
6.9 45.1 42.0 51.0 1.119(0.290)
Note: Bold highlights Intervention>Control differences which are significantly different at p<=0.10 level.

Table 3.4: Comparison of key MNCH indicators, Zamfara BHS 2009 vs EHS 2013
Key maternal health indicators Baseline 2009
EHS Total
EHS Control
EHS Intervention
Intervention v Control
% births attended by skilled birth attendant
4.2 16.6 17.6 15.8 0.889(0.3467)
% women aged 15-49 who have 2+ TT doses
9.4 84.5 82.1 86.1 0.780(0.377)
% caesarian section rates 3.0 1.0 1.0 0.9 0.001(0.973)
% women receiving ANC by trained person
13.1 26.1 23.7 27.8 3.105(0.078)
% 1-year-olds immunised against measles
14.8 26.1 24.4 28.5 0.735(0.391)
% 1-year-olds that have received OPV3 (polio3)
23.6 68.6 66.7 71.5 0.943(0.332)
% 1-year-olds that have received DPT3
0.87 96.9 96.2 97.9 0.805(0.370)
% 1-year-olds fully immunised (all sources inc maternal self report)
0.2 11.5 8.5 16.0 4.781(0.029)
% 1-year-olds fully immunised (children with vaccination cards)
0.1 24.7 29.4 25.0 0.016(0.900)
% women with standing permission to take child to health centre
47.5 78.2 80.8 76.2 4.665(0.097)
% women who know 4 maternal danger signs
4.4 12.2 10.0 13.8 4.980(0.026)
% mothers of children under 2 years who know number of visits needed
3.0 51.1 63.0 49.2 4.094(0.043)
Note: Bold highlights Intervention>Control differences which are significantly different at p<=0.10 level.
with under-five mortality per 1,000 live births declining in the four year interval from 160.0 to 102.2 and infant mortality from 90.0 to 63.0 per 1,000 live births.
At this pace, the four states are on track to meet the 2015 MDG4 target of a two-thirds reduction in the under-five mortality rate. Between the baseline and endline, there was a significant increase in the proportion of one-year-olds with specific antigens and in the proportion with all recommended doses, as reported by the mother with or without confirma-tion against the child’s vaccination card. Further, the one-year-old vaccination rate for all recommended antigens was greater in the intervention than control communities.
This suggests the focused efforts by the programme to educate women and men about the importance of childhood
vaccinations is vital, for example in the intervention communities almost half of all mothers of one-year-olds or infants knew how many visits it takes to completely immunise the child.
Hence, it is also possible that their recollection of the number of visits and the “see and do” drill of pointing to where the child gets each vaccination is effective at helping mothers remember that doses were given. Thus, the difference between the intervention and control communities in maternal report of a fully immunised child could reflect better recall of vaccinations or real differences in vaccine delivery in the intervention communities.
Varying immunisation coverage ratesThe large difference in immunisation
coverage rates when only doses reported on cards are counted suggests that part of the difference may be in the reporting of doses, not in access to cards. These reporting differences notwithstanding, the higher complete immunisation coverage rate based on maternal report may also reflect the combined impact of the programme’s interventions on improving vaccine supplies and delivery services at the primary health care (PHC) clinics coupled with radio jingles and community dialogues to help men and women understand about immunisations and prompt attention to the care of sick children.
This increases the visit rates to the PHC, which increases opportunities for vaccinations. The immunisation rates are not uniform across all antigens. In many clinical settings the standard

immunisation protocol is to deliver all vaccines for which a child is eligible but not yet received.
This practice would lead to immunisation coverage rates which are similar across antigens. Yet, in our survey, the rates differ. The differences between immunisation rates by antigen could reflect problems with the supply of vaccines. In addition, community-based campaigns, eg for polio vaccines, can independently raise the coverage rate for that antigen, in this case polio.
Polio immunisations are delivered annually through a series of monthly campaigns where volunteers go door to door to identify children eligible for the polio vaccine. The vaccines are delivered in the community, which means that it is very easy for children to have or even exceed the number of recommended polio immunisations.
DPT3 supplies also were out of stock in some of the states. Whether or not the child lived in the intervention or the control community, there was no DPT3 to be given. Shortages of vaccination cards may also have influenced the coverage rate for all antigens based on cards, which also was higher in the control than intervention communities.
Significant improvements in intervention communitiesThe improvements were greater in the intervention communities than in the control communities for most of the key MNCH behaviours: MMR, infant and child mortality rates, ANC, complete immunisation coverage, knowledge of maternal danger signs and of the number of visits needed to complete the childhood immunisation series. Each of these variables reflects key dimensions of the MNCH interventions, and the greater improvements seen in the intervention communities suggest that the programme is having an impact.
For the remaining MNCH outcomes, the intervention communities’ rates did not differ significantly from those of the control communities. There are several possible reasons for this lack of difference. First, many of the programmes, particularly initiatives to upgrade facilities or adopt statewide health systems reforms, were
implemented throughout the state, and these state-level programmes, such as improvement of drug supplies and training of health care workers, could have made it possible for all families living anywhere in the state to achieve improved health outcomes.
Second, initiatives sponsored by other agencies or programmes, such as the child nutrition programme implemented by Save the Children International or the mass immunisation campaigns of UNICEF, could have independently raised health outcomes in both the intervention and control areas.
Third, the intervention activities and particularly the community demand-generation activities were rolled out by cluster, and by the time the EHS was conducted, the vast majority of the LGAs had already had some exposure to the intervention. However, not all the intervention areas had received the intervention throughout the intervening period between the BHS and EHS. Therefore, some of the EHS intervention communities might have been less ‘intervention’ and more ‘control’. We have minimised this potential effect by excluding from the intervention any community which had received the intervention in the year before the survey date.
Differences between statesThe states differed in their level of health outcomes and in the amount of change they demonstrated from baseline to endline. Jigawa achieved the highest immunisation coverage rates, which reflects the prior existence of the immunisation programme in Jigawa prior to its implementation in other states. Jigawa also showed the biggest improvements in outcomes in the intervention areas. Katsina had the highest level of outcome for ANC-related patterns, while Yobe and Zamfara each had effective community education programmes, as evidenced by the high proportion of mothers knowing four or more maternal danger signs (32.0% among Yobe mothers) and knowing the number of visits needed to complete the child vaccination series (51.1% in Zamfara).
In summary, after four years there
were significant improvements in virtually all targeted health behaviours and, importantly, in maternal, infant and under-five mortality. This is seen most clearly in the comparison of the outcomes for the intervention versus control communities, suggesting that the work of the programme through local communities and PHC services had a measurable impact. Statewide improvements after implementing the complex, integrated, and multi-level set of interventions have nonetheless contributed to improvements in the control communities.
References
1. Doctor HV, Olatunji O, Findley SE, Afenyadu GY, Abdulwahab A, Jumare A. Maternal mortality in northern Nigeria: findings of a health and demographic surveillance system in Zamfara State, Nigeria. Tropical Doctor. 2012; 42(3):140-143.
2. Ezeanochie M, Olagbuji B, Agholor K, Okonofua F. Attaining MDG5 in northern Nigeria: Need to focus on skilled birth attendance. Af J of Repro Health. 2010;14(2):9-11.
3. UNICEF. The state of the world’s children 2009. New York: United Nations Children’s Fund, 2009.
4. World Health Organization. Cause-specific mortality and morbidity, maternal mortality ratio. World Health Statistics, Global Health Observatory Repository Data. Available at: http://apps.who.int/ghodata; Accessed 31 October 2011.
5. Federal Ministry of Health of Nigeria, Save the Children and ACCESS. Saving newborn lives in Nigeria: newborn health in the context of the integrated maternal newborn and child health strategy. Abuja, Nigeria: Federal Ministry of Health, Save the Children and ACCESS, 2009.
6. National Population Commission [Nigeria] and ICF Macro. Nigeria Demographic and Health Survey 2008 Preliminary Report. Abuja, Nigeria and Calverton, Maryland: National Population Commission and ICF Macro, 2009.
7. National Population Commission (NPC) [Nigeria] and ORC Macro. Nigeria Demographic and Health Survey 2003. Calverton, Maryland: National Population Commission and ORC Macro, 2004.

www.prrinn-mnch.org
www.health partners-int.co.uk
www.save the children.org.uk
www.grid consulting.net
The PRRINN-MNCH programme is funded and supported by UK aid from the UK Government and the State Department of the Norwegian Government. The programme is managed by a consortium of Health Partners International, Save the Children and GRID Consulting, Nigeria.
This set of Technical Briefs highlights key achievements from the PRRINN-MNCH programme in Northern Nigeria under one of four streams of work: Governance and Leadership, Health Service Delivery, Community Mobilisation, and Evidence for Decision-making.
PRRINN-MNCH worked with the federal, state and local governments, and in close consultation with local communities, to strengthen Primary Health Care services in four states, covering a population of over 19 million. PRRINN-MNCH helped each state achieve significant health-related goals, and improved the quality and availability of health services including antenatal and postnatal care, safer deliveries, care for newborns and infants, better nutrition, and routine immunization against preventable diseases.


