54
1 1
1
1

In a study carried out by Great Place to Work and The Economic Times, NTPChas been adjudged as the Best Company to work in the Public Sector categoryfor the year 2016
EVOLUTION OF NTPC

OPINION MAKER’S VIEW“Unchahar Thermal Power Station wasacquired by the NTPC LTD. from theGovernment of Uttar Pradesh. Performancewas improved dramatically by usingdebottlenecking techniques…………These dramatic results have been obtained
under ordinary or even oppressivecircumstances, and despite the absence ofrecognition by the system.”
(Extract from the book “INDIA 2020 – A Visionfor the New Millennium” authored by theformer President of India – Dr A.P.J. AbdulKalam.)
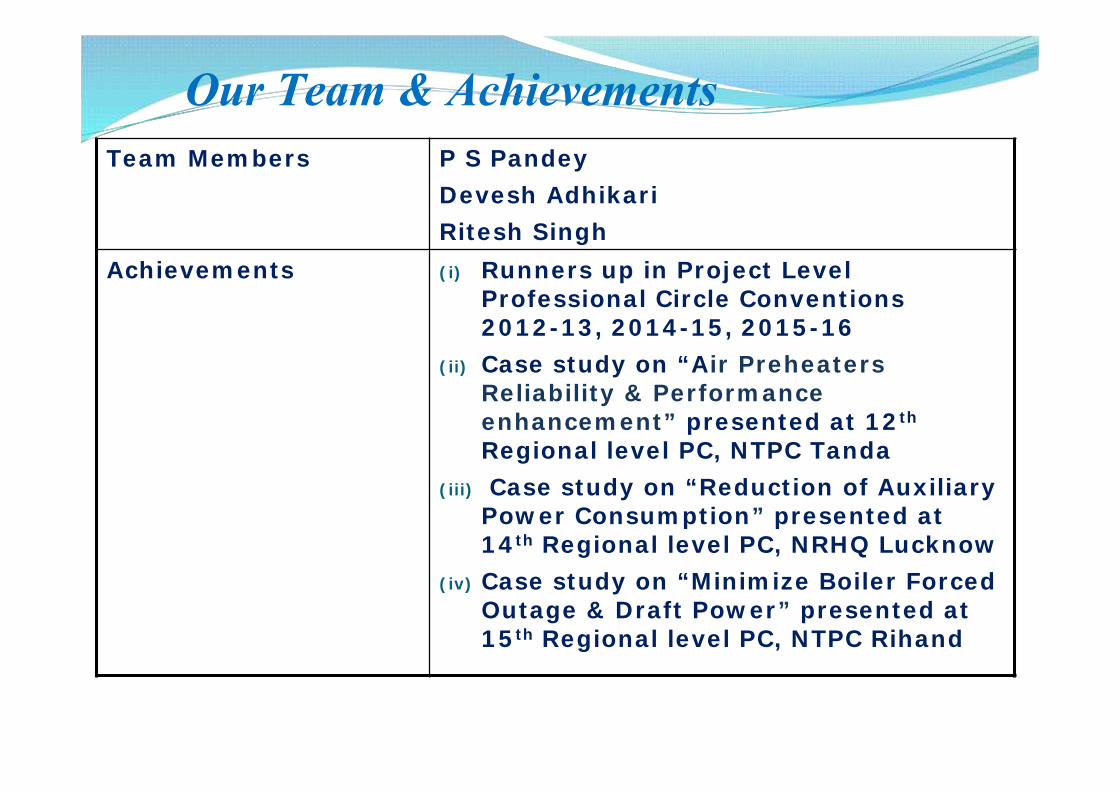
Our Team & AchievementsTeam Members P S Pandey
Devesh AdhikariRitesh Singh
Achievements (i) Runners up in Project LevelProfessional Circle Conventions2012-13, 2014-15, 2015-16
(ii) Case study on “Air PreheatersReliability & Performanceenhancement” presented at 12th
Regional level PC, NTPC Tanda(iii) Case study on “Reduction of Auxiliary
Power Consumption” presented at14th Regional level PC, NRHQ Lucknow
(iv) Case study on “Minimize Boiler ForcedOutage & Draft Power” presented at15th Regional level PC, NTPC Rihand
5
The site is located at a distance of approx. 3 km fromUnchahar town on Allahabad-Raebarelli broad gaugesection of Northern Railway. It is 35 km fromRaebareli, 120 km from Lucknow and 90km fromAllahabad on Lucknow-Allahabad Highway. Totalland acquired so far is 2198 Acres.
LOCATION
6
MAJOR EVENTS The foundation stone of the project was laid by Late Smt. Indira
Gandhi, the then Prime Minister on 27-06-1981.
Unit # 1 & 2 in stage-I were commissioned by UPRVUN on 21-11-88 & 22-03-89 respectively.
NTPC took over the project w.e.f. 13-02-1992 at a cost of 925Crore.
NTPC added unit # 3 & 4 in stage-II on 27-01-99 & 22-10-99respectively.
NTPC added unit # 5 as stage-III on 28-09-06.
10 MW of Solar Energy added on 31.03.2015
7
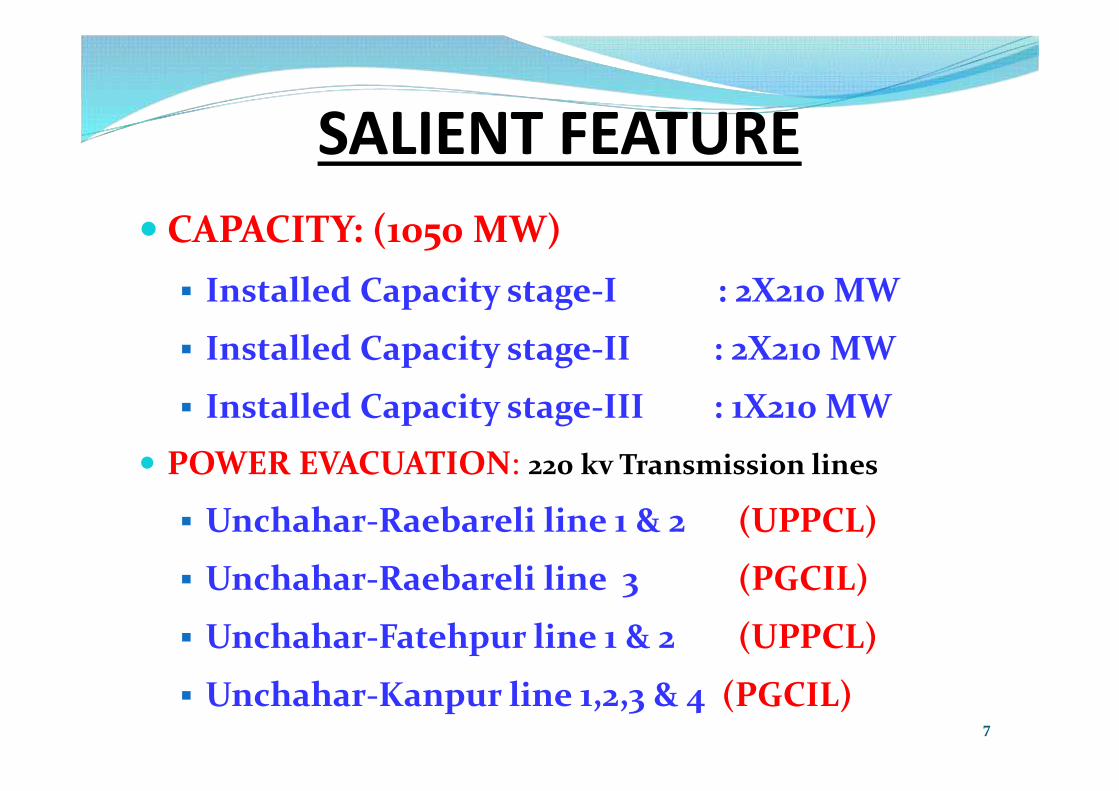
CAPACITY: (1050 MW) Installed Capacity stage-I : 2X210 MW
Installed Capacity stage-II : 2X210 MW
Installed Capacity stage-III : 1X210 MW
POWER EVACUATION: 220 kv Transmission lines
Unchahar-Raebareli line 1 & 2 (UPPCL)
Unchahar-Raebareli line 3 (PGCIL)
Unchahar-Fatehpur line 1 & 2 (UPPCL)
Unchahar-Kanpur line 1,2,3 & 4 (PGCIL)
SALIENT FEATURE
8
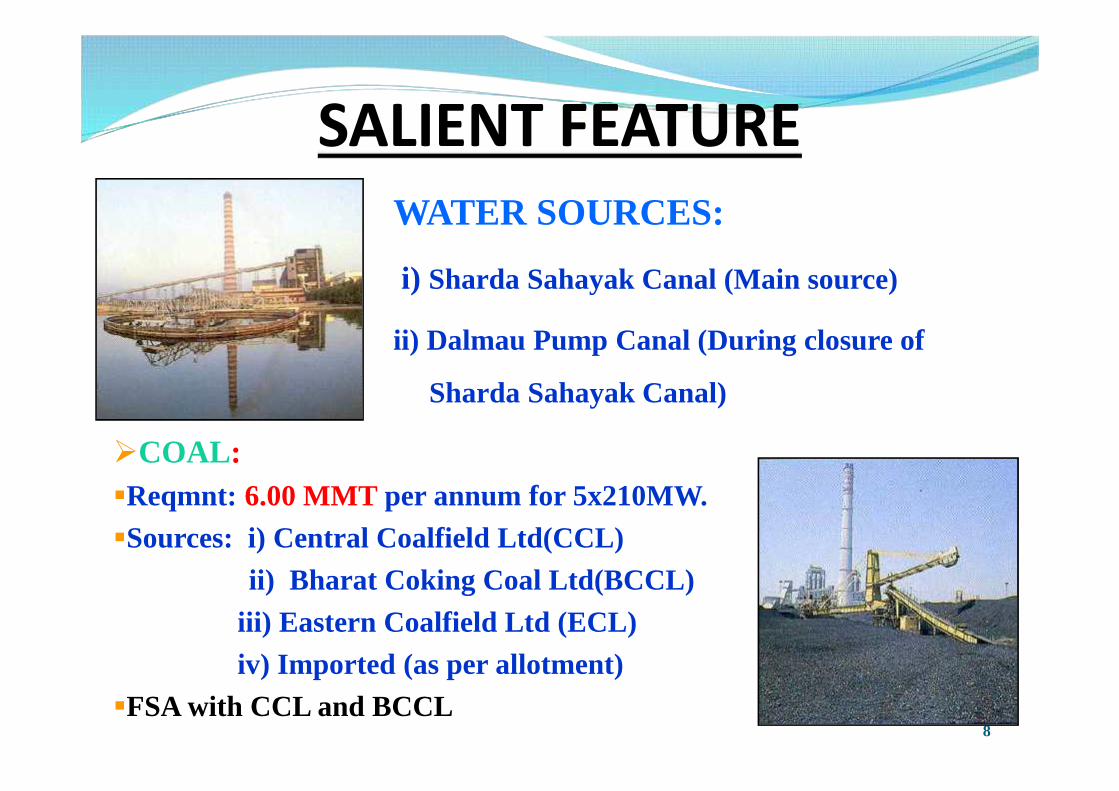
WATER SOURCES:
i) Sharda Sahayak Canal (Main source)
ii) Dalmau Pump Canal (During closure of
Sharda Sahayak Canal)
COAL:Reqmnt: 6.00 MMT per annum for 5x210MW.
Sources: i) Central Coalfield Ltd(CCL)
ii) Bharat Coking Coal Ltd(BCCL)
iii) Eastern Coalfield Ltd (ECL)
iv) Imported (as per allotment)
FSA with CCL and BCCL
SALIENT FEATURE

9
LAND AT UNCHAHAR
Particulars Area(Acres)
Plant : 981Township : 254Area for Solar Plant : 46Arkha Ash Dyke + Corridor : 673Umran Ash Dyke + Corridor : 244
TOTAL : 2198

10
POWER ALLOCATION
42%
11%9%
8%
6%
5%
4%3%1% 11% STATE MW
UP 442Punjab 113Delhi 100Rajasthan 81Uttrakhand 64J&K 57Haryana 46HP 27Chandigarh 6Unallocated 114
Total 1050

Coal to Electricity ….. Basics
Coal
ChemicalEnergy
Super HeatedSteam
Pollutants
ThermalEnergy
TurbineTorque
Heat Loss InCondenser
KineticEnergy
ElectricalEnergy
Alternatingcurrent in Stator
Mech. EnergyLossASH
Heat
Loss
Elet. EnergyLoss

Power Generation Process

OBJECTIVE
“Minimize Boiler Forced Outage anddraft power”
Road map Introduction Reduction in Boiler Tube Leakage. Process improvement during overhauling.
Reduction in Draft Power. Auxiliary power reduction .
Saving & benefits.
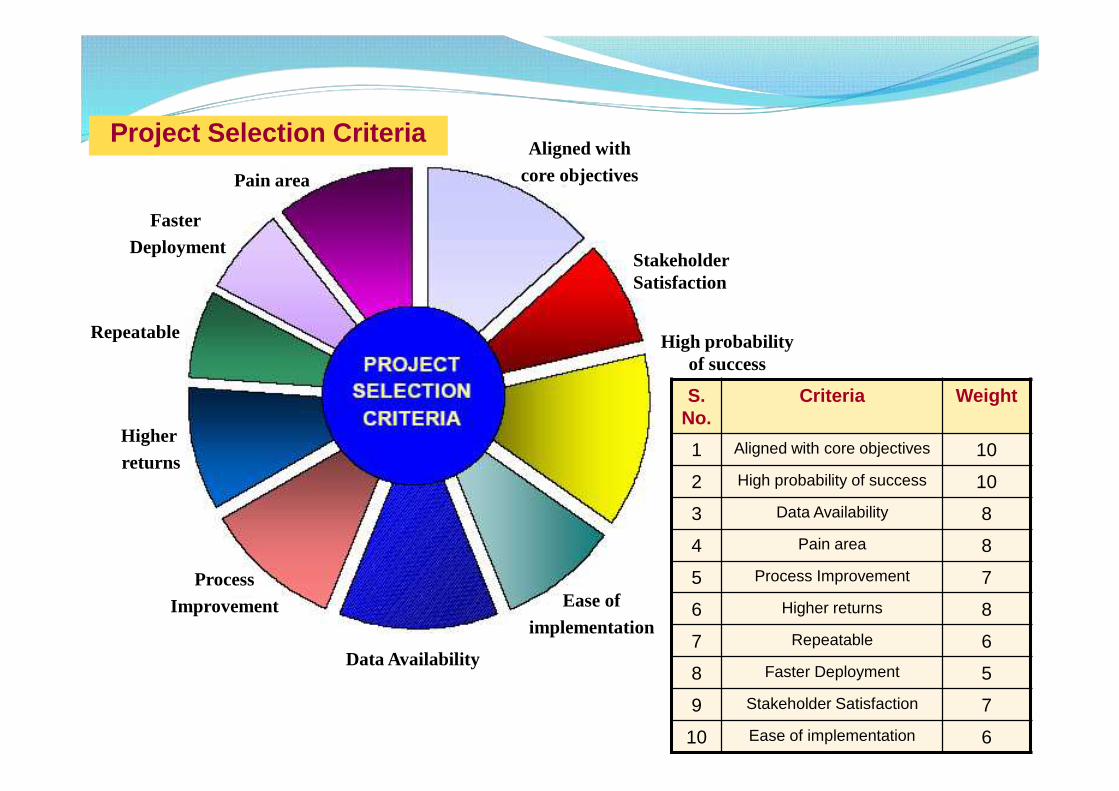
S.No.
Criteria Weight
1 Aligned with core objectives 10
2 High probability of success 10
3 Data Availability 8
4 Pain area 8
5 Process Improvement 7
6 Higher returns 8
7 Repeatable 6
8 Faster Deployment 5
9 Stakeholder Satisfaction 7
10 Ease of implementation 6
Aligned withcore objectives
High probabilityof success
Data Availability
Pain area
ProcessImprovement
Higherreturns
Repeatable
StakeholderSatisfaction
Ease ofimplementation
FasterDeployment
Project Selection Criteria

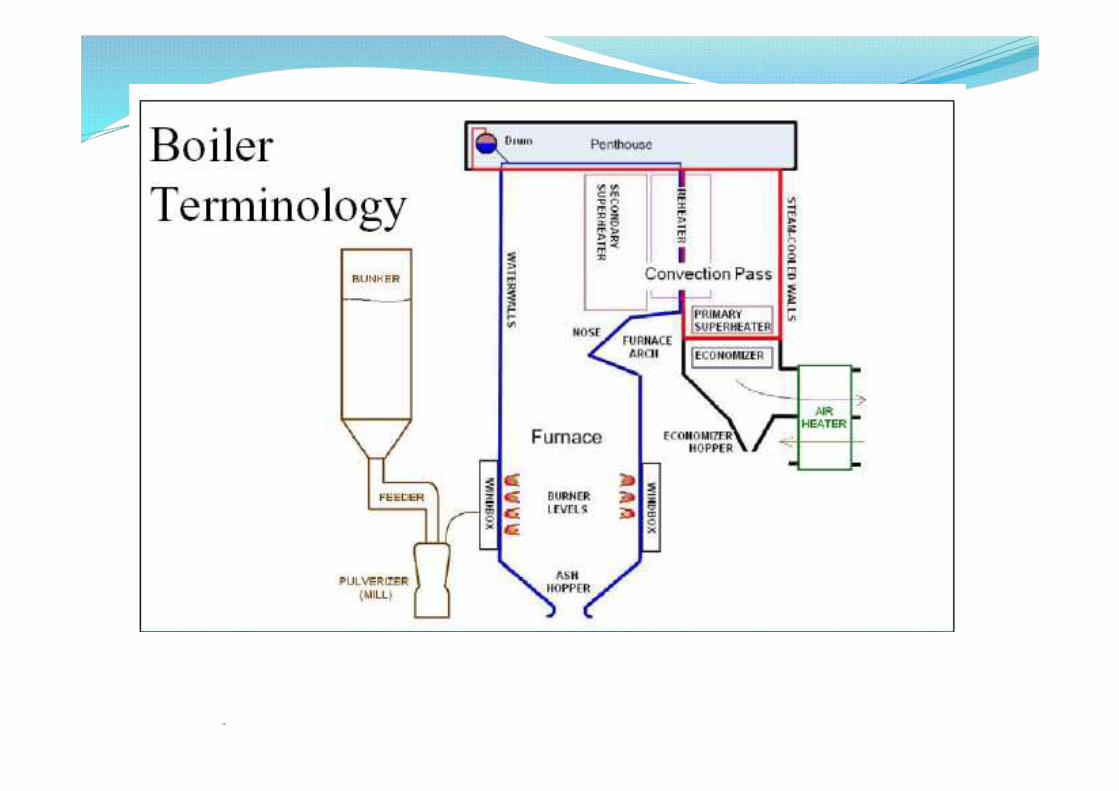
Boiler & Auxiliaries in Coal based Thermal PowerPlant has three main sub-areas: Pressure Parts: In this area boiler tube leakage is main
cause of forced outage which leads to unit shutdownand generation loss Rotary Parts: In rotary parts area draft power
consumption increases auxiliary power consumptionand it has to be minimized Milling System: Milling system responsible for
efficient coal pulverisation and its availability is mainconcern to minimize forced outage
Major Areas of Boiler

Boiler performance factors Exit flue gas temp. Superheater / Reheater spray Excess Air in furnace Unburnt coal in Bottom ash / fly ash Aux. power consumed by Boiler auxiliaries Flue gas emission etc. Rated steam parameter (MS & HRH)

Reduction in Boiler TubeLeakage

DEFINEReduction inBoiler Tube
Leakage
MEASUREGeneration
loss due to BTLin hours/MU
ANALYZEArea wise and
cause wiseAnalysis of past
fifteen yearshistory
I MPROVEChalk out
action plan inrespective
failure areas asper outage
history
CONTROLRequired
maintenanceworks as peraction plan inlimited timeframe/OH
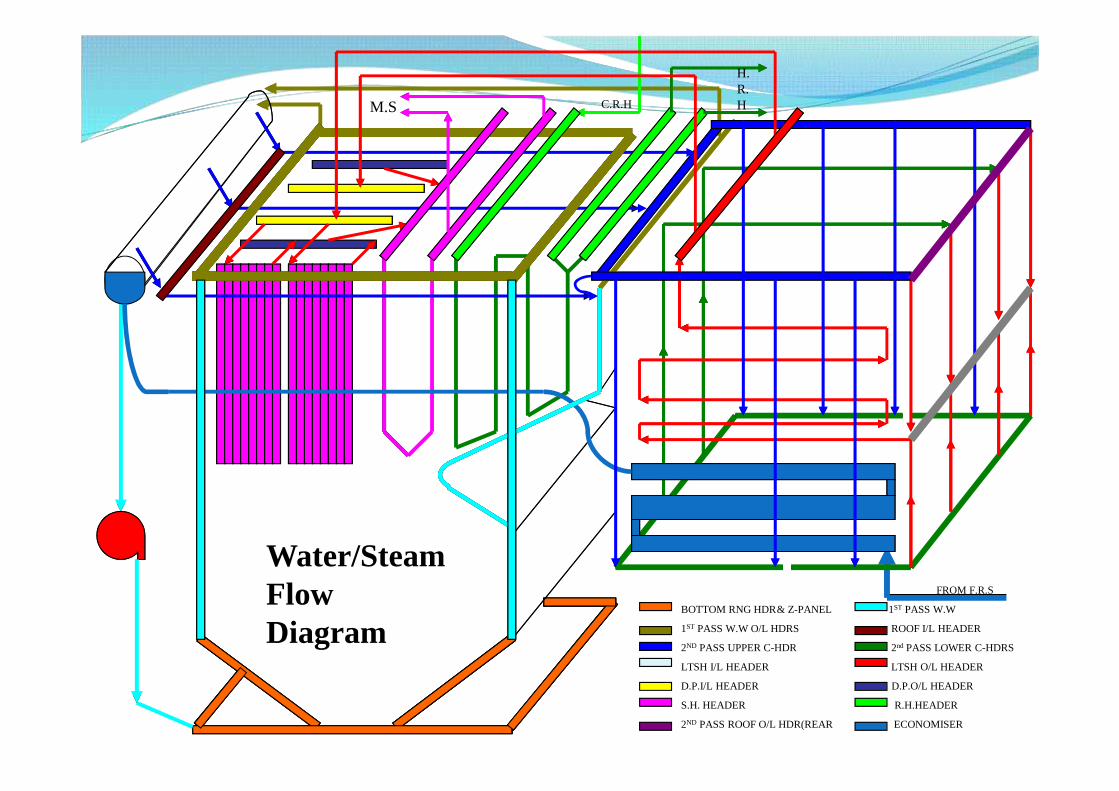
BOTTOM RNG HDR& Z-PANEL 1ST PASS W.W
1ST PASS W.W O/L HDRS ROOF I/L HEADER
2ND PASS UPPER C-HDR 2nd PASS LOWER C-HDRS
LTSH I/L HEADER LTSH O/L HEADER
D.P.I/L HEADER D.P.O/L HEADER
S.H. HEADER R.H.HEADER
2ND PASS ROOF O/L HDR(REAR ECONOMISER
M.S
H.R.HC.R.H
FROM F.R.S
Water/SteamFlowDiagram

BTL Area Wise 2000-01 to 2015-2016
Unit/Area
WW LTSH ScreenTube Eco RH
Penthouse
FSH PSHSupplyTube/spacer
HandHole/HDRPlug
Total
Unit-I 6 6 0 9 6 1 0 1 1 2 32
Unit-II 2 2 1 5 4 0 0 1 1 0 16
Unit-III 9 8 0 5 1 0 1 1 0 0 25
Unit-IV 9 7 0 5 1 0 1 2 1 0 26
Unit-V 3 8 0 3 2 0 0 1 0 0 17
Total 29 31 1 27 14 1 2 6 3 2 116

Area Wise BTLHand hole 2
116
Water Wall25%
LTSH27%
Screen Tube1%
Economizer23%
RH12%
SH vent line1%
Final SH1%
Platen SH5%
RH spacertube2%
SupplyTube
1%
Hand hole2%

BTL Cause Wise 2000-01 to 2015-16
Unit/Area
Weldjointfailure
Flyash/Airerosion
Steamerosion
Attachmentweld
overheating
Oldjointsfailure
CoalErosion
Mat.Failure/others
Total
Unit-I 7 11 2 2 6 - 1 3 32
Unit-II 3 3 1 1 4 2 - 2 16
Unit-III 8 7 - 6 2 1 1 - 25
Unit-IV - 12 1 6 4 3 - 1 26
Unit-V - 11 - 1 3 1 1 17
Total 17 45 4 16 19 7 3 5 116
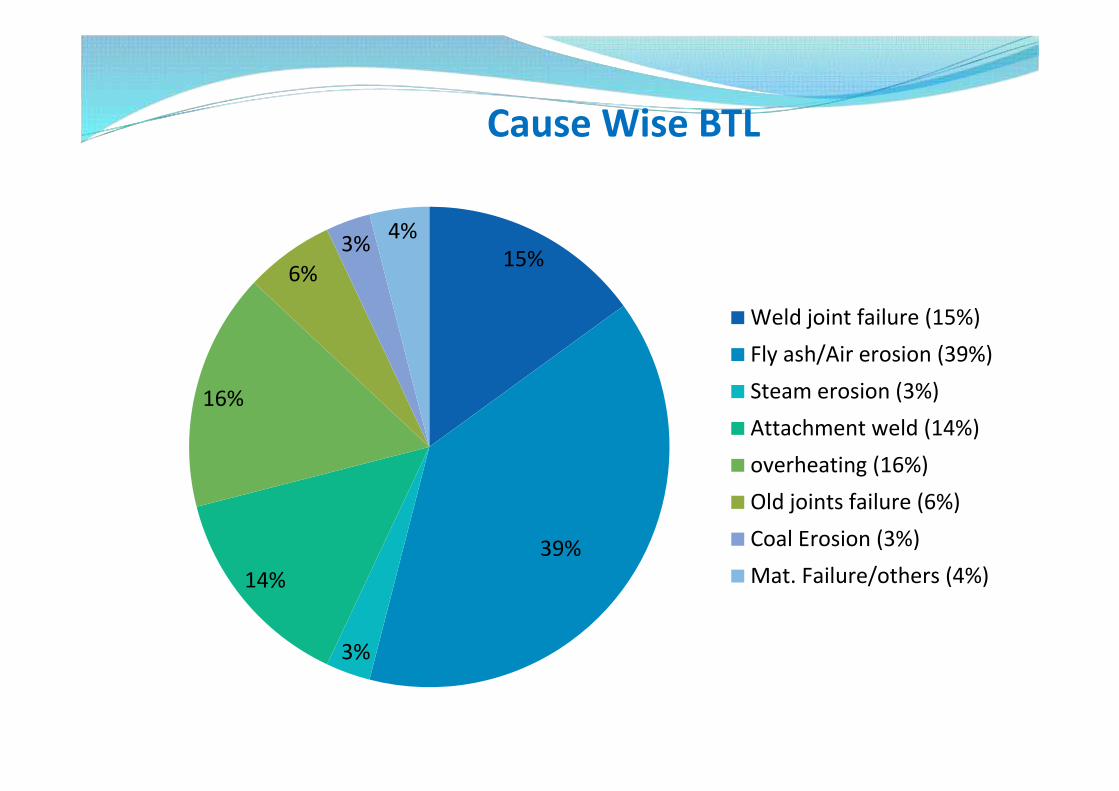
Cause Wise BTL
15%
39%
3%
14%
16%
6%3% 4%
Weld joint failure (15%)Fly ash/Air erosion (39%)Steam erosion (3%)Attachment weld (14%)overheating (16%)Old joints failure (6%)Coal Erosion (3%)Mat. Failure/others (4%)
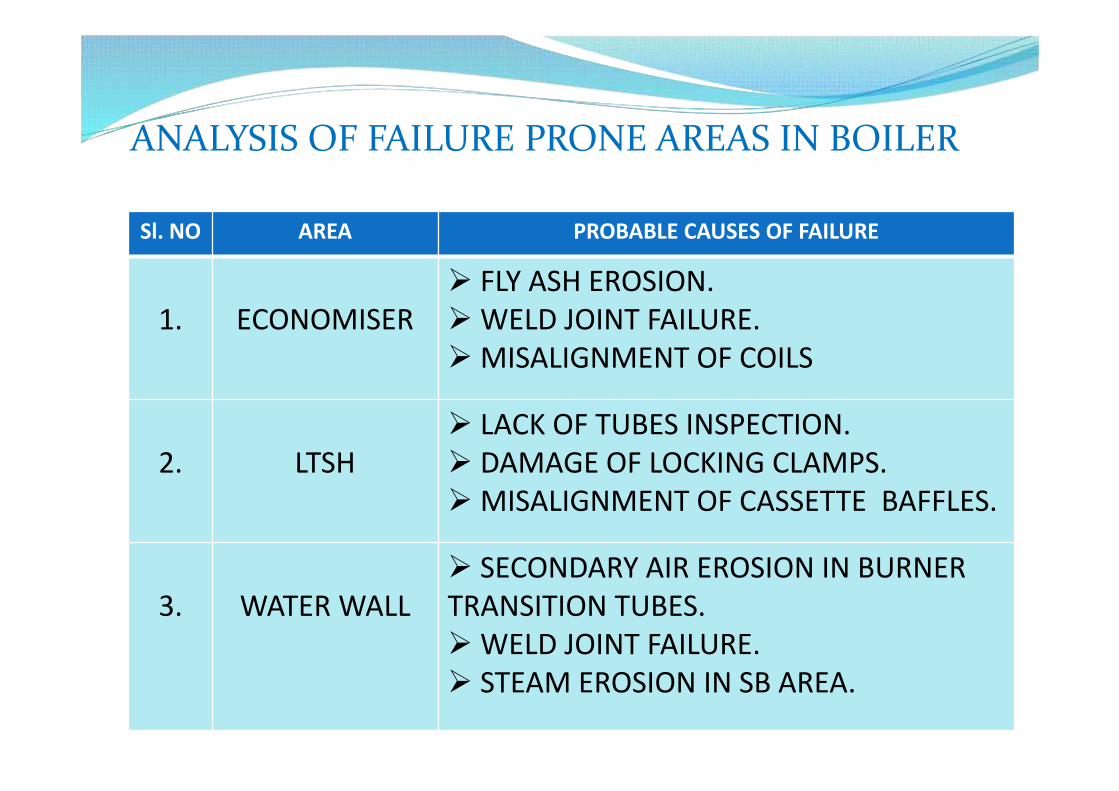
Sl. NO AREA PROBABLE CAUSES OF FAILURE
1. ECONOMISER FLY ASH EROSION.WELD JOINT FAILURE.MISALIGNMENT OF COILS
2. LTSH LACK OF TUBES INSPECTION. DAMAGE OF LOCKING CLAMPS.MISALIGNMENT OF CASSETTE BAFFLES.
3. WATER WALL SECONDARY AIR EROSION IN BURNERTRANSITION TUBES.WELD JOINT FAILURE. STEAM EROSION IN SB AREA.
ANALYSIS OF FAILURE PRONE AREAS IN BOILER

PROCESS IMPROVEMENTSl.No
AREA PROBABLE CAUSES OF FAILURE
1. ECONOMISER
MAPPING OF BOILER TUBES THICKNESS DURING EACH OH COIL LOWERING DECISION BASED ON PAST MAPPING USAGE OF MODERN T&P FOR JOINTS PROPER ALIGNMENTS OF COILS
2. LTSH
RESTORATION OF LOCKING AND CLAMPS DURING EACHOH COIL LOWERING DECISION BASED ON PAST MAPPING USAGE OF MODERN T&P FOR JOINTS ALLIGNMENT AND LOCKING OF CASSETTE BAFFLES
3. WATER WALL
APPLICATION OF PLASTIC REFRACTORY.EROSION RESISTANT COATING IN EROSION PRONE AREA FIXING OF HALF TUBE SHIELDS IN SOOT BLOWER AREA TO ENSURE ALIGNMENT OF SOOT BLOWER SLEEVE FIN WELDING BY HP WELDER

ERECTION/OLD JOINTS RADIOGRAPHYYEAR Unit#1 Unit#2 Unit#3 Unit#4 Unit#5
2006-07 227
2007-08 1510 10702008-09 682 210 942009-10 563 1017 5652010-11 785
2011-12 797 167 130
2012-13 186
2013-14 227
2014-15 244 225
2015-16 176 396
TOTAL 1479 2484 1865 1765 1106
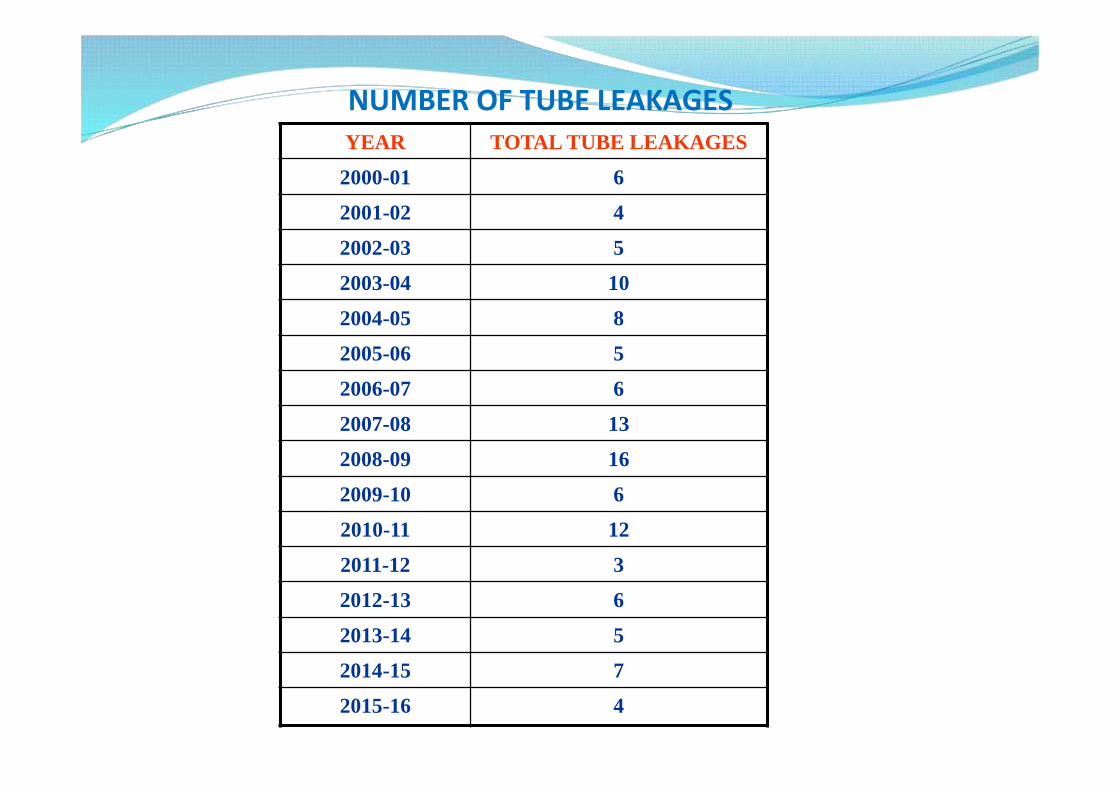
YEAR TOTAL TUBE LEAKAGES
2000-01 6
2001-02 4
2002-03 5
2003-04 10
2004-05 8
2005-06 5
2006-07 6
2007-08 13
2008-09 16
2009-10 6
2010-11 12
2011-12 3
2012-13 6
2013-14 5
2014-15 7
2015-16 4
NUMBER OF TUBE LEAKAGES
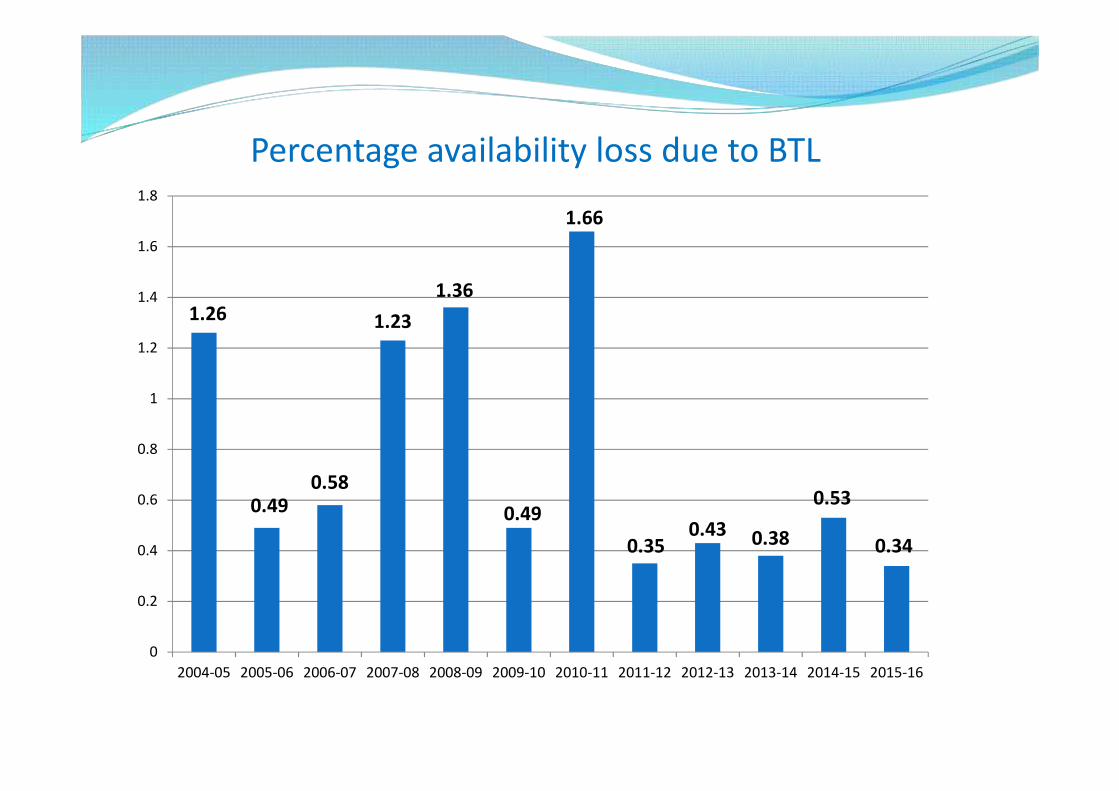
1.26
0.490.58
1.231.36
0.49
1.66
0.350.43 0.38
0.53
0.34
0
0.2
0.4
0.6
0.8
1
1.2
1.4
1.6
1.8
2004-05 2005-06 2006-07 2007-08 2008-09 2009-10 2010-11 2011-12 2012-13 2013-14 2014-15 2015-16
Percentage availability loss due to BTL

Reduction in Draft Power
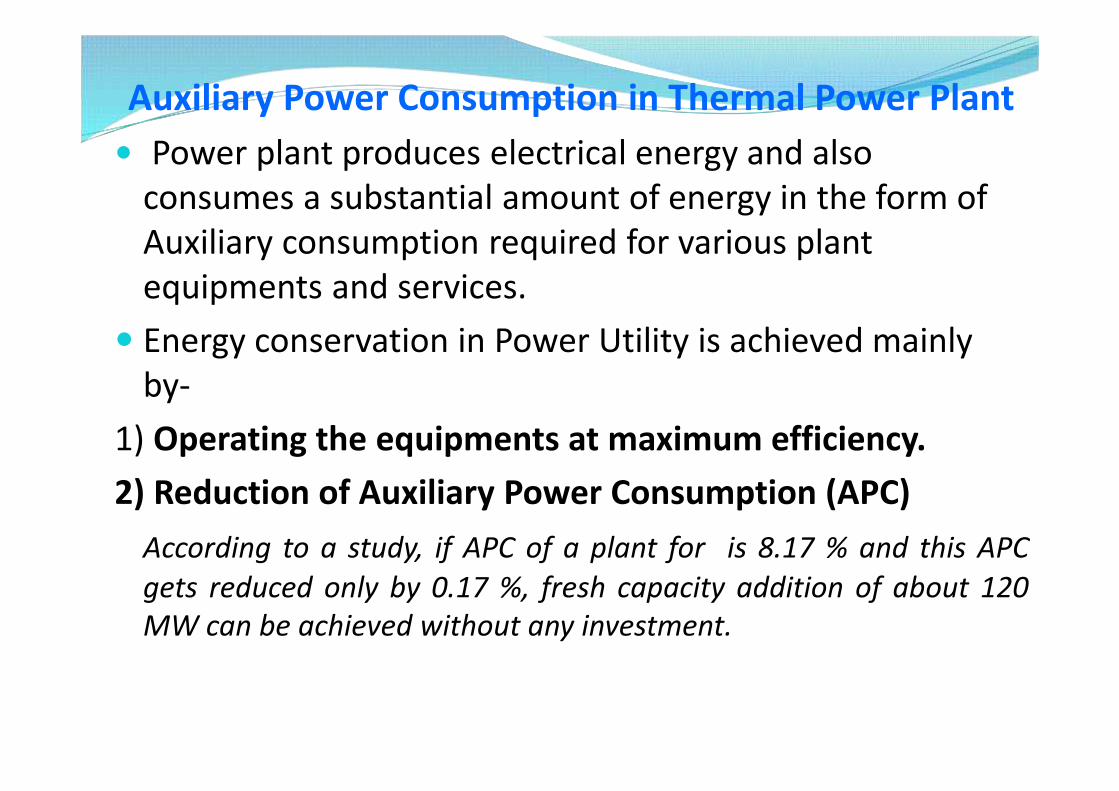
Auxiliary Power Consumption in Thermal Power Plant Power plant produces electrical energy and also
consumes a substantial amount of energy in the form ofAuxiliary consumption required for various plantequipments and services. Energy conservation in Power Utility is achieved mainly
by-1) Operating the equipments at maximum efficiency.2) Reduction of Auxiliary Power Consumption (APC)
According to a study, if APC of a plant for is 8.17 % and this APCgets reduced only by 0.17 %, fresh capacity addition of about 120MW can be achieved without any investment.
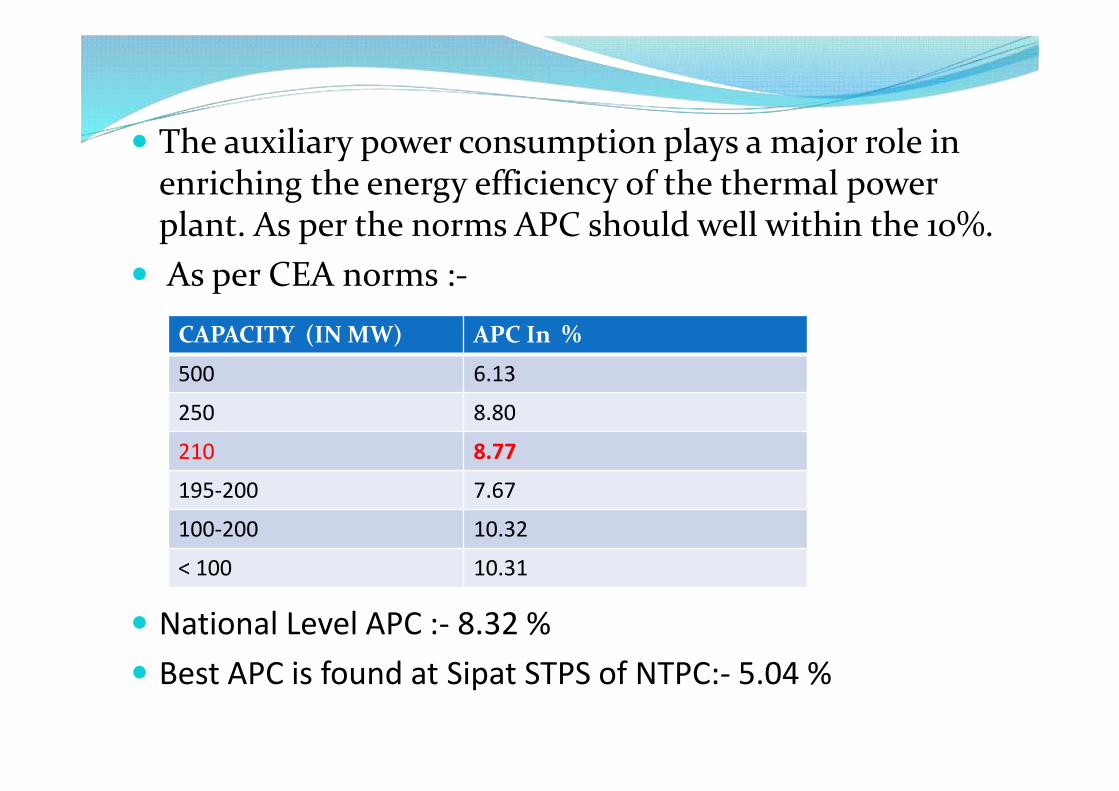
The auxiliary power consumption plays a major role inenriching the energy efficiency of the thermal powerplant. As per the norms APC should well within the 10%. As per CEA norms :-
National Level APC :- 8.32 % Best APC is found at Sipat STPS of NTPC:- 5.04 %
CAPACITY (IN MW) APC In %
500 6.13250 8.80210 8.77195-200 7.67100-200 10.32< 100 10.31

Typical Breakup of APC in Thermal Power Plant

14 March 2017 35

NTPC/UNCHAHAR
STATION PERFORMANCE REPORT
FIN. YEAR : 2016- 2017
Date of Report : 22-June-16 Report Upto :21-Jun-16 21-Jun-15
Description Period Unit Unit-I Unit-II Stg-I Unit-III Unit-IV Stg-IIUnit-V /
Stg-IIIStation Station
Aux. PowerConsumption
DMUs 0.35054 0.35054 0.70108 0.40921 0.40921 0.81842 0.395403 1.9149028 1.82437
% 7.41 7.36 7.38 8.85 8.72 8.79 8.60 8.18 8.49
MMUs 7.3455 7.3456 14.6911 7.6764 8.1769 15.8533 8.1865 38.7309 40.4129
% 7.70 7.65 7.67 8.87 8.73 8.80 8.84 8.34 8.49
FYMUs 118.7502 99.4995 218.2498 108.2280 120.4637 228.6917 113.7591 560.7007 571.5840
% 8.68 8.65 8.67 9.14 9.18 9.16 8.48 8.82 8.93
Auxiliary Power Consumption at NTPC Unchahar

Factors affecting Auxiliary PowerConsumption
Unit Generation and Load PatternOperational Efficiency of Plant
Auxiliaries ,Service Auxiliaries and theirreliability.Unit & Equipment startups / shutdowns.Age of plantCoal Quality
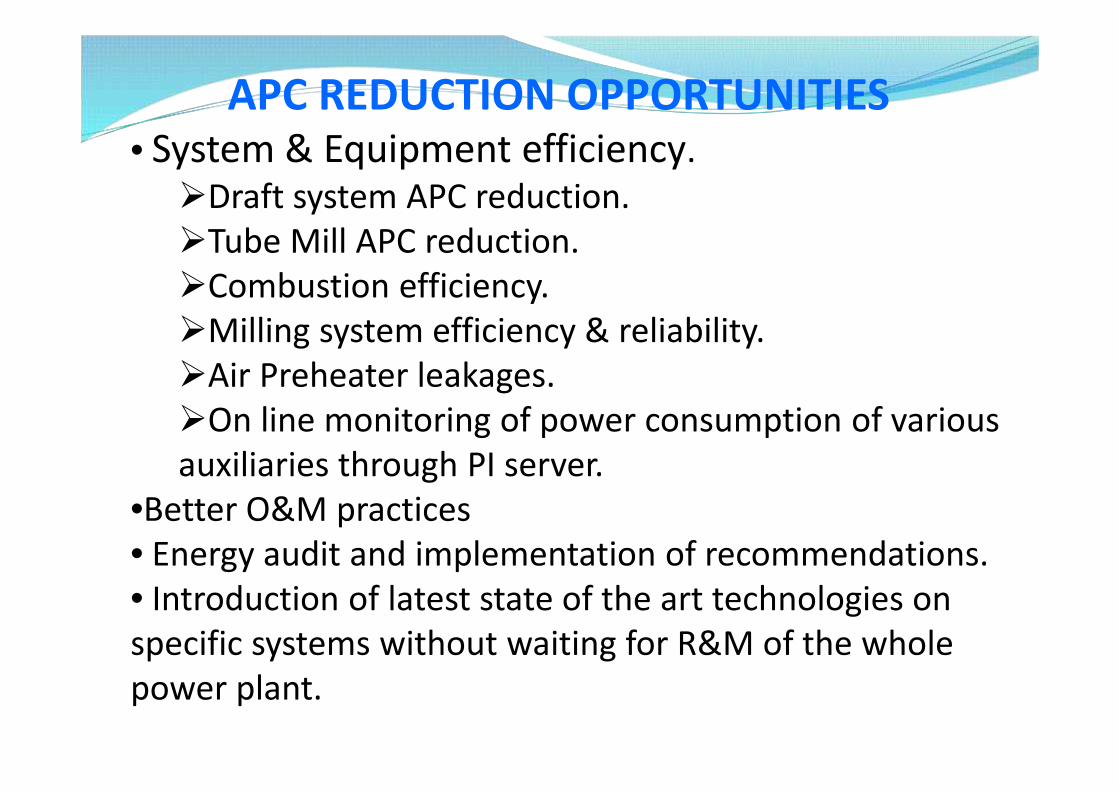
APC REDUCTION OPPORTUNITIES• System & Equipment efficiency.Draft system APC reduction.Tube Mill APC reduction.Combustion efficiency.Milling system efficiency & reliability.Air Preheater leakages.On line monitoring of power consumption of variousauxiliaries through PI server.
•Better O&M practices• Energy audit and implementation of recommendations.• Introduction of latest state of the art technologies onspecific systems without waiting for R&M of the wholepower plant.
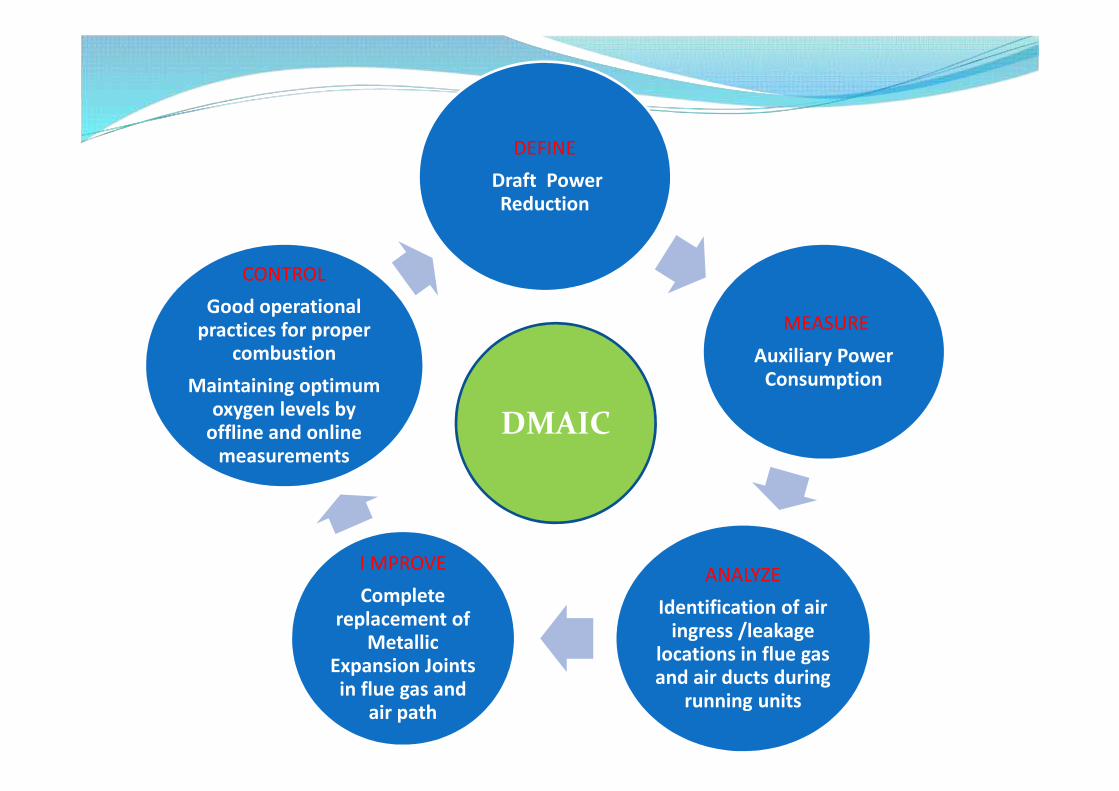
DEFINEDraft PowerReduction
MEASUREAuxiliary Power
Consumption
ANALYZEIdentification of air
ingress /leakagelocations in flue gasand air ducts during
running units
I MPROVEComplete
replacement ofMetallic
Expansion Jointsin flue gas and
air path
CONTROLGood operational
practices for propercombustion
Maintaining optimumoxygen levels by
offline and onlinemeasurements
DMAIC
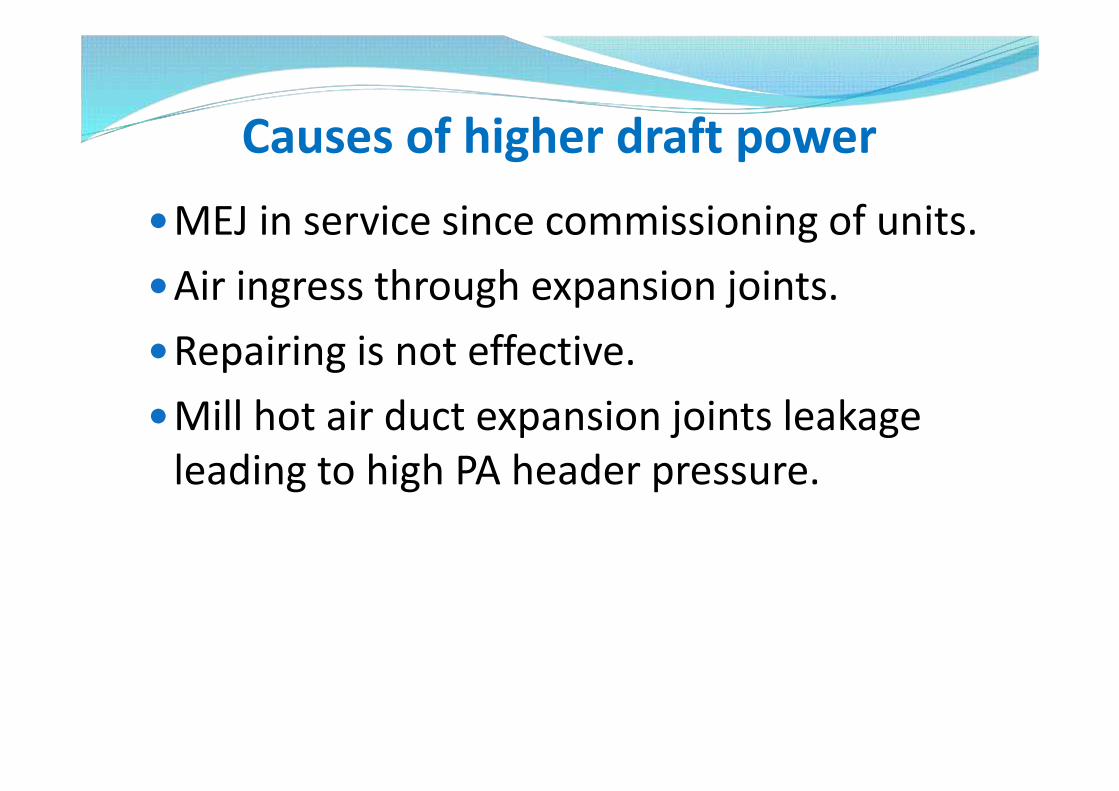
Causes of higher draft powerMEJ in service since commissioning of units.Air ingress through expansion joints.Repairing is not effective.Mill hot air duct expansion joints leakage
leading to high PA header pressure.
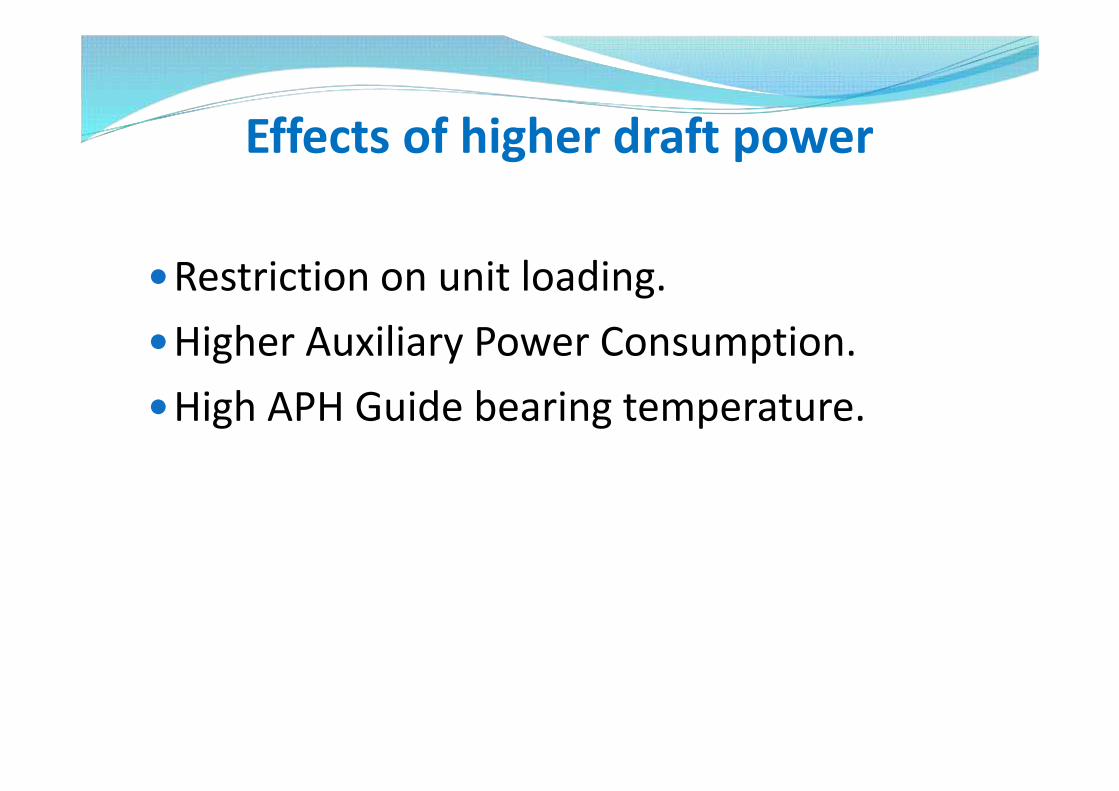
Effects of higher draft power
Restriction on unit loading.Higher Auxiliary Power Consumption.High APH Guide bearing temperature.

MEJ REPLACEMENT IN ST-I UNITSSl No. LOCATION UNIT-2 ( Sep-2014) UNIT-1 ( Sep-2015)
1 FLUE GAS PATH ,ECO OUTLET 2 2
2 FLUE GAS PATH ,APH INLET 2 2
3 FLUE GAS PATH (APH O/L-ESPI/L) 7 4
4 PRIMARY AIR PATH (HOT APHO/L) 2 2
5 PRIMARY AIR PATH APH-A/BOUTLET TO PA COMMON DUCT 4 NIL
6 WINDBOX 18 NIL
7 MILL HOT AIR DUCT (APH O/LTO MILL I/L) 16 16
TOTAL 51 26

Lifting of Eco Outlet (Style-7) and APH Inlet(Style-5) MEJ
43

Cutting ,Locking and Edge preparation

Primary Hot Air APH Outlet MEJ Replacement
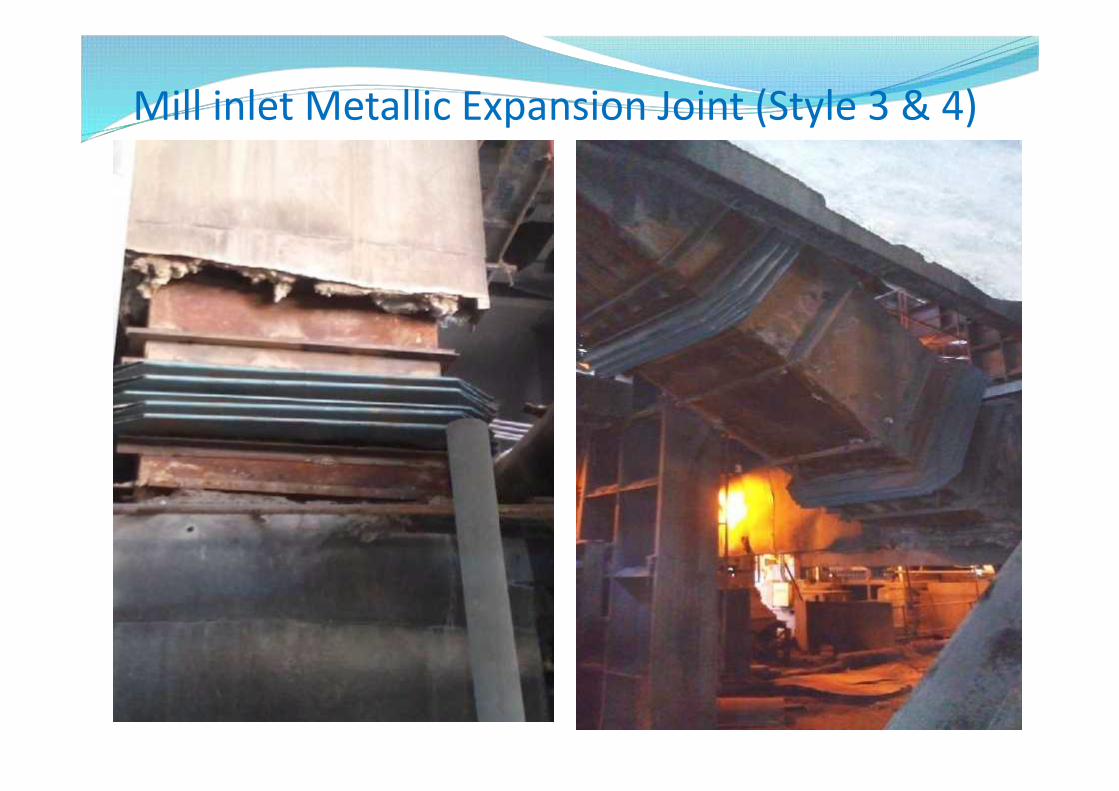
Mill inlet Metallic Expansion Joint (Style 3 & 4)

APH Outlet to ESP Inlet after APH Hopper MEJ Replaced
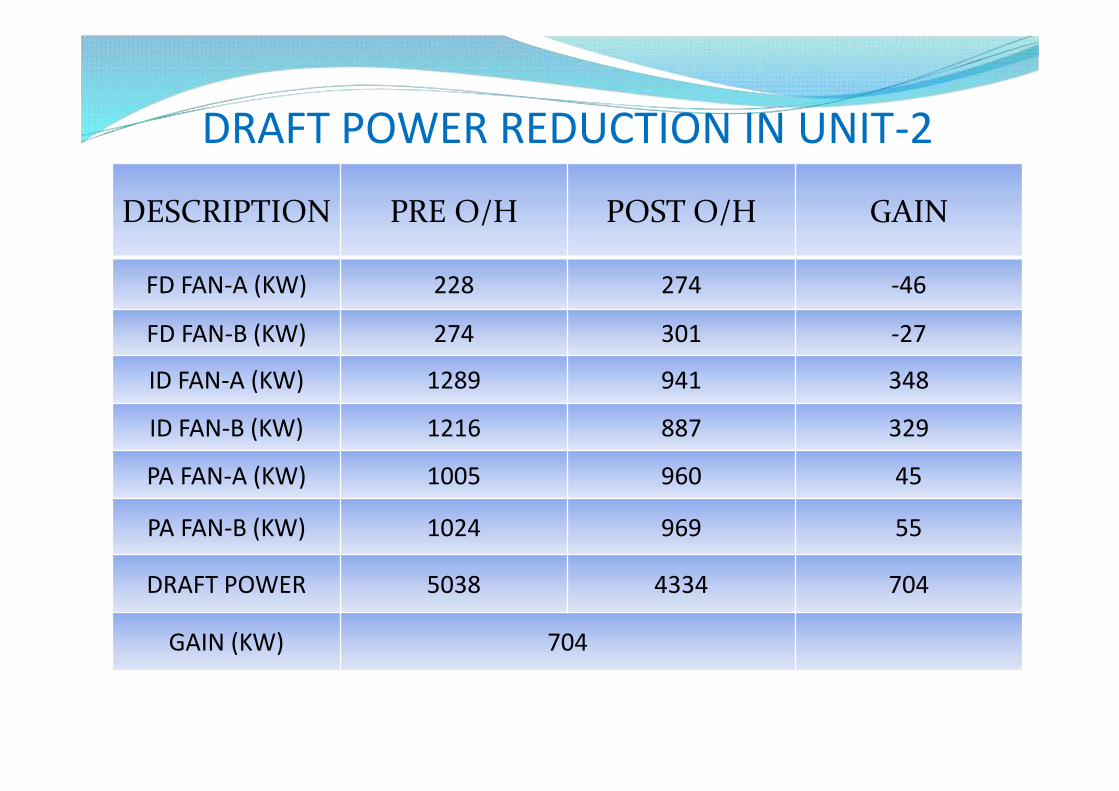
DRAFT POWER REDUCTION IN UNIT-2DESCRIPTION PRE O/H POST O/H GAIN
FD FAN-A (KW) 228 274 -46
FD FAN-B (KW) 274 301 -27
ID FAN-A (KW) 1289 941 348
ID FAN-B (KW) 1216 887 329
PA FAN-A (KW) 1005 960 45
PA FAN-B (KW) 1024 969 55
DRAFT POWER 5038 4334 704
GAIN (KW) 704
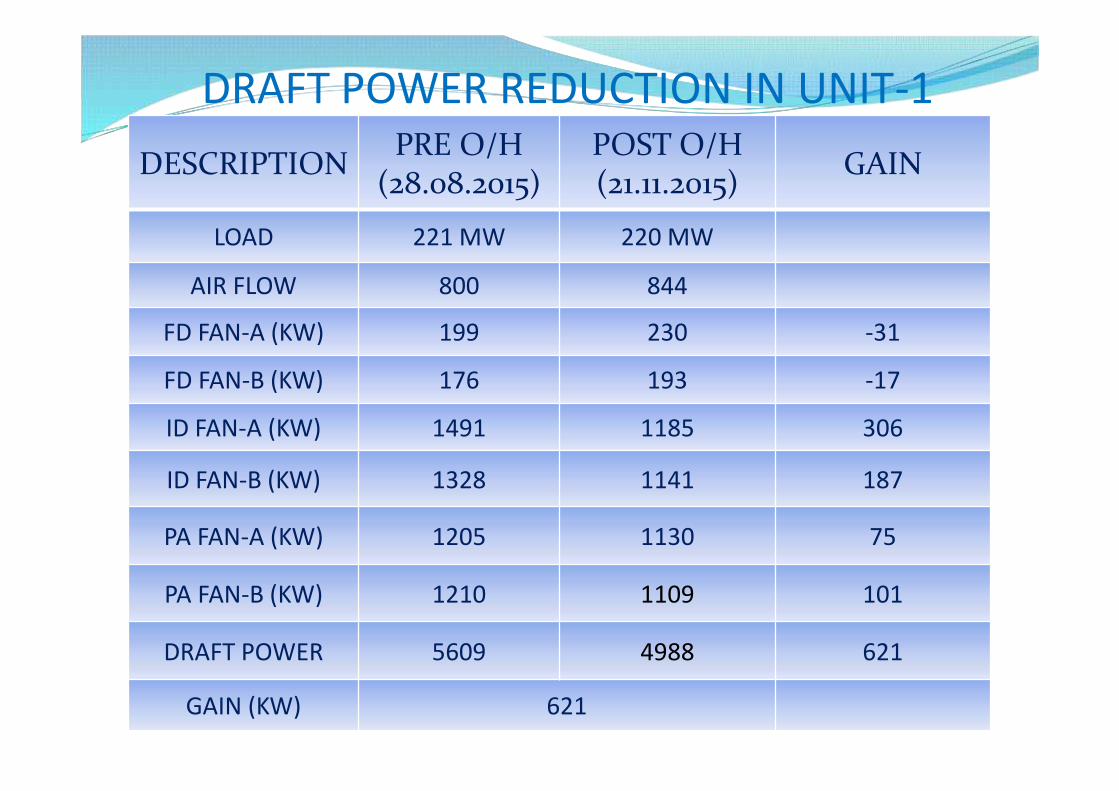
DRAFT POWER REDUCTION IN UNIT-1DESCRIPTION PRE O/H
(28.08.2015)POST O/H(21.11.2015) GAIN
LOAD 221 MW 220 MW
AIR FLOW 800 844
FD FAN-A (KW) 199 230 -31
FD FAN-B (KW) 176 193 -17
ID FAN-A (KW) 1491 1185 306
ID FAN-B (KW) 1328 1141 187
PA FAN-A (KW) 1205 1130 75
PA FAN-B (KW) 1210 1109 101
DRAFT POWER 5609 4988 621
GAIN (KW) 621

PaybackDESCRIPTION Unit-2 Unit-1
Reduction in Draft Power 700 KW 621 KW
Selling Price of Electricity ₹ 3.70 ₹ 3.70
Saving due to APCReduction/Day
700 x 24 x 3.70= ₹ 62160/-
621 x 24 x 3.70= ₹ 55144/-
Total Saving /Day ₹ 62160/- ₹ 55144/-Saving per annum(@90% PLF) ₹ 2.04 Crore ₹ 1.81 Crore
Material Cost ₹ 34 Lacs ₹ 17 Lacs
Service Cost ₹ 30 Lacs ₹ 39 Lacs
Payback Period 0.313 Years(3.7 Months)
0.309 years(3.7 months)

Saving/ Benefits by Reduction in BTL Average Unit Outage duration due to single BTL
is 24 Hrs.(Approx.) Generation Loss in MU= 0.21*24 MU = 5.04 MU Average Cost /Unit= ₹ 3.70 Net loss due to 24 Hrs Generation loss:
₹ 3.70*5.04*1000000 = ₹ 186 Lac= ₹ 1.86 Cr (Approx)
Average number of BTL during last 5 years=6.6 Number of BTL in FY 2015-16 =4 Net Saving =2.6*1.86
= ₹ 4.83 Cr in 2015-16

Intangible Gains Reliability of Boiler & Auxiliaries improved resulting
in one of the highest DC among all NTPC stations in2015-16 Availability of Boiler increased ID Fan Loading reduced from 135-140 Amps. pre
overhauling to 95-100 Amps. post overhauling PA Fan loading reduced Proper combustion of Coal in Furnace No restriction on Unit loading. Availability of Milling system increased


!['llf crc=cn - NRPC · Request Detail 1 NTPC [ DELHI ] Anta(NTPC)-Swaimadhopur ... NTPC [ DELHI ] Anta(NTPC)-Lalsot(RVPNL) 2(220 kV) Powergrid Continuous. Annual Bay …](https://static.documents.pub/doc/80x56/5acd10827f8b9a93268d2ca5/llf-crccn-detail-1-ntpc-delhi-antantpc-swaimadhopur-ntpc-delhi-.jpg)


