39
EVOLUTION OF SILICON PARAMETERS DUE TO IRRADIATION AT THE LHC Frank Hartmann [email protected] 23.06.2011
Vertex 2011 2
Different Strategies Leakage currents Comparison with expectation Depletion Voltage
Effects are showing up, monitoring efforts and comparison efforts started More integrated lumi will decrease errors
○ current results are first glimpse
Everybody is following the same goal but with slightly different strategies
Content & Disclaimer
Frank Hartmann
Vertex 2011 3
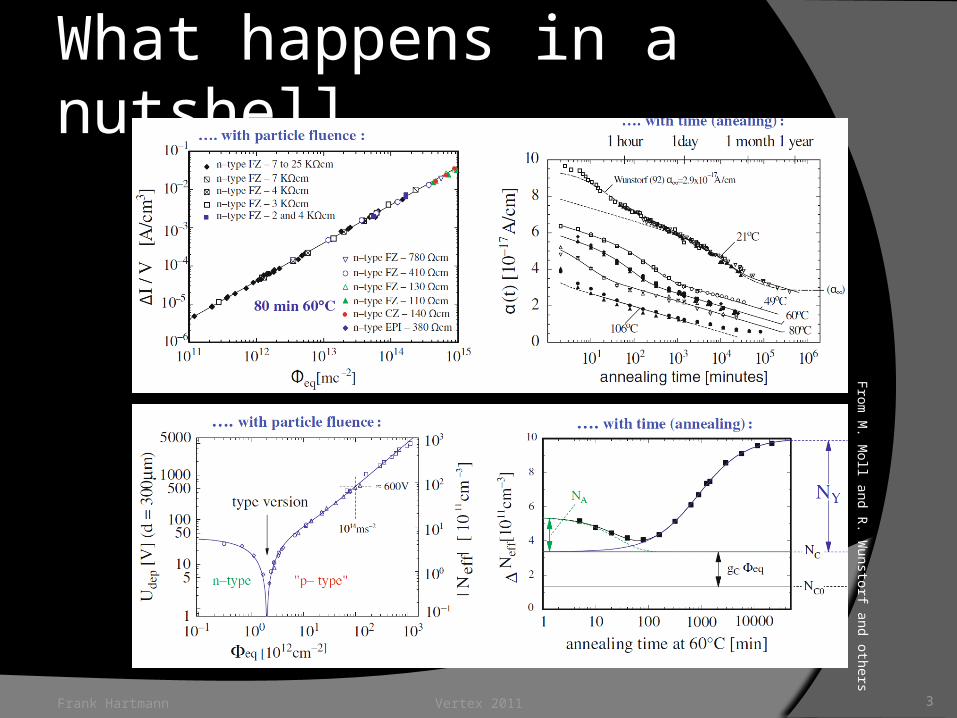
What happens in a nutshell
Frank Hartmann
From M
. Moll and R
. Wunstorf and others
Vertex 2011 4
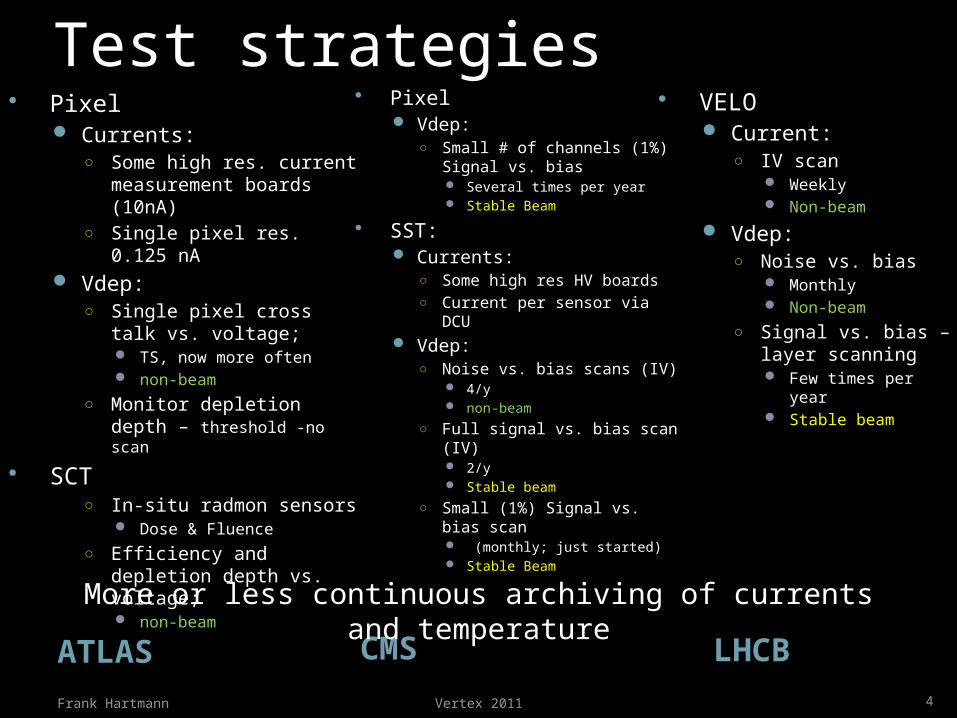
Test strategies
ATLAS
Pixel Currents:
○ Some high res. current measurement boards (10nA)
○ Single pixel res. 0.125 nA Vdep:
○ Single pixel cross talk vs. voltage; TS, now more often non-beam
○ Monitor depletion depth – threshold -no scan
SCT○ In-situ radmon sensors
Dose & Fluence○ Efficiency and depletion
depth vs. voltage; non-beam
Frank Hartmann
CMS
Pixel Vdep:
○ Small # of channels (1%) Signal vs. bias Several times per year Stable Beam
SST: Currents:
○ Some high res HV boards○ Current per sensor via DCU
Vdep:○ Noise vs. bias scans (IV)
4/y non-beam
○ Full signal vs. bias scan (IV) 2/y Stable beam
○ Small (1%) Signal vs. bias scan (monthly; just started) Stable Beam
LHCB
VELO Current:
○ IV scan Weekly Non-beam
Vdep:○ Noise vs. bias
Monthly Non-beam
○ Signal vs. bias – layer scanning Few times per year Stable beam
More or less continuous archiving of currents and temperature

Vertex 2011 5
Leakage Currents
Does it increases?Alpha?Annealing?Comparison with simulation?
Frank Hartmann
Vertex 2011 6
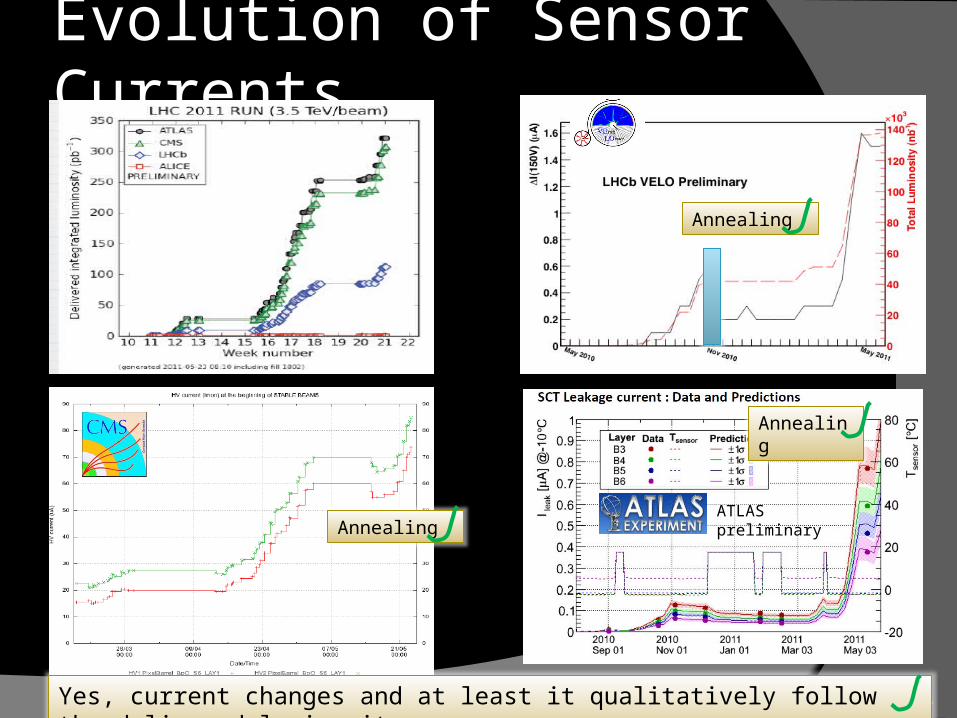
Evolution of Sensor Currents
Frank HartmannYes, current changes and at least it qualitatively follow the delivered luminosity
ATLAS preliminary
Annealing
Annealing
Annealing
Vertex 2011 7
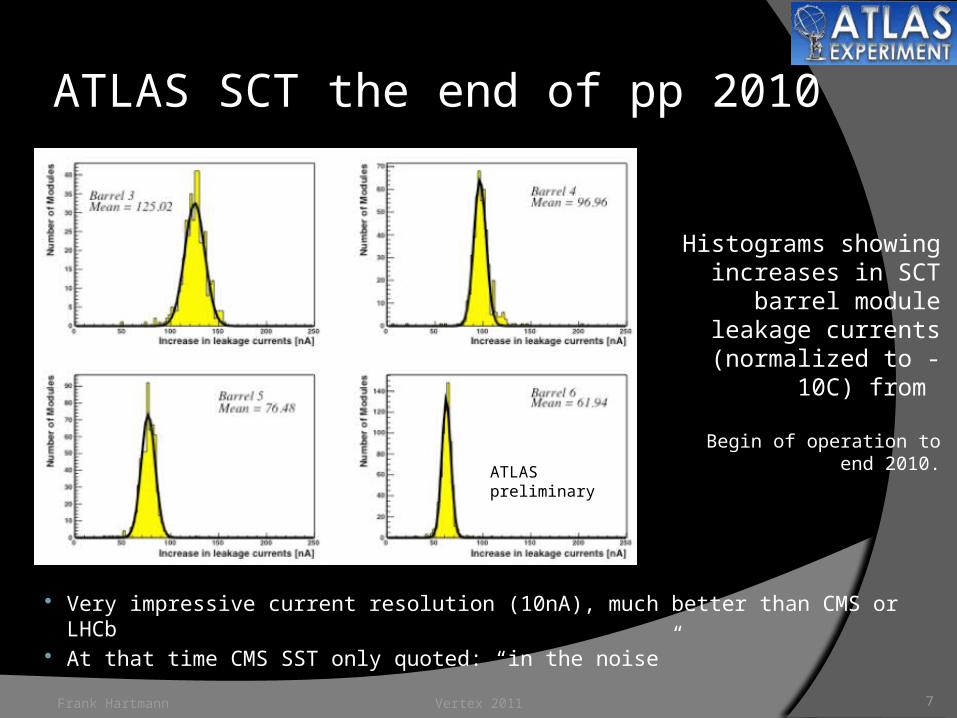
Very impressive current resolution (10nA), much better than CMS or LHCb At that time CMS SST only quoted: “in the noise”
ATLAS SCT the end of pp 2010
Frank Hartmann
Histograms showing increases in SCT barrel
module leakage currents(normalized to -10C) from
Begin of operation to end 2010.
ATLAS preliminary

Vertex 2011 8
WEB-based online tool No dedicated measurement Standard DB query
Power supply I value, begin of each fill (10min)
Different layers – different f Different # of modules Different T
different curves
Offline analysis Normalize volume & T Normalize to slope
[mA/1fb-1/ cm3]
DB query
Frank Hartmann
CMS Preliminary
CMS Preliminary
CMS Preliminary
Vertex 2011 9
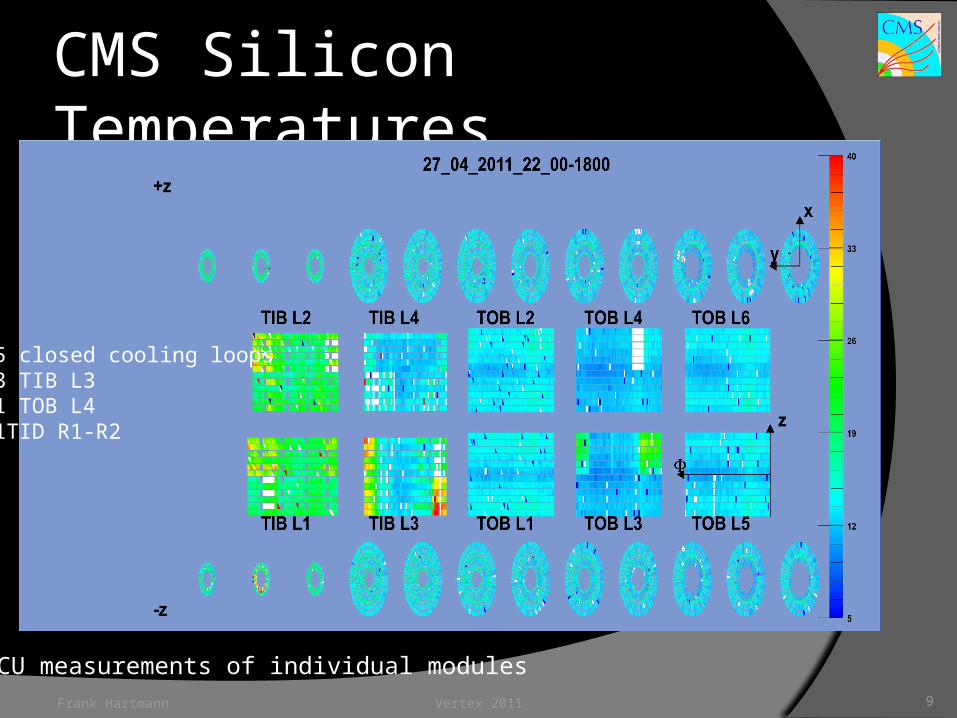
CMS Silicon Temperatures
Frank Hartmann
DCU measurements of individual modules
5 closed cooling loops3 TIB L31 TOB L41TID R1-R2
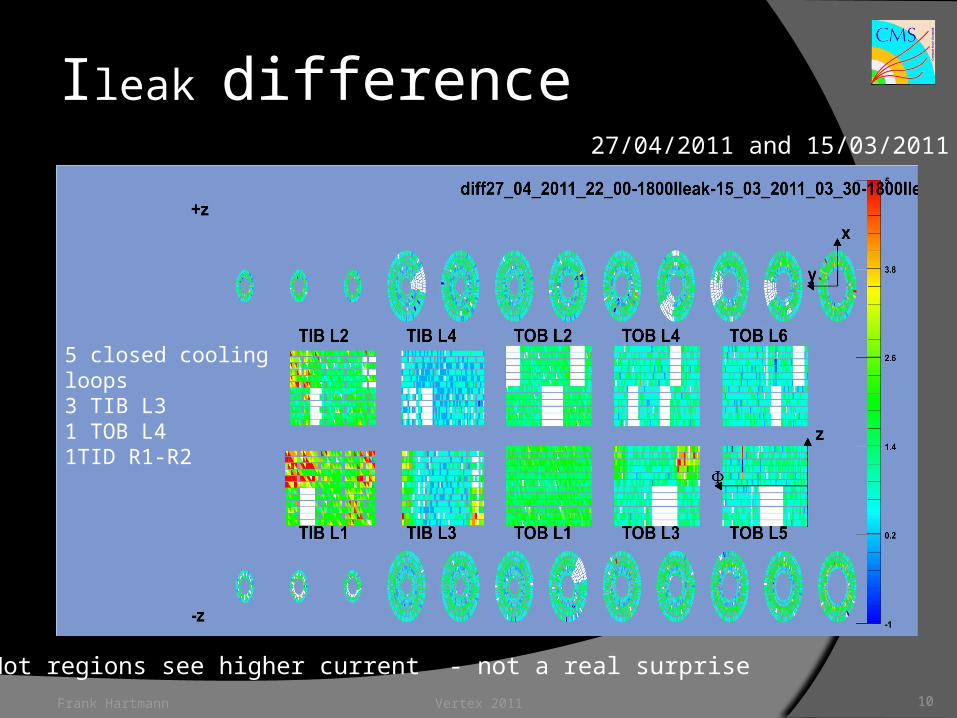
Ileak difference
5 closed cooling loops3 TIB L31 TOB L41TID R1-R2
27/04/2011 and 15/03/2011
Hot regions see higher current - not a real surpriseFrank Hartmann Vertex 2011 10
Vertex 2011 11
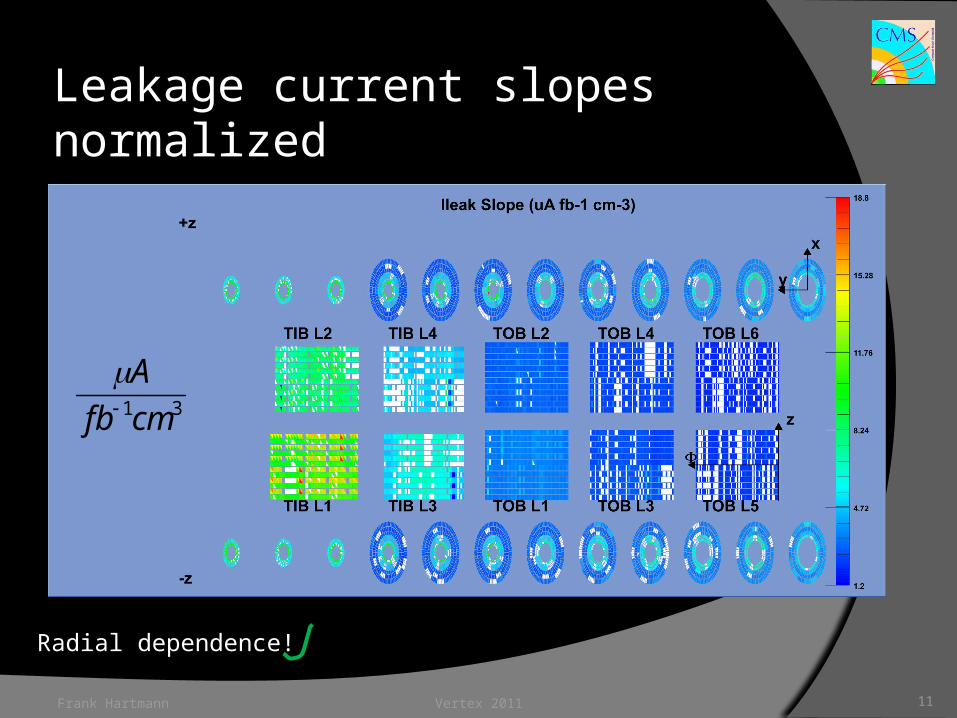
Leakage current slopes normalized
Frank Hartmann
31cmfbA
m
Radial dependence!
Vertex 2011 12
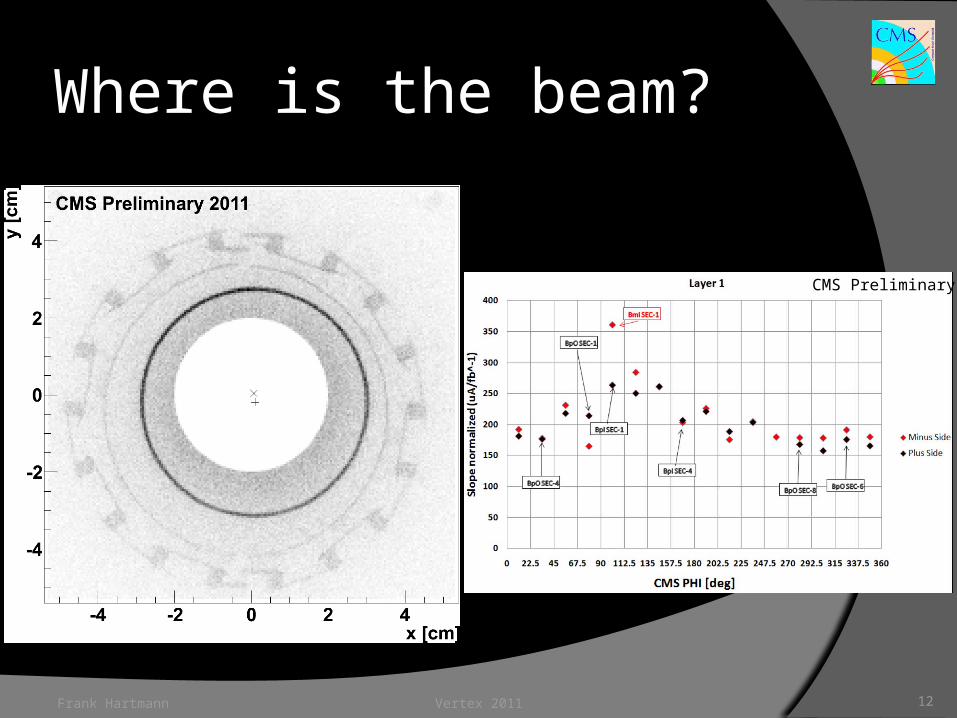
Where is the beam?
Frank Hartmann
CMS Preliminary
Vertex 2011 13
A try to compare results with simulation
Frank Hartmann

Vertex 2011 14
ATLAS current data vs. simulation
Frank Hartmann
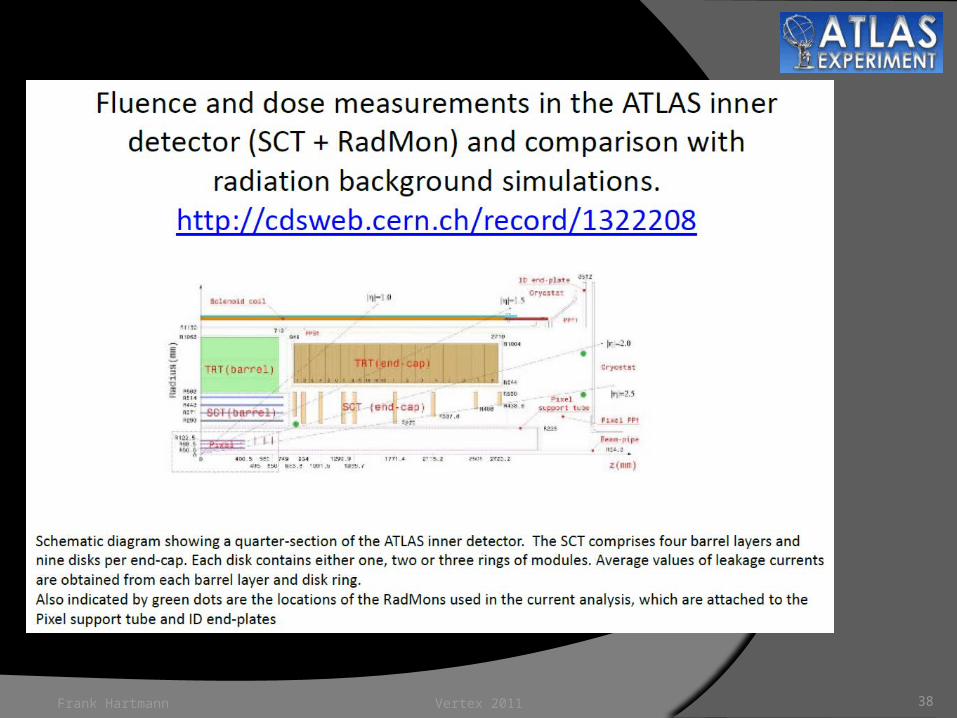
Comparison of NIEL (1MeV neutron equivalent) measurements and simulated predictions
Comparison of ionising-dose measurements and simulated predictions
Dedicated RADmon sensors readout via DCS1. Radiation sensitive p-MOS
transistors (RADFETs).2. Calibrated diodes
ATLAS preliminary
ATLAS preliminary
Comparison
Vertex 2011 15
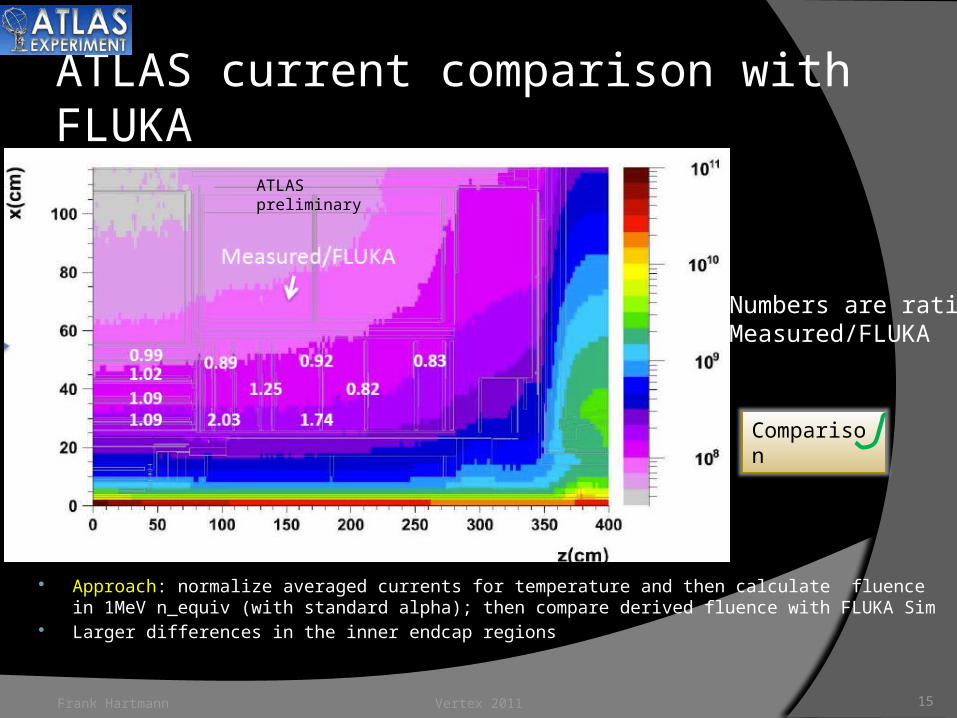
Approach: normalize averaged currents for temperature and then calculate fluence in 1MeV n_equiv (with standard alpha); then compare derived fluence with FLUKA Sim
Larger differences in the inner endcap regions
ATLAS current comparison with FLUKA
Frank Hartmann
Numbers are ratioMeasured/FLUKA
ATLAS preliminary
Comparison
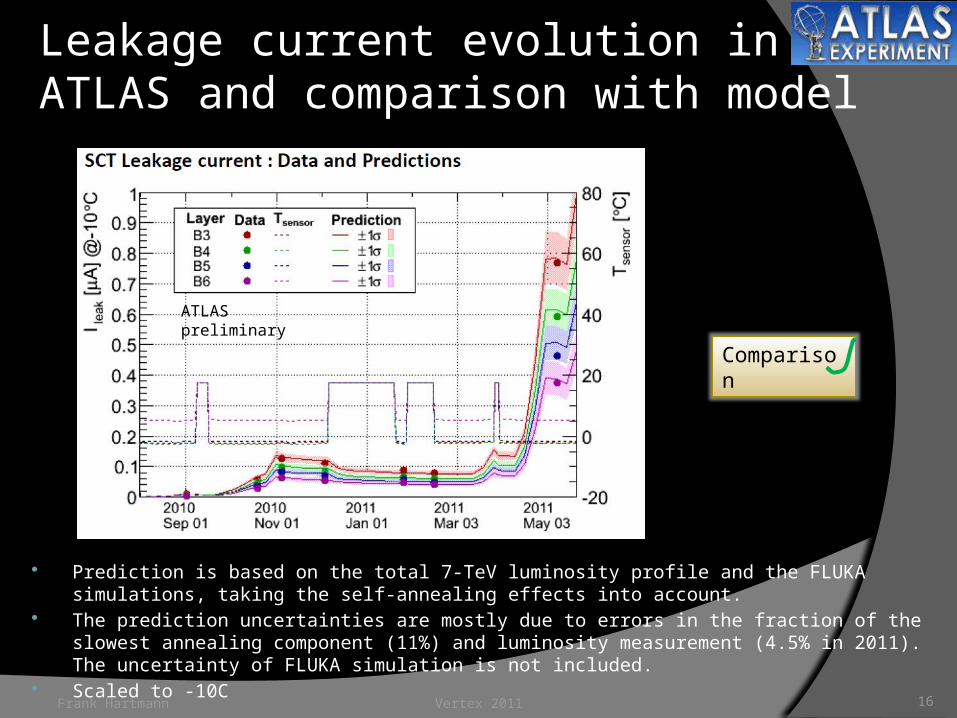
Vertex 2011 16
Prediction is based on the total 7-TeV luminosity profile and the FLUKA simulations, taking the self-annealing effects into account.
The prediction uncertainties are mostly due to errors in the fraction of the slowest annealing component (11%) and luminosity measurement (4.5% in 2011). The uncertainty of FLUKA simulation is not included.
Scaled to -10C
Leakage current evolution in ATLAS and comparison with model
Frank Hartmann
ATLAS preliminary
Comparison
Vertex 2011 17
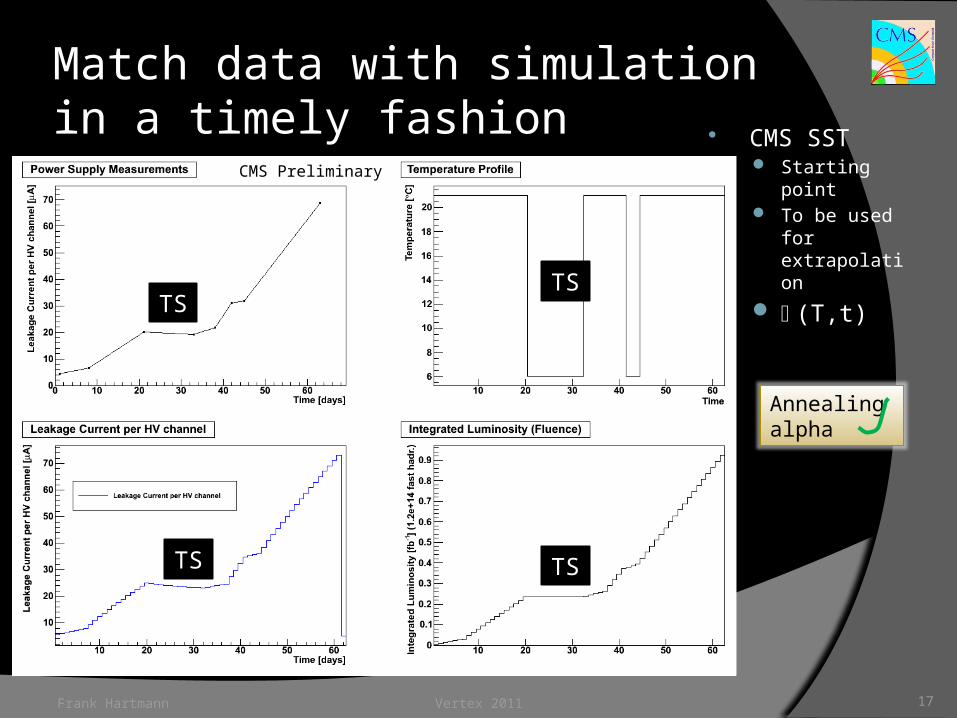
CMS SST Starting point To be used for
extrapolation a(T,t)
Match data with simulation in a timely fashion
Frank Hartmann
TS
TS TS
TS
CMS Preliminary
Annealingalpha
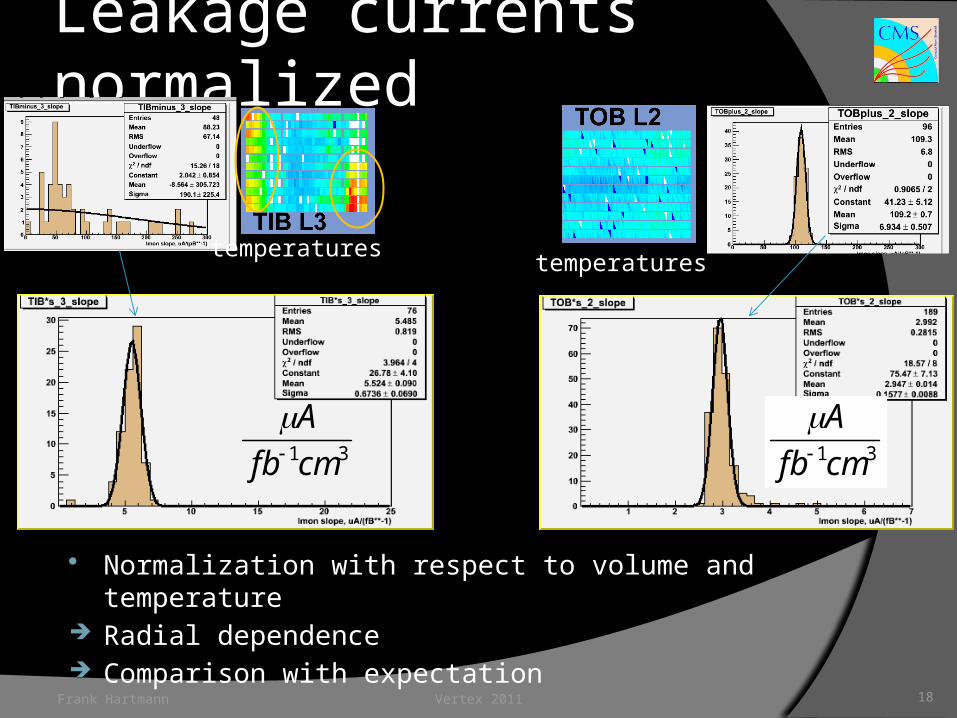
Normalization with respect to volume and temperature Radial dependence Comparison with expectation
Leakage currents normalized
Frank Hartmann Vertex 2011 18
31cmfbA
m31cmfb
A
m
temperatures temperatures
Vertex 2011 19
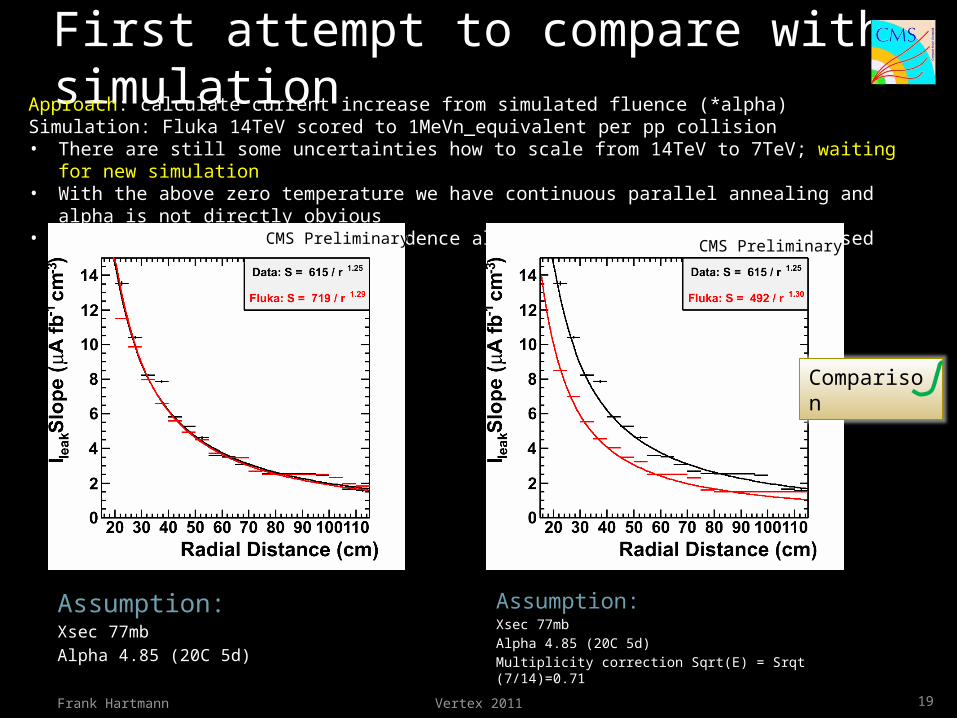
First attempt to compare with simulation
Assumption:Xsec 77mbAlpha 4.85 (20C 5d)
Assumption:Xsec 77mbAlpha 4.85 (20C 5d)Multiplicity correction Sqrt(E) = Srqt (7/14)=0.71
Frank Hartmann
Approach: calculate current increase from simulated fluence (*alpha)Simulation: Fluka 14TeV scored to 1MeVn_equivalent per pp collision• There are still some uncertainties how to scale from 14TeV to 7TeV; waiting for new simulation• With the above zero temperature we have continuous parallel annealing and alpha is not directly obvious• Mind also that the radial dependence also changes a bit with Z (here used central region)
CMS Preliminary CMS Preliminary
Comparison

Vertex 2011 20
Hide & Seek -- Localized comparison
Frank Hartmann
CMS Preliminary
Comparison

Vertex 2011 21
Depletion voltageDo we see already effects?Can we tune the HH model parameters?
Frank Hartmann
Vertex 2011 22
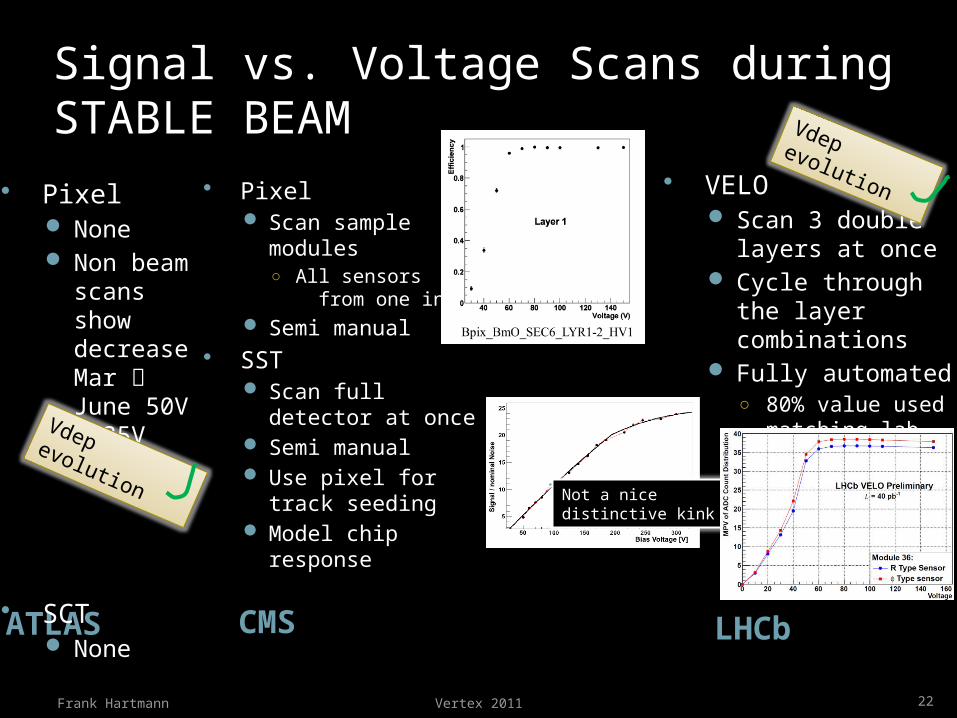
Signal vs. Voltage Scans during STABLE BEAM
ATLAS
Pixel None Non beam
scans show decrease Mar June 50V 35V
SCT None
Frank Hartmann
CMS
Pixel Scan sample
modules○ All sensors
from one ingot Semi manual
SST Scan full detector at
once Semi manual Use pixel for track
seeding Model chip response
LHCb
VELO Scan 3 double
layers at once Cycle through the
layer combinations Fully automated
○ 80% value used matching lab CV
Not a nice distinctive kink
Vdep evolution
Vdep evolution
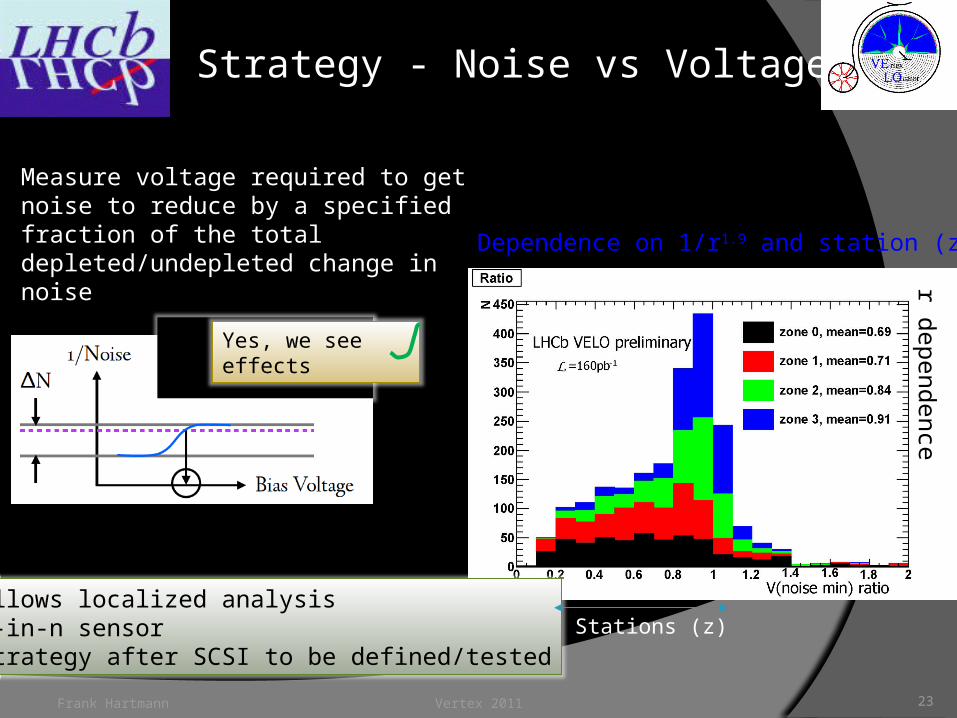
Strategy - Noise vs Voltage
Measure voltage required to get noise to reduce by a specified fraction of the total depleted/undepleted change in noise
• Allows localized analysis• n-in-n sensor• Strategy after SCSI to be defined/tested
Yes, we see effects
Dependence on 1/r1.9 and station (z)
Stations (z)
r dependence
Frank Hartmann Vertex 2011 23
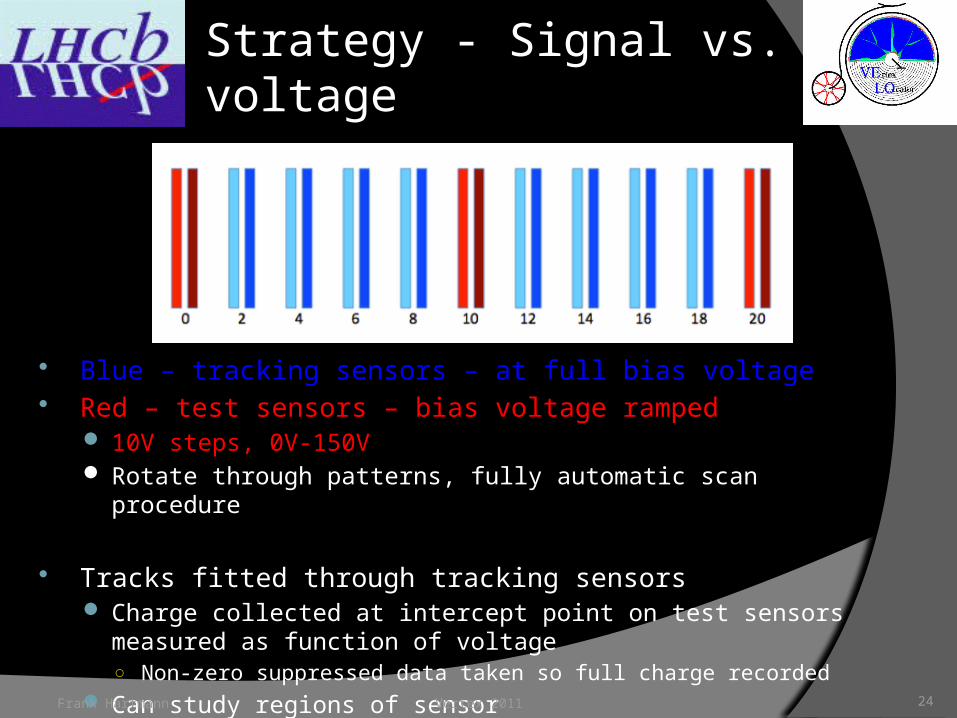
Strategy - Signal vs. voltage
Blue – tracking sensors – at full bias voltage Red – test sensors – bias voltage ramped
10V steps, 0V-150V Rotate through patterns, fully automatic scan procedure
Tracks fitted through tracking sensors Charge collected at intercept point on test sensors measured as function
of voltage○ Non-zero suppressed data taken so full charge recorded
Can study regions of sensorFrank Hartmann Vertex 2011 24
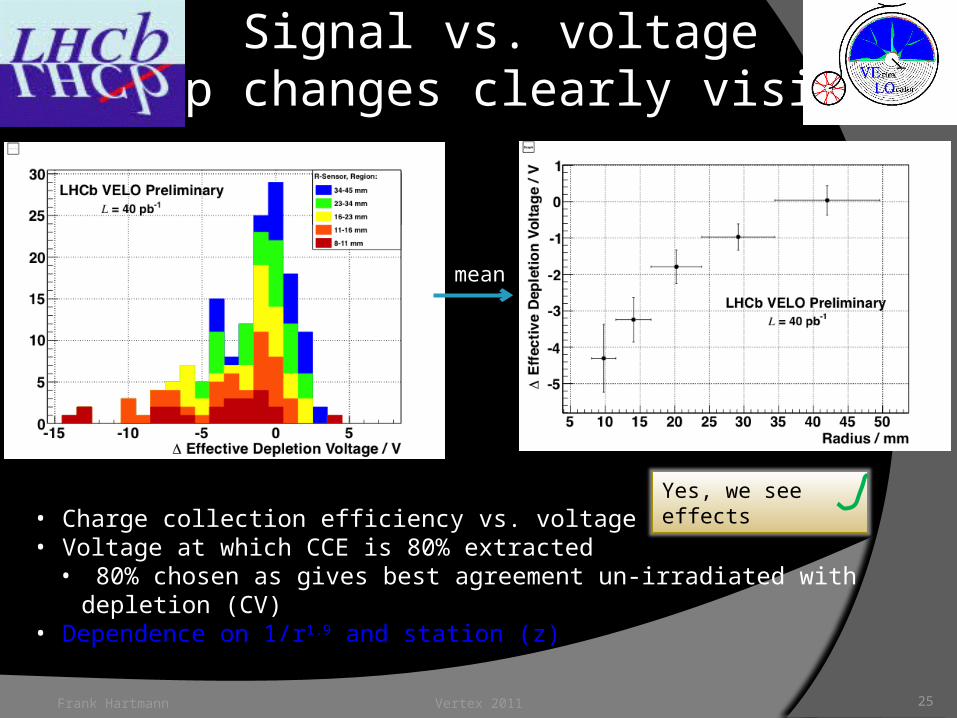
• Charge collection efficiency vs. voltage measured.• Voltage at which CCE is 80% extracted
• 80% chosen as gives best agreement un-irradiated with depletion (CV)• Dependence on 1/r1.9 and station (z)
Signal vs. voltageVdep changes clearly visible
mean
Yes, we see effects
Frank Hartmann Vertex 2011 25
Vertex 2011 26
More detailed example of method to determine depletion voltage
For CMS SST
Frank Hartmann
Vertex 2011 27
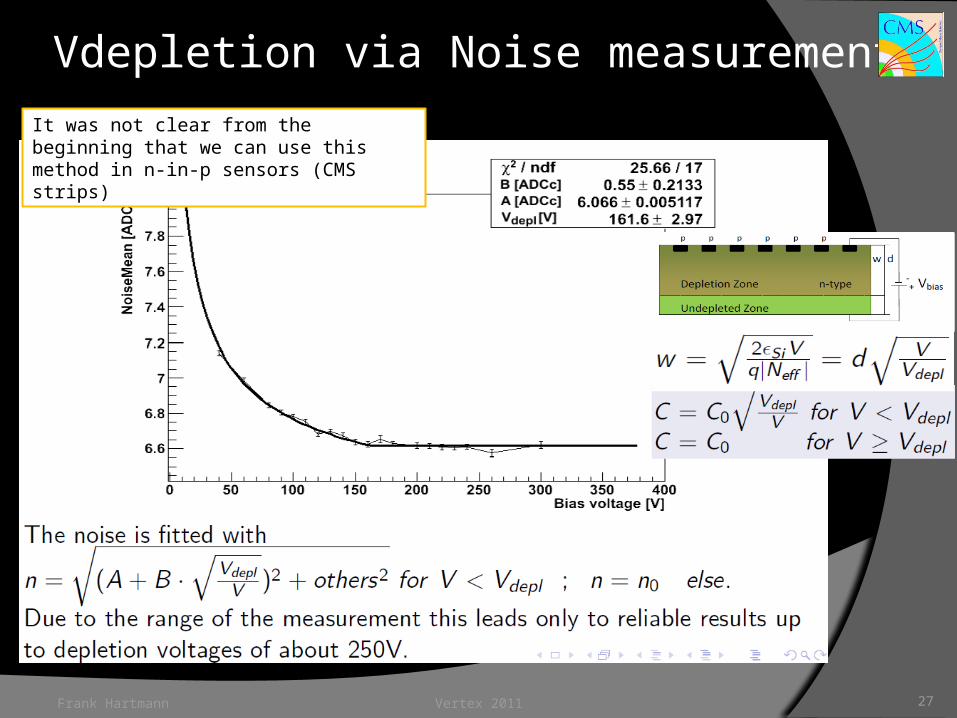
Vdepletion via Noise measurement
Frank Hartmann
It was not clear from the beginning that we can use this method in n-in-p sensors (CMS strips)

Vertex 2011 28
Vdepletion from noise in p-in-n sensors
Frank Hartmann
TOB
Reference measurements are from lab CV measurements on full sensor or
company CV on diodes
Vertex 2011 29
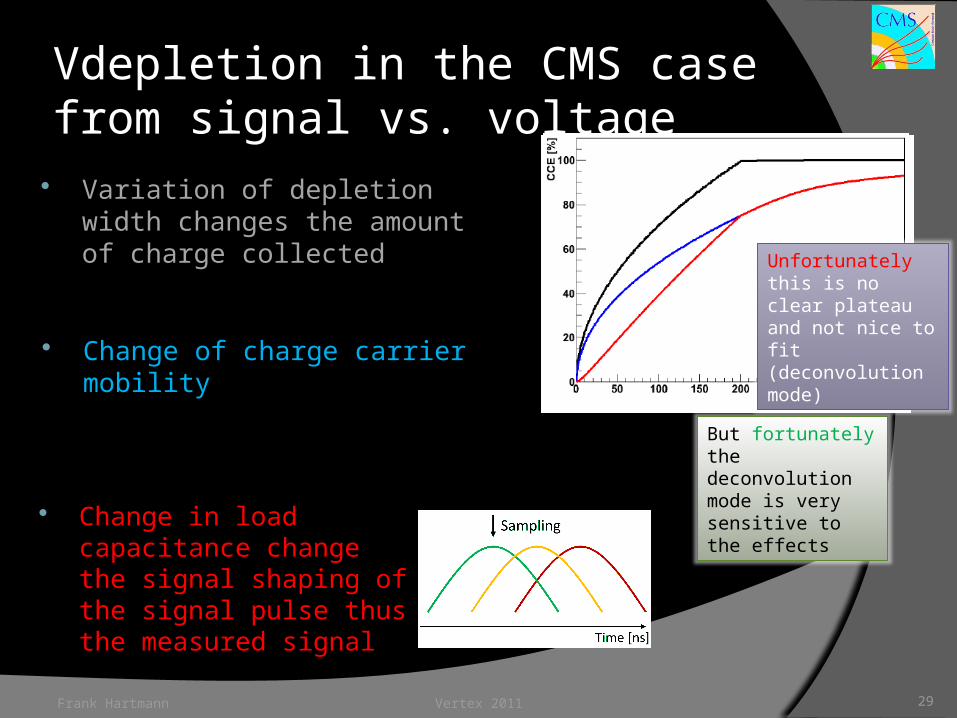
Variation of depletion width changes the amount of charge collected
Vdepletion in the CMS case from signal vs. voltage
Frank Hartmann
Change of charge carrier mobility
Change in load capacitance change the signal shaping of the signal pulse thus the measured signal
Unfortunately this is no clear plateau and not nice to fit (deconvolution mode)
But fortunately the deconvolution mode is very sensitive to the effects

Vertex 2011 30
Vdepletion from signal vs. voltage
Frank Hartmann
Laudau fit per given voltage onTrack cluster with good Landau fits Fit graph with pre-modeled curve
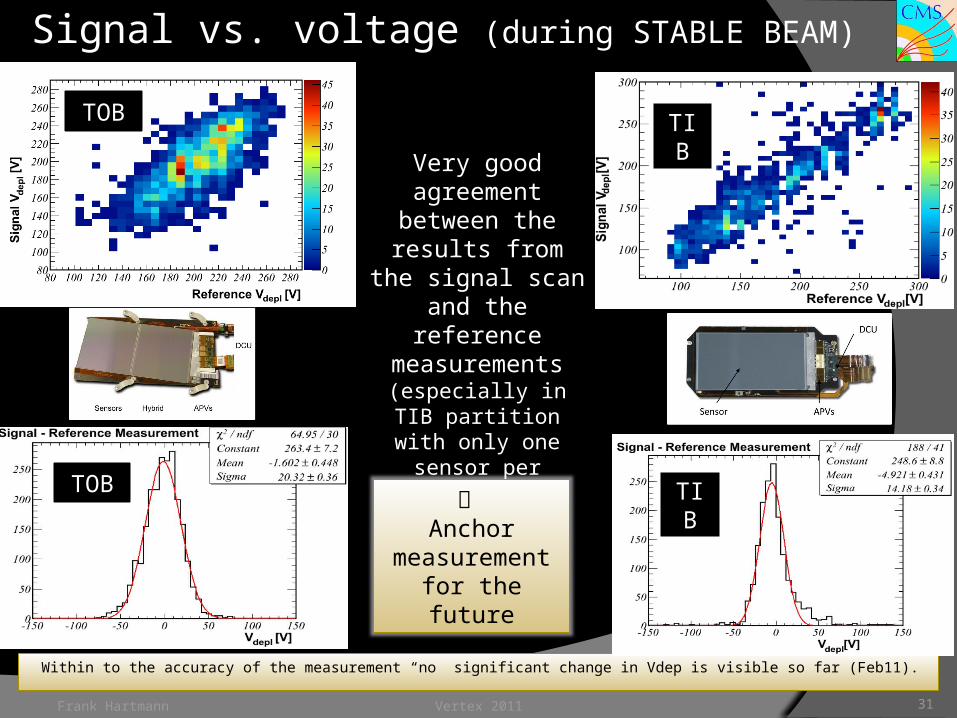
Signal vs. voltage (during STABLE BEAM)
Frank Hartmann Vertex 2011 31
Very good agreement between the results from the signal scan and the
reference measurements (especially in TIB
partition with only one sensor per module)
TIBTOB
Within to the accuracy of the measurement “no” significant change in Vdep is visible so far (Feb11).
TIBTOB Anchor
measurement for the future
Vertex 2011 32
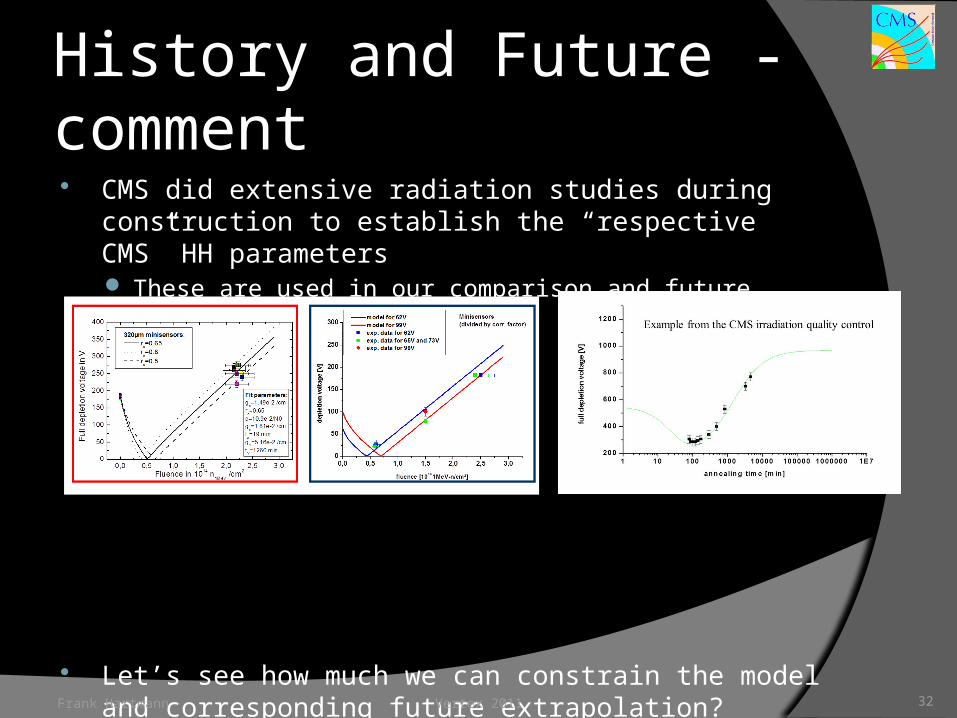
CMS did extensive radiation studies during construction to establish the “respective CMS” HH parameters These are used in our comparison and future extrapolation
Let’s see how much we can constrain the model and corresponding future extrapolation? Useful for upgrade?!?!
How can 10 LHC years in 10 minutes be compared with 10 LHC year in 10 years?
History and Future - comment
Frank Hartmann

Vertex 2011 33
Comments and Conclusion
Frank Hartmann
34
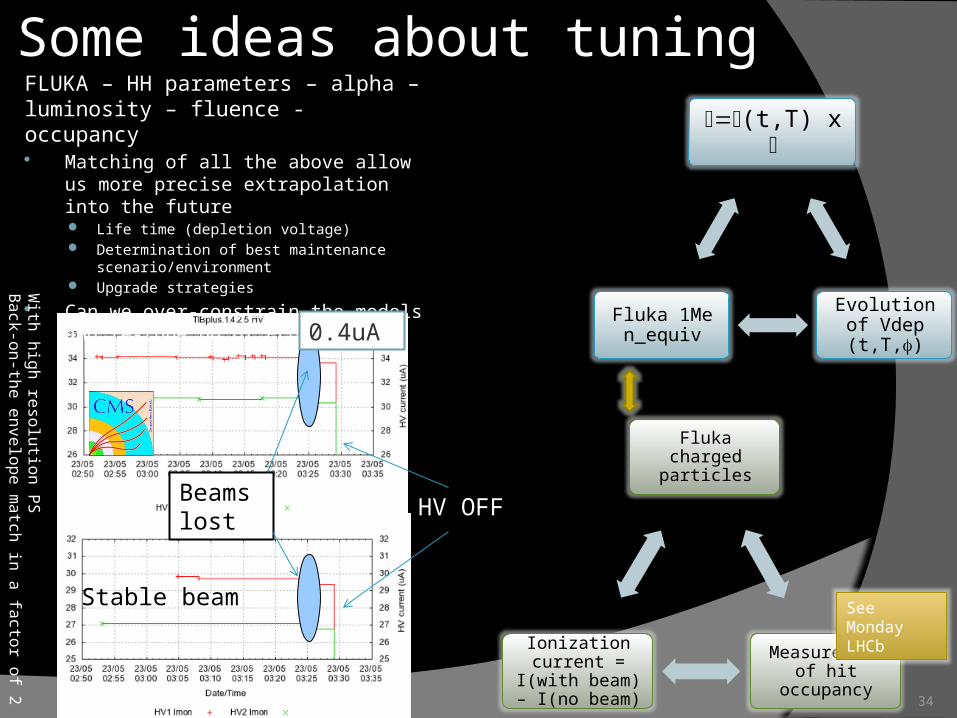
Some ideas about tuningFLUKA – HH parameters – alpha – luminosity – fluence - occupancy Matching of all the above allow us more
precise extrapolation into the future Life time (depletion voltage) Determination of best maintenance
scenario/environment Upgrade strategies
Can we over-constrain the models and re-tune HH or FLUKA?
I=a(t,T) x f
Evolution of Vdep (t,T,f)
Fluka 1Me n_equiv
Fluka charged particles
Measurement of hit occupancy
Ionization current = I(with beam) –
I(no beam)
With high resolution P
SB
ack-on-the envelope match in a factor of 2
HV OFF
Stable beam
Beamslost
0.4uA
See Monday LHCb
Vertex 2011 35
The effects of radiation on the silicon sensor is clearly visible in the first 1fb -1
Current ~ integrated luminosity○ Normalization for temperature and volume is necessary to allow comparison○ First comparison of data to simulation looks ok○ Uncertainties in
CMS: Still waiting for 7Tev Fluka SIM FLUKA, multiplicity, scaling and alpha - especially in the annealing term
Effects on Vdepletion are still tiny or not observable or not evaluated yet○ Methods to determine Vdepletion are established
Number of scans will remain small – cut into data taking Comparison and HH parameter tuning for Vdep is not yet possible
Projections are underway to ○ estimate lifetime or define environment during technical stops or shutdowns○ support the upgrade planning
Conclusion
Frank Hartmann
Big thanks to ATLAS and LHCb to allow me to show and compare strategies & results
Vertex 2011 36
Backup
Frank Hartmann

Vertex 2011 37
And now to LHCb - VELO
Frank Hartmann
Tips of VELO sensors expected to type invert in next months of LHC running
Middle station
Far station
TDR Prediction
•First Strip only 8mm from LHC beam• Outer strip 40mm
•Maximum Fluence predicted at 14TeV • 1.3x10¹⁴ 1MeV neq/cm2/2 fb-1
•Strongly non-uniform • dependence on 1/r1.9 and station
(z)
Vertex 2011 38Frank Hartmann
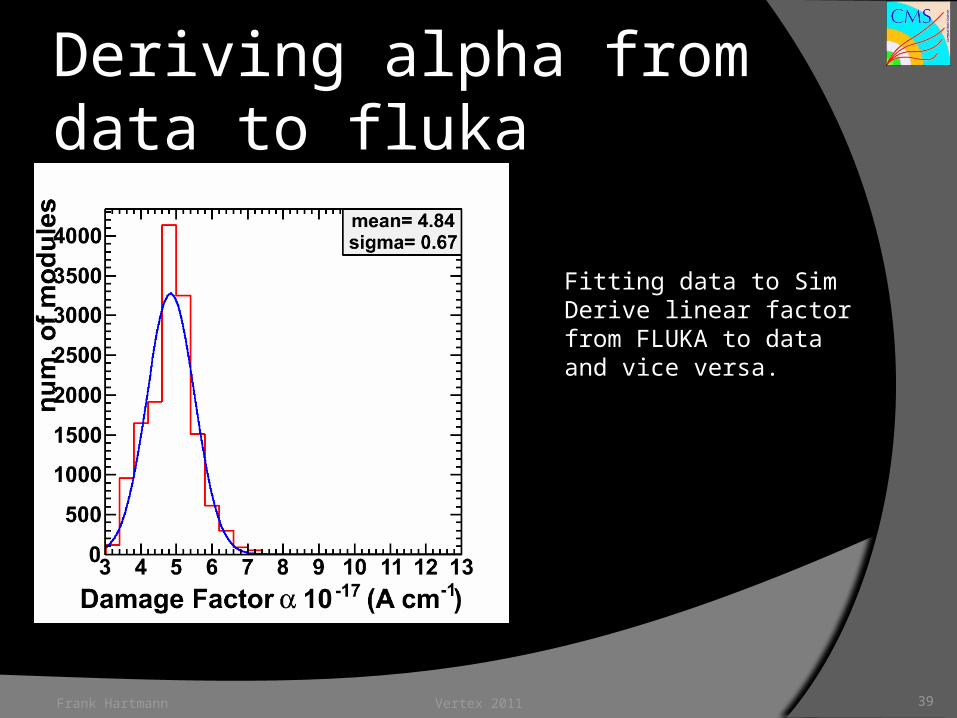
Deriving alpha from data to fluka
Fitting data to SimDerive linear factor from FLUKA to data and vice versa.
Frank Hartmann Vertex 2011 39