65
Telenet Roadshow Presentation H1 2015 Results

Telenet Roadshow Presentation
H1 2015
Results
Safe harbor disclaimer
Safe Harbor Statement under the Private Securities Litigation Reform Act of 1995.
Various statements contained in this document constitute “forward-looking statements” as that term is defined under the U.S. Private Securities Litigation
Reform Act of 1995. Words like “believe,” “anticipate,” “should,” “intend,” “plan,” “will,” “expects,” “estimates,” “projects,” “positioned,” “strategy,” and similar
expressions identify these forward-looking statements related to our financial and operational outlook; future growth prospects;, strategies; product, network
and technology launches and expansion and the anticipated impact of the acquisition of BASE Company NV on our combined operations and financial
performance, which involve known and unknown risks, uncertainties and other factors that may cause our actual results, performance or achievements or
industry results to be materially different from those contemplated, projected, forecasted, estimated or budgeted whether expressed or implied, by these
forward-looking statements. These factors include: potential adverse developments with respect to our liquidity or results of operations; potential adverse
competitive, economic or regulatory developments; our significant debt payments and other contractual commitments; our ability to fund and execute our
business plan; our ability to generate cash sufficient to service our debt; interest rate and currency exchange rate fluctuations; the impact of new business
opportunities requiring significant up-front investments; our ability to attract and retain customers and increase our overall market penetration; our ability to
compete against other communications and content distribution businesses; our ability to maintain contracts that are critical to our operations; our ability to
respond adequately to technological developments; our ability to develop and maintain back-up for our critical systems; our ability to continue to design
networks, install facilities, obtain and maintain any required governmental licenses or approvals and finance construction and development, in a timely manner
at reasonable costs and on satisfactory terms and conditions; our ability to have an impact upon, or to respond effectively to, new or modified laws or
regulations; our ability to make value-accretive investments; and our ability to sustain or increase shareholder distributions in future periods. We assume no
obligation to update these forward-looking statements contained herein to reflect actual results, changes in assumptions or changes in factors affecting these
statements.
Adjusted EBITDA and Free Cash Flow are non-GAAP measures as contemplated by the U.S. Securities and Exchange Commission’s Regulation G. For
related definitions and reconciliations, see the Investor Relations section of the Liberty Global plc website (http://www.libertyglobal.com/). Liberty Global plc is
our controlling shareholder.
2

Introduction to Telenet
Play (More)
De Vijver Media
BASE Company
NV
Acquisition Interkabel
Phone Retailer
Data security
Sporting Yelo
Fibernet
KING & KONG
Yelo TV
Whop & Whoppa
Broadband Internet
Telephony Analogue
TV Pay TV
Launch IDTV
HDTV & Hosting
2007 2009 2010 2010
1998 1996 2003 2005 2007 2002
2012 2013
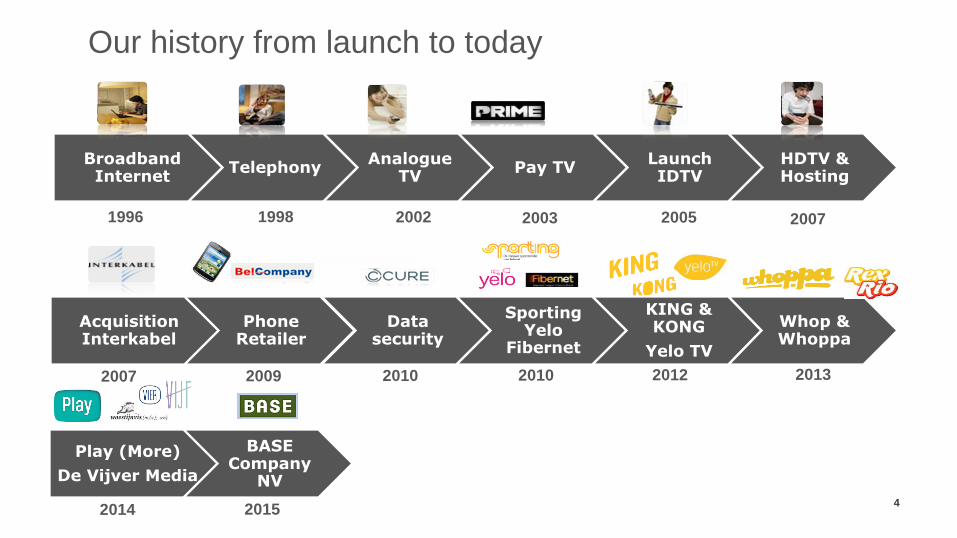
Our history from launch to today
2014 2015 4

Triple-play subscribers
(in 000)
+9.8%
2014
1,046.7
2013
955.3
2012
860.4
2011
738.1
2010
719.2
Mobile telephony subscribers
(in 000)
+44.6%
2014
894.5
2013
750.5
2012
521.6
2011
246.4
2010
204.4
ARPU per customer relationship1
42.1
2010
38.8
2012
45.9
2011
+6.4%
2014
49.8
2013
47.6
(in €)
Multiple-play penetration
3P
2014
2P
1P
2013 2012 2011 2010
5
See Notes page for additional disclosure
Robust triple-play growth resulted in 6% ARPU CAGR
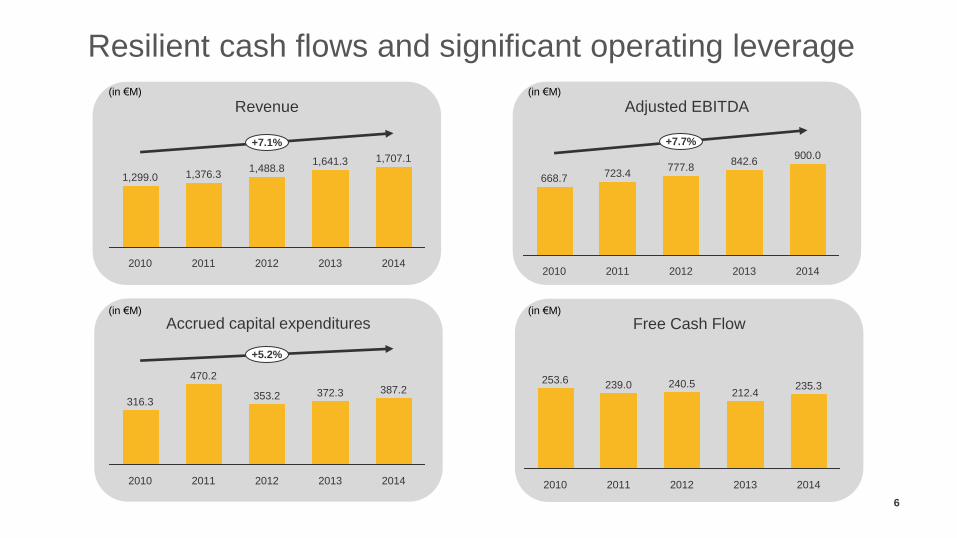
Revenue
(in €M)
+7.1%
2014
1,707.1
2013
1,641.3
2012
1,488.8
2011
1,376.3
2010
1,299.0
Accrued capital expenditures
(in €M)
+5.2%
2014
387.2
2013
372.3
2012
353.2
2011
470.2
2010
316.3
Free Cash Flow
2014
235.3
2013
212.4
2012
240.5
2011
239.0
2010
253.6
(in €M)
Adjusted EBITDA
+7.7%
2014
900.0
2013
842.6
2012
777.8
2011
723.4
2010
668.7
(in €M)
6
Resilient cash flows and significant operating leverage

Legacy Telenet Network
Interkabel Network = acquired Oct 1, 2008
+ 1/3rd of Brussels
Flanders is a cohesive footprint with …
› … a focused, regional government
› … a regional culture and language
› … a regional media environment
› … a strong and growing economy
› … superior GDP per capita
› (23% above EU average)
› Our franchise area covers 2.9 million
households (63% of Belgium)
› 2.8 million homes passed with our cable =
98% reach
› 2.3 million unique customers
= 81% cable penetration
› In B2B, we cover the whole of Belgium and
Luxembourg
7
Our footprint in Flanders and one third of Brussels

Investing in the upgrade and
modernisation of our network
€ 500m over the next five years
At least 1 Gbps
With downstream broadband
speeds of at least 1 Gbps,
our HFC network is future-proof
and will be able to cater to ever
increasing need for speed.
Wi-Free
Improving WiFi networks in public
place, at home and at work.
600 MHz 1 GHz
Increasing available bandwidth by replacing
all 150,000 amplifiers and no fewer than 1.8
million other components in our fixed
network.
Ambitious multi-year plan
In order to fulfill the increase in data traffic
going forward and to have the necessary
capacity to carry out speed increases.
“Grote Netwerf” investment program The most far-reaching adaptation to our network in our history
8

Boosting the digital aorta in Flanders €500 million network investment program to increase the available bandwidth capacity from 600 MHz currently to 1 GHz, enabling speeds of minimum 1 Gbps
9
150,000 amplifiers
1.8 millions taps & splitters
6,200 nodes 48 head-ends 1.8 million NIUs

10
Cable technology roadmap Building next-generation network at stable network capex thanks to gradual upgrade cycles; Pulsar almost finished at ~490 HP/node

Deliver fastest connectivity for all devices in and beyond the home
Continuous investments to stay ahead of competition
Preparing for EuroDocsis 3.1, allowing downstream speeds of up to 1
Gbps
Superior
connection
Leading
products &
services
Simple portfolio, offering the best value for money
Service convergence between fixed and mobile
Seamless integration of connectivity, platform and content
Everything included, enabling customers to enjoy their digital lifestyle
Great entertainment offering
Focus on customer loyalty and customer service
Great
customer
experience
11
Our strategy Delivering an Amazing Customer Experience through a superior pipe

Our customer promise
12
Simple Transparent Customer
is King Future proof

Further investment in customer care Telenet Support expands the app ecosystem for our residential customers, while our B2B customers get dedicated and personalized assistance
13
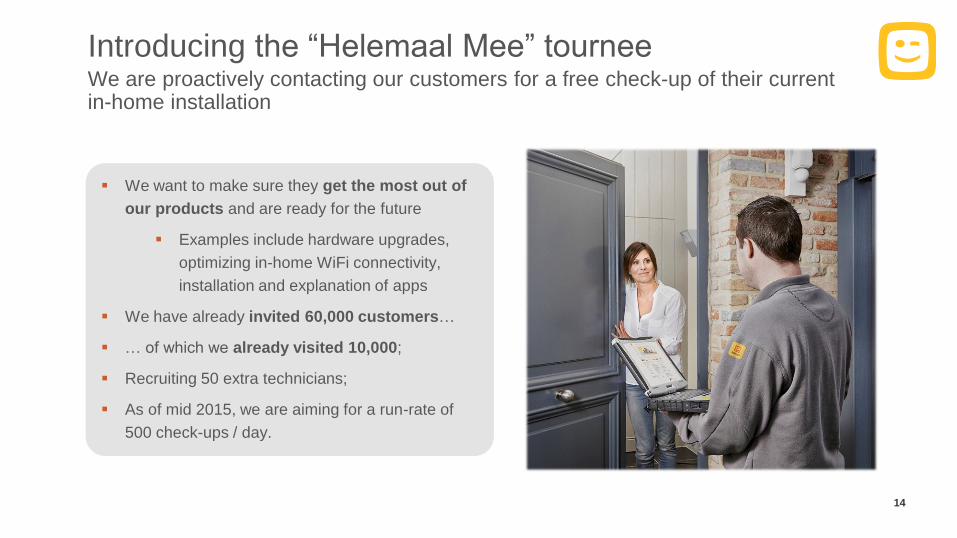
Introducing the “Helemaal Mee” tournee We are proactively contacting our customers for a free check-up of their current in-home installation
14
We want to make sure they get the most out of
our products and are ready for the future
Examples include hardware upgrades,
optimizing in-home WiFi connectivity,
installation and explanation of apps
We have already invited 60,000 customers…
… of which we already visited 10,000;
Recruiting 50 extra technicians;
As of mid 2015, we are aiming for a run-rate of
500 check-ups / day.

Our future growth drivers Further investments in our products, customers and network have strengthened our competitive positioning and left us well positioned for healthy growth in 2016
15
Entertainment Telenet for
Business Mobile
Offer best value for money
through a simple portfolio
with King, King Supersize
and Kong
Seamless handover
between 4G cellular and
WiFi via EAP SIM
Continue expansion of our
WiFree homespots
Revamped Yelo TV
platform to cater new trends
in TV (e.g. swipe TV, catch-
up TV, smart search,
recommendations)
Home of HBO and access
to local programming: offer
the broadest and most
exclusive film and TV series
1 2 3
WiFi offloading as money-
saver for customers
B2B solutions on the
Telenet Business Highway
Aggregating the best local
and international content
Mobile Employee Plan
Telenet network expansion
program in greenfield and
existing business parks
Examples of MLE wins
include voice at all Flemish
universities and security at
“De Persgroep”
5
Triple-play
penetration
Fastest and most valuable
triple play experience
4
3P 49%
2P
28%
1P
29%
Benefiting from operating leverage:
increased focus on cost efficiences

Executive Summary
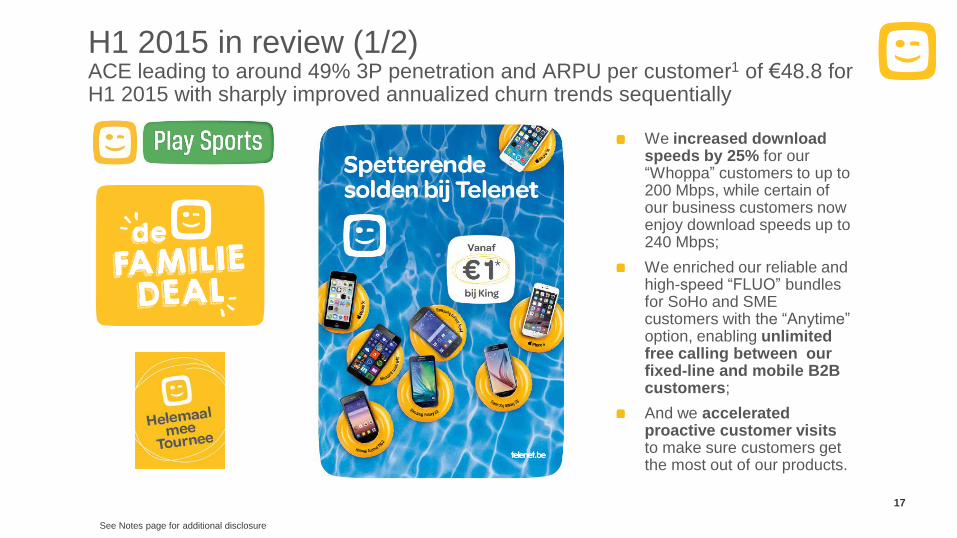
H1 2015 in review (1/2) ACE leading to around 49% 3P penetration and ARPU per customer1 of €48.8 for H1 2015 with sharply improved annualized churn trends sequentially
17
We increased download speeds by 25% for our “Whoppa” customers to up to 200 Mbps, while certain of our business customers now enjoy download speeds up to 240 Mbps;
We enriched our reliable and high-speed “FLUO” bundles for SoHo and SME customers with the “Anytime” option, enabling unlimited free calling between our fixed-line and mobile B2B customers;
And we accelerated proactive customer visits to make sure customers get the most out of our products.
See Notes page for additional disclosure

H1 2015 in review (2/2) Solid operational results leading to robust financial growth and upgraded outlook for FY 2015
18
Start of our B2B footprint expansion project
Kick-off of “De Grote Netwerf”, our €500.0 million network upgrade program to 1 GHz
Further Wi-Free roll-out across core cities in Flanders
Speed upgrade to up to 200 Mbps for both new and existing “Whoppa” customers
Certain of our B2B customers now enjoy download speeds of up to 240 Mbps
Launch of “Play Sports”, the true sports hub in our market
Regulatory approval for 50% investment in local media company De Vijver Media NV
Acquisition of BASE Company NV to secure long-term mobile access, pending regulatory approval
Launch of “Telenet Kickstart, powered by Idealabs”, our follow-up start-up accelerator program
Successful debt refinancing through issuance of €530.0 million Senior Secured Notes with improved tenor at lower cost
€50.0 million share buy-back program
Continuing to add more
value for customers
Adding building blocks for
future healthy growth

Cable wholesale access Timeline and issues with the current proposal
19
1. Reference values for additional services need to be relevant for Telenet
2. France is not a valuable reference as
the average effective retail-minus is put at around 47% (current proposal for Telenet above 60%), and
an upfront investment by operators is foreseen at €5 million (for Telenet only €750,000)
3. Stimulating innovation is a must
EC comments
letter
May 2011
Suspension appeal
rejected
September 2012
CRC
Retail minus decision
December 2013
Telenet
Implementation
ready
July 2014
Publication
Retail minus
assessment
for Brussels
May 2015
December 2010
Draft CRC
broadcasting
decision
July 2011
CRC
broadcasting
market
decision
September 2013
CRC
technical
implementation
decision
January 2014
Mobistar
access request
November 2014
Court case on the
merits rejected
Aug – Sep 2015
EC notification
procedure reviewof
retail minus by EC
Final revised retail
Minus decision
Oct 2015

Cable wholesale access – Retail minus calculation Composition of new/former wholesale tariffs for “Whop” in €/month
20
New
wholesale
tariff
(2015)
during
transition
period
19.7
Min
us (
durin
g
transitio
n p
erio
d)
2.1
New
wholesale
tariff
(2015)
after
transition
period
21.8
Min
us (
aft
er
transitio
n p
erio
d)
5.7
New
reference
tariff
(2015)
27.5
VA
S
7.6
Te
lephony
10.7
ST
B
7.2
Conte
nt
rig
hts
3.3
Retail
tariff
(2015,
excl VAT)
56.3
Conte
nt
rig
hts
3.3
Te
lephony
14.2
Former
reference
price
(2013)
38.8
Fo
rmer
min
us
8.9
Former
wholesale
tariff
(2013)
29.9
-27.1%

Product Overview & Operational Highlights

Multiple-play penetration Triple-play subscribers up 8% in Q2 2015, representing around 49% of our customer base
Customer mix H1 2014
Customer mix H1 2015
3P 44.5%
2P
24.3%
1P
31.2%
3P 48.6%
2P
22.7%
1P
28.7%
Triple-play subscribers
ARPU per customer relationship1
+8.1%
Q2 15
1,058,700
Q2 14
979,000
+4.1%
Q2 15
48.8
Q2 14
46.9
22
See Notes page for additional disclosure
(in €)
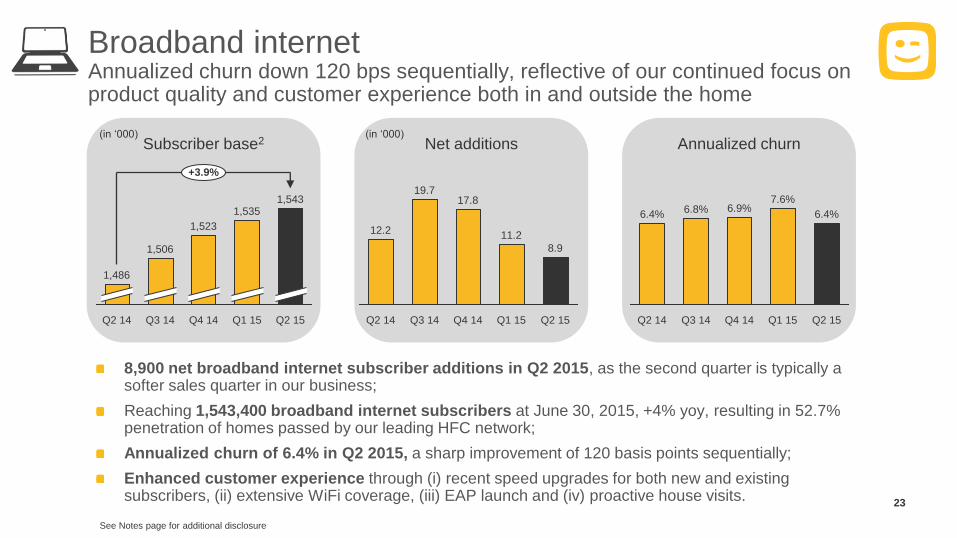
Broadband internet Annualized churn down 120 bps sequentially, reflective of our continued focus on product quality and customer experience both in and outside the home
8,900 net broadband internet subscriber additions in Q2 2015, as the second quarter is typically a softer sales quarter in our business;
Reaching 1,543,400 broadband internet subscribers at June 30, 2015, +4% yoy, resulting in 52.7% penetration of homes passed by our leading HFC network;
Annualized churn of 6.4% in Q2 2015, a sharp improvement of 120 basis points sequentially;
Enhanced customer experience through (i) recent speed upgrades for both new and existing subscribers, (ii) extensive WiFi coverage, (iii) EAP launch and (iv) proactive house visits.
Subscriber base2
Q1 15
1,535
Q4 14
1,523
Q3 14
1,506
Q2 15
1,543
1,486
Q2 14
+3.9%
Net additions
Q1 15
11.2
Q4 14
17.8
Q3 14
19.7
Q2 14
12.2
8.9
Q2 15
Annualized churn
Q1 15
7.6%
Q4 14
6.9% 6.4%
Q2 15 Q3 14
6.8%
Q2 14
6.4%
(in ‘000) (in ‘000)
23
See Notes page for additional disclosure

“Helemaal mee” Tournee Accelerating our well appreciated proactive customer visits across Flanders, driving customer satisfaction higher
24
Check and improve indoor WiFi coverage and connect all devices to the correct WiFi access points;
Install all relevant Telenet apps (Support, Mobile, Yelo Play, Play Sports) and reset forgotten passwords;
Making sure STB is optimally connected to TV set and free Telenet modem upgrade if necessary.

Fixed-line telephony More than 40% of homes passed subscribed to our attractive fixed-line telephony offers at June 30, 2015
13,000 net fixed-line telephony subscriber additions in Q2 2015, again exceeding net broadband subscriber additions, demonstrating continued triple-play conversion;
1,187,500 fixed-line telephony subscribers at the end of Q2 2015, up 7% yoy, equivalent to 40.6% penetration of homes passed by our network;
Annualized churn of 7.0% in Q2 2015, a 190 basis points improvement compared to Q1 2015 when our churn was impacted by the January 2015 price adjustments;
Our innovative VoIP app “Triiing” had approximately 358,600 registered devices at June 30, 2015.
Subscriber base2
+6.8%
Q2
15
1,188
Q1
15
1,175
Q4
14
1,160
Q3
14
1,139
Q2
14
1,112
Net additions
Q2 15
13.0
Q1 15
15.0
Q4 14
20.9
Q3 14
26.9
Q2 14
19.6
Annualized churn
Q1 15 Q2 15
7.0%
8.9%
Q4 14
6.7% 7.8%
Q3 14
6.8%
Q2 14
(in ‘000) (in ‘000)
25
See Notes page for additional disclosure

Mobile telephony Broadly stable net mobile postpaid subscriber growth in Q2 2015, with subscriber base up 16% yoy at June 30, 2015
29,200 net mobile postpaid subscribers added in Q2 2015, a broadly stable performance compared to the preceding quarter despite the intensely competitive environment;
Solid commercial performance driven by our new “Family Deal” offers and attractive handset subsidy plans, resulting in 953,700 mobile postpaid subscribers at June 30, 2015 (+16% yoy);
Annualized churn of 13.1% in Q2 2015 reached its lowest level since mid-2012;
Mobile telephony subscription revenue of €98.9 million in H1 2015 (excluding interconnection), up 16% yoy, driven by double-digit subscriber growth, partially offset by a decrease in usage-related revenue per user.
Subscriber base
+16.2%
Q2
15
954
Q1
15
925
Q4
14
894
Q3
14
868
Q2
14
821
Net additions
Q2 2015
29.2
Q1 15
30.2
Q4 14
25.9
Q3 14
47.8
Q2 14
41.2
Mobile telephony revenue
Q1
+15.5%
Q2
2015
98.9
47.9
51.0
2014
85.6
41.8
43.8
(in ‘000) (in ‘000)
26
(in €M)

Launch of our “Family Deal” proposition Boosting value for new and existing triple-play subscribers, through recurring monthly discounts as of the 2nd SIM in the home
27

Video Improved net subscriber loss in Q2 2015, back in line with average loss rate of recent quarters
2,063,800 total video subscribers at June 30, 2015, representing approximately 71% of the homes passed by our network;
The net loss of 7,600 net video subscribers in Q2 2015 was back in-line with the average churn witnessed in previous quarters after the increase in Q1 2015, which reflected the anticipated impact from the January 2015 price adjustments.
Total video subscribers
Q1 15
2,071
Q4 14
2,083
Q3 14
2,091
Q2 14
2,093
Q2 15
2,064
(in ‘000)
28
Net total video subscriber loss3
Q2 14
(5.2)
Q1 15
(11.9)
Q4 14
(7.4)
Q3 14
(2.1)
Q2 15
(7,6)
(in ‘000)
See Notes page for additional disclosure

Enhanced video Nearly 1.7 million enhanced video subscribers at June 30, 2015, equivalent to around 82% of our total video subscriber base
5,800 net enhanced video subscribers added in Q2 2015;
1,693,900 enhanced video subscribers at June 30, 2015, up 2% yoy, and representing around 82% of our total video subscriber base;
Active user base of “Yelo Play”, our OTT platform, reached approximately 21% of our enhanced video subscriber base at June 30, 2015.
Subscriber base
Q2 2015
1,694
Q1 15
1,688
Q4 14
1,680
Q3 14
1,676
Q2 14
1,661
+2.0%
Net additions
5.8
Q2 15 Q1 15
8.0
Q4 14
4.0
Q3 14
15.1
Q2 14
11.6
Digitalization rate4
82%
18%
Enhanced
Basic
Q1 15
81%
19%
Q4 14
81%
19%
Q3 14
80%
20%
Q2 14
79%
21%
Q2 15
(in ‘000) (in ‘000)
29
See Notes page for additional disclosure

Unique positioning in premium entertainment Subscription VOD packs showing continued meaningful uptake across our enhanced video subscriber base
30
Our subscription VOD packages “Play” and “Play More” had 220,900 customers at June 30, 2015, up a strong 25% compared to Q1 2015 and driven in part by temporary promotions;
At June 30, 2015, 203,700 customers subscribed to our sports pay television channels, temporarily impacted by the end of the 2014-2015 football season throughout both domestic and international leagues;
The 2015-2016 Jupiler Pro League season started at the end of July 2015 and we will continue to broadcast all league matches on a non-exclusive basis.
“Play” & “Play More”
subscriber base
221
Q1
15
177
Q4
14
151
Q3
14
127
Q2
14
113
+95.7%
Q2
2015
“Play Sports”
subscriber base
+1.1%
Q2 15
204
Q1 15
207
Q4 14
205
Q3 14
206
Q2 14
202
(in ‘000) (in ‘000)

Launch of More sports, top entertainment and innovative extras, a must for all sports lovers
The best selection of sports, including football (Jupiler Pro League, Premier League, Bundesliga, Eredivisie), ball sports (basket, volleyball, hockey), cyclo cross (UCI, Superprestige), motor sports (Formula 1 & E, motorcross) and a 24/7 golf channel;
Play Sports app introduces a new dimension with 7-day catch-up functionality across a myriad of devices and ecosystems, live stats and match summaries;
Follow your favorite sports heroes on and off the field with the introduction of new TV programs and a brand new state-of-the-art contemporary studio;
Price unchanged at €16.45 per month5 for triple-play subscribers. 31
See Notes page for additional disclosure

Financial Highlights & FY 2015 Outlook

Revenue of €892.1 million in H1 2015, up 6% yoy Solid revenue growth driven by higher cable subscription revenue and double-digit growth in mobile telephony and B2B
Revenue of €892.1 million in H1 2015, up 6% yoy, driven by (i) solid multiple-play growth with the number of triple-play subscribers up 8% yoy, (ii) the benefit from the selective price increase on certain fixed services in January 2015, (iii) a €13.3 million higher contribution from our mobile activities, up 16% yoy, and (iv) a 14% increase in our business services revenue;
Revenue of €448.7 million in Q2 2015, up 6% yoy, reflecting the same growth drivers as mentioned above;
Upgraded revenue outlook for the full year 2015, targeting “5-6%” top line growth versus “4-5%” initially.
Revenue
+6.3%
Q2 15
448.7
Q2 14
422.0
YoY revenue trend
(in €M)
33
6.4%
5.3%
3.4%
Q4 14 Q2 14 Q1 15
4.4%
6.3%
Q2 15 Q3 14 H1 14 H1 15
892.1
+6.4%
838.8
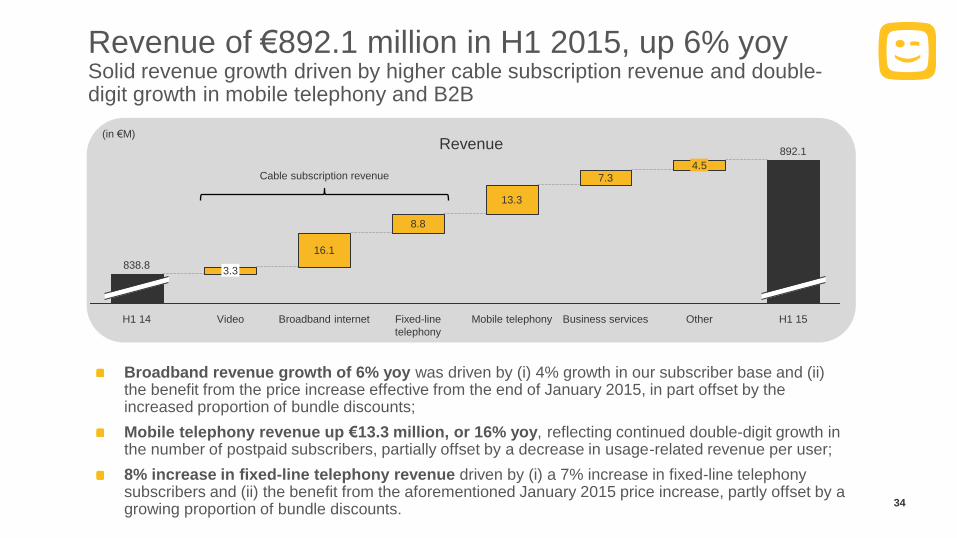
Revenue of €892.1 million in H1 2015, up 6% yoy Solid revenue growth driven by higher cable subscription revenue and double-digit growth in mobile telephony and B2B
Broadband revenue growth of 6% yoy was driven by (i) 4% growth in our subscriber base and (ii) the benefit from the price increase effective from the end of January 2015, in part offset by the increased proportion of bundle discounts;
Mobile telephony revenue up €13.3 million, or 16% yoy, reflecting continued double-digit growth in the number of postpaid subscribers, partially offset by a decrease in usage-related revenue per user;
8% increase in fixed-line telephony revenue driven by (i) a 7% increase in fixed-line telephony subscribers and (ii) the benefit from the aforementioned January 2015 price increase, partly offset by a growing proportion of bundle discounts.
Revenue
(in €M)
34
16.1
Video
3.3
H1 14
838.8
H1 15
892.1
4.5
Other Business services
7.3
Mobile telephony
13.3
Fixed-line
telephony
8.8
Broadband internet
Cable subscription revenue

Adjusted EBITDA of €481.4 million, up 5% yoy Excluding one-off benefits of €12.5 million and €7.6 million for Q1 2014 and Q2 2015, respectively, our Adjusted EBITDA growth would have been slightly higher
Adjusted EBITDA up 5% yoy to €481.4 million with H1 2015 and H1 2014 including favorable impacts of €7.6 million and €12.5 million, respectively, related to the resolution of certain operational contingencies;
Excluding these impacts, Adjusted EBITDA growth was driven by (i) accretive multiple-play growth, including the impact from the price adjustments, and (ii) our continued focus on controlling our overhead expenses, partly offset by higher costs related to content, interconnection and handset subsidies;
Q2 2015 Adjusted EBITDA of €246.6 million, +11% yoy, including the aforementioned benefit;
Anticipate “4-5%” Adjusted EBITDA growth for the full year versus “around 4%” initially.
Adjusted EBITDA
+10.8%
Q2
15
246.4
7.67
Q2
14
222.3
Adjusted EBITDA
Q2 15
246.4
54.9%
Q1 15
235.0
53.0%
Q4 14
212.6
48.8%
Q3 14
227.3
52.6%
Q2 14
222.3
52.7%
(in €M) (in €M)
35
See Notes page for additional disclosure
481.4
H1
15
+4.6%
7.67
H1
14
460.1
12.56
Accrued capital expenditures9
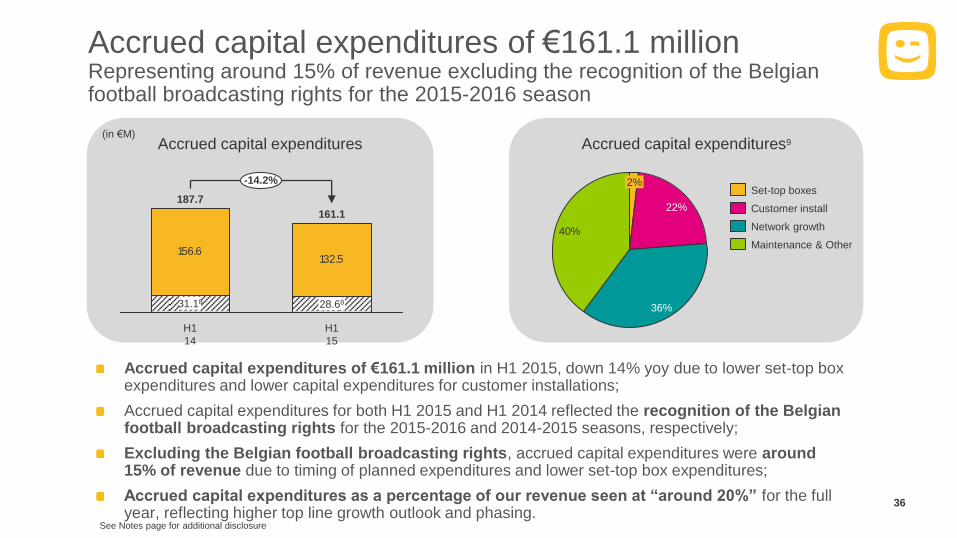
Accrued capital expenditures of €161.1 million Representing around 15% of revenue excluding the recognition of the Belgian football broadcasting rights for the 2015-2016 season
Accrued capital expenditures of €161.1 million in H1 2015, down 14% yoy due to lower set-top box expenditures and lower capital expenditures for customer installations;
Accrued capital expenditures for both H1 2015 and H1 2014 reflected the recognition of the Belgian football broadcasting rights for the 2015-2016 and 2014-2015 seasons, respectively;
Excluding the Belgian football broadcasting rights, accrued capital expenditures were around 15% of revenue due to timing of planned expenditures and lower set-top box expenditures;
Accrued capital expenditures as a percentage of our revenue seen at “around 20%” for the full year, reflecting higher top line growth outlook and phasing.
Accrued capital expenditures
(in €M)
36
156.6132.5
H1
15
161.1
H1
14
187.7
-14.2%
31.18 28.68 36%
22%
2%
40%
Customer install
Set-top boxes
Maintenance & Other
Network growth
See Notes page for additional disclosure

Free Cash Flow of €145.1 million, down 4% yoy Significantly higher cash taxes almost fully absorbed by solid Adjusted EBITDA growth, lower cash interest expenses and working capital improvements
In H1 2015, we generated €145.1 million of Free Cash Flow compared to €151.6 million in H1 2014;
The 4% decrease in our Free Cash Flow for H1 2015 was predominantly driven by €77.6 million higher cash taxes in Q1 2015;
This negative impact was, however, almost fully absorbed by the combined effect of (i) solid Adjusted EBITDA growth, (ii) an improvement in our working capital and (iii) substantially lower cash interest expenses.
Free Cash Flow
Free Cash Flow
-4.3%
Q1
Q2
2015
145.1
24.6
120.5
2014
151.6
27.6
124.0
(in €M) (in €M)
37
H1
15
Income
taxes
paid
77.6
Cash capital
expenditure
s
18.4
Working
capital
and
other
Cash
interest
expense
s
20.6
Adjusted
EBITDA1
0
13.7
H1
14
151.6
55.2
145.1
See Notes page for additional disclosure

Net leverage ratio of 3.4x at June 30, 2015 Sequential decrease driven by robust Consolidated Annualized EBITDA growth in the second quarter
At June 30, 2015, our net leverage ratio reached 3.4x as compared to 3.7x at March 31, 2015;
The sequential decrease in our net leverage ratio was primarily attributable to the robust growth in our Consolidated Annualized EBITDA in the second quarter, while Net Total Debt remained broadly stable quarter-on-quarter;
Our net leverage ratio at the end of June 2015 excluded the additional debt facilities related to the acquisition of BASE Company.
Net leverage ratio
Debt profile (June 30, 2015)
3.5
4.5
4.0
3.0
2.5
2.0
Q2
15
3.4x
Q2
14
Q2
13
Q2
12
Q2
11
38
32.2% Fixed-rate facilities
Floating-rate facilities
37.7% 30.1%
Undrawn facilities11
See Notes page for additional disclosure

Post-refinancing12
Pre-refinancing
Debt profile Increased average tenor to 8.3 years at attractive market conditions thanks to issuance of €530 million 4.875% Senior Secured Fixed Rate notes due 2027
See Notes page for additional disclosure
Undrawn facilities
Floating rate debt
Fixed rate debt
Revolving Credit Facility
€ M
illio
ns
2024
Facility V
250.0
2023
Facility AA
800.0
Facility Y
882.9
2022
Facility W
474.1
Facility U
450.0
2021
Facility P
400.0
Facility O
300.0
2020
RCF X
286.0
Facility M
500.0
2019 2018
RCF Z
200.0
2017 2016
RCF S
36.9
2015
RCF Z
RCF X
RCF S
Facility AA
Facility Y
Facility W
Facility U
Facility P
Facility O
Facility M
€ M
illio
ns
2027
Facility AB
530.0
2026 2025 2024
Facility V
250.0
2017 2016
RCF S
26.9
2015 2019
RCF X
381.0
2020
Facility O
300.0
Facility P
400.0
2021
Facility U
450.0
Facility W
474.1
2022
Facility Y
882.9
Facility AA
800.0
2023
RCF Z
200.0
2018
RCF Z
RCF S
Facility AB
RCF X
Facility AA
Facility Y
Facility W
Facility U
Facility P
Facility O
39
New €530 million 4.875% Senior Secured Fixed Rate Notes due 2027
Net proceeds of the Notes will be on lent to Telenet International
Finance S.à r.l. under Telenet’s existing Senior Credit Facility and
used to prepay Facility M thereunder and in turn to redeem the €500
million Senior Secured Fixed Rate Notes due November 2020

Full year 2015 outlook upgraded Improved revenue and Adjusted EBITDA growth outlook, together with relatively lower capital intensity, leading to higher Free Cash Flow growth for the full year
Combination of solid Adjusted EBITDA growth,
lower cash capital expenditures and an
improvement in our working capital will drive Free
Cash Flow growth, partly offset by significantly
higher cash taxes paid in 2015.
Having achieved 6% top line growth in H1 2015,
we expected growth in H2 to be driven by a
generally higher contribution from our fixed
connectivity business, a higher contribution from
our premium content and mobile businesses and
continued growth for our B2B activities.
Our FY 2015 outlook includes the €7.6 million
favorable impact of Q2 2015, costs related to the
acquisition and integration of BASE Company and
higher costs related to our proactive customer
visits.
Relative to H1 2015, when accrued capital
expenditures reached 15% of revenue10, we
anticipate higher investments in H2 2015 driven by
timing in planned network investments and
accelerated customer visits.
Revenue growth 4 – 5%
Adjusted EBITDA
growth Around 4%
Accrued
capital expenditures
(as % of revenue)
Around 21%9
Free Cash Flow €240.0 – 250.0
million13
As presented on
February 12, 2015
40
See Notes page for additional disclosure
5 – 6%
4 – 5%
Around 20%9
€250.0 – 260.0
million13
As presented on
July 30, 2015
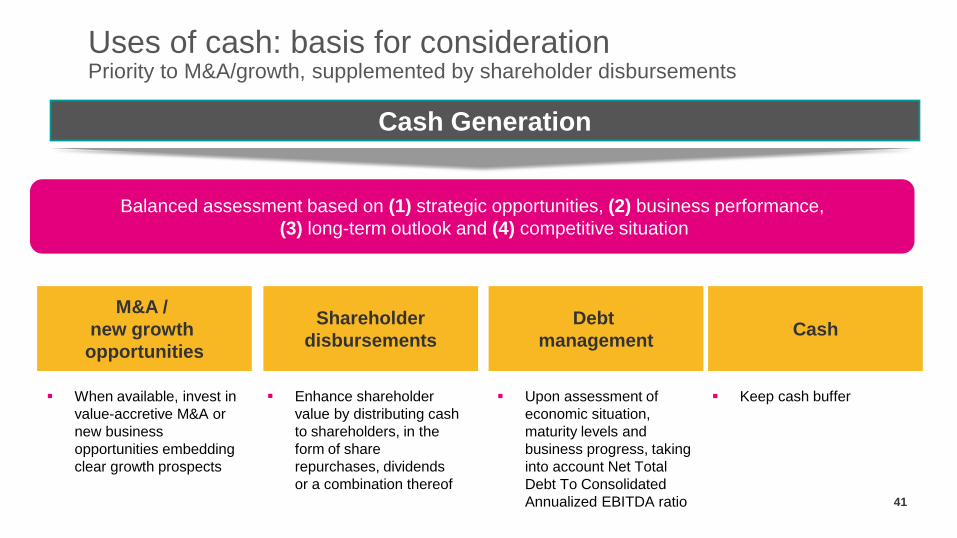
Cash Generation
M&A /
new growth
opportunities
Cash
Upon assessment of
economic situation,
maturity levels and
business progress, taking
into account Net Total
Debt To Consolidated
Annualized EBITDA ratio
Keep cash buffer
Debt
management
When available, invest in
value-accretive M&A or
new business
opportunities embedding
clear growth prospects
Shareholder
disbursements
Enhance shareholder
value by distributing cash
to shareholders, in the
form of share
repurchases, dividends
or a combination thereof 41
Balanced assessment based on (1) strategic opportunities, (2) business performance,
(3) long-term outlook and (4) competitive situation
Uses of cash: basis for consideration Priority to M&A/growth, supplemented by shareholder disbursements

Thank you!
Telenet
Liersesteenweg 4
2800 Mechelen, Belgium
Rob Goyens
VP Strategic Planning, Treasury
& Investor Relations
+32 (0)15 33 30 54
Thomas Deschepper
Investor Relations Analyst
+32 (0)15 36 66 45
thomas.deschepper@
staff.telenet.be

Acquisition BASE Company NV

BASE Company acquired for 5.0x Adjusted EBITDA3
Will provide stable long-term mobile access and secures our future as a leading integrated telecommunications provider
44
Control own destiny in large and
growing mobile business
Mobile4 is a large and growing part of Telenet’s business (11% of revenue, 15% revenue
growth in Q1 2015)
Reinforce and ensure continuity of Telenet’s mobile strategy
Achieve owner economics in
mobile
Replace usage-based MVNO with a stable network infrastructure model, providing owner
economics in mobile
Highly complementary
combination
Combining a leading fixed line network with a strong mobile network
Creates value through
significant synergy potential
Significant operating synergies by eliminating MVNO payments over time under agreement
with Mobistar, while honoring the current MVNO contract
Projected annual run-rate opex and capex-related synergies of approximately €150 million5
Total of approximately €240 million of one-off investments in BASE Company’s network and
integration costs
Builds on Telenet and Liberty
Global’s strong track record of
value creation
Builds on Telenet’s and Liberty Global’s successful track record in M&A including UPC
Belgium and Interkabel in Belgium, as well as Virgin Media, Unitymedia, KBW and Ziggo
among others
Optimises balance sheet
through efficient financing
structure
Financed through a combination of €1bn of new debt facilities and existing liquidity
1
2
3
4
5
6
See Notes page for additional disclosure

Mobile is a large and growing part of Telenet
…resulting in mobile comprising an increasing share of Telenet revenues2,3 Telenet has realised strong growth in mobile subscribers…
1
Source: Company filings
Please refer to page 18 for notes.
258275
341
522
625
675
713
751780
821
869895
Q12012
Q22012
Q32012
Q42012
Q12013
Q22013
Q32013
Q42013
Q12014
Q22014
Q32014
Q42014
# Active Mobile Subscribers (k)¹
€1,383m(93%)
€1,401m(85%)
€1,447m(85%)
€106m(7%)
€240m(15%)
€260m(15%)€1,489m
€1,641m€1,707m
2012 2013 2014
Fixed and Other Mobile
7.1%
56.5%
2.3%
CAGR2012-14
45

Belgian mobile market is recovering
Blended mobile ARPUs are past historical lows2
Source: Company filings
Please refer to page 18 for notes.
Mobile service revenue growth by operator Blended ARPU (€ / month)
1
Mobile service revenue growth stabilising1
Lowest Historical ARPU
(30)%
(15)%
0%
15%
30%
Q1
201
0
Q2
201
0
Q3
201
0
Q4
201
0
Q1
201
1
Q2
201
1
Q3
201
1
Q4
201
1
Q1
201
2
Q2
201
2
Q3
201
2
Q4
201
2
Q1
201
3
Q2
201
3
Q3
201
3
Q4 2
013
Q1 2
014
Q2 2
014
Q3 2
014
Q4
201
4
Proximus Mobistar BASE
10
15
20
25
30
35
Q1
201
2
Q2
201
2
Q3
201
2
Q4
201
2
Q1 2
013
Q2
201
3
Q3
201
3
Q4
201
3
Q1
201
4
Q2
201
4
Q3
201
4
Q4
201
4
Proximus Mobistar BASE
46

Achieve owner economics in mobile
Launched Light MVNO
Proposition
(2006)
Launched Full MVNO
Proposition
(2009)
First in rolling out
EAP in Belgium
(2014)
Network Ownership
through BASE
Company Acquisition
(2015)
Transaction allows Telenet to continue to meet changing
customer demands
Telenet gains owner economics in mobile
More control over future investment and product innovation
Long-term certainty
Reduced exposure to variable data costs
Complementary to Telenet single authentication WiFi strategy
Forecast worldwide mobile data traffic 2011-2018¹
2
Growth in
Data: +3.5x
Source: Gartner
Please refer to page 18 for notes.
0
20
40
60
80
100
120
140
160
180
200
2011 2012 2013 2014 2015 2016 2017 2018
Ex
ab
yte
s
(1m
Te
rab
yte
s)
47
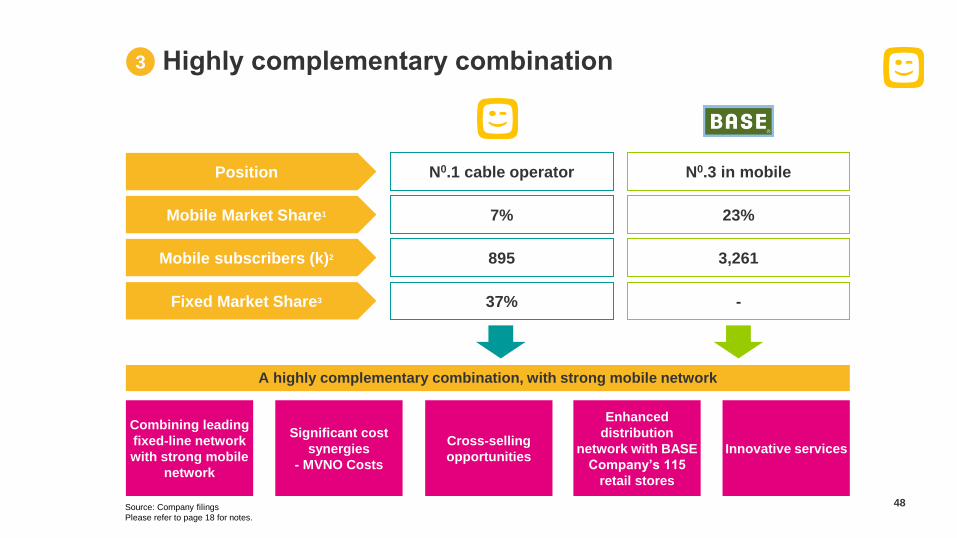
Highly complementary combination
Source: Company filings
Please refer to page 18 for notes.
A highly complementary combination, with strong mobile network
Combining leading
fixed-line network
with strong mobile
network
Significant cost
synergies
- MVNO Costs
Cross-selling
opportunities
Enhanced
distribution
network with BASE
Company’s 115
retail stores
Innovative services
N0.3 in mobile N0.1 cable operator
Fixed Market Share3
23% 7%
- 37%
Position
Mobile Market Share1
3,261 895 Mobile subscribers (k)2
3
48

Creates value through significant synergy potential
Key categories Run-rate (€m) Description
4
Opex and
Capex
Synergies
Migration of Mobile Traffic
Migration of Telenet MVNO from Mobistar to BASE
Company network while honoring the current
Mobistar contract Approximately
€145 million1 of
opex synergies
Approximately
€5 million of
capex
synergies
Network, IT and SG&A
Integration of core and backhaul
Integration of IT platform
Optimise shop footprint
Rationalise combined marketing spend
Rationalise overlapping activities
Total of approximately €240 million of one-off investment to prepare mobile network
for Telenet Traffic and create best in class integrated communications provider, and
integration costs, most of which will occur over the next few years
Source: Company data
Please refer to page 18 for notes.
Attractive EBITDA Multiple
4.2x
5.0x (a)
(b)
a) Purchase price multiple is based on the enterprise value of €1.325
billion and Telenet management’s estimate of BASE Company’s FY
2015 EBITDA of €165 million, as adjusted by Telenet to exclude BASE
Company’s discontinued operations and estimated reorganization costs
and as adjusted to include approximately €145 million of projected
annual run-rate opex synergies.
b) Same as (a) but this purchase price multiple adds €240 million of
projected one-off investments in BASE Company’s network and
integration costs to the enterprise value.
49

Builds on Telenet and Liberty Global’s strong track record of value creation
Strong track record of integration and of achieving synergy targets
Belgium
5
50

Optimises balance sheet through efficient financing structure
Telenet debt maturity profile – pre acquisition (€m)
Telenet intends to finance the
acquisition through a
combination of €1.0 billion of
new debt facilities and
existing liquidity
6
Telenet indicative debt maturity profile – post acquisition (€m)
Source: Company data
500 300 450 250
474 883 400
800
37 200
286
2016 2018 2020 2021 2022 2023 2024
Senior Secured Credit Facilities Term LoanSenior Secured Floating Rate Notes New Term LoanRCF
500 300 450 250
474 883 400
37 286
2016 2018 2020 2021 2022 2023 2024
Senior Secured Credit Facilities Term Loan Senior Secured Floating Rate Notes RCF
51
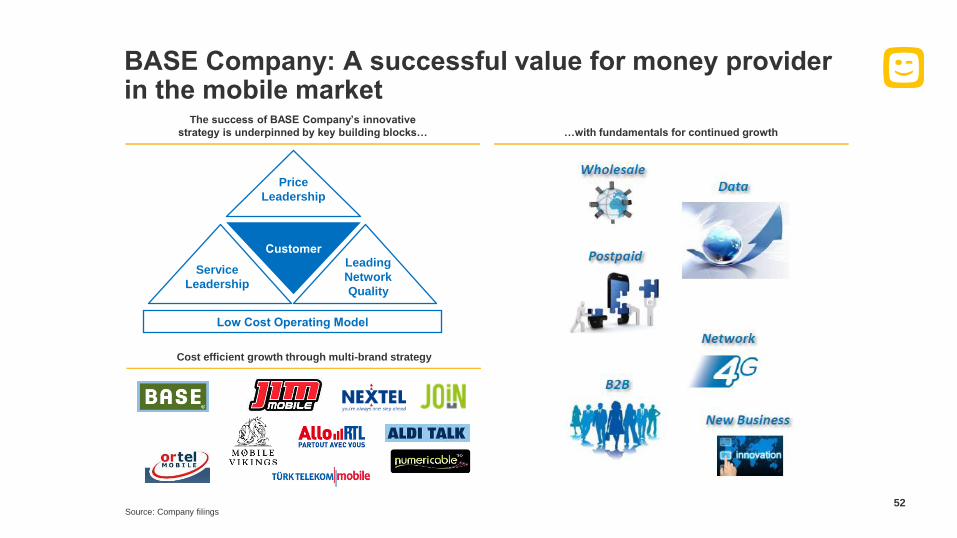
BASE Company: A successful value for money provider in the mobile market
The success of BASE Company’s innovative
strategy is underpinned by key building blocks… …with fundamentals for continued growth
Cost efficient growth through multi-brand strategy
Low Cost Operating Model
Customer
Price
Leadership
Leading
Network
Quality
Service
Leadership
Source: Company filings 52

Paired Spectrum (MHz)
BASE Company: Creating a leading mobile infrastructure in Belgium
Current performance in line with other operators Network investment plan
3G FTP Downlink Speed (in Mbps) as of Q1 2015¹
4G FTP Downlink Speed (in Mbps) as of Q1 2015¹
BASE Company has a high quality network with comparable
performance versus other operators
Telenet‘s plan is to accelerate the network rollout plans of
BASE Company and improve regional weaker spots
Accelerate realisation of nationwide 4G coverage and
improve 3G coverage in short term
Increase network capacity to support Telenet subscriber
migration
Source: Commsquare Feb 2015, company filings
Please refer to page 18 for notes.
BASE Company ready for data growth² Comparable spectrum holdings in key frequencies
4G population coverage outdoor
~36%
>80%
End-2013 End-2014
10.8 8.7 9.6
Proximus BASE Mobistar
21.5 18.3 18.9
Proximus BASE Mobistar
10.0
10.0
10.0
10.2
12.4
11.6
23.4
23.4
23.4
14.8
15.0
14.8
15.0
20.0
20.0
73.4
80.8
79.8
BASE
Proximus
Mobistar
800MHz 900MHz 1.8GHz 2.1GHz 2.6GHz
53

BASE Company has been successfully growing its service revenue share
54
Continuous growth in mobile service revenue market share over the last decade BASE Company’s innovating offerings
BASE Company:
— €690 million adjusted revenue¹ in FY2014
— €610 million mobile service revenue2 in FY2014
Source: Company filings
Please refer to page 18 for notes.
Introduction of wholesale
partnerships
Introduction of flat fee tariff
plans
Inclusion of data in all plans
Before legal obligation, contract
duration stopped
Leader in innovation, service
and network
Launch of B-Europe, the first
EU tariff plan
2002
2004
2010
2012
2013
2014
8% 16%
21%
28%
35%34%
64%
49% 45%
2002 2008 2014
BASE Mobistar Proximus
54

BASE Company: Encouraging trends
55
Following mobile market decline in 2013, the market is recovering. BASE Company has been gaining share..
…while successfully converting a large portion of its subscribers from pre-paid to post-paid
BASE Company Key Stats
3.3 million mobile customers as of 2014
1.0 million post-paid customers, up 7% YoY as of 2014
Post-paid ARPU is 3x pre-paid ARPU
Post-paid churn at 28%
Source: Company filings
Please refer to page 18 for notes.
1 1
Evolution of post-paid subscribers
20% 31%
80% 69%
2011 2014
Post-paid Pre-paid
100% 100%
(5)%
(11)%(13)%
(15)%
(6)%(4)% (4)% (4)%
(10)%(11)%
(14)% (16)%
(9)%(7)%
(3)% (2)%
Q12013
Q22013
Q32013
Q42013
Q12014
Q22014
Q32014
Q42014
BASE (Mobile) Total Market (as reported)
Growth in mobile service revenue
19.0%21.1%
2011A 2014A
BASE Mobile Service Revenue Market Share
55
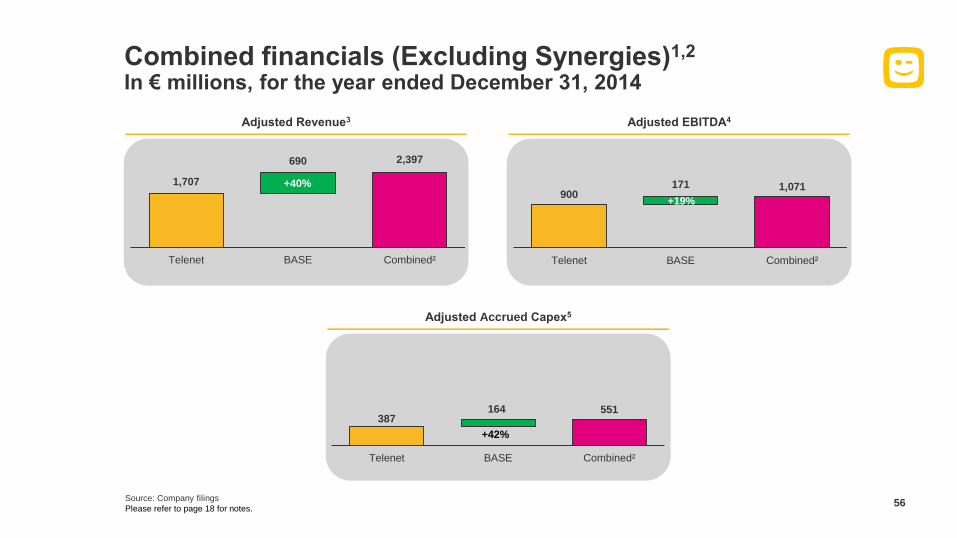
Combined financials (Excluding Synergies)1,2 In € millions, for the year ended December 31, 2014
56
Adjusted Revenue3 Adjusted EBITDA4
Adjusted Accrued Capex5
Source: Company filings
Please refer to page 18 for notes.
1,707
690 2,397
Telenet BASE Combined²
+40%900
171 1,071
Telenet BASE Combined²
+19%
387 164 551
Telenet BASE Combined²
+42%
56

Sources & Uses and Pro forma capitalization Financed through existing liquidity complemented with new debt facilities up to €1.0 billion – pro forma leverage end-2014 of 4.45x
Sources and Uses (€ million)
Pro Forma Capitalization as per December 31, 2014 (€ million)
Please refer to page 44 for notes
Sources Uses
New Senior Secured Term Loan 800 BASE Purchase Consideration 1,325
New Senior Secured RCF 200 Fees and Expenses 42
Draw on Existing RCF 217
Cash on Balance Sheet 150
Total Sources 1,367 Total Uses 1,367
Adjusted for the
Telenet Transaction Pro FormaCash (189) 150 (39)
Existing Senior Secured Credit Facilities 1,357 217 1,574
New Senior Secured RCF 200 200
New Senior Secured Term Loan 800 800
Senior Secured Notes 1,900 1,900
Licenses and Other Adjustments 160 160
Total Debt 3,417 1,217 4,633
Net Total Debt 3,228 1,367 4,594
Consolidated Annualized EBITDA (ex. Synergies) 869 163 1,032
Consolidated Annualized EBITDA (inc. Synergies) 869 308 1,177
Net Leverage Ratio (ex. Synergies)1
3.71 x 4.45 x
Net Leverage Ratio (inc. Synergies)1 3.90 x
57

Net leverage ratio – pre BASE acquisition
Debt maturity profile – pre BASE acquisition
Acquisition of BASE Company NV Financed through existing liquidity complemented with new debt facilities up to €1.0 billion – pro forma leverage end-2014 of 4.45x
(in €M) 4.5
4.0
3.5
3.0
2.5
2.0
Q4
14
3.7x
Q4
13
Q4
12
Q4
11
Indicative debt maturity profile – post BASE
acquisition
(in €M)
250
155
20037
2024 2023
883
800
2022
450
474
2021
300
400
2020
500
131
2018 2016 2014
Net leverage ratio – post BASE acquisition9
4,5x
2,0
2,5
3,0
3,5
4,0
4,5
Q4
14
3.9x incl synergies
Q4
13
Q4
12
Q4
11
250
37
883
2024
474
2021 2023 2022
450
2016 2014
300
400
2020
500
286
2018
Senior Secured Notes
Senior Secured Floating Rate Notes
Undrawn RCF
Drawn RCF
Term Loan
New Term Loan
See Notes page for additional disclosure
58

Please refer to page 44 for notes
Telenet Group Holding NV
Telenet NV (Senior Credit Facility Co-Borrower
and Co-Guarantor)¹
Other Operating
Subsidiaries2
Telenet International
Finance S.à r.l. (Senior Credit Facility
Co-Borrower
and Co-Guarantor)¹
New Senior Credit
Facilities
BASE Company N.V.
Simplified Pro Forma Corporate Structure
59
Important reporting changes
Revenue by nature: In Q1 2015, we changed the way we present the disclosure of our revenue in order to further align with our controlling shareholder and
to provide a greater level of transparency on the underlying evolution of (i) our traditional cable subscription revenue, (ii) the revenue generated by our mobile
telephony customers, (iii) our B2B revenue and (iv) our other revenue, which includes amongst others the revenue generated from the sale of set-top boxes
and handsets, interconnection revenue and carriage fees. We have also applied these changes retroactively to the prior year quarters.
RGU adjustment: In Q1 2015, we changed the way we calculate certain operational key performance indicators to further align with our controlling
shareholder. From January 1, 2015, RGUs are counted on a unique premises basis such that a given premises does not count as more than one RGU for any
given service. On the other hand, if an individual receives one of our services in two premises (for instance a primary and a secondary home) that individual
will count as two RGUs for that service. This definition adjustment also impacted certain other derived operational parameters, including amongst others
multiple-play penetration levels, the number of services per unique customer and the underlying ARPU generated by such unique customers. During the
quarter, we also modified certain video subscriber definitions to better align these definitions with the underlying services received by our customers and have
replaced our “digital cable TV” and “analog cable TV” subscriber definitions with “enhanced video” and “basic video” respectively. We have also applied these
changes retroactively to the prior year quarters.
Free Cash Flow: In Q1 2015, we changed our Free Cash Flow definition to further align with our controlling shareholder. From January 1, 2015, Free Cash
Flow is defined as net cash provided by the Company’s continuing operations, plus cash payments for third-party costs directly associated with successful and
unsuccessful acquisitions and dispositions, less (i) purchases of property and equipment and purchases of intangibles of our continuing operations, (ii)
principal payments on capital-related vendor financing obligations, (iii) principal payments on capital leases (exclusive of network-related leases that were
assumed in acquisitions), and (iv) principal payments on post acquisition additions to network leases, each as reported in the Company’s consolidated
statement of cash flows.
Reclassification of certain device-related payments: In Q4 2014, we changed the classification of certain device-related payments from purchases of
property and equipment in the investing section of our consolidated cash flow statement to working capital changes and other non-cash items in the operating
section of our consolidated cash flow statement. We have applied this classification retroactively to January 1, 2014. Accordingly, €26.7 million of device-
related payments during the first six months of 2014 (Q2 2014: €8.3 million) were reclassified to working capital changes and other non-cash items in the
operating section of our consolidated cash flow statement. The reclassification of these cash flows did not impact our net results or our Free Cash Flow.For
additional information, we refer to our Investor & Analyst Toolkit, which can be downloaded from our Investor Relations website.
60
Definitions
a) EBITDA is defined as profit before net finance expense, income taxes, depreciation, amortization and impairment. Adjusted EBITDA is defined as
EBITDA before stock-based compensation and restructuring charges, and before operating charges or credits related to successful or unsuccessful
acquisitions or divestitures. Operating charges or credits related to acquisitions or divestitures include (i) gains and losses on the disposition of long-lived
assets and (ii) due diligence, legal, advisory and other third-party costs directly related to the Company’s efforts to acquire or divest controlling interests
in businesses. Adjusted EBITDA is an additional measure used by management to demonstrate the Company’s underlying performance and should not
replace the measures in accordance with EU IFRS as an indicator of the Company’s performance, but rather should be used in conjunction with the most
directly comparable EU IFRS measure.
b) Accrued capital expenditures are defined as additions to property, equipment and intangible assets, including additions from capital leases and other
financing arrangements, as reported in the Company’s consolidated statement of financial position on an accrued basis.
c) Free Cash Flow is defined as net cash provided by the operating activities of Telenet’s continuing operations less (i) purchases of property and
equipment and purchases of intangibles of its continuing operations, (ii) principal payments on capital-related vendor financing obligations, (iii) principal
payments on capital leases (exclusive of network-related leases that were assumed in acquisitions), and (iv) principal payments on post acquisition
additions to network leases, each as reported in the Company’s consolidated statement of cash flows. Free Cash Flow is an additional measure used by
management to demonstrate the Company’s ability to service debt and fund new investment opportunities and should not replace the measures in
accordance with EU IFRS as an indicator of the Company’s performance, but rather should be used in conjunction with the most directly comparable EU
IFRS measure.
d) Basic Video Subscriber is a home, residential multiple dwelling unit or commercial unit that receives our video service over the Combined Network either
via an analog video signal or via a digital video signal without subscribing to any recurring monthly service that requires the use of encryption-enabling
technology. Encryption-enabling technology includes smart cards, or other integrated or virtual technologies that we use to provide our enhanced service
offerings. With the exception of RGUs that we count on an equivalent billing unit (“EBU”) basis, we count Revenue Generating Unites (“RGUs”) on a
unique premises basis. In other words, a subscriber with multiple outlets in one premise is counted as one RGU and a subscriber with two homes and a
subscription to our video service at each home is counted as two RGUs.
e) Enhanced Video Subscriber is a home, residential multiple dwelling unit or commercial unit that receives our video service over the Combined Network
via a digital video signal while subscribing to any recurring monthly service that requires the use of encryption-enabling technology. Enhanced Video
Subscribers that are not counted on an EBU basis are counted on a unique premises basis. For example, a subscriber with one or more set-top boxes
that receives our video service in one premise is generally counted as just one subscriber. An Enhanced Video Subscriber is not counted as a Basic
Video Subscriber. As we migrate customers from basic to enhanced video services, we report a decrease in our Basic Video Subscribers equal to the
increase in our Enhanced Video Subscribers. 61
Definitions
f) Internet Subscriber is a home, residential multiple dwelling unit or commercial unit that receives internet services over the Combined Network.
g) Fixed-line telephony Subscriber is a home, residential multiple dwelling unit or commercial unit that receives fixed-line voice services over the Combined
Network. Fixed-line telephony Subscribers exclude mobile telephony subscribers.
h) Our mobile subscriber count represents the number of active subscriber identification module (“SIM”) cards in service rather than services provided. For
example, if a mobile subscriber has both a data and voice plan on a smartphone this would equate to one mobile subscriber. Alternatively, a subscriber
who has a voice and data plan for a mobile handset and a data plan for a laptop (via a dongle) would be counted as two mobile subscribers. Customers
who do not pay a recurring monthly fee are excluded from our mobile telephony subscriber counts after a 90-day inactivity period.
i) Customer Relationships are the number of customers who receive at least one of our video, internet or telephony services that we count as RGUs,
without regard to which or to how many services they subscribe. To the extent that RGU counts include EBU adjustments, we reflect corresponding
adjustments to our Customer Relationship counts. Customer Relationships generally are counted on a unique premises basis. Accordingly, if an
individual receives our services in two premises (e.g., a primary home and a vacation home), that individual generally will count as two Customer
Relationships. We exclude mobile-only customers from Customer Relationships.
j) Average monthly revenue (“ARPU”) per RGU and ARPU per customer relationship are calculated as follows: average total monthly recurring revenue
(including revenue earned from carriage fees and set-top box rentals and excluding interconnection revenue, installation fees, B2B revenue, mobile
telephony revenue and set-top box sales) for the indicated period, divided by the average of the opening and closing RGU base or customer
relationships, as applicable, for the period.
k) Homes Passed are homes, residential multiple dwelling units or commercial units that can be connected to our networks without materially extending the
distribution plant. Our Homes Passed counts are based on census data that can change based on either revisions to the data or from new census
results.
l) RGU is separately a Basic Video Subscriber, Enhanced Video Subscriber, Internet Subscriber or Telephony Subscriber. A home, residential multiple
dwelling unit, or commercial unit may contain one or more RGUs. For example, if a residential customer to our enhanced video service, fixed-line
telephony service and broadband internet service, the customer would constitute three RGUs. Total RGUs is the sum of Basic Video, Enhanced Video,
Internet and Fixed-line Telephony Subscribers. RGUs generally are counted on a unique premises basis such that a given premises does not count as
more than one RGU for any given service. On the other hand, if an individual receives one of our services in two premises (e.g. a primary home and a
vacation home), that individual will count as two RGUs for that service. Each bundled cable, internet or fixed-line telephony service is counted as a
separate RGU regardless of the nature of any bundling discount or promotion. Non-paying subscribers are counted as subscribers during their free
promotional service period. Some of these subscribers may choose to disconnect after their free service period. Services offered without charge on a
long-term basis (e.g., VIP subscribers, free service to employees) generally are not counted as RGUs. We do not include subscriptions to mobile services
in our externally reported RGU counts. 62
Definitions
m) Customer Churn represents the rate at which customers relinquish their subscriptions. The annual rolling average basis is calculated by dividing the
number of disconnects during the preceding 12 months by the average number of customer relationships. For the purpose of computing churn, a
disconnect is deemed to have occurred if the customer no longer receives any level of service from us and is required to return our equipment. A partial
product downgrade, typically used to encourage customers to pay an outstanding bill and avoid complete service disconnection is not considered to be
disconnected for purposes of our churn calculations. Customers who move within our cable footprint and upgrades and downgrades between services
are also excluded from the disconnect figures used in the churn calculation.
n) Net leverage ratio is calculated as per the 2010 Amended Senior Credit Facility definition, using net total debt, excluding (a) subordinated shareholder
loans, (b) capitalized elements of indebtedness under the Clientele and Annuity Fees, (c) any finance leases entered into on or prior to August 1, 2007,
and (d) any indebtedness incurred under the network lease entered into with the pure intermunicipalities up to a maximum aggregate amount of €195.0
million, divided by last two quarters’ Consolidated Annualized EBITDA.
63
Notes
1) Average monthly revenue (ARPU) per revenue generating unit (RGU) and ARPU per customer relationship are calculated as follows: average total monthly
recurring revenue (including revenue earned from carriage fees and set-top box rentals and excluding interconnection revenue, installation fees, mobile telephony
revenue and set-top box sales) for the indicated period, divided by the average of the opening and closing RGU base or customer relationships, as applicable, for
the period.
2) In Q2 2015, 25,100 and 24,000 residential broadband internet and residential fixed-line telephony subscribers, respectively, were reclassed to business broadband
internet and business fixed-line telephony subscribers.
3) Our net organic loss rate excludes migrations to our enhanced video service and represents customers churning to competitors’ platforms, such as other digital
television, OTT and satellite providers, or customers terminating their television service or having moved out of our service footprint.
4) Digitalization rate equals the number of enhanced video subscribers at the end of a given period over the total number of video subscribers at the end of a given
period.
5) Including 21% VAT.
6) Total operating expenses in Q2 2015 included a €7.6 million favorable impact from the resolution of a contingency associated with universal service obligations.
7) Total operating expenses in Q1 2014 included a €12.5 million nonrecurring benefit related to the settlement of certain operational contingencies.
8) Accrued capital expenditures for both H1 2015 and H1 2015 included the recognition of the Belgian football broadcasting rights (“Jupiler Pro League”) for the 2014-
2015 (€31.1 million) and 2015-2016 (€28.6 million) seasons. Under EU IFRS, these non-exclusive broadcasting rights have been capitalized as intangible assets
and will be amortized on a pro‐rata basis as the season progresses..
9) Excluding the impact from the recognition of the Belgian football broadcasting rights.
10) Excluding the €7.6 million favorable impact from the resolution of a contingency associated with universal service obligations in Q2 2015.
11) Undrawn facilities as per June 30, 2015 included revolving facilities S, X and Z and Term Loan AA. All these undrawn debt facilities are floating-rate debt facilities.
12) Post-refinancing refers to issuance of €530 million 4.875% Senior Secured Fixed Rate notes due 2027 and the redemption of the €500 million 6,375% Senior
Secured Fixed Rate Notes due 2020 and the upsizing of our Revolving Facilities by a net €85 million.
13) Assuming the tax payment on our 2014 tax return will not occur until early 2016 and excluding additional cash interest expenses incurred for the new debt facilities
related to the acquisition of BASE Company NV.

Notes
65
Page Associated Note
45
1. Based on FY 2015 EBITDA, as per Telenet management’s assumptions including estimated annual run-rate savings on FY 2017 MVNO-related expenses and other estimated annual run-rate opex savings to be achieved by FY 2019. In
addition, for purposes of computing the acquisition multiples, the enterprise value was increased by approximately €240 million of projected one-off investments in BASE Company’s network and integration costs. The estimated BASE
Company 2015E EBITDA as adjusted by Telenet (“Adjusted EBITDA”) of €165 million, under EU-IFRS, is based on Telenet management’s assumptions and is adjusted to exclude BASE Company’s discontinued operations and reorganisation
costs.
2. Mobile revenue includes mobile interconnect revenue, but excludes standalone mobile handset sales.
3. Based on Telenet management’s assumptions including estimated annual run-rate savings on FY 2017 MVNO-related expenses, other estimated annual run-rate opex savings to be achieved by FY 2019 before integration costs and
approximately €5 million of estimated annual run-rate capex synergies.
46
1. Mobile telephony subscriber count includes customers who subscribe to data-only mobile plans.
2. Mobile revenue includes mobile interconnect revenue, but excludes standalone mobile handset sales. Fixed and other revenue includes basic cable television, premium cable television, distributors / other, standalone mobile handset sales,
residential broadband internet, fixed residential telephony and business services.
3. Part of the bundle discount on mobile products was allocated to fixed, reducing fixed revenues.
47
1. Proximus: consists of Enterprise and Consumer revenue. Mobistar: consists of mobile service revenue and does not include Mobistar/MES Fix/Data and Orange Communications Luxembourg revenue. BASE Company: consists of B2C, B2B,
wholesale and other branded resellers’ revenue.
2. Proximus ARPU based on Consumer ARPU. Mobistar ARPU based on blended post-paid and pre-paid ARPU. Quarterly ARPU calculation mode for Mobistar switched from a 12 month rolling average to a quarterly basis from 2013 onwards.
BASE Company ARPU based on blended B2C, B2B, wholesale and other branded resellers ARPU. BASE Company ARPU includes Ortel wholesale clean-up of 108k inactive SIMs in Q2 2013 and pre-paid net adds of (58)k adjusted for
technical correction in Q2 2014.
48 1. Based on Gartner, Inc., Forecast: Mobile Data Traffic, Worldwide, 2011-2018, by Jessica Ekholm, 12-Jan-2015.
49
1. Group subscriber market shares as of Q4 2014.
2. Based on companies’ Q4 2014 results. The reported BASE Company mobile subscribers of 3.3 million mobile subscribers consist of approximately 2.2 million subscribers under prepaid arrangements and approximately 1.0 million subscribers
under postpaid arrangements. Mobile subscribers that are served through third-party MVNO wholesale relationships are included in the mobile subscriber count. The prepaid subscribers reported by BASE Company include subscribers that
have been inactive for 12 months or less. The presentation of subscribers under BASE Company’s subscriber counting policies may differ from Telenet’s and Liberty Global’s treatment, including the presentation of subscribers under MVNO
wholesale arrangements and inactive prepaid subscribers.
3. Fixed revenue marker share based on Companies’ Q4 2014 results.
50 1. Based on Telenet management’s assumptions including estimated annual run-rate savings on FY 2017 MVNO-related expenses and other estimated annual run-rate opex savings to be achieved by FY 2019
54 1. Based on Commsquare Feb 2015 data for areas driven in Flanders.
2. Based on company filings.
55 1. 2014 Adjusted Revenue for BASE Company is the 2014 reported Revenue of €711million, under EU-IFRS, has been adjusted to exclude discontinued operations of €21 million.
2. 2014 reported mobile service Revenue for BASE Company.
56 1. Total market comprised of aggregate mobile service revenue of BASE, Mobistar and Proximus.
57
1. Telenet financial information has been derived from quarterly results releases previously published by Telenet for the 12 months ended 31 December 2014. BASE Company financial information has been derived from quarterly results releases
previously published by Koninklijke KPN N.V. under KPN’s accounting and reporting policies for the 12 months ended 31 December 2014 including certain adjustments. The financial information of Telenet and BASE Company was prepared
under International Financial Reporting Standards, as adopted by the European Union (“EU-IFRS”).
2. The combined Telenet/BASE Company amounts are not necessarily indicative of the amounts that would have occurred if the proposed Telenet/BASE Company transaction had occurred on the date assumed for the purpose of calculating the
combined results or the revenue or Adjusted EBITDA that might occur in the future.
3. 2014 adjusted Revenue for BASE Company is the 2014 reported Revenue of €711million, under EU-IFRS, has been adjusted to exclude discontinued operations of €21 million.
4. 2014 Adjusted EBITDA for BASE Company is the 2014 reported EBITDA of €149 million, adjusted for BASE Company’s discontinued operations and reorganisation costs of €22 million.
5. 2014 adjusted accrued capex for BASE Company is the 2014 reported Capex of €173 million, adjusted for BASE Company’s discontinued operations of €11million and for RTU license fees payable to BIPT of €(3) million.


