36
Excellence in Energy Management Dahanu Thermal Power Station – Reliance Infrastructure LTD. 2 nd September 2010 Company & Plant Profile

Excellence in Energy ManagementDahanu Thermal Power Station – Reliance Infrastructure LTD.
2nd September 2010
Company & Plant Profile

DTPS Milestones – “Journey towards Excellence”

Plant Load Factor102.33101.35 100.99101.53
101.79
98.70
2004-05 2005-06 2006-07 2007-08 2008-09 2009-10
Average PLF for last 6 years = 101.12% (Above 100%)
Sustainable Plant Performance
Better
Availabilty
97.18
96.8894.71
96.79 96.7 96.31
2004-05 2005-06 2006-07 2007-08 2008-09 2009-10
Average Availability for last 6 years = 96.43%
Sustainable Plant Performance
Better

Heat Rate
22882286
2261 2278 2279 2300
2004-05 2005-06 2006-07 2007-08 2008-09 2009-10
Average Heat Rate for last 6 years = 2282 Kcal/kwh
Better
Sustainable Plant Performance
Auxillary Power Consumption (%)
7.6
7.53 7.59 7.64 7.67 7.71
2004-05 2005-06 2006-07 2007-08 2008-09 2009-10
Average Aux Power Cons. for last 6 years = 7.62 %
Better
Sustainable Plant Performance

Benchmarking: (Top five Plants)( Source CEA website )Benchmarking: 2009-10
Plant Name PLF (%) AVF (%) LoadingFactor (%)
Heat Rate(Kcal/kwh)
Sp. Oil(ml/KWH)
DTPS 102.33 97.18 105.30 2288 0.14Korba 97.61 95.46 102.25 2375 0.09
Unchahar 97.33 94.07 103.46 2384 0.18Simhadri 97.27 94.38 103.06 2349 0.22
Dadari 96.64 94.33 102.44 2386 0.34
Benchmarking: 2008-09
Plant Name PLF (%) AVF (%) LoadingFactor (%)
Heat Rate(Kcal/kwh)
Sp. Oil(ml/KWH)
DTPS 100.99 96.31 104.86 2300 0.13Simhadri 97.41 94.54 103.04 2351 0.10
Dadari 99.36 96.35 103.12 2389 0.14Ramagundam 94.45 93.52 100.99 2372 0.16Vindhyachal 93.15 92.18 101.05 2376 0.20
Energy Saving Projects
Energy Saving ProjectSavings
(Rs. Lakhs)
Investments(Rs. Lakhs)
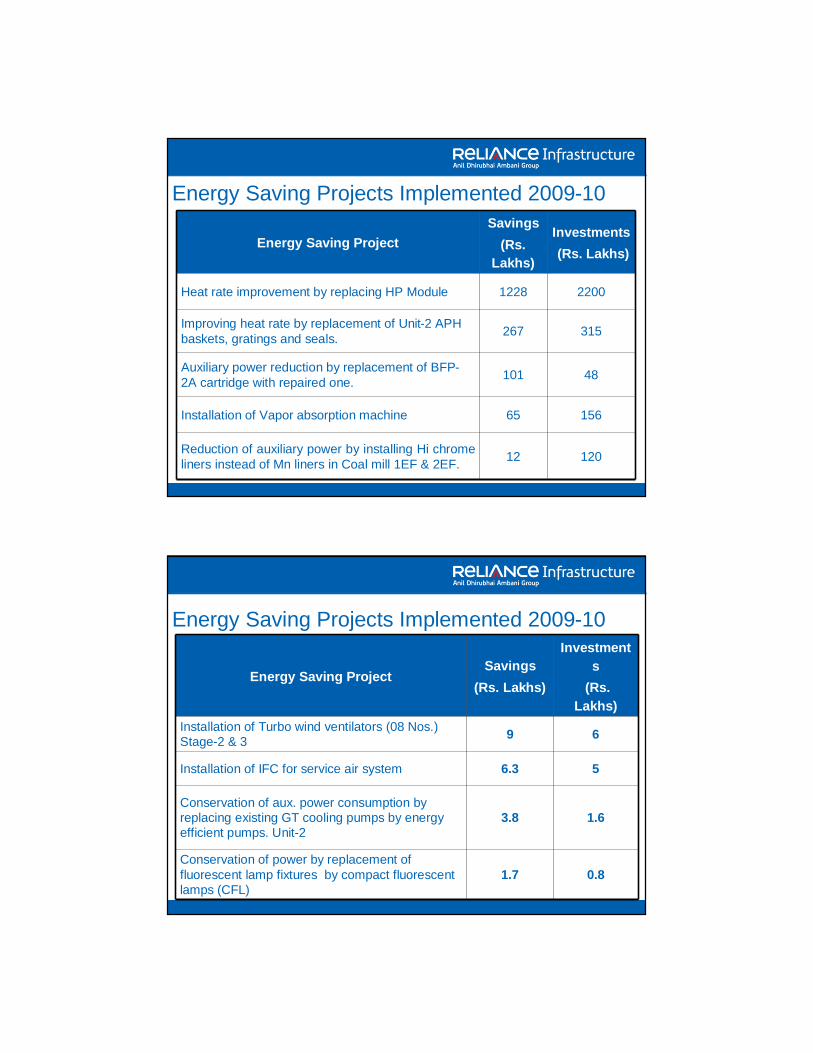
Heat rate improvement by replacing HP Module 1228 2200
Improving heat rate by replacement of Unit-2 APH baskets, gratings and seals. 267 315
Auxiliary power reduction by replacement of BFP-2A cartridge with repaired one. 101 48
Installation of Vapor absorption machine 65 156
Reduction of auxiliary power by installing Hi chrome liners instead of Mn liners in Coal mill 1EF & 2EF. 12 120
Energy Saving Projects Implemented 2009-10
Energy Saving ProjectSavings
(Rs. Lakhs)
Investments
(Rs. Lakhs)
Installation of Turbo wind ventilators (08 Nos.) Stage-2 & 3 9 6
Installation of IFC for service air system 6.3 5
Conservation of aux. power consumption by replacing existing GT cooling pumps by energy efficient pumps. Unit-2
3.8 1.6
Conservation of power by replacement of fluorescent lamp fixtures by compact fluorescent lamps (CFL)
1.7 0.8
Energy Saving Projects Implemented 2009-10

Energy Saving ProjectSavings
(Rs. Lakhs)Investments(Rs. Lakhs)
APH basket replacement in Unit-1 368.00 220.00
BFP 1A Cartridge replacement 146.27 100.00
CEP VFD Installed in Unit-1 25.20 70.00
VFD for colony drinking water Pump 1.26 4
Reduction in Debris Filter Flushing Pump Operation. 1.871.87 NilNil
DTPS TG Roof Wind Ventilator Installation –Phase-1
2.21 1.49
Installation of energy efficient pump for Unit 1 Generator Transformer oil cooling system
1.47 0.17
Energy Saving Projects Implemented 2008-2009
Energy Saving ProjectSavings
(Rs. Million)
Investments(Rs. Million)
Unit Startup and Shutdown process 16 NIL
Running of double crusher with one unit drive 0.1 0.35Replacement of boiler feed cartridge 2.56 2.0
Provision of water refractory cooling header from service water header result in reduction in running hrs of sea water pump.
0.057 0.2
VFD for condensate extraction pump. Unit-2 4.52 6.00
Provision of make up line for HP/ LP sump from hydrant pump 0.06 0.15
Energy Saving Projects Implemented 2007-2008
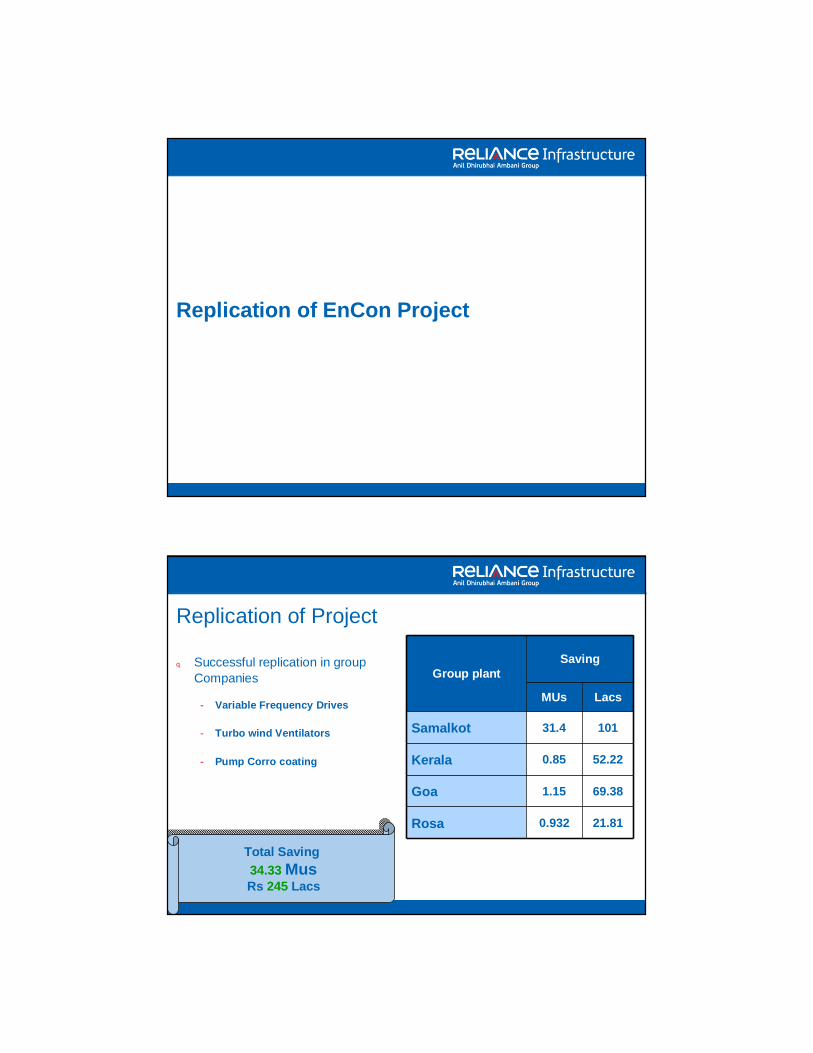
Replication of EnCon Project
Replication of Project
q Successful replication in group Companies
- Variable Frequency Drives
- Turbo wind Ventilators
- Pump Corro coating
Group plantSaving
MUs Lacs
Samalkot 31.4 101
Kerala 0.85 52.22
Goa 1.15 69.38
Rosa 0.932 21.81
Total Saving34.33 MusRs 245 Lacs

Use of Renewable Energy Sources
Use of Renewable Energy Sources
1056 Watts (Total 48 nos)
Total 1100 LPD
Total 10 nos.
Hybrid Wind VentilatorSolar Water Heater
Solar street lighting

Employees Involvement ,Team Work
Energy Management Cell“Awareness drive“
q Training for all employees ü By Internal facultyü By External Faculty
q Celebration of Energy Conservation weekü Energy conservation walk involving all
employees ü Create awareness among local school children
about energy conservation through BEE Film show & competition
ü Display of energy conservation posters
Employees Involvement & Team Work

Employees Involvement -3L Programme with BEE
q Program conducted on 13 and 14 May 2010.
q Total 137 participants were presented from, NTPC, Tata Power, Aditya Birlagroup, Godrej Boyce LTD, etc.
q Site Visit was also arranged for above participants for actual running and performance of energy saving projects established at DTPS
q Mr. P. S. Jalkote from DTPS have attended the training program arrange by JICA through MOP in JAPAN.
Employees Involvement & Team Work
Site Visit
Participants
Class Room TrainingParticipants
Hands On Experience
Hands on experience on energy Auditing for Group companies
Employees Involvement & Team Work

Monitoring, Reporting & Implementation Methodology
Energy Management Cell

Energy Audit Team As per CEA guidelinesDahanu TPS, Reliance Infrastructure Ltd., Reliance Energy
Internal Energy Auditing Team
Sr. Area to
Be Audited
Audit Team AuditFrequency
AuditSchedule Equipments Required
1 BoilerU1
1. V. A. Dali-Asst EM2. A. Shukla-Opn3. Punnet Hate- Opn4. Ravi Patil O&E5. Hemant Bari- MTP6. Pramaod Rege - Ele
Twice in year
Jul-09
• Power analyzer• Temperature Indicator
&Probe• Sling/ digital hygrometer• Anemometer• Digital manometer• Infrared Pyrometer • Stream trap tester/ ultra
sonic leak detector.• Flue gas analyzer/ Orsat
apparatus• Pressure Gauges• Appropriate probe for
measurement of Pressure Head & Velocity Head
1. A. D. Patil -Asst EM2. N. Pamale Feb-10
2 BoilerU2
1. V. A. Dali- Asst EM2. S. Mestry - EA3. Paresh Pahari -Opn4. Hemant Bari - MTP5. Bhupesh Raut -O&E6. Pramod Rege - Ele
Twice in year
Jul-09
1. A. D. Patil -Asst EM2. 2. R. Sawant MECH Feb-10

Energy Audit Report
Review Of Daily Energy Deviation of HT Auxiliaries
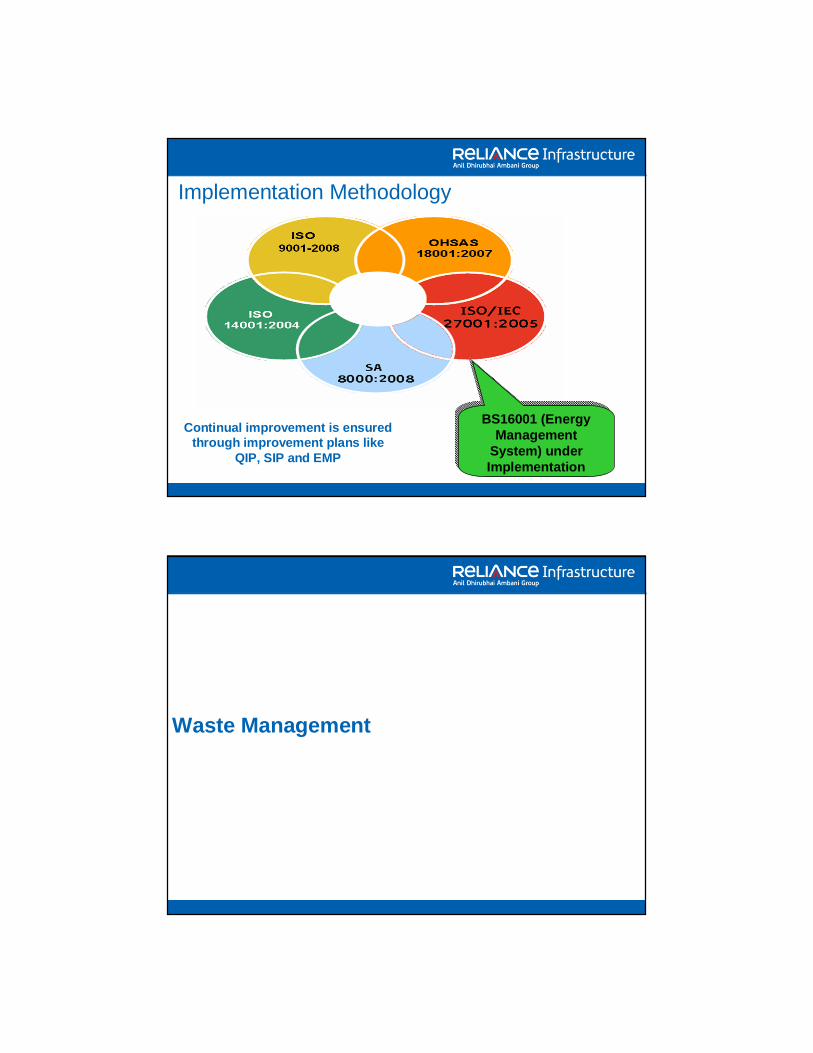
Implementation Methodology
Continual improvement is ensured through improvement plans like
QIP, SIP and EMP
BS16001 (Energy Management
System) under Implementation
Waste Management

73.470646152
251915
12953
10097
9083
76
696255
4841
342720
13119 9 -
2 0 000 0- 0 1 0 1- 0 2 02 - 0 3 03 - 0 4 0 4 -0 5 0 5- 0 6 0 6 - 07 0 7- 0 8 0 8 - 09 0 9 -10 10 -11
( Upt oJuly10 )
2 0 11-12
20 12 -13
13 -14 14 - 15 15- 16
ACTUAL (%) PLANNED (%)
Achieved Ash utilization Vs Planned ash utilization.
Presently Ash Utilization at DTPS is about 73.4% of the total Ash generated.
Water Recycled & Harvested (M3)
1532017418
2767 35118280
20934
2007-08 2008-09 2009-10
Recycled (M3) Harvested (M3)
MOT Oil Recycled (Liters)
2130
70208180
7480
2006-07 2007-08 2008-09 2009-10
Paper Recycled (Tones)
3.89 4.02
6.71
2007-08 2008-09 2009-10
Waste generated is monitored and disposed as per approved SOPs

Reduction Specific Energy Consumption
F. Year
Annual Energy consumptionGenerat
ion
(Mus)
Specific Energy Consumption
Redn. in Specific Energy consn. Over
previous year **
Electrical ThermalElectrical Energy
(%)
Thermal Energy
kcal/kwh)
Electrical Thermal
KWH * Million
RsMillion
Type of
fuelTons/KL Rs
Million
2007–08 370.031 636.45
Coal
Oil
2445668
567.8
5755.5
15.83
4459 7.67 ** 2279 - 0.39 -0.065
2008–09 398.69 1074.6
3
Coal
Oil
2555868
593.2
7042.3
21.98
4423 7.71 ** 2300 -0.39 -0.921
2009–10 340.682 841.48
Coal
Oil
2617231
630.3
7395.8
23.234482 7.60 2288 1.43 0.522
Reduction Specific Energy Consumption

Project Linking With Carbon Emission Reduction
Title of Project implementedYear of
implementation
CO2 reduction in Tonnes
Investment in Rs in Million
Heat rate improvement by replacing HP Module Nov-09 30842 220
Auxiliary power reduction by replacement of BFP 2A cartridge with repaired one. Nov-09 2532 4.8
Improving heat rate by replacement of Unit-2 APH baskets, gratings and seals Nov-09 6694 31.5
Installation of Vapor Absorption Machine (VAM) Apr-09 1632 15.6
Installation of Turbo wind ventilators Stage-2 & 3 (08 Nos) May-09 222 0.6
Installation of 1100 LPD solar water heater—Stage-1&2 March-10 15.88 0.41
Carbon Emission Reduction Projects

Title of Project implementedYear of implementation
CO2 reduction in Tonnes
Investment in Rs
Million
Installation of solar street lighting at Railway dead end (9 watts X 16 nos) + (11 watts X 32 nos)
May-09 1.273 1.152
Installation of solar Ecogen system (15 watts X 6 nos) Mar-10 0.116 0.115
Conservation of power by replacement of fluorescent lamp fixtures by compact fluorescent lamps (CFL)
Nov-09 42 0.44
Discontinuing Service Air & Instrument air Supply to FOPH,Filter Water House, Raw Water Pump House,CHP.
Jul-09 100 Nil
Installation of 200 LPD solar water heater Stage-1 Apr-09 2 0.095
Carbon Emission Reduction Projects
Title of Project implementedYear of
implementation
Total Co2 reduction in Tonnes
Investment in Rs in Million
Reduction of auxiliary power by installing Hi chrome liners instead of Mn liners in Coal mill 1EF & 2EF.
Jun-09 295 12
Conservation of aux. power consumption by replacing existing GT cooling pumps by energy efficient pumps.
Nov-09 95 0.16
Variable Frequency Drive for Condensate Extraction Pump (CEP#1A) Nov-08 1520 7.0
Variable Frequency Drive for Colony Drinking water pump Feb-09 76 0.003
Carbon Emission Reduction Projects
Total CO2 Reduction > 45000 Tons

Carbon Foot Print Study with CII
Emission Intensity Unit 2008-09 2009-10
With gross generation ton CO2 / MWH 0.878 0.878
With net power export ton CO2 / MWH 0.965 0.963
SO2 emission
1
16
31
46
61
76
2002-03 2003-04 2004-05 2005-06 2006-07 2007-08 2008-09 2009-10SO2 E
miss
ion (T
on/D
ay)
SO2 Emission from DTPS (Ton/Day)
SO2 Limit by MPCB (80.4 Ton/Day)
Environment Performance - SO2 EmissionSO2 Station (T/Day)
52.3 52.6
28.2
2.93.3 3.2 4.4 3.6 3.8 3.6 4.0 3.9 4.0
57.2
56.5
32.2
57.3
Apr-07 Jul-07 Oct-07 Jan-08 Apr-08 Jul-08 Oct-08 Jan-09 Apr-09 Jul-09 Oct-09
SO2 Station (T/Day)
FGD commissioned
TPM Emission
73.0
51.3
34.0 34.0 39.0 34.4 37.3 40.7
2002-03 2003-04 2004-05 2005-06 2006-07 2007-08 2008-09 2009-10
TP
M
NOx Emission
89 88.5 88.586.1
76.3069.90
75.4075.60
150
2002-03 2003-04 2004-05 2005-06 2006-07 2007-08 2008-09 2009-10
(PPM
)
Actual NOx Emission from DTPS NOx Emission Limit by M PCB (150 ppm at 15% excess O2)
MPCB Limit – 150 mg/nm3

Innovative Project -1Reduction In Overhauling Cycle Time
q Shortage of power in grid
q Time taken for Unit Overhauling is perceived to be high
q High Unit Overhauling cycle time leads to more generation loss and hence
pain to all
Problem Statement
q National Average unit overhaul time is between 35-45 Days
q Use of Six sigma methodology for reduction in overhaul cycle time
q SOP developed for overhaul & with monitoring & review system in place
Reason for taking up project
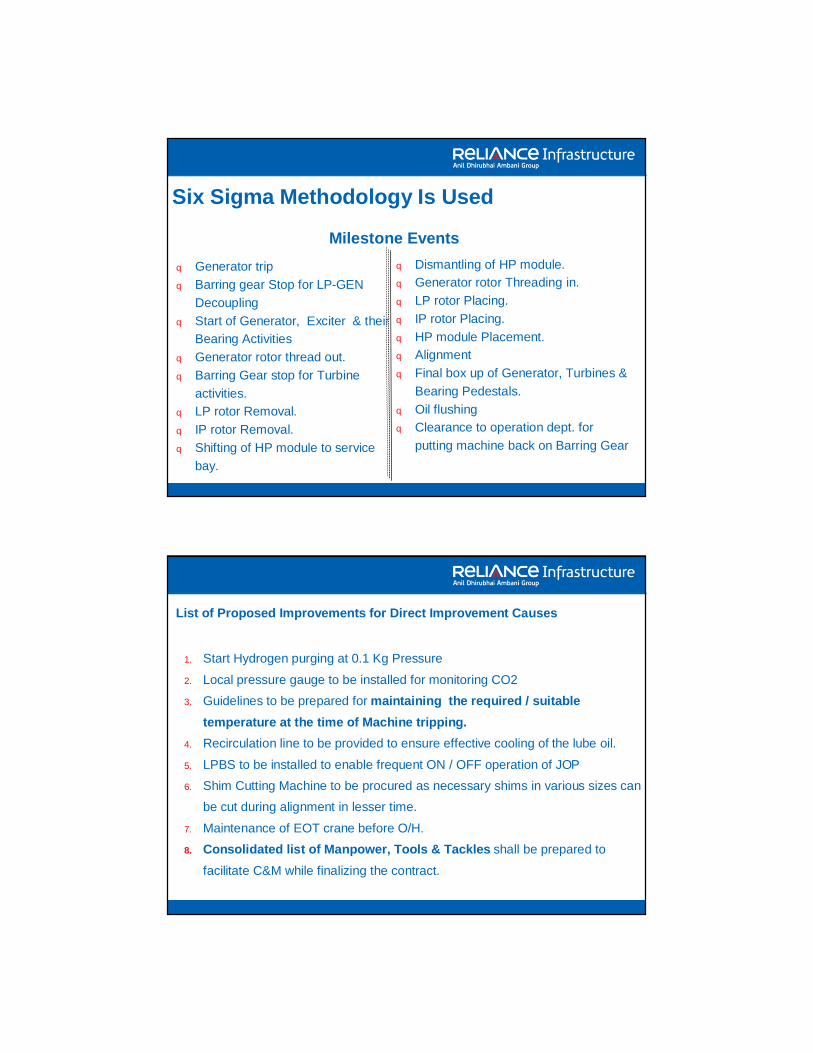
Milestone Eventsq Generator trip q Barring gear Stop for LP-GEN
Decouplingq Start of Generator, Exciter & their
Bearing Activitiesq Generator rotor thread out.q Barring Gear stop for Turbine
activities.q LP rotor Removal.q IP rotor Removal.q Shifting of HP module to service
bay.
q Dismantling of HP module.q Generator rotor Threading in.q LP rotor Placing.q IP rotor Placing.q HP module Placement.q Alignmentq Final box up of Generator, Turbines &
Bearing Pedestals.q Oil flushingq Clearance to operation dept. for
putting machine back on Barring Gear
Six Sigma Methodology Is Used
List of Proposed Improvements for Direct Improvement Causes
1. Start Hydrogen purging at 0.1 Kg Pressure
2. Local pressure gauge to be installed for monitoring CO23. Guidelines to be prepared for maintaining the required / suitable
temperature at the time of Machine tripping.4. Recirculation line to be provided to ensure effective cooling of the lube oil.
5. LPBS to be installed to enable frequent ON / OFF operation of JOP6. Shim Cutting Machine to be procured as necessary shims in various sizes can
be cut during alignment in lesser time.
7. Maintenance of EOT crane before O/H.8. Consolidated list of Manpower, Tools & Tackles shall be prepared to
facilitate C&M while finalizing the contract.

22
89
6486
24
123
86
10 1015
66 6483
124
24
102
74
10 10
211
0012
87
3023
7
21
0
GeneratorTrip
Barring re-started af terdecoupling
Barring stop Low ering ofHP module at
"0" mtrs.
HP moduledimantaling
HP modulebox-up
HP moduleplaced inposition
Turbine &GeneratorAlignment
Completion ofInsulation
Oil flushing
Dura
tion
(Hrs
)
AS IS Should Be Difference
Comparison of AS IS & Should Be Durations of O/H
Dash Board
3025
21 22 21
37
2001 2002 2006 2007 2008 2009
Trip to Barring Avg Trip to Barring prior to project implementation Duration Trend for O/H Cycle
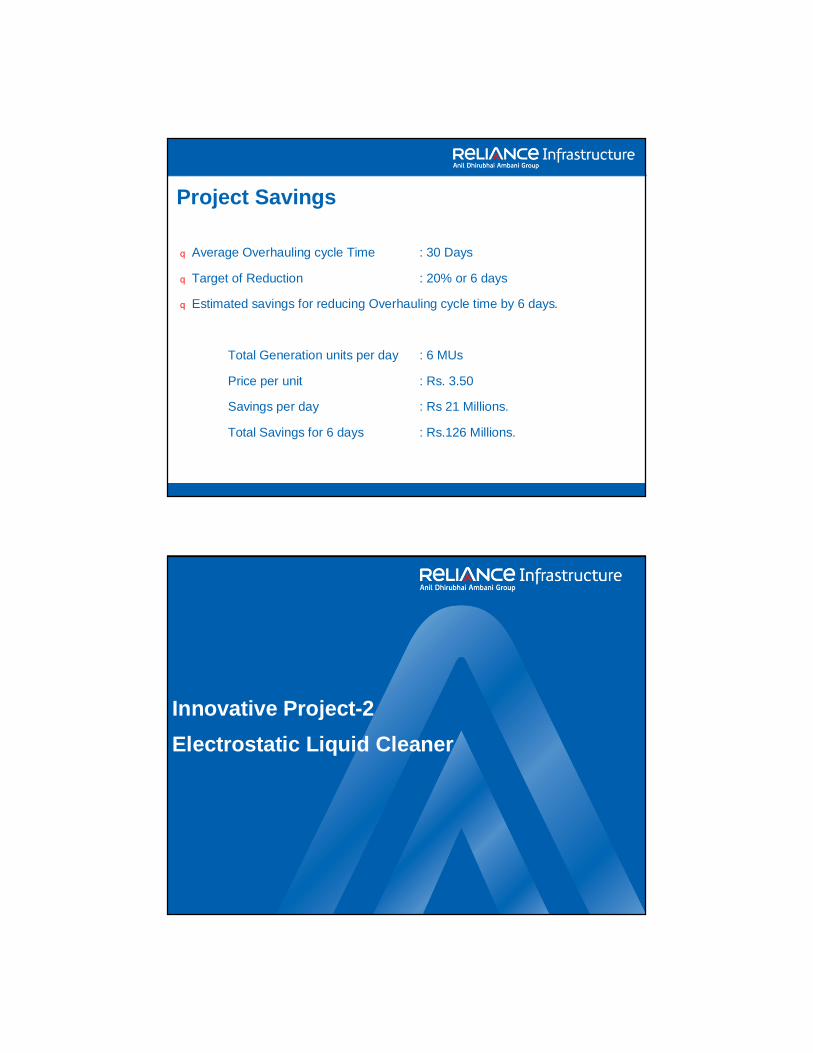
Project Savings
q Average Overhauling cycle Time : 30 Days
q Target of Reduction : 20% or 6 days
q Estimated savings for reducing Overhauling cycle time by 6 days.
Total Generation units per day : 6 MUs
Price per unit : Rs. 3.50
Savings per day : Rs 21 Millions.
Total Savings for 6 days : Rs.126 Millions.
Electrostatic Liquid Cleaner Innovative Project-2
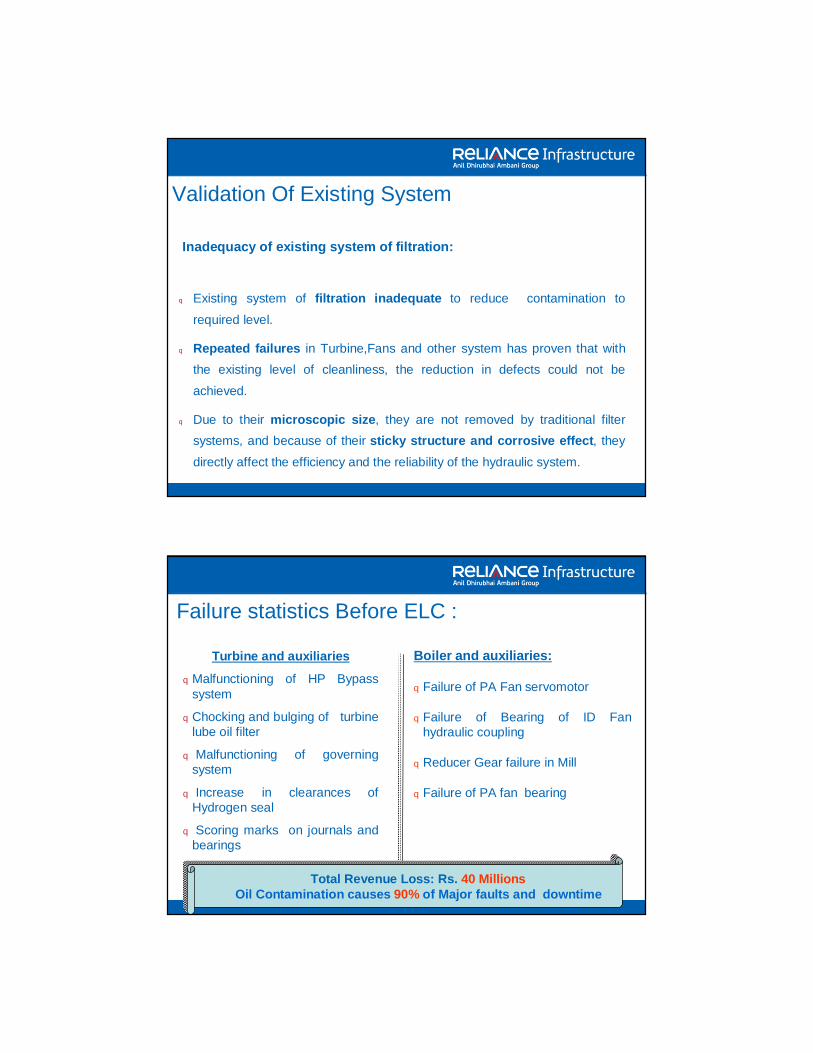
Validation Of Existing System
Inadequacy of existing system of filtration:
q Existing system of filtration inadequate to reduce contamination to
required level.
q Repeated failures in Turbine,Fans and other system has proven that with the existing level of cleanliness, the reduction in defects could not be
achieved.
q Due to their microscopic size, they are not removed by traditional filter systems, and because of their sticky structure and corrosive effect, they
directly affect the efficiency and the reliability of the hydraulic system.
15 June’ 2006
Turbine and auxiliaries
qMalfunctioning of HP Bypass system
qChocking and bulging of turbine lube oil filter
q Malfunctioning of governing system
q Increase in clearances of Hydrogen seal
q Scoring marks on journals and bearings
Failure statistics Before ELC :
Boiler and auxiliaries:
qFailure of PA Fan servomotor
qFailure of Bearing of ID Fan hydraulic coupling
qReducer Gear failure in Mill
qFailure of PA fan bearing
Total Revenue Loss: Rs. 40 MillionsOil Contamination causes 90% of Major faults and downtime

q ELC works similar to the principle of Electro Static Precipitator.
Super Cleaning by ELC (Electrostatic Liquid Cleaner)
Methodology q Trial with HP By-pass hydraulic system. q Patch test carried out before and after oil filtration.The results were
encouraging.
q Based on the results,it has been adopted for other critical equipments like Turbine,PA / FD Fans.
q Sustained Achievement in oil cleanliness to NAS-7 level.

q Reduction in Oil consumption
q Reduction in Inventory.
q Process reliability has increased.
q Equipment availability has increased.
BenefitsOIL CONSUMPTION PATTERN
131159
10174
5480
60 58 50
2000 2001 2002 2003 2004 2005* 2006 2007 2008
BARRELS
*
Average oil consumption has reduced to 76 barrels from 145 barrelsNet Savings of Rs 8.6 Lacs
Turbine Outage time reduction
q Eliminating replacement of bearing.
q Oil Flushing time reduced.
q Reduction in time required for MOT cleaning because of less sludge
formation.
Reduction in Fan Outages
q Cumulative Loss of generation due to fan outage before ELC = 0.70 Mus
q After ELC-No outage due to Oil problems.
Indirect Benefits

On Line Energy Monitoring System
Innovative Project - 03
Network Connectivity
eLAN®
DATA CONVERT
OR
DATA CONVERTO
R
EM-6400 MULTIFUNCTION METERSTotal 135 nos Energy
meter installed
Objective Of EMS
q Online monitoring of auxiliary wise energy consumption.
q To optimize the power consumption.q Benchmarking energy consumptionq To identify the inefficient equipment
operationq To provide useful input for Predictive
maintenance decisions

Mimic.

This Screen shows Trend (of real time data of every individual feeder (Flow, pressure, Active power).
Trends
SLD

Reports
View Reports
Feeder name
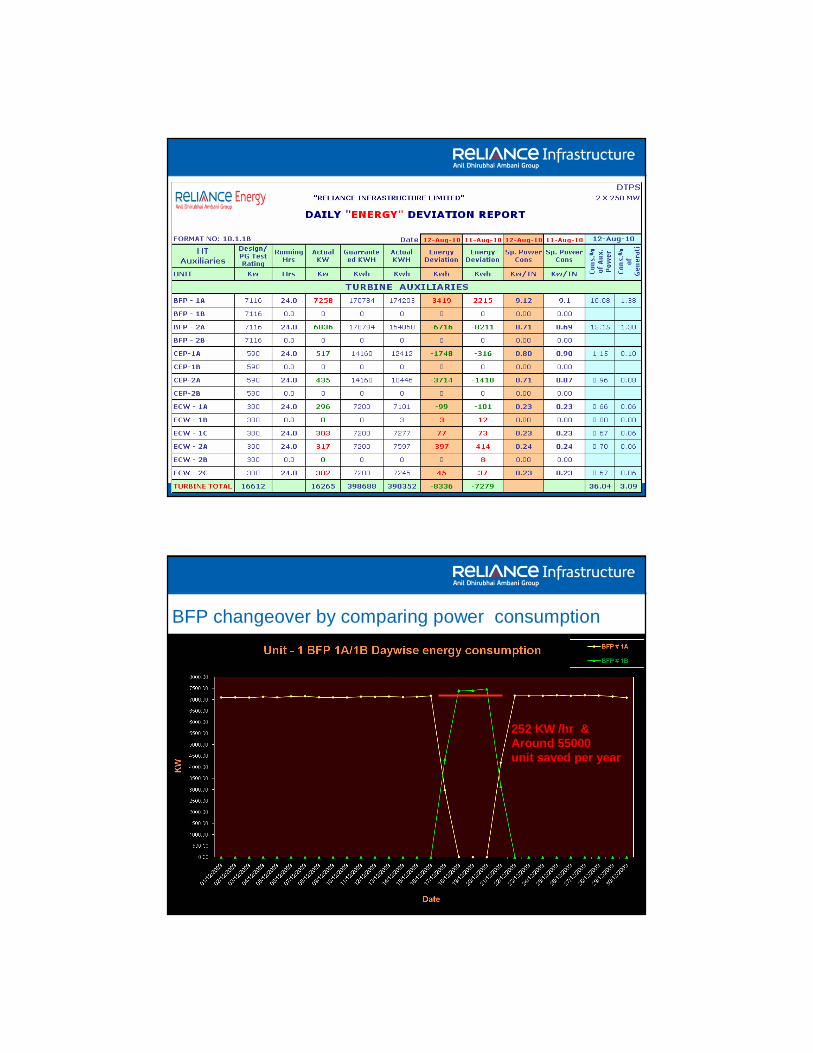
252 KW /hr & Around 55000 unit saved per year
BFP changeover by comparing power consumption

Mill changeover by comparing power consumption
Benefits
q Benchmarking energy consumption
q Different type of reports like daily, monthly, quarterly or yearly are
generated automatically.
q Enhanced the efficient equipment operation
q Useful Data available for Predictive maintenance decision.
q Availability of online data of all electrical and process at single point which
is very useful for Energy audit.
q Measurement and verification
Awards & Recognition
More than 80 National & International awards received in the category of
q Environment
q Performance
q Safety
q Corporate Social Responsibility
DTPS “ Journey Towards Business Excellence”q Benchmarking with other units & Internal benchmarking exercisesq System based approach and Continual improvement through QIP/ EMP/ SIPq Adoption of Best O&M practices. Cost control on dynamic basis by Day – to –
day planning online
q Divisional objectives & KPI identified for ENCON.
q Adoption of latest & best technologies. q Use of “Six Sigma” methodology for break through improvements.q Maintain a highly motivated workforce- Employee centric best HR practices q Optimized operations by resource conservation, waste reduction along with
Focused Energy conservation projectsq .Participation in various Awards.q Identification of COPQ.q Advance Maintenance management by use of Equipment criticality analysis
and Condition monitoring etc.

q Replacement of HP Module in Unit-1
q Replacement of BFP -1B cartridge in Unit-1
q Installation of VFD for next level of equipments
q Use of professional Software package for finding out opportunities to improve
heat rate, improve in boiler efficiency and other auxiliaries performance
q Installation of IFC air controller – GE60 for instrument air network to reduce
demand side pressure consumption.
q Installation of refrigerant drier in place of Desiccant drier
Major Energy Saving Projects Under Implementation
Think Bigger Think Better - Anil D. Ambani

Thank you
2nd September 2010


