84
Power | Power and Water | Oil and Gas Excelling Globally Abu Dhabi National Energy Company PJSC (TAQA) 2018 Annual Report
Power | Power and Water | Oil and Gas
Excelling GloballyAbu Dhabi National Energy Company PJSC (TAQA)
2018 Annual Report
Abu Dhabi N
ational Energy Com
pany PJSC (TAQ
A)
20
18
Annual Report
His Highness Sheikh Khalifa bin Zayed Al Nahyan
President of the UAE
The Late Sheikh Zayed bin Sultan Al Nahyan
Founder of the United Arab Emirates
His Highness Sheikh Mohamed bin Zayed Al Nahyan
Crown Prince of Abu Dhabi and Deputy Supreme Commander of the UAE Armed Forces
W
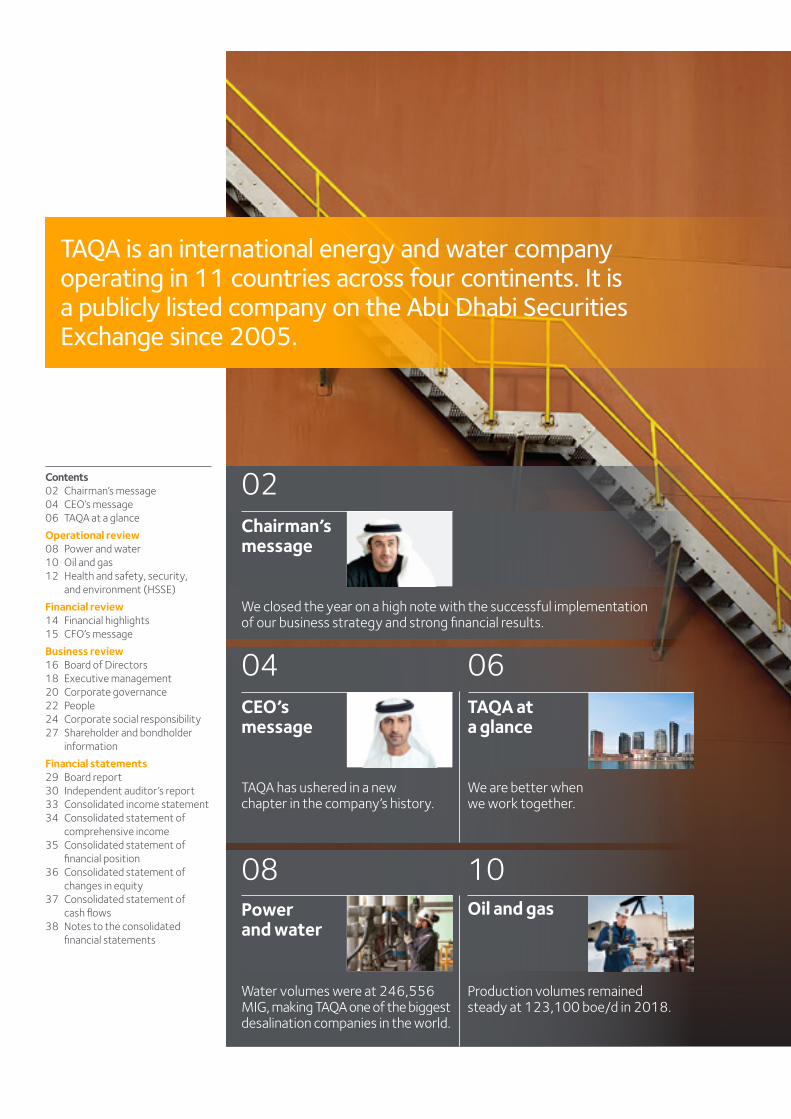
TAQA has ushered in a new chapter in the company’s history.
We closed the year on a high note with the successful implementation of our business strategy and strong financial results.
Water volumes were at 246,556 MIG, making TAQA one of the biggest desalination companies in the world.
We are better when we work together.
Production volumes remained steady at 123,100 boe/d in 2018.
CEO’s message
Chairman’s message
Power and water
04
02
08
06
10
TAQA at a glance
Oil and gas
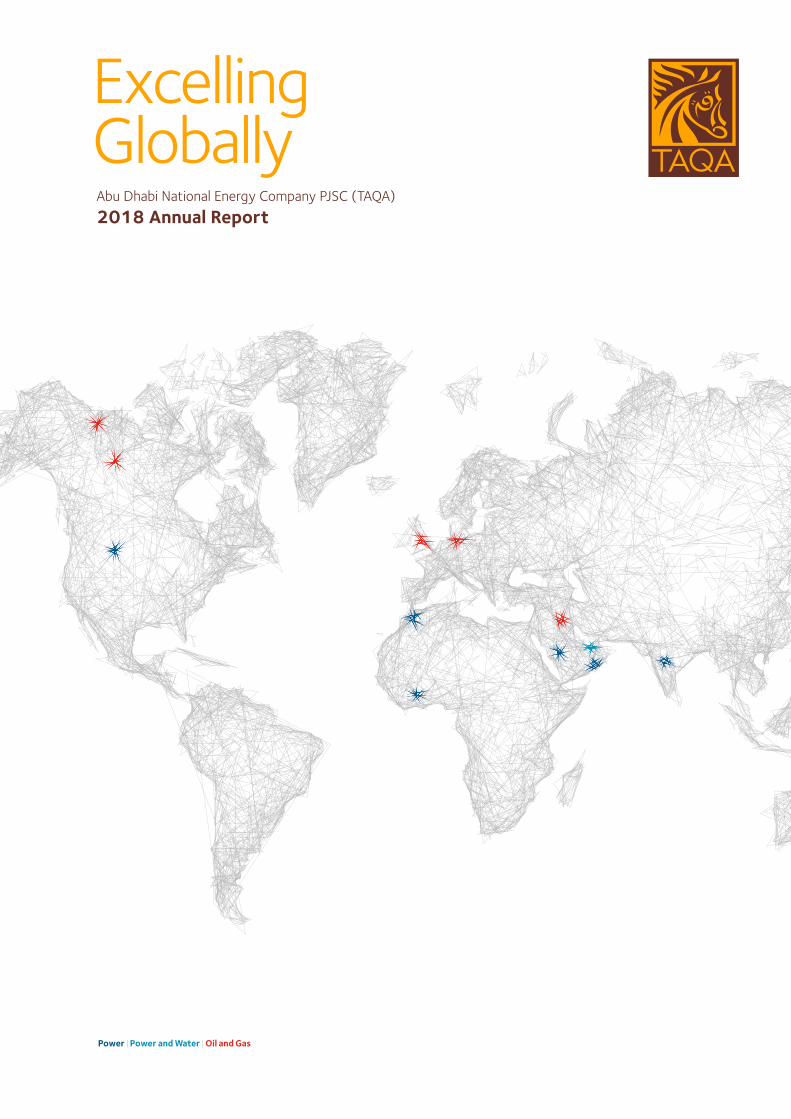
TAQA is an international energy and water company operating in 11 countries across four continents. It is a publicly listed company on the Abu Dhabi Securities Exchange since 2005.
Contents02 Chairman’s message04 CEO’s message 06 TAQA at a glance
Operational review08 Power and water10 Oil and gas12 Health and safety, security,
and environment (HSSE)
Financial review 14 Financial highlights 15 CFO’s message
Business review 16 Board of Directors18 Executive management20 Corporate governance22 People24 Corporate social responsibility27 Shareholder and bondholder
information
Financial statements29 Board report30 Independent auditor’s report33 Consolidated income statement34 Consolidated statement of
comprehensive income35 Consolidated statement of
financial position36 Consolidated statement of
changes in equity37 Consolidated statement of
cash flows38 Notes to the consolidated
financial statements
W
TAQA strives to run its company safely and sustainably, operating to the highest ethical standards. The company is proud to align its strategy with Abu Dhabi’s Economic Vision 2030, a roadmap for a sustainable economy with a focus on knowledge-based industry.
TAQA has investments in power generation, water desalination, oil and gas exploration and production, pipelines, and gas storage. The company’s assets are located in Canada, Ghana, India, Iraq, Morocco, Netherlands, Oman, Saudi Arabia, the United Arab Emirates, the United Kingdom, and the United States.
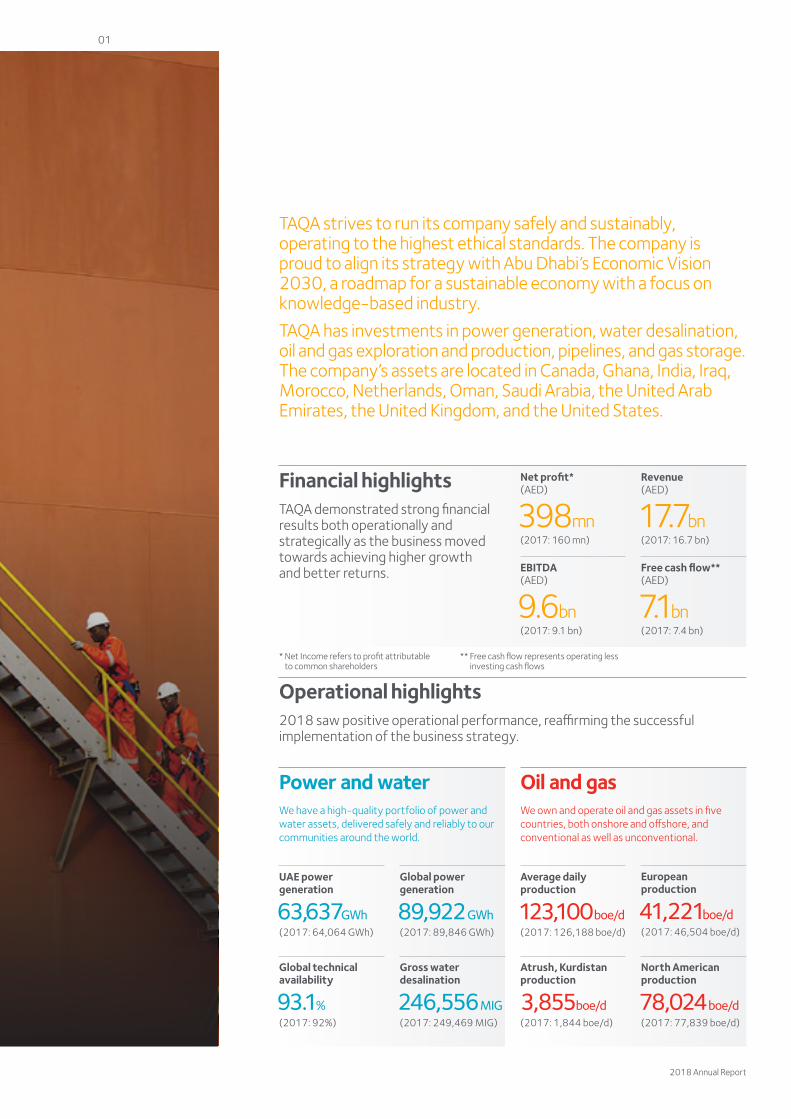
Financial highlightsTAQA demonstrated strong financial results both operationally and strategically as the business moved towards achieving higher growth and better returns.
* Net Income refers to profit attributable to common shareholders
** Free cash flow represents operating less investing cash flows
Net profit* (AED)
398mn(2017: 160 mn)
EBITDA (AED)
9.6bn (2017: 9.1 bn)
Revenue (AED)
17.7bn(2017: 16.7 bn)
Free cash flow** (AED)
7.1bn (2017: 7.4 bn)
Operational highlights2018 saw positive operational performance, reaffirming the successful implementation of the business strategy.
UAE power generation
63, 637GWh(2017: 64,064 GWh)
Global technical availability
93.1%(2017: 92%)
Average daily production
123,100 boe/d(2017: 126,188 boe/d)
Atrush, Kurdistan production
3,855boe/d(2017: 1,844 boe/d)
North American production
78,024 boe/d(2017: 77,839 boe/d)
Global power generation
89,922 GWh(2017: 89,846 GWh)
Gross water desalination
246,556 MIG(2017: 249,469 MIG)
European production
41,221 boe/d(2017: 46,504 boe/d)
Oil and gasWe own and operate oil and gas assets in five countries, both onshore and offshore, and conventional as well as unconventional.
Power and waterWe have a high-quality portfolio of power and water assets, delivered safely and reliably to our communities around the world.
2018 Annual Report
01
On behalf of the members of TAQA’s Board of Directors, I am pleased to present TAQA’s Annual Report for 2018, which demonstrates our key achievements over the year. We closed the year on a high note with the successful implementation of our business strategy and strong financial results.
Despite challenging business and economic conditions, TAQA’s financial and operational performance remained impressive throughout the year. We continued to focus our efforts on defining and implementing a growth strategy and addressing emerging challenges, while also capitalizing on the opportunities offered by evolving power, water, oil and gas industries.
The company’s balance sheet remains strong due to a two-year transformation program we undertook in 2015, which was aimed at enhancing operational efficiencies and safety. We introduced the program against the wider backdrop of falling oil prices; however, we remained committed to aligning our operations with the highest international standards.
As pleased as I am with our operational and financial performance in 2018, it is with even greater satisfaction to note that significant emphasis was placed on sustainable growth underpinned by social and environmental obligations. As a result, the year 2018 witnessed considerable improvement in operational efficiency while focusing on health, safety, security and environment (HSSE) as key drivers of success.
In terms of governance, we have maintained a high level of integrity and transparency and have taken proactive efforts to communicate with our stakeholders in a clear and accurate manner, as disclosed in our corporate governance report.
Additionally, we remained committed to the professional development of our staff through an inclusive environment and greater engagement. In 2018, we made significant progress in driving our Emiratization efforts with a strong focus on developing local leadership talent. Today, 65% of all employees in our Abu Dhabi headquarters are Emirati.
The commitment of our leadership and strong balance sheet ensure that we are well-placed to meet the potential opportunities and challenges that 2019 will present. Looking forward, as a reliable energy and water company listed on the Abu Dhabi Securities Exchange, with operations in 11 countries spanning four continents, TAQA is committed to continuing its journey of transformation and unlocking potential for further growth.
As Abu Dhabi continues to accelerate its diversification agenda, in line with the UAE’s Vision 2021, I am confident that we will to continue our momentum while aligning our growth strategy with UAE national interests.
In closing, I would like to take this opportunity to express my sincere gratitude to His Highness Sheikh Khalifa Bin Zayed Al Nahyan, the President of the UAE and Ruler of Abu Dhabi, and His Highness Sheikh Mohammed Bin Zayed, Crown Prince of Abu Dhabi, for their visionary leadership and excellence across all sectors in the UAE.
H.E. Saeed Mubarak Al-HajeriChairman of the Board
We remain on course to becoming an emerging global energy and water company. As a result of our concerted efforts, we have been on a firm growth trajectory in 2018.
Chairman’s message
As pleased as I am with our operational and financial performance in 2018, it is with even greater satisfaction to note that significant emphasis was placed on sustainable growth, underpinned by social and environmental obligations.
Financial review Page 14
Business review Page 16
Financial statementsPage 28
Abu Dhabi National Energy Company PJSC (TAQA)
02
On behalf of the Board of Directors, I would also like to express my gratitude to His Highness Sheikh Hazza bin Zayed Al Nahyan, Vice Chairman of the Abu Dhabi Executive Council, for his support of TAQA.
I thank our management and colleagues around the world for their continued efforts over the past year. It is through their hard work and dedication that TAQA continues to raise the bar and drive our business towards delivering the organization’s strategy, vision, mission, and values.
Last but not the least, I would like to extend our appreciation to all our valued stakeholders and shareholders for their continuous support and loyalty to TAQA.
H.E. Saeed Mubarak Al HajeriChairman of the Board
We made significant progress in driving nationalization efforts. Today, 65% of all employees in our Abu Dhabi headquarters are UAE nationals.
2018 Annual Report
03
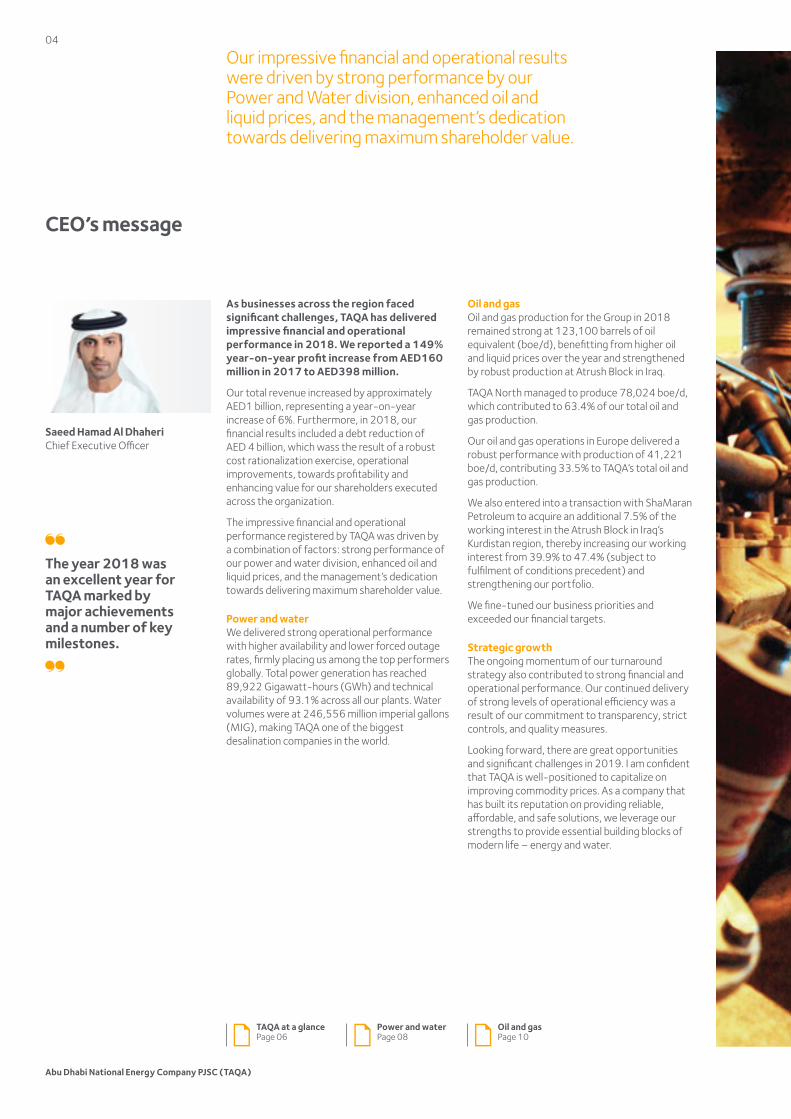
Saeed Hamad Al DhaheriChief Executive Officer
The year 2018 was an excellent year for TAQA marked by major achievements and a number of key milestones.
CEO’s message
As businesses across the region faced significant challenges, TAQA has delivered impressive financial and operational performance in 2018. We reported a 149% year-on-year profit increase from AED160 million in 2017 to AED398 million.
Our total revenue increased by approximately AED1 billion, representing a year-on-year increase of 6%. Furthermore, in 2018, our financial results included a debt reduction of AED 4 billion, which wass the result of a robust cost rationalization exercise, operational improvements, towards profitability and enhancing value for our shareholders executed across the organization.
The impressive financial and operational performance registered by TAQA was driven by a combination of factors: strong performance of our power and water division, enhanced oil and liquid prices, and the management’s dedication towards delivering maximum shareholder value.
Power and waterWe delivered strong operational performance with higher availability and lower forced outage rates, firmly placing us among the top performers globally. Total power generation has reached 89,922 Gigawatt-hours (GWh) and technical availability of 93.1% across all our plants. Water volumes were at 246,556 million imperial gallons (MIG), making TAQA one of the biggest desalination companies in the world.
Oil and gasOil and gas production for the Group in 2018 remained strong at 123,100 barrels of oil equivalent (boe/d), benefitting from higher oil and liquid prices over the year and strengthened by robust production at Atrush Block in Iraq.
TAQA North managed to produce 78,024 boe/d, which contributed to 63.4% of our total oil and gas production.
Our oil and gas operations in Europe delivered a robust performance with production of 41,221 boe/d, contributing 33.5% to TAQA’s total oil and gas production.
We also entered into a transaction with ShaMaran Petroleum to acquire an additional 7.5% of the working interest in the Atrush Block in Iraq’s Kurdistan region, thereby increasing our working interest from 39.9% to 47.4% (subject to fulfilment of conditions precedent) and strengthening our portfolio.
We fine-tuned our business priorities and exceeded our financial targets.
Strategic growth The ongoing momentum of our turnaround strategy also contributed to strong financial and operational performance. Our continued delivery of strong levels of operational efficiency was a result of our commitment to transparency, strict controls, and quality measures.
Looking forward, there are great opportunities and significant challenges in 2019. I am confident that TAQA is well-positioned to capitalize on improving commodity prices. As a company that has built its reputation on providing reliable, affordable, and safe solutions, we leverage our strengths to provide essential building blocks of modern life – energy and water.
Our impressive financial and operational results were driven by strong performance by our Power and Water division, enhanced oil and liquid prices, and the management’s dedication towards delivering maximum shareholder value.
Power and waterPage 08
Oil and gasPage 10
TAQA at a glancePage 06
Abu Dhabi National Energy Company PJSC (TAQA)
04
With this in mind, we continue to focus on delivering improvements in our operations and, in doing so, we drive profitability and enhance value for our shareholders.
This philosophy will enable us to achieve synergies within our businesses model by acting as a cohesive global organization. Combined with our-long term investment approach, I am confident this strategy will help us meet future opportunities with a more solid and strengthened balance sheet.
In closing, I would like to thank the Board of Directors, the senior management team, and all the TAQA employees for their tireless efforts and commitment to TAQA. I also thank our valued shareholders and all stakeholders for their support and trust in our organization.
Saeed Hamad Al DhaheriChief Executive Officer
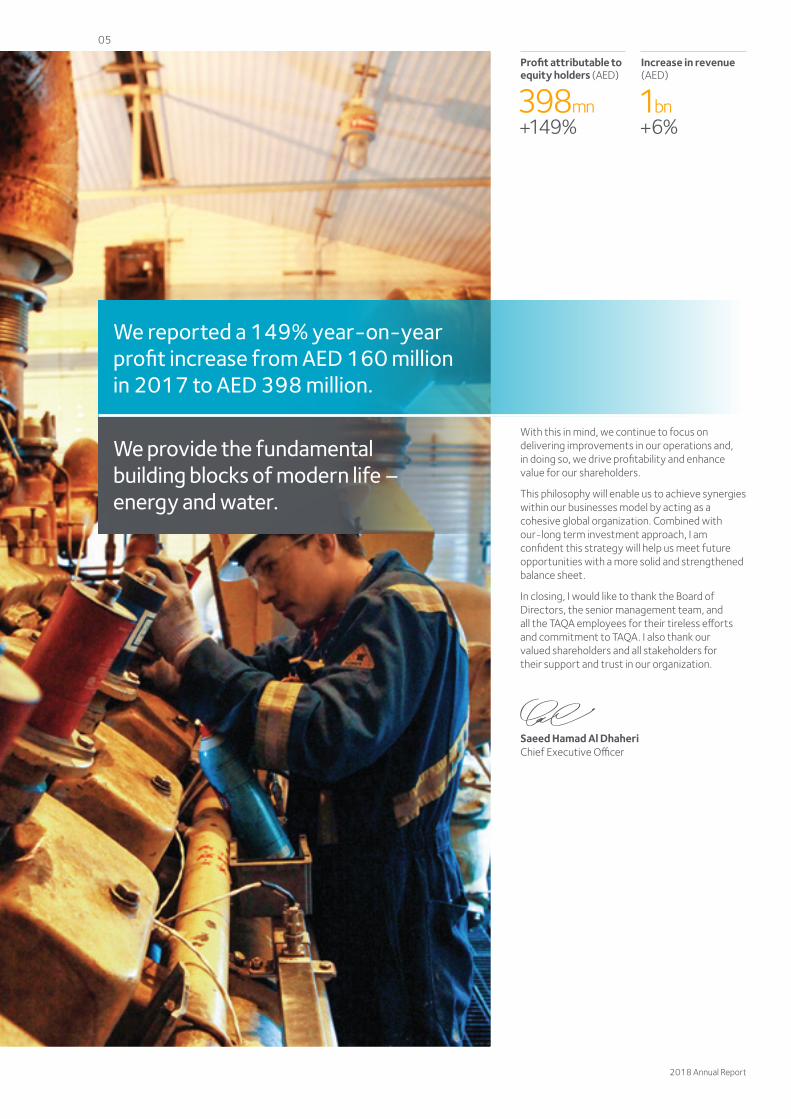
We provide the fundamental building blocks of modern life – energy and water.
We reported a 149% year-on-year profit increase from AED 160 million in 2017 to AED 398 million.
Profit attributable to equity holders (AED)
398mn +149%
Increase in revenue (AED)
1bn +6%
2018 Annual Report
05
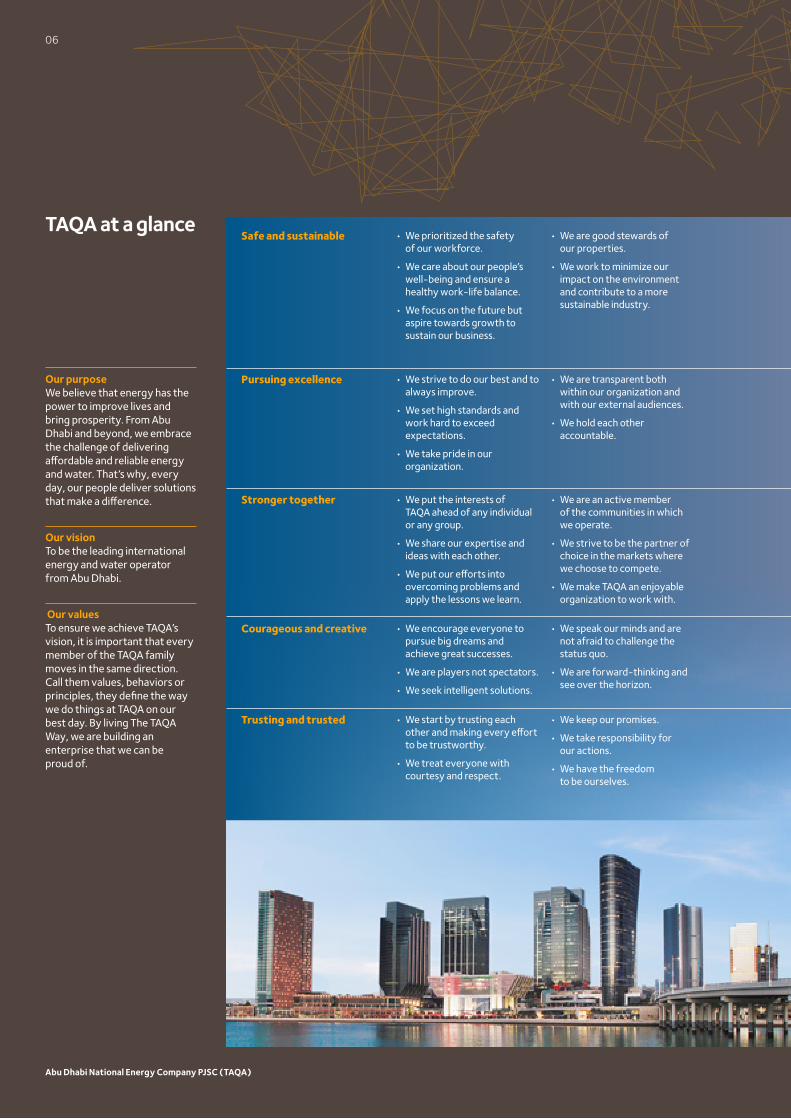
TAQA at a glance
Our purposeWe believe that energy has the power to improve lives and bring prosperity. From Abu Dhabi and beyond, we embrace the challenge of delivering affordable and reliable energy and water. That’s why, every day, our people deliver solutions that make a difference.
Our visionTo be the leading international energy and water operator from Abu Dhabi.
Our valuesTo ensure we achieve TAQA’s vision, it is important that every member of the TAQA family moves in the same direction. Call them values, behaviors or principles, they define the way we do things at TAQA on our best day. By living The TAQA Way, we are building an enterprise that we can be proud of.
Safe and sustainable • We prioritized the safety of our workforce.
• We care about our people’s well-being and ensure a healthy work-life balance.
• We focus on the future but aspire towards growth to sustain our business.
• We are good stewards of our properties.
• We work to minimize our impact on the environment and contribute to a more sustainable industry.
Pursuing excellence • We strive to do our best and to always improve.
• We set high standards and work hard to exceed expectations.
• We take pride in our organization.
• We are transparent both within our organization and with our external audiences.
• We hold each other accountable.
Stronger together • We put the interests of TAQA ahead of any individual or any group.
• We share our expertise and ideas with each other.
• We put our efforts into overcoming problems and apply the lessons we learn.
• We are an active member of the communities in which we operate.
• We strive to be the partner of choice in the markets where we choose to compete.
• We make TAQA an enjoyable organization to work with.
Courageous and creative • We encourage everyone to pursue big dreams and achieve great successes.
• We are players not spectators.
• We seek intelligent solutions.
• We speak our minds and are not afraid to challenge the status quo.
• We are forward-thinking and see over the horizon.
Trusting and trusted • We start by trusting each other and making every effort to be trustworthy.
• We treat everyone with courtesy and respect.
• We keep our promises.
• We take responsibility for our actions.
• We have the freedom to be ourselves.
Abu Dhabi National Energy Company PJSC (TAQA)
06
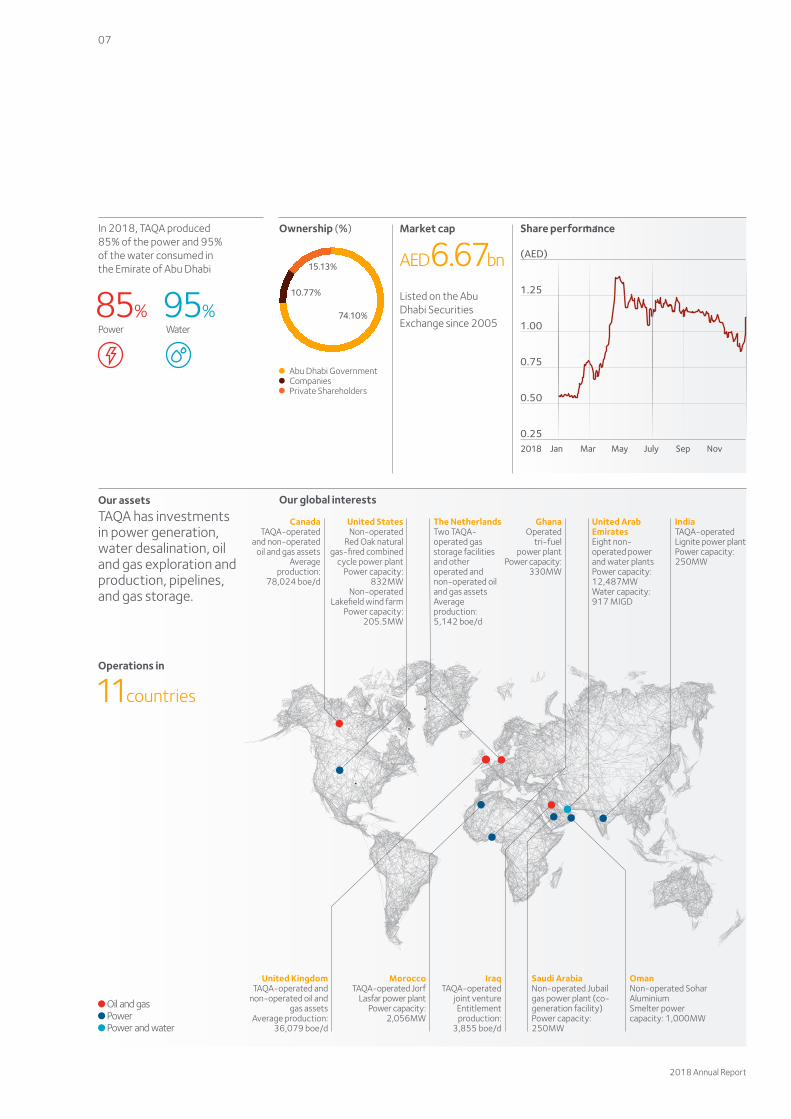
85%Power
95%Water
Share performance
Abu Dhabi Government Companies Private Shareholders
Ownership (%)
10.77%
74.10%
In 2018, TAQA produced 85% of the power and 95% of the water consumed in the Emirate of Abu Dhabi
United StatesNon-operated
Red Oak natural gas-fired combined
cycle power plantPower capacity:
832MWNon-operated
Lakefield wind farmPower capacity:
205.5MW
United Arab EmiratesEight non-operated power and water plantsPower capacity: 12,487MWWater capacity: 917 MIGD
IndiaTAQA-operated Lignite power plantPower capacity: 250MW
Saudi ArabiaNon-operated Jubail gas power plant (co-generation facility)Power capacity: 250MW
OmanNon-operated Sohar AluminiumSmelter power capacity: 1,000MW
IraqTAQA-operated
joint venture Entitlement production:
3,855 boe/d
GhanaOperated
tri-fuel power plant
Power capacity: 330MW
MoroccoTAQA-operated Jorf
Lasfar power plant Power capacity:
2,056MW
United KingdomTAQA-operated and
non-operated oil and gas assets
Average production: 36,079 boe/d
The NetherlandsTwo TAQA-operated gas storage facilities and other operated and non-operated oil and gas assetsAverage production: 5,142 boe/d
CanadaTAQA-operated
and non-operated oil and gas assets
Average production:
78,024 boe/d
Our global interestsOur assets TAQA has investments in power generation, water desalination, oil and gas exploration and production, pipelines, and gas storage.
Operations in
11countries
Oil and gas Power Power and water
Market cap
AED6.67bn
Listed on the Abu Dhabi Securities Exchange since 2005
(AED)
1.25
1.00
0.75
0.50
0.25Jan Mar May July Sep Nov
15.13%
2018
2018 Annual Report
07
Operational reviewPower and water
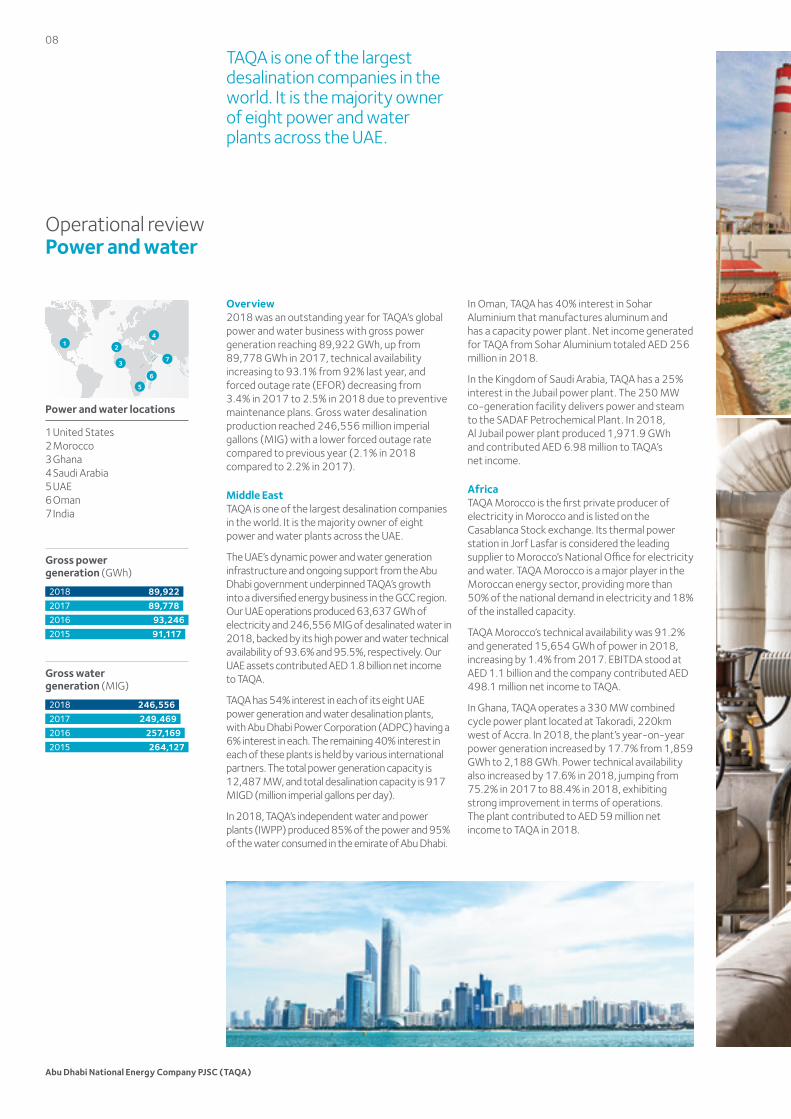
TAQA is one of the largest desalination companies in the world. It is the majority owner of eight power and water plants across the UAE.
Overview 2018 was an outstanding year for TAQA’s global power and water business with gross power generation reaching 89,922 GWh, up from 89,778 GWh in 2017, technical availability increasing to 93.1% from 92% last year, and forced outage rate (EFOR) decreasing from 3.4% in 2017 to 2.5% in 2018 due to preventive maintenance plans. Gross water desalination production reached 246,556 million imperial gallons (MIG) with a lower forced outage rate compared to previous year (2.1% in 2018 compared to 2.2% in 2017).
Middle EastTAQA is one of the largest desalination companies in the world. It is the majority owner of eight power and water plants across the UAE.
The UAE’s dynamic power and water generation infrastructure and ongoing support from the Abu Dhabi government underpinned TAQA’s growth into a diversified energy business in the GCC region. Our UAE operations produced 63,637 GWh of electricity and 246,556 MIG of desalinated water in 2018, backed by its high power and water technical availability of 93.6% and 95.5%, respectively. Our UAE assets contributed AED 1.8 billion net income to TAQA.
TAQA has 54% interest in each of its eight UAE power generation and water desalination plants, with Abu Dhabi Power Corporation (ADPC) having a 6% interest in each. The remaining 40% interest in each of these plants is held by various international partners. The total power generation capacity is 12,487 MW, and total desalination capacity is 917 MIGD (million imperial gallons per day).
In 2018, TAQA’s independent water and power plants (IWPP) produced 85% of the power and 95% of the water consumed in the emirate of Abu Dhabi.
In Oman, TAQA has 40% interest in Sohar Aluminium that manufactures aluminum and has a capacity power plant. Net income generated for TAQA from Sohar Aluminium totaled AED 256 million in 2018.
In the Kingdom of Saudi Arabia, TAQA has a 25% interest in the Jubail power plant. The 250 MW co-generation facility delivers power and steam to the SADAF Petrochemical Plant. In 2018, Al Jubail power plant produced 1,971.9 GWh and contributed AED 6.98 million to TAQA’s net income.
AfricaTAQA Morocco is the first private producer of electricity in Morocco and is listed on the Casablanca Stock exchange. Its thermal power station in Jorf Lasfar is considered the leading supplier to Morocco’s National Office for electricity and water. TAQA Morocco is a major player in the Moroccan energy sector, providing more than 50% of the national demand in electricity and 18% of the installed capacity.
TAQA Morocco’s technical availability was 91.2% and generated 15,654 GWh of power in 2018, increasing by 1.4% from 2017. EBITDA stood at AED 1.1 billion and the company contributed AED 498.1 million net income to TAQA.
In Ghana, TAQA operates a 330 MW combined cycle power plant located at Takoradi, 220km west of Accra. In 2018, the plant’s year-on-year power generation increased by 17.7% from 1,859 GWh to 2,188 GWh. Power technical availability also increased by 17.6% in 2018, jumping from 75.2% in 2017 to 88.4% in 2018, exhibiting strong improvement in terms of operations. The plant contributed to AED 59 million net income to TAQA in 2018.
Power and water locations
1 United States 2 Morocco3 Ghana4 Saudi Arabia5 UAE6 Oman7 India
Gross power generation (GWh)
Gross water generation (MIG)
2018 89,9222017 89,7782016 93,2462015 91,117
2018 246,5562017 249,4692016 257,1692015 264,127
21
3 7
4
6
5
Abu Dhabi National Energy Company PJSC (TAQA)
08
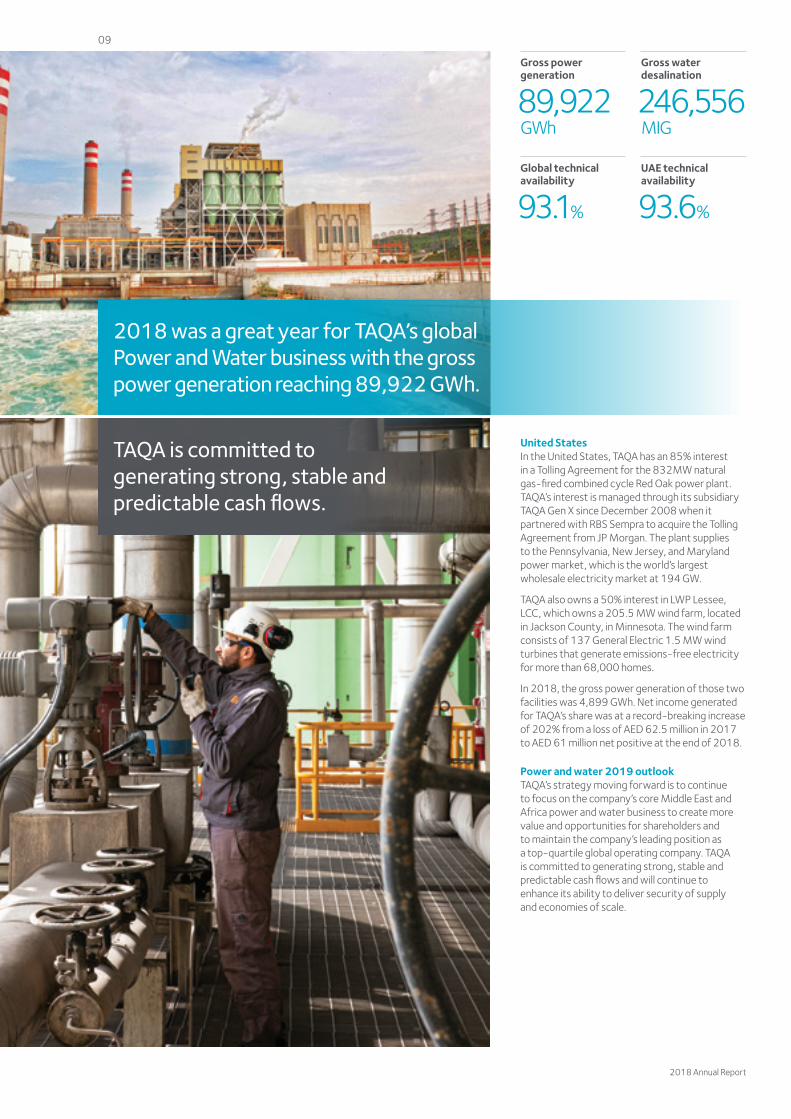
TAQA is committed to generating strong, stable and predictable cash flows.
United StatesIn the United States, TAQA has an 85% interest in a Tolling Agreement for the 832MW natural gas-fired combined cycle Red Oak power plant. TAQA’s interest is managed through its subsidiary TAQA Gen X since December 2008 when it partnered with RBS Sempra to acquire the Tolling Agreement from JP Morgan. The plant supplies to the Pennsylvania, New Jersey, and Maryland power market, which is the world’s largest wholesale electricity market at 194 GW.
TAQA also owns a 50% interest in LWP Lessee, LCC, which owns a 205.5 MW wind farm, located in Jackson County, in Minnesota. The wind farm consists of 137 General Electric 1.5 MW wind turbines that generate emissions-free electricity for more than 68,000 homes.
In 2018, the gross power generation of those two facilities was 4,899 GWh. Net income generated for TAQA’s share was at a record-breaking increase of 202% from a loss of AED 62.5 million in 2017 to AED 61 million net positive at the end of 2018.
Power and water 2019 outlookTAQA’s strategy moving forward is to continue to focus on the company’s core Middle East and Africa power and water business to create more value and opportunities for shareholders and to maintain the company’s leading position as a top-quartile global operating company. TAQA is committed to generating strong, stable and predictable cash flows and will continue to enhance its ability to deliver security of supply and economies of scale.
Gross power generation
89,922 GWh
Global technical availability
93.1%
UAE technical availability
93.6%
Gross water desalination
246,556 MIG
2018 was a great year for TAQA’s global Power and Water business with the gross power generation reaching 89,922 GWh.
2018 Annual Report
09
Oil and gas prices fluctuated during 2018 but were higher than in 2017.
The focus for 2018 was on maximizing the division’s potential.
Operational reviewOil and gas
The oil and gas business continues to focus on safety and operational excellence and maximizing value in a fluctuating commodity price environment.
Overview The oil and gas business continues to focus on safety and operational excellence and maximizing value in a fluctuating commodity price environment.
Despite our focus on cost efficiency, production volumes remained robust at 123,100 boe/d in 2018, slightly decreasing by 2.5% from the previous year.
In December 2018, TAQA celebrated a decade since it acquired 100% interest in the Tern, Kestrel, Eider, Cormorant, and Pelican fields and became the operator of the Brent Pipeline System in the North Sea. Soon after, the UK business proved to be a fully-fledged operator and became duty holder of its northern North Sea assets in 2009.
The global oil and gas division delivered AED 6.3 billion in revenues and EBITDA for the year was AED 2.7 billion, backed by enhanced oil and liquid prices in Europe and Iraq.
Europe A major highlight in our European business in 2018 was the creation of a new decommissioning directorate in June 2018. We also saw the transformation of the Eider platform, a bypass project that now redirects production from the Otter field - which previously produced to Eider - to the TAQA-operated North Cormorant platform. As a result, the life of both the Otter field and the North Cormorant platform wells are being extended. This ensures the continued production from the Otter field as part of the strategy to maximize economic recovery and extend the life of our oil and gas fields in the northern North Sea.
We also secured a contract with Tulip Oil that will see gas from Tulip’s Q10 development (one of the biggest discoveries of the past decade in the Dutch North Sea) being produced via our P15/P18 facilities, thereby significantly extending the operational life of our hub.
Across Europe, capital investment increased from AED 407.7 million in 2017 to AED 679.6 million in 2018. The main drivers for this growth were the Otter Multi Phase Pump project, the drilling of a Pelican development well (TP26), and the recertification of the North Cormorant rig to enable drilling in early 2019.
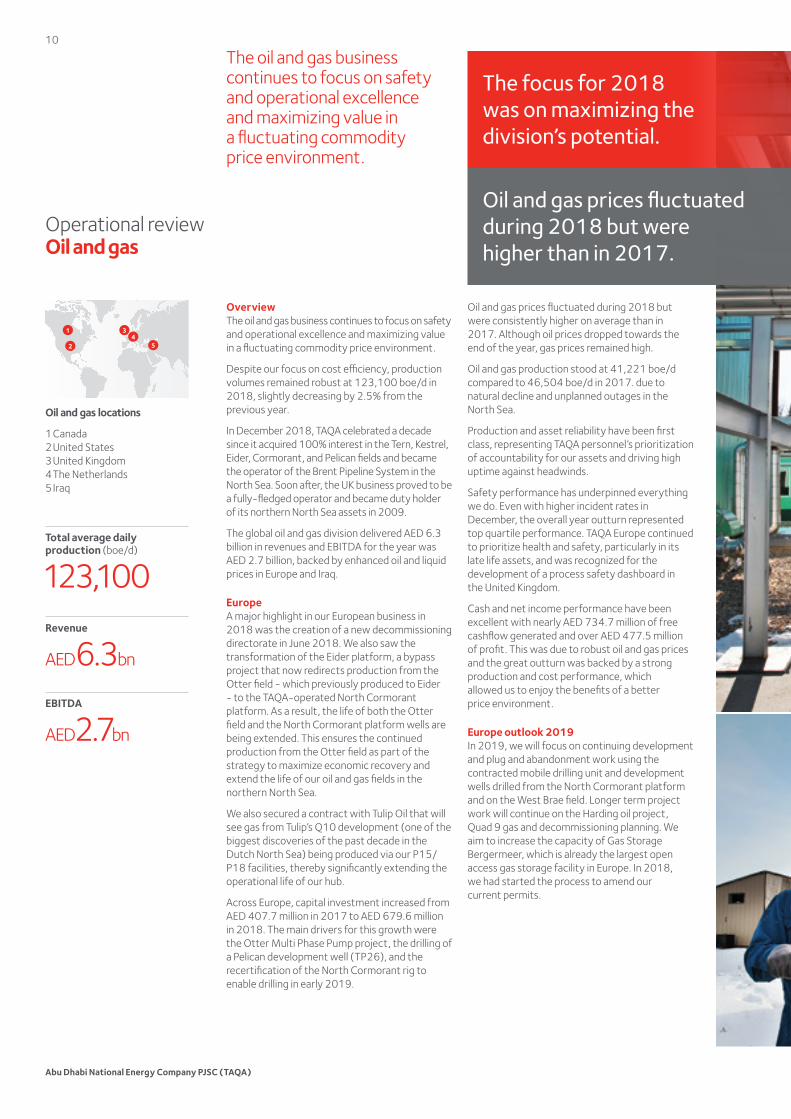
Oil and gas locations
1 Canada 2 United States 3 United Kingdom 4 The Netherlands 5 Iraq
Total average daily production (boe/d)
123,100Revenue
AED6.3bn
EBITDA
AED2.7bn
1
2
34
5
Oil and gas prices fluctuated during 2018 but were consistently higher on average than in 2017. Although oil prices dropped towards the end of the year, gas prices remained high.
Oil and gas production stood at 41,221 boe/d compared to 46,504 boe/d in 2017. due to natural decline and unplanned outages in the North Sea.
Production and asset reliability have been first class, representing TAQA personnel’s prioritization of accountability for our assets and driving high uptime against headwinds.
Safety performance has underpinned everything we do. Even with higher incident rates in December, the overall year outturn represented top quartile performance. TAQA Europe continued to prioritize health and safety, particularly in its late life assets, and was recognized for the development of a process safety dashboard in the United Kingdom.
Cash and net income performance have been excellent with nearly AED 734.7 million of free cashflow generated and over AED 477.5 million of profit. This was due to robust oil and gas prices and the great outturn was backed by a strong production and cost performance, which allowed us to enjoy the benefits of a better price environment.
Europe outlook 2019In 2019, we will focus on continuing development and plug and abandonment work using the contracted mobile drilling unit and development wells drilled from the North Cormorant platform and on the West Brae field. Longer term project work will continue on the Harding oil project, Quad 9 gas and decommissioning planning. We aim to increase the capacity of Gas Storage Bergermeer, which is already the largest open access gas storage facility in Europe. In 2018, we had started the process to amend our current permits.
Abu Dhabi National Energy Company PJSC (TAQA)
10
Oil and gas prices fluctuated during 2018 but were higher than in 2017.
The focus for 2018 was on maximizing the division’s potential.
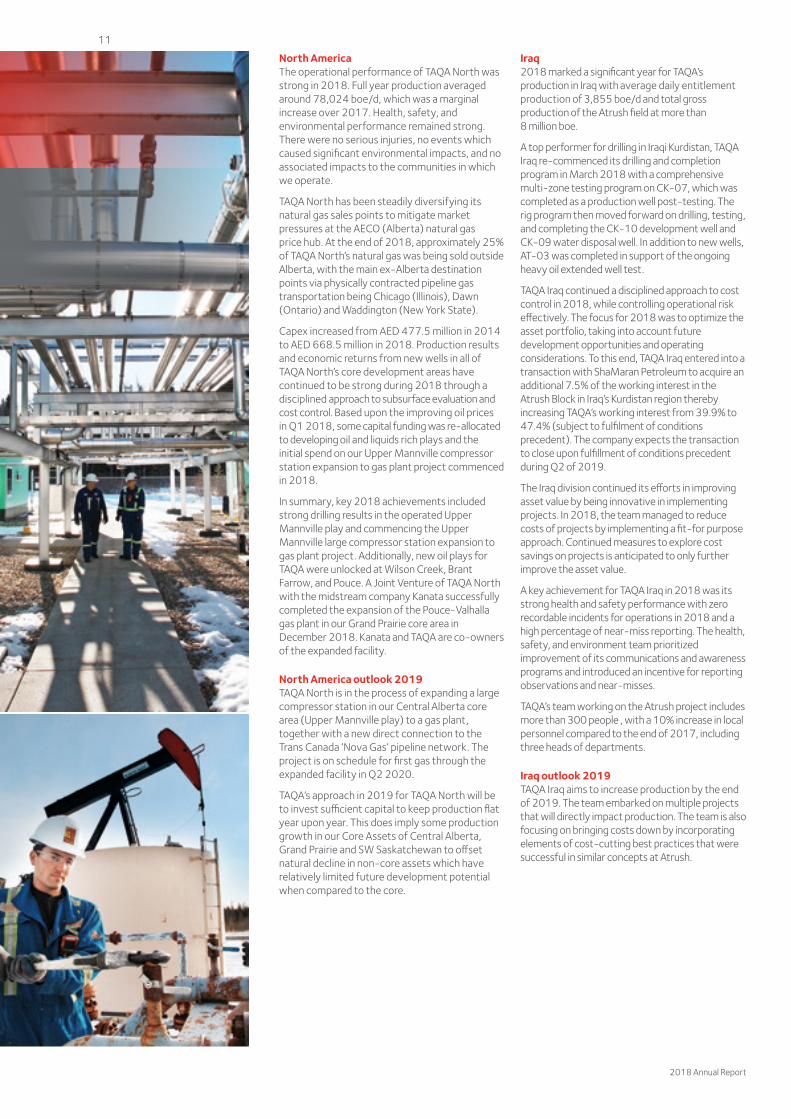
North AmericaThe operational performance of TAQA North was strong in 2018. Full year production averaged around 78,024 boe/d, which was a marginal increase over 2017. Health, safety, and environmental performance remained strong. There were no serious injuries, no events which caused significant environmental impacts, and no associated impacts to the communities in which we operate.
TAQA North has been steadily diversifying its natural gas sales points to mitigate market pressures at the AECO (Alberta) natural gas price hub. At the end of 2018, approximately 25% of TAQA North’s natural gas was being sold outside Alberta, with the main ex-Alberta destination points via physically contracted pipeline gas transportation being Chicago (Illinois), Dawn (Ontario) and Waddington (New York State).
Capex increased from AED 477.5 million in 2014 to AED 668.5 million in 2018. Production results and economic returns from new wells in all of TAQA North’s core development areas have continued to be strong during 2018 through a disciplined approach to subsurface evaluation and cost control. Based upon the improving oil prices in Q1 2018, some capital funding was re-allocated to developing oil and liquids rich plays and the initial spend on our Upper Mannville compressor station expansion to gas plant project commenced in 2018.
In summary, key 2018 achievements included strong drilling results in the operated Upper Mannville play and commencing the Upper Mannville large compressor station expansion to gas plant project. Additionally, new oil plays for TAQA were unlocked at Wilson Creek, Brant Farrow, and Pouce. A Joint Venture of TAQA North with the midstream company Kanata successfully completed the expansion of the Pouce-Valhalla gas plant in our Grand Prairie core area in December 2018. Kanata and TAQA are co-owners of the expanded facility.
North America outlook 2019TAQA North is in the process of expanding a large compressor station in our Central Alberta core area (Upper Mannville play) to a gas plant, together with a new direct connection to the Trans Canada ‘Nova Gas’ pipeline network. The project is on schedule for first gas through the expanded facility in Q2 2020.
TAQA’s approach in 2019 for TAQA North will be to invest sufficient capital to keep production flat year upon year. This does imply some production growth in our Core Assets of Central Alberta, Grand Prairie and SW Saskatchewan to offset natural decline in non-core assets which have relatively limited future development potential when compared to the core.
Iraq2018 marked a significant year for TAQA’s production in Iraq with average daily entitlement production of 3,855 boe/d and total gross production of the Atrush field at more than 8 million boe.
A top performer for drilling in Iraqi Kurdistan, TAQA Iraq re-commenced its drilling and completion program in March 2018 with a comprehensive multi-zone testing program on CK-07, which was completed as a production well post-testing. The rig program then moved forward on drilling, testing, and completing the CK-10 development well and CK-09 water disposal well. In addition to new wells, AT-03 was completed in support of the ongoing heavy oil extended well test.
TAQA Iraq continued a disciplined approach to cost control in 2018, while controlling operational risk effectively. The focus for 2018 was to optimize the asset portfolio, taking into account future development opportunities and operating considerations. To this end, TAQA Iraq entered into a transaction with ShaMaran Petroleum to acquire an additional 7.5% of the working interest in the Atrush Block in Iraq’s Kurdistan region thereby increasing TAQA’s working interest from 39.9% to 47.4% (subject to fulfilment of conditions precedent). The company expects the transaction to close upon fulfillment of conditions precedent during Q2 of 2019.
The Iraq division continued its efforts in improving asset value by being innovative in implementing projects. In 2018, the team managed to reduce costs of projects by implementing a fit-for purpose approach. Continued measures to explore cost savings on projects is anticipated to only further improve the asset value.
A key achievement for TAQA Iraq in 2018 was its strong health and safety performance with zero recordable incidents for operations in 2018 and a high percentage of near-miss reporting. The health, safety, and environment team prioritized improvement of its communications and awareness programs and introduced an incentive for reporting observations and near-misses.
TAQA’s team working on the Atrush project includes more than 300 people , with a 10% increase in local personnel compared to the end of 2017, including three heads of departments.
Iraq outlook 2019TAQA Iraq aims to increase production by the end of 2019. The team embarked on multiple projects that will directly impact production. The team is also focusing on bringing costs down by incorporating elements of cost-cutting best practices that were successful in similar concepts at Atrush.
2018 Annual Report
11
Operational review Health and safety, security, and environment (HSSE)
TAQA enforces a strict set of rules, guidelines, and reporting tools to ensure a high level of professionalism and adherence to both local and global regulations wherever we operate.
Overview HSSE is a fundamental pillar of TAQA’s business. Our management teams at all levels are directly involved in the development of HSSE objectives at an individual and organizational level. TAQA enforces a strict set of rules, guidelines, and reporting tools to ensure a high level of professionalism and adherence to both local and global regulations wherever we operate. Our commitment to ‘zero accidents’ aims to ensure a safer environment for our staff, our clients, and their end-users.
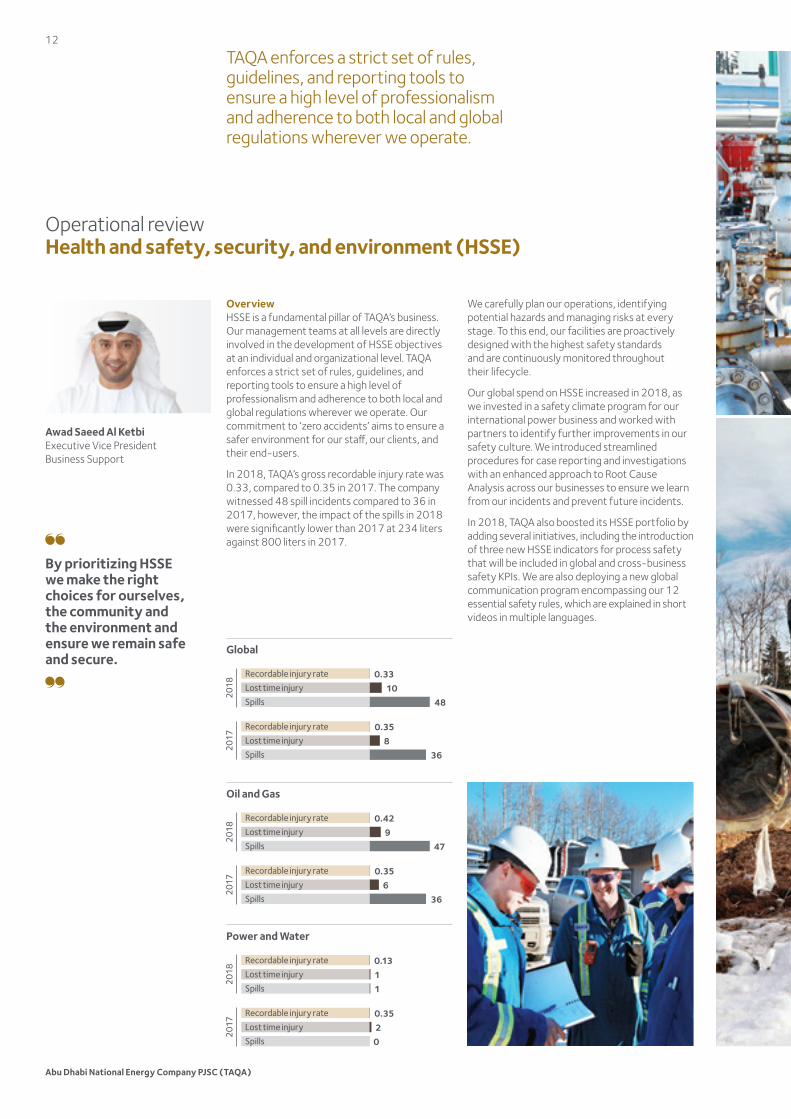
In 2018, TAQA’s gross recordable injury rate was 0.33, compared to 0.35 in 2017. The company witnessed 48 spill incidents compared to 36 in 2017, however, the impact of the spills in 2018 were significantly lower than 2017 at 234 liters against 800 liters in 2017.
We carefully plan our operations, identifying potential hazards and managing risks at every stage. To this end, our facilities are proactively designed with the highest safety standards and are continuously monitored throughout their lifecycle.
Our global spend on HSSE increased in 2018, as we invested in a safety climate program for our international power business and worked with partners to identify further improvements in our safety culture. We introduced streamlined procedures for case reporting and investigations with an enhanced approach to Root Cause Analysis across our businesses to ensure we learn from our incidents and prevent future incidents.
In 2018, TAQA also boosted its HSSE portfolio by adding several initiatives, including the introduction of three new HSSE indicators for process safety that will be included in global and cross-business safety KPIs. We are also deploying a new global communication program encompassing our 12 essential safety rules, which are explained in short videos in multiple languages.
By prioritizing HSSE we make the right choices for ourselves, the community and the environment and ensure we remain safe and secure.
Global
Recordable injury rate
Lost time injury
Spills 48 10
0.33
2018
Recordable injury rate
Lost time injury
Spills 36 8
0.35
2017
Oil and Gas
Recordable injury rate
Lost time injury
Spills 47 9
0.42
2018
Recordable injury rate
Lost time injury
Spills 36 6
0.35
2017
Power and Water
Recordable injury rate
Lost time injury
Spills 1 1 0.13
2018
Recordable injury rate
Lost time injury
Spills 0
0.35
2017 2
Awad Saeed Al KetbiExecutive Vice President Business Support
Abu Dhabi National Energy Company PJSC (TAQA)
12
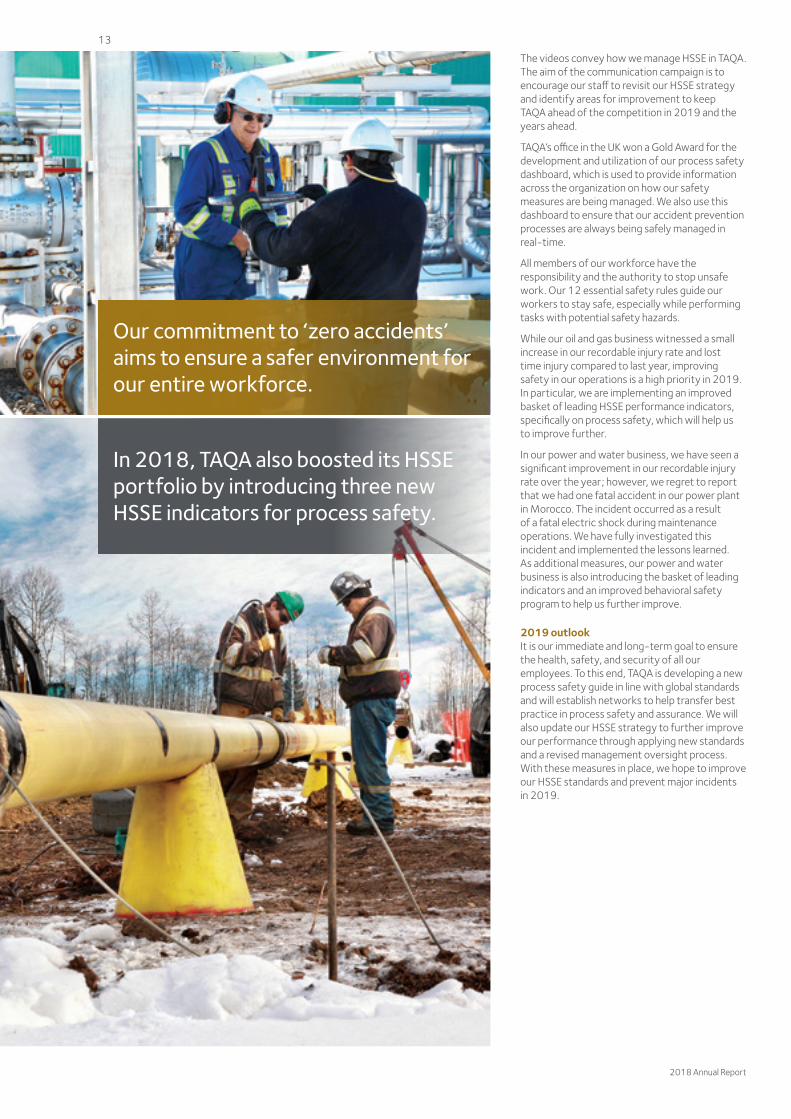
In 2018, TAQA also boosted its HSSE portfolio by introducing three new HSSE indicators for process safety.
Our commitment to ‘zero accidents’ aims to ensure a safer environment for our entire workforce.
The videos convey how we manage HSSE in TAQA. The aim of the communication campaign is to encourage our staff to revisit our HSSE strategy and identify areas for improvement to keep TAQA ahead of the competition in 2019 and the years ahead.
TAQA’s office in the UK won a Gold Award for the development and utilization of our process safety dashboard, which is used to provide information across the organization on how our safety measures are being managed. We also use this dashboard to ensure that our accident prevention processes are always being safely managed in real-time.
All members of our workforce have the responsibility and the authority to stop unsafe work. Our 12 essential safety rules guide our workers to stay safe, especially while performing tasks with potential safety hazards.
While our oil and gas business witnessed a small increase in our recordable injury rate and lost time injury compared to last year, improving safety in our operations is a high priority in 2019. In particular, we are implementing an improved basket of leading HSSE performance indicators, specifically on process safety, which will help us to improve further.
In our power and water business, we have seen a significant improvement in our recordable injury rate over the year; however, we regret to report that we had one fatal accident in our power plant in Morocco. The incident occurred as a result of a fatal electric shock during maintenance operations. We have fully investigated this incident and implemented the lessons learned. As additional measures, our power and water business is also introducing the basket of leading indicators and an improved behavioral safety program to help us further improve.
2019 outlookIt is our immediate and long-term goal to ensure the health, safety, and security of all our employees. To this end, TAQA is developing a new process safety guide in line with global standards and will establish networks to help transfer best practice in process safety and assurance. We will also update our HSSE strategy to further improve our performance through applying new standards and a revised management oversight process. With these measures in place, we hope to improve our HSSE standards and prevent major incidents in 2019.
2018 Annual Report
13
Financial review Financial highlights
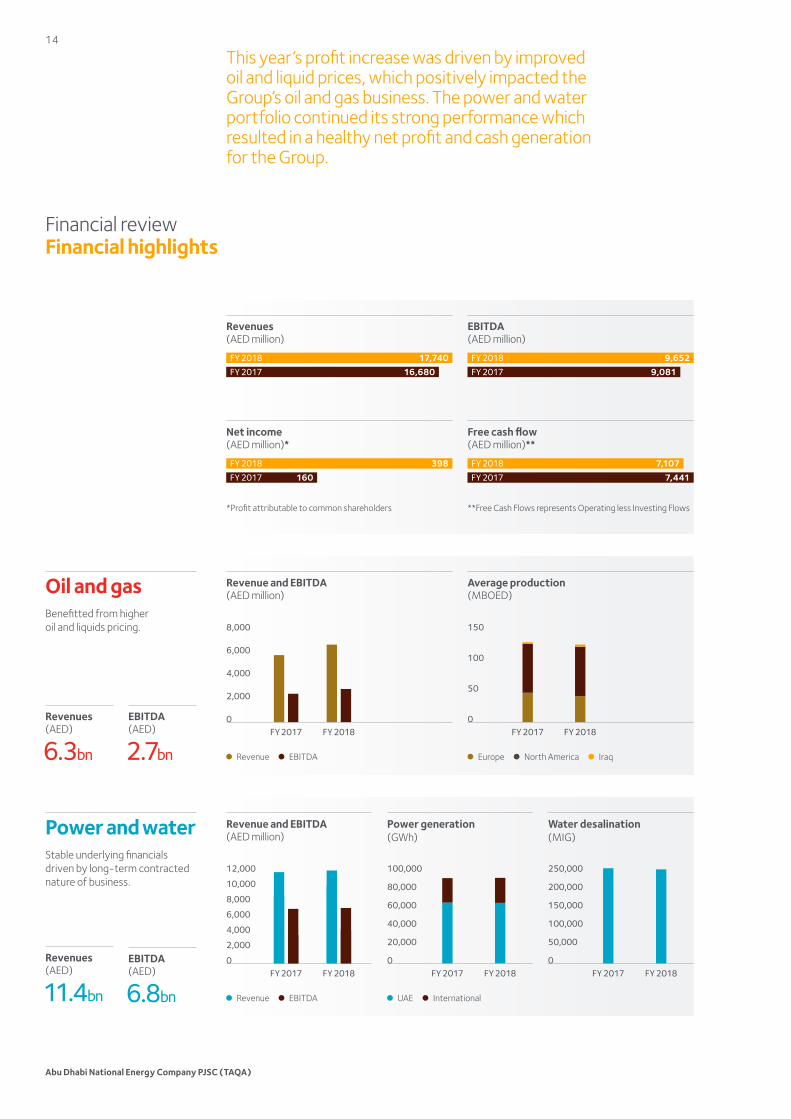
*Profit attributable to common shareholders **Free Cash Flows represents Operating less Investing Flows
Europe North America Iraq
Revenues (AED)
6.3bn
Revenues (AED)
11.4bn
EBITDA (AED)
2.7bn
EBITDA (AED)
6.8bn
Revenue EBITDA
Revenue and EBITDA (AED million)
8,000
6,000
4,000
2,000
0
Average production (MBOED)
150
100
50
0
Oil and gasBenefitted from higher oil and liquids pricing.
Power and waterStable underlying financials driven by long-term contracted nature of business.
Water desalination (MIG)
250,000
200,000
150,000
100,000
50,000
0 FY 2017 FY 2018
This year’s profit increase was driven by improved oil and liquid prices, which positively impacted the Group’s oil and gas business. The power and water portfolio continued its strong performance which resulted in a healthy net profit and cash generation for the Group.
Revenues (AED million)
Net income (AED million)*
EBITDA (AED million)
Free cash flow (AED million)**
FY 2018 17,740 FY 2017 16,680
FY 2018 398FY 2017 160
FY 2018 9,652FY 2017 9,081
FY 2018 7,107FY 2017 7,441
FY 2018FY 2017 FY 2017 FY 2018
UAE International
Power generation (GWh)
100,000
80,000
60,000
40,000
20,000
0 FY 2017 FY 2018
Revenue EBITDA
Revenue and EBITDA (AED million)
12,000
10,000
8,000
6,000
4,000
2,000
0FY 2018FY 2017
Abu Dhabi National Energy Company PJSC (TAQA)
14
Financial overview CFO’s message
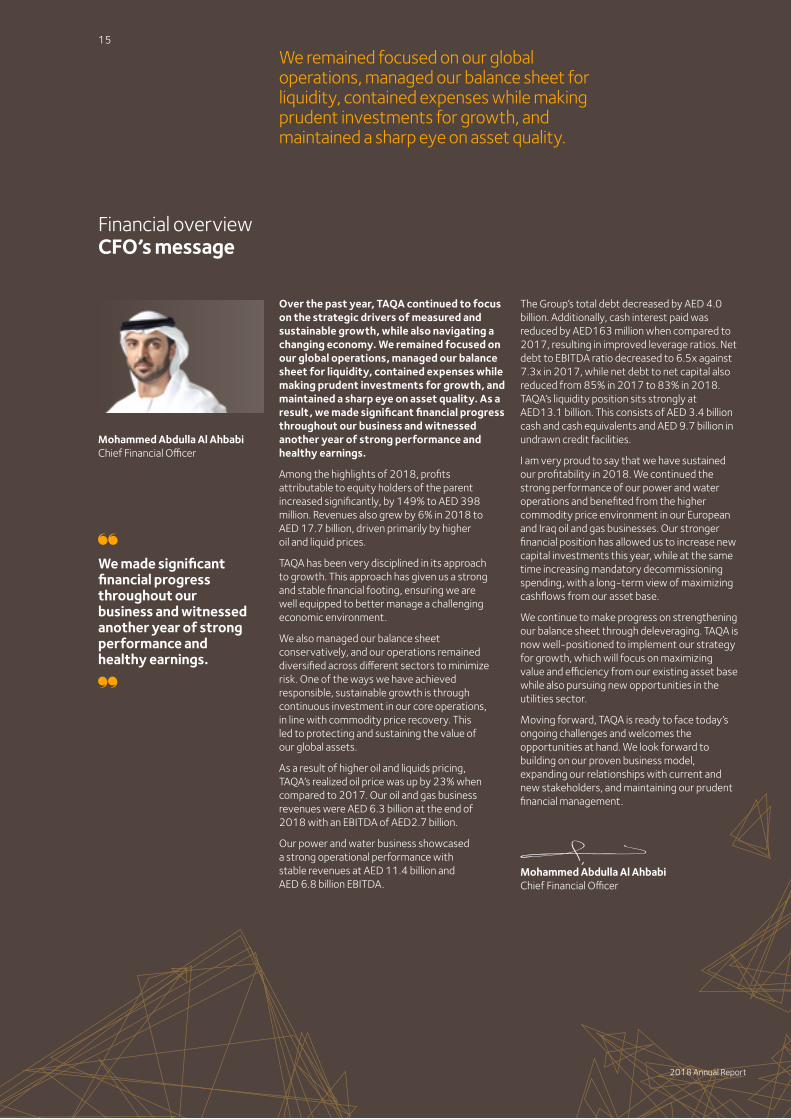
We remained focused on our global operations, managed our balance sheet for liquidity, contained expenses while making prudent investments for growth, and maintained a sharp eye on asset quality.
Over the past year, TAQA continued to focus on the strategic drivers of measured and sustainable growth, while also navigating a changing economy. We remained focused on our global operations, managed our balance sheet for liquidity, contained expenses while making prudent investments for growth, and maintained a sharp eye on asset quality. As a result, we made significant financial progress throughout our business and witnessed another year of strong performance and healthy earnings.
Among the highlights of 2018, profits attributable to equity holders of the parent increased significantly, by 149% to AED 398 million. Revenues also grew by 6% in 2018 to AED 17.7 billion, driven primarily by higher oil and liquid prices.
TAQA has been very disciplined in its approach to growth. This approach has given us a strong and stable financial footing, ensuring we are well equipped to better manage a challenging economic environment.
We also managed our balance sheet conservatively, and our operations remained diversified across different sectors to minimize risk. One of the ways we have achieved responsible, sustainable growth is through continuous investment in our core operations, in line with commodity price recovery. This led to protecting and sustaining the value of our global assets.
As a result of higher oil and liquids pricing, TAQA’s realized oil price was up by 23% when compared to 2017. Our oil and gas business revenues were AED 6.3 billion at the end of 2018 with an EBITDA of AED2.7 billion.
Our power and water business showcased a strong operational performance with stable revenues at AED 11.4 billion and AED 6.8 billion EBITDA.
The Group’s total debt decreased by AED 4.0 billion. Additionally, cash interest paid was reduced by AED163 million when compared to 2017, resulting in improved leverage ratios. Net debt to EBITDA ratio decreased to 6.5x against 7.3x in 2017, while net debt to net capital also reduced from 85% in 2017 to 83% in 2018. TAQA’s liquidity position sits strongly at AED13.1 billion. This consists of AED 3.4 billion cash and cash equivalents and AED 9.7 billion in undrawn credit facilities.
I am very proud to say that we have sustained our profitability in 2018. We continued the strong performance of our power and water operations and benefited from the higher commodity price environment in our European and Iraq oil and gas businesses. Our stronger financial position has allowed us to increase new capital investments this year, while at the same time increasing mandatory decommissioning spending, with a long-term view of maximizing cashflows from our asset base.
We continue to make progress on strengthening our balance sheet through deleveraging. TAQA is now well-positioned to implement our strategy for growth, which will focus on maximizing value and efficiency from our existing asset base while also pursuing new opportunities in the utilities sector.
Moving forward, TAQA is ready to face today’s ongoing challenges and welcomes the opportunities at hand. We look forward to building on our proven business model, expanding our relationships with current and new stakeholders, and maintaining our prudent financial management.
Mohammed Abdulla Al AhbabiChief Financial Officer
Mohammed Abdulla Al AhbabiChief Financial Officer
We made significant financial progress throughout our business and witnessed another year of strong performance and healthy earnings.
2018 Annual Report
15
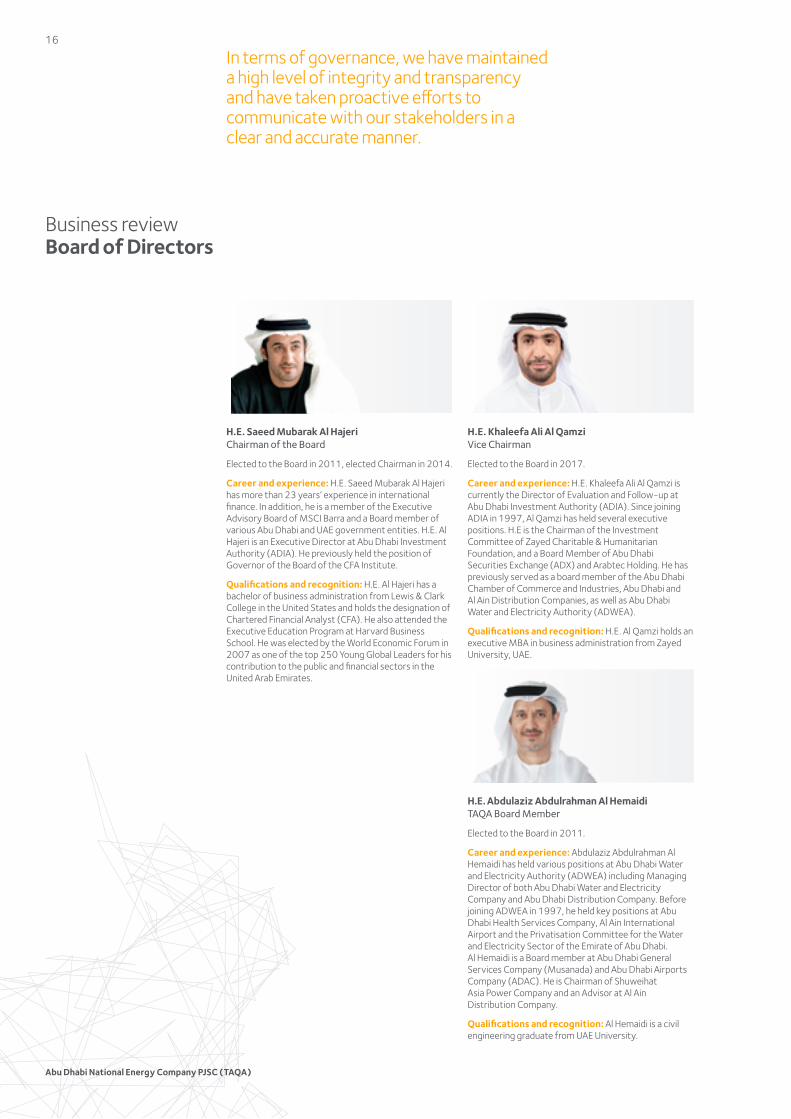
Business review Board of Directors
H.E. Saeed Mubarak Al HajeriChairman of the Board
Elected to the Board in 2011, elected Chairman in 2014.
Career and experience: H.E. Saeed Mubarak Al Hajeri has more than 23 years’ experience in international finance. In addition, he is a member of the Executive Advisory Board of MSCI Barra and a Board member of various Abu Dhabi and UAE government entities. H.E. Al Hajeri is an Executive Director at Abu Dhabi Investment Authority (ADIA). He previously held the position of Governor of the Board of the CFA Institute.
Qualifications and recognition: H.E. Al Hajeri has a bachelor of business administration from Lewis & Clark College in the United States and holds the designation of Chartered Financial Analyst (CFA). He also attended the Executive Education Program at Harvard Business School. He was elected by the World Economic Forum in 2007 as one of the top 250 Young Global Leaders for his contribution to the public and financial sectors in the United Arab Emirates.
H.E. Khaleefa Ali Al QamziVice Chairman
Elected to the Board in 2017.
Career and experience: H.E. Khaleefa Ali Al Qamzi is currently the Director of Evaluation and Follow-up at Abu Dhabi Investment Authority (ADIA). Since joining ADIA in 1997, Al Qamzi has held several executive positions. H.E is the Chairman of the Investment Committee of Zayed Charitable & Humanitarian Foundation, and a Board Member of Abu Dhabi Securities Exchange (ADX) and Arabtec Holding. He has previously served as a board member of the Abu Dhabi Chamber of Commerce and Industries, Abu Dhabi and Al Ain Distribution Companies, as well as Abu Dhabi Water and Electricity Authority (ADWEA).
Qualifications and recognition: H.E. Al Qamzi holds an executive MBA in business administration from Zayed University, UAE.
H.E. Abdulaziz Abdulrahman Al HemaidiTAQA Board Member
Elected to the Board in 2011.
Career and experience: Abdulaziz Abdulrahman Al Hemaidi has held various positions at Abu Dhabi Water and Electricity Authority (ADWEA) including Managing Director of both Abu Dhabi Water and Electricity Company and Abu Dhabi Distribution Company. Before joining ADWEA in 1997, he held key positions at Abu Dhabi Health Services Company, Al Ain International Airport and the Privatisation Committee for the Water and Electricity Sector of the Emirate of Abu Dhabi. Al Hemaidi is a Board member at Abu Dhabi General Services Company (Musanada) and Abu Dhabi Airports Company (ADAC). He is Chairman of Shuweihat Asia Power Company and an Advisor at Al Ain Distribution Company.
Qualifications and recognition: Al Hemaidi is a civil engineering graduate from UAE University.
In terms of governance, we have maintained a high level of integrity and transparency and have taken proactive efforts to communicate with our stakeholders in a clear and accurate manner.
Abu Dhabi National Energy Company PJSC (TAQA)
16
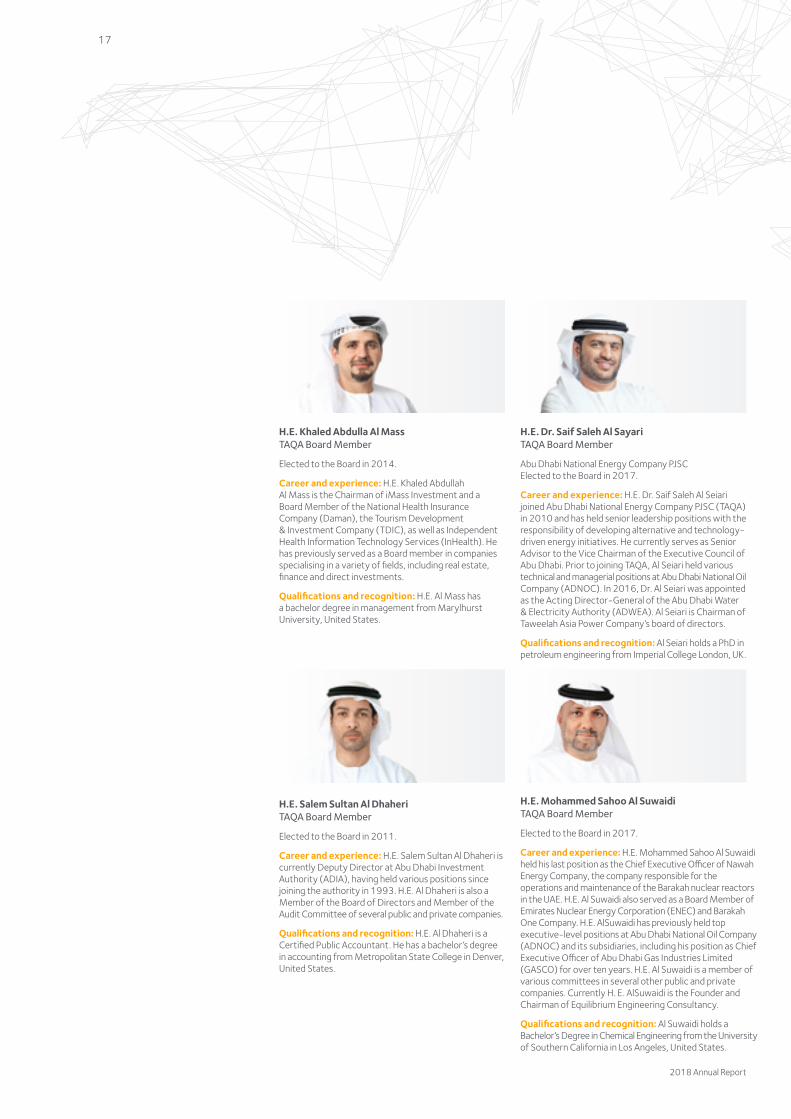
H.E. Khaled Abdulla Al Mass TAQA Board Member
Elected to the Board in 2014.
Career and experience: H.E. Khaled Abdullah Al Mass is the Chairman of iMass Investment and a Board Member of the National Health Insurance Company (Daman), the Tourism Development & Investment Company (TDIC), as well as Independent Health Information Technology Services (InHealth). He has previously served as a Board member in companies specialising in a variety of fields, including real estate, finance and direct investments.
Qualifications and recognition: H.E. Al Mass has a bachelor degree in management from Marylhurst University, United States.
H.E. Dr. Saif Saleh Al SayariTAQA Board Member
Abu Dhabi National Energy Company PJSC Elected to the Board in 2017.
Career and experience: H.E. Dr. Saif Saleh Al Seiari joined Abu Dhabi National Energy Company PJSC (TAQA) in 2010 and has held senior leadership positions with the responsibility of developing alternative and technology-driven energy initiatives. He currently serves as Senior Advisor to the Vice Chairman of the Executive Council of Abu Dhabi. Prior to joining TAQA, Al Seiari held various technical and managerial positions at Abu Dhabi National Oil Company (ADNOC). In 2016, Dr. Al Seiari was appointed as the Acting Director-General of the Abu Dhabi Water & Electricity Authority (ADWEA). Al Seiari is Chairman of Taweelah Asia Power Company’s board of directors.
Qualifications and recognition: Al Seiari holds a PhD in petroleum engineering from Imperial College London, UK.
H.E. Salem Sultan Al Dhaheri TAQA Board Member
Elected to the Board in 2011.
Career and experience: H.E. Salem Sultan Al Dhaheri is currently Deputy Director at Abu Dhabi Investment Authority (ADIA), having held various positions since joining the authority in 1993. H.E. Al Dhaheri is also a Member of the Board of Directors and Member of the Audit Committee of several public and private companies.
Qualifications and recognition: H.E. Al Dhaheri is a Certified Public Accountant. He has a bachelor’s degree in accounting from Metropolitan State College in Denver, United States.
H.E. Mohammed Sahoo Al SuwaidiTAQA Board Member
Elected to the Board in 2017.
Career and experience: H.E. Mohammed Sahoo Al Suwaidi held his last position as the Chief Executive Officer of Nawah Energy Company, the company responsible for the operations and maintenance of the Barakah nuclear reactors in the UAE. H.E. Al Suwaidi also served as a Board Member of Emirates Nuclear Energy Corporation (ENEC) and Barakah One Company. H.E. AlSuwaidi has previously held top executive-level positions at Abu Dhabi National Oil Company (ADNOC) and its subsidiaries, including his position as Chief Executive Officer of Abu Dhabi Gas Industries Limited (GASCO) for over ten years. H.E. Al Suwaidi is a member of various committees in several other public and private companies. Currently H. E. AlSuwaidi is the Founder and Chairman of Equilibrium Engineering Consultancy.
Qualifications and recognition: Al Suwaidi holds a Bachelor’s Degree in Chemical Engineering from the University of Southern California in Los Angeles, United States.
2018 Annual Report
17

Business review Executive management
Awad Saeed Al KetbiExecutive Vice President Business Support
Awad Saeed Al Ketbi joined TAQA in 2014 and was appointed Executive Vice-President Business Support in 2016. He is responsible for TAQA’s HR, HSSE, IT, procurement, business continuity and general services functions. Al Ketbi was previously TAQA’s Chief Technology Officer.
Career and experience: Prior to joining TAQA, he held IT leadership positions at Tawazun Economic Council and Tawam Johns Hopkins Hospital in Abu Dhabi Emirate.
Qualifications and recognition: Al Ketbi has a bachelor’s degree in management information systems from the American University in Dubai.
Abdelmajid IraquiActing Executive Officer Global Power and Water
Abdelmajid Iraqui is responsible for managing TAQA’s global power and water businesses. He is also the Managing Director for the African business which includes TAQA Morocco, a listed company in the Casablanca Exchange and Takoradi International Company, a power plant in Ghana.
Career and experience: Before joining TAQA in 2006, Iraqui was CFO and regional Director at CMS Energy.
Qualifications and recognition: Iraqui has a bachelor’s degree in finance from Eastern Michigan University, and a master’s degree in business administration from the University of Michigan in the United States.
Saeed Hamad Al DhaheriChief Executive Officer
Saeed Hamad Al Dhaheri joined TAQA in 2014 and was appointed Chief Operating Officer in 2016. Al Dhaheri is a Board member at Massar Solutions, Sohar Aluminium and TAQA Morocco.
Career and experience: Prior to joining TAQA, Al Dhaheri held leadership positions at Abu Dhabi Media Company, Etihad Rail and Abu Dhabi Health Services Company (SEHA) and he previously served on the United Printing & Publishing Board of Directors.
Qualifications and recognition: Al Dhaheri has a master’s degree in management from Abu Dhabi University and bachelor’s degree in international business from Eckerd College, United States.
Our enhanced leadership commitment and strong balance sheet ensure that we are well placed to meet the opportunities and challenges that 2019 will present.
Abu Dhabi National Energy Company PJSC (TAQA)
18

Vivek GambhirGeneral Counsel
Vivek Gambhir joined TAQA in 2011 as Deputy General Counsel and was appointed Acting General Counsel in October 2015. He was appointed General Counsel in May 2017.
Career and experience: Prior to joining TAQA, Gambhir worked in London as a partner in an international law firm where he headed up their international power practice. Gambhir has worked in a number of jurisdictions on various international assignments, involving M&A, projects, regulatory and sector privatisations and restructuring.
Qualifications and recognition: Gambhir holds qualifications to practice law in England.
Saeed Rashed Al DareiExecutive Vice President, Government Affairs and Corporate Communications; Secretary of the Board of Directors
Saeed Rashed Al Darei joined TAQA in 2013 as its Executive Vice President for Government Affairs and Corporate Communications, where he manages the company’s public affairs, external communications to a variety of stakeholders, and investor relations.
Career and experience: Before joining TAQA in 2013, Al Darei served in leadership positions at several Abu Dhabi government entities, including the Department of Social Services and Commercial Buildings (DSSCB), the Department of Municipalities and Agriculture (DMA), the Department of Transport (DoT), and the Department of Civil Service (DCS). Al Darei contributed to several successful transformation programs across public sector entities and oversaw internal efforts to maximize efficiencies and reduce departmental redundancies.
Qualifications and recognition: Al Darei holds a bachelor’s degree in management, sociology, and leadership from Gonzaga University in the United States.
Mohammed Abdulla Al AhbabiChief Financial Officer
Mohammed Abdulla Al Ahbabi joined TAQA in January 2016 as deputy CFO and was appointed CFO in September 2016. He is responsible for TAQA’s corporate finance function.
Career and experience: Al Ahbabi started his career at Abu Dhabi Company for Onshore Oil Operations (ADCO). He joined Abu Dhabi Health Services Company (SEHA) in 2009 where he held the position of CFO before joining TAQA.
Qualifications and recognition: Al Ahbabi has a bachelor’s degree in finance and banking from United Arab Emirates University and an MBA from New York Institute of Technology.
2018 Annual Report
19
TAQA’s Board of Directors comprises seven Directors with a broad range of background and expertise.
Business review Corporate governance
Structure of the Board TAQA’s Board of Directors comprises seven Directors with a broad range of backgrounds, expertise and commercial experience. Each Director is elected for a term of three years and, at the end of that period, the Board may be reconstituted. Save for one Executive Director, all other Directors are Independent Directors and have technical skills and experience that will be of benefit to TAQA.
Whenever Directors are chosen, consideration is given to whether or not a Director is able to dedicate adequate time and effort to his or her membership and that such membership is not in conflict with his or her other interests. The Board meets in person on a periodic basis pursuant to a formal schedule.
The current Board members were elected during the Company’s Annual General Meeting held on 19 April 2017.
At a meeting of the Board held on the same date, H.E. Saeed Mubarak Al-Hajeri was elected as the Chairman of the Board of Directors.
Board Committees Presently the Board has the following two committees – each of which has been established by a written charter setting forth its scope and responsibilities:
• Audit Committee • Nomination and Remuneration Committee
Audit CommitteeThe main duties of the Audit Committee are monitoring the integrity of the Company’s financial statements and reports (annual reports, semi-annual reports, and quarterly reports) and reviewing the financial and accounting policies and procedures of the Company, as well as ensuring the independence of the Company’s external auditor. It is also responsible for evaluating the integrity and quality of the Company’s internal control policies and all the duties mentioned in Article 48 of the Chairman of Authority’s Board of Directors’ Resolution No. (7/R.M) and those specified below.
Whenever Directors are chosen, consideration is given to whether or not a Director is able to dedicate time and effort to his or her membership.
Abu Dhabi National Energy Company PJSC (TAQA)
20
The members of the Committee were appointed by the Board of Directors at its meeting held on 19 April 2017. The Audit Committee shall consist of the following members:
H.E. Salem Sultan Al Dhaheri (Chairman of the Committee)
H.E. Abdulaziz Abdulrahman Al Hemaidi Non-executive and independent member
H.E. Mohamed Sahoo Al Suwaidi Non-executive and independent member
The Committee holds its meetings at least once every three months and when needed. All members of the Audit Committee shall sign the minutes of the meetings of the Audit Committee. The Company shall also provide the Committee with the necessary and sufficient resources to perform its duties, including the use of experts, whenever necessary.
The Audit Committee was formed by virtue of the approval of the Board of Directors at its meeting held on 30 October 2007. The Committee’s Charter was adopted on 9 December 2007 and was revised and updated on 5 November 2017.
Nomination and Remuneration CommitteeThe basic duties of the Nomination and Remuneration Committee are to regularly ensure the independence of the independent Board members, to review the remuneration matters related to the Company, and to nominate members of the Board of Directors and determine their remuneration and all the basic duties included in Article (47) of the Chairman of Authority’s Board of Directors’ resolution No. (7 R.M).
The members of the Committee were appointed by the Board of Directors at the meeting held on 21 April 2017. The Nomination and Remuneration Committee consists of the following members:
H.E. Khalifa Ali Al Qamzi Chairman of the Committee - non-executive and independent member
H.E. Khaled Abdulla Al Mass Non-executive and independent member
H.E. Abdulaziz Abdulrahman Al Hemaidi Non-executive and independent member
The establishment of the Nomination and Remuneration Committee was approved by a resolution by the Board of Directors in a meeting held on 20 January 2008, and the Committee’s charter was last updated in November 2016 and approved by the Board on 6 December 2016.
Internal ControlsThe Company’s internal controls are processes designed to achieve the:
• effectiveness and efficiency of operations; • reliability of financial reporting; and• Compliance with laws and regulations. There are
two main components of the Company’s internal control system:
- The design, development and implementation of an effective internal control system, and
- The ongoing monitoring and review of the internal control system to test its fitness for purpose, and to confirm that the business is in compliance with it.
The Company’s internal controls are contained in the policies, procedures and systems that have been adopted by the Company and that are managed and implemented by multi-disciplinary officials including:
• Chief Executive Officer; • Chief Financial Officer; • General Counsel; • Vice President of Accounting and Control; • Vice President of Assurance and Internal Control; • Compliance officer; and • Heads of departments
The responsibility for implementing the internal controls framework rests with the CEO who manages the Company and provides guidance to the managers in charge of applying specific aspects of the internal control system and is accountable to the Board.
The Company’s internal control system consists of a series of documented policies and procedures, particularly the Code of Conduct, and accounting policies and procedures (which include a number of procedures designed to address financial issues and financial reports), as well as the delegation of authority policy, financial policies, treasury policies, anti-fraud policy, HSSE policy, and reporting policy. These policies and procedures help the company achieve its objectives within an effective ethical framework and provide appropriate means to direct, monitor and measure the Company’s resources and assist in analyzing the financial performance of the Company as well as playing an important role in preventing and controlling any fraud or other financial irregularities.
2018 Annual Report
21
Business review People
OverviewAchieving success in the increasingly dynamic and complex energy sector requires a resilient and empowered team of people. We recruit, train, and reward according to a strategy that strives to make TAQA a more efficient and effective organization.
As part of our long-term succession plan, we are focused on retaining and developing a deep pool of diversified talent as well as growing and strengthening our leadership capabilities. Our people are essential to the successful delivery of TAQA’s strategy and to a safe and sustainable organization.
At the end of 2018, TAQA announced the appointment of Saeed Hamad Al Dhaheri as Chief Executive Officer and Mohammed Abdulla Al Ahbabi as Chief Financial Officer of the TAQA Group.
In 2018, our current employees totaled 1,758 at TAQA group, shown by geographical area in the table below: Country 2018 2017
UAE 84 74
Morocco 479 480
United Kingdom 520 507
Canada 346 341
Iraq 123 67
The Netherlands 136 128
India 127 134
Ghana 79 78
United States * *
Saudi Arabia * *
Oman * *
*Not applicable; non-operated asset
2018 was also marked by several milestones at the group level. In addition to the publication of TAQA’s new HR policy, we undertook a global benchmarking study to better understand employee compensation challenges and worked with each business unit to address their concerns. We introduced several initiatives to enhance employee engagement, support career development, and ultimately retain our workforce.
Employee communication and involvementTAQA’s culture is underpinned by our strong corporate values. We strive to maintain a unified and collaborative organization by fostering an open and transparent workplace where discussion and the sharing of information is actively encouraged. On a quarterly basis, employees are briefed on our financial and operational results through various channels, including team meetings, Chairman and CEO announcements, and several other global messages.
We are committed to a safe and sustainable workplace and encourage feedback on our processes and procedures. The TAQA Whistleblowing Hotline, available across TAQA’s operations, enables employees and third-party service providers to report potential breaches of TAQA’s policies, procedures or operations, confidentially and anonymously, in a variety of languages.
Diversity and inclusionTAQA is continually looking to cultivate and sustain a diverse workforce. By promoting an inclusive environment and embracing our different backgrounds, we are better placed to achieve strong financial and operational performance and deliver long-term value.
TAQA’s commitment to diversity and inclusion extends to all areas of business. Our leaders understand the importance of empowering individuals to thrive and succeed. Our efforts to champion diversity are supported by a range of approaches including talent acquisition, community engagement, and leadership visibility. In addition, we actively monitor the representation of women and UAE nationals in leadership positions and have recently redesigned our internship program to encourage more Emiratis to consider a career at TAQA.
65%TAQA’s Headquarters are UAE Nationals
1,758Number of employees as of December 2018.
12.2%Percentage of women in senior positions
11CountriesOf operation
As part of our long-term succession plan, we are focused on retaining and developing a deep pool of diversified talent as well as growing and strengthening our leadership capabilities.
TAQA’s success depends on having a talented and diverse workforce.
Abu Dhabi National Energy Company PJSC (TAQA)
22
Percentage of female employees in senior leadership positions:Country 2018 2017
UAE 13.63% 10%
Morocco 13% 13%
United Kingdom 9.7% 8.4%
Canada 26% 27%
Iraq 5% 10%
The Netherlands 10% 12.5%
India 8.3% 8.3%
Ghana 1.3% 1.3%
United States * *
Saudi Arabia * *
Oman * *
*Not applicable; non-operated asset
EmiratizationIn line with the UAE government’s initiative to increase the number of UAE local talent in the public and private sectors, TAQA expanded its Emirati workforce to 65% in 2018. TAQA has long championed Emiratization efforts to create an environment to foster entrepreneurship and skills growth among qualified UAE nationals.
The nationwide policy of Emiratization seeks to address a growing divide and underrepresentation of UAE nationals in both public and private sectors. The initiative, which has been a top priority since 2015 aims to ensure nationals are gaining meaningful employment that will contribute to the sustainable growth of the UAE’s knowledge-based economy.
In 2018, TAQA prioritized attracting talent in senior and middle management in its core business, with notable growth of UAE national talent in its finance and UAE and GCC power and water departments. As of 2018, all our business functions are led by UAE nationals.
Leveraging our global presence, we introduced an on-site training program for UAE nationals to participate in specific projects at regional business units to encourage knowledge transfer and technical skills development. TAQA has also launched work placement internships and an internship program to help equip young Emiratis with skills required for the job market.
ValuesWe assess any exposure to bribery and corruption risk when working with suppliers and business partners. Where appropriate, we put in place a risk mitigation plan or we reject them if we conclude that risks are too high.
We prohibit the use of TAQA funds or resources to support any political matter. We recognize the rights of our employees to participate in the political process and these rights are governed by the applicable laws in the countries in which we operate. We work with governments on a range of issues that are relevant to our business, from regulatory compliance, to understanding our tax liabilities, to collaborating on community initiatives. The way in which we interact with those governments depends on the legal and regulatory framework in each country.
TAQA’s commitment to diversity and inclusion extends to all areas of business.
We are committed to a safe and sustainable workplace and encourage feedback on our processes and procedures.
2018 Annual Report
23
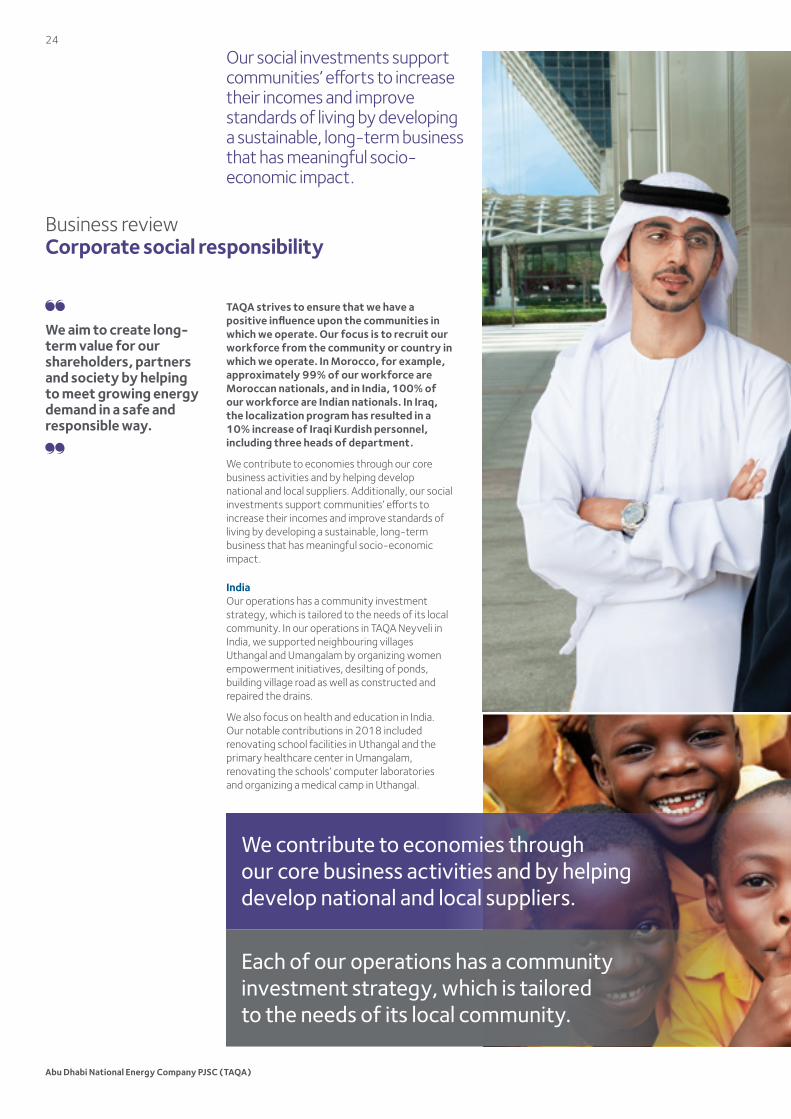
Each of our operations has a community investment strategy, which is tailored to the needs of its local community.
We contribute to economies through our core business activities and by helping develop national and local suppliers.
Business review Corporate social responsibility
TAQA strives to ensure that we have a positive influence upon the communities in which we operate. Our focus is to recruit our workforce from the community or country in which we operate. In Morocco, for example, approximately 99% of our workforce are Moroccan nationals, and in India, 100% of our workforce are Indian nationals. In Iraq, the localization program has resulted in a 10% increase of Iraqi Kurdish personnel, including three heads of department.
We contribute to economies through our core business activities and by helping develop national and local suppliers. Additionally, our social investments support communities’ efforts to increase their incomes and improve standards of living by developing a sustainable, long-term business that has meaningful socio-economic impact.
IndiaOur operations has a community investment strategy, which is tailored to the needs of its local community. In our operations in TAQA Neyveli in India, we supported neighbouring villages Uthangal and Umangalam by organizing women empowerment initiatives, desilting of ponds, building village road as well as constructed and repaired the drains.
We also focus on health and education in India. Our notable contributions in 2018 included renovating school facilities in Uthangal and the primary healthcare center in Umangalam, renovating the schools’ computer laboratories and organizing a medical camp in Uthangal.
Our social investments support communities’ efforts to increase their incomes and improve standards of living by developing a sustainable, long-term business that has meaningful socio-economic impact.
We aim to create long-term value for our shareholders, partners and society by helping to meet growing energy demand in a safe and responsible way.
Abu Dhabi National Energy Company PJSC (TAQA)
24
GhanaIn 2018, the management in Ghana put in place an appropriate organizational structure to effectively identity, monitor, and manage CSR issues and performance. Education, environment, and health were key pillars for CSR activities designed to capture the expectations of the communities, primarily through Shama District Assembly, the traditional council.
TAQA’s office in Ghana re-launched the Larry Kramer Scholarship scheme for residents of the Aboadze region. Two hundred students at the tertiary level received both financial and learning material support from the company.
TAQA’s office in Ghana donated equipment to the Secondi School for the Deaf to improve the physical activities of the students.
In collaboration with TAQA’s Ghana office, the Shama District Education Directorate organized annual mock exams for the Basic Education Certificate of Examinations (BECE). These exams prepared candidates for the nationwide BECE. Since inception of this collaborative effort, students’ performance has improved significantly. In addition to the BECE Mock Examination, TAQA sponsored the Shama District 2018 Inter Basic Schools Science, Mathematics, and ICT Quiz competition. This contest is an annual program aiming at promoting mathematics and science studies.
In collaboration with Radio Maxx, Radio Maxx, a local radio station in Takoradi, TAQA’s Ghana office organized a blood donation drive. The purpose was to support efforts to saving lives in the Western Region. TAQA Ghana employees, personnel of the security services, and the local community members donated blood.
Finally, TAQA Ghana hosted a half-day event called “Pink Friday” in October 2018 to support breast cancer awareness through breast cancer information and screening for female employees and spouses of male employees.
MoroccoTAQA Morocco aims to provide 15,000 low-income patients with chemotherapy through the Lalla Salma Cancer Foundation. By supporting medical research, TAQA also aims to contribute to oncology centers in different towns throughout Morocco, making the fight against cancer a national public health priority.
TAQA Morocco is also the partner of an emergency medical assistance service deployed throughout the province of El Jadida, serving a population of almost 635,000 with a 24/7 hotline. The emergency medical service (SAMU), which meets international standards, facilitates thousands of free emergency treatments through five medical centres set up in El Jadida, Sidi Smaïl, Ouled Frej, Bir Jdid and Ouled Ghanem.
Additionally, TAQA Morocco joined forces with the Sheikh Zayed Bin Sultan Foundation to provide free and quality healthcare to communities located in remote, rural areas. Medical missions are carried out by a multidisciplinary mobile medical unit operated by TAQA, with the support of medical and paramedical teams from the
Sheikh Zayed Hospital (doctors, nurses and volunteers). This real mobile multidisciplinary diagnostic centre, combined with an ocular surgery unit, enabled over 125 cataract surgeries and 1,480 medical diagnoses to be carried out in the region of El Jadida in 2018.
TAQA Morocco also supported the Bab Rayan association by providing accommodation, education and protection for orphaned, abandoned, or mistreated children at a home, specially designed to accommodate them in Casablanca. Bab Rayan has the capacity to accommodate 60 children who are given the opportunity to build a future and grow up in a dignified manner.
EuropeAcross the TAQA Europe organization, employees raised over £60,000 through the organization and participation of various fundraising initiatives for their selected charities of the year, including Royal National Lifeboat Institution (RNLI), Sandpiper Trust and Hersenstichting.
In the Netherlands, Culture Fund donations are aimed at cultural activities and are spread over the municipalities that surround TAQA’s land activities. Areas of operation around Alkmaar, specifically Bergen, are very culturally-oriented, and our support to community activities is greatly valued.
In the United Kingdom, one of TAQA’s goals is to strengthen education in science, technology, engineering, and math (STEM), in recognition of the growing shortage of individuals with these skills, which are vital for the future of the oil and gas industry. In 2018 alone, we reached over 2,000 local primary and secondary school students with STEM messages across 50 schools.
Education initiatives include sponsorship of the Grampian heats of the national Greenpower competition, which challenges students to design, construct, and race electric cars; funding for the purchase of materials for several local schools in northeast Scotland to participate in the Greenpower challenge via the Young Engineers and Science Club Scotland (YESCS); sponsorship of the Engineering Club at Aberdeen Science Center, enabling children aged 9-12 years to discover more about the world of engineering; funding as part of a collaborative effort across the industry for a NASA Astronaut to come to Aberdeen and deliver a STEM based program to schools and the public; and the Northsound 1 Schools Energy Challenge, in association with the Energy Institute, providing school pupils from across Aberdeen City and Shire the opportunity to showcase their general knowledge and gain an insight into the oil and gas industry.
On the environmental side, TAQA sponsors new child-friendly signage in Arnhall Moss Nature reserve, close to TAQA’s offices in Aberdeen, Scotland. This has involved local schools in the design of the signage. In addition, TAQA continues to sponsor the Outdoor Access Trust for Scotland, with the aim to preserve and protect, for the benefit of the public, the natural heritage and environment of Scotland. TAQA teams have also volunteer and participated in team building as part of these community projects.
2018 Annual Report
25

TAQA also sponsors the interns’ uniforms at Project SEARCH, a one-year training for employment scheme for young people with additional needs, run in partnership with Inspire Ltd, The University of Aberdeen and North East Scotland College.
IraqTAQA’s office in Erbil prioritized three areas for CSR investment in 2018, based off a socioeconomic survey conducted by TAQA in coordination with the Kurdistan Regional Government to have the highest impact for communities in Atrush: agriculture, education and training, and women and youth. In 2018, TAQA Iraq invested a total of AED 2.1 million as part of a third phase of its five-year plan for CSR activities, which spans 2016 to 2020,
Under the agriculture program, TAQA Iraq focused on horticulture and wheat projectivity projects for more than 15 villages with involvement of more than 519 farmers. TAQA provided training and tools to all the participants, and, as a result, wheat productivity increased by 300% to 500%. The quality of the wheat also increased to Grade 1, based off of KRG criteria, which will continue to generate more income for the farmers in communities around the Atrush Block.
In an effort to support educational initiatives in local communities, TAQA Iraq continued to invest in the pipeline welding center at Duhok Polytechnic University. TAQA launched a four-month train the trainer program for local instructors and six-month training program for fresh graduates to enhance technical skillsets among workers in an effort to help strengthen the local economy. TAQA Iraq also donated materials to 22 schools within Atrush Block communities, including more than 4,000 backpacks for students ranging from primary school through high school, along with 40 kerosene heaters and 10,600 liters of kerosene to heat the schools in winter.
As part of its programming to support women and youth in surrounding communities, TAQA Iraq supported a formal education program to promote literacy among women, resulting in 72 women becoming certified in three training centers opened by TAQA Iraq, which was later converted to a formally recognized school by the KRG’s Ministry of Education. Similarly, TAQA Iraq provided English training courses to more than 250 young people throughout Atrush Block communities.
Finally, TAQA also launched an environmental sustainability program in 2018. TAQA is the first oil company in the Kurdistan Region of Iraq to focus on segregating recyclable Polyethylene Terephthalate (PET) plastic caps and making a positive impact in the local community. To encourage more people to recycle out in the field, the team decided to champion a cause that would directly and positively impact the community around them and, at the same time, compel people to incorporate sustainable practices into their daily lives. Each time the Atrush Block met their target of 15 18-liter barrels filled with plastic caps, TAQA donates a wheelchair to a family in need.
Capitalizing on the success of the current program, the TAQA HSSE team in Iraq aims to expand the recycling program to include a potential partnership with the University of Kurdistan and the Technical University of Ostrava in Erbil to make furniture out of recycled plastic.
CanadaTAQA North has an active community outreach program, focused mainly in Calgary and our key field operations areas of Crossfield (Southern Alberta), Rocky Mountain House (Central Alberta) and Grande Prairie (Northern Alberta). Notable organizations supported in this space in 2018 included STARS Air Ambulance, The Alberta Children’s Hospital and The United Way.
We continued to prioritize meaningful engagement with local communities. Our TAQA Cares campaign had our employees volunteering at local homeless shelters, food banks and the Alberta Children’s Hospital as well as raising funds for the United Way. A new initiative aligned with our Wellness strategy included raising funds and awareness for the Canadian Mental Health Association (CMHA). We raised C$12,700 in support of the CMHA – Calgary region. We also maintained our long term commitments with STARS Air Ambulance and the Neocritical Unit at The Alberta Children’s Hospital.
Business review Corporate social responsibilityContinued
Abu Dhabi National Energy Company PJSC (TAQA)
26
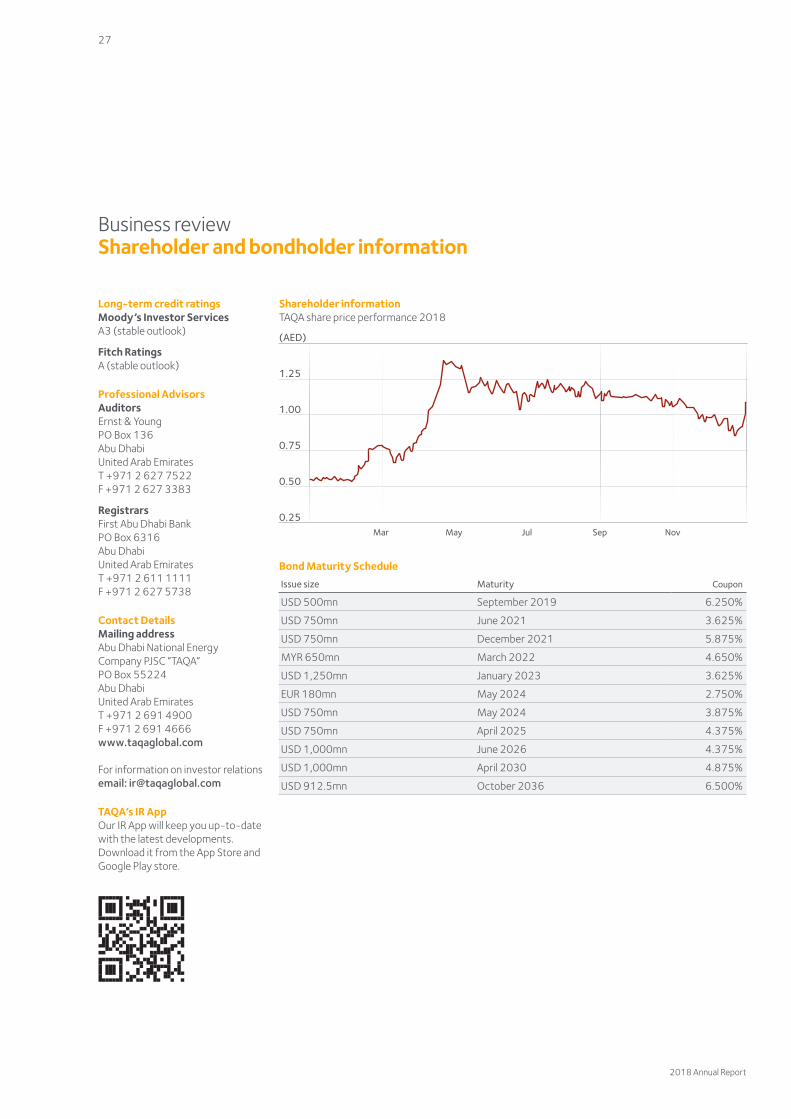
Business review Shareholder and bondholder information
Shareholder informationTAQA share price performance 2018
(AED)
1.25
1.00
0.75
0.50
0.25Mar May Jul Sep Nov
Bond Maturity ScheduleIssue size Maturity Coupon
USD 500mn September 2019 6.250%
USD 750mn June 2021 3.625%
USD 750mn December 2021 5.875%
MYR 650mn March 2022 4.650%
USD 1,250mn January 2023 3.625%
EUR 180mn May 2024 2.750%
USD 750mn May 2024 3.875%
USD 750mn April 2025 4.375%
USD 1,000mn June 2026 4.375%
USD 1,000mn April 2030 4.875%
USD 912.5mn October 2036 6.500%
Long-term credit ratingsMoody’s Investor Services A3 (stable outlook)
Fitch Ratings A (stable outlook)
Professional Advisors Auditors Ernst & Young PO Box 136 Abu Dhabi United Arab Emirates T +971 2 627 7522 F +971 2 627 3383
Registrars First Abu Dhabi Bank PO Box 6316 Abu Dhabi United Arab Emirates T +971 2 611 1111 F +971 2 627 5738
Contact Details Mailing addressAbu Dhabi National Energy Company PJSC “TAQA” PO Box 55224 Abu Dhabi United Arab Emirates T +971 2 691 4900 F +971 2 691 4666 www.taqaglobal.com
For information on investor relationsemail: [email protected]
TAQA’s IR App Our IR App will keep you up-to-date with the latest developments. Download it from the App Store and Google Play store.
2018 Annual Report
27

Financial statements29 Abu Dhabi National Energy Company PJSC (TAQA) Board report30 Independent auditor’s report to the shareholders of
Abu Dhabi National Energy Company PJSC (TAQA)33 Consolidated income statement34 Consolidated statement of comprehensive income35 Consolidated statement of financial position36 Consolidated statement of changes in equity37 Consolidated statement of cash flows38 Notes to the consolidated financial statements
Abu Dhabi National Energy Company PJSC (TAQA)
28
Financial statements Abu Dhabi National Energy Company PJSC (TAQA) Board report
On behalf of the Board of Directors of Abu Dhabi National Energy Company PJSC ("TAQA" or "The Company"), I am pleased to present the financial statements of TAQA for the year ended 31 December 2018.
In 2018, TAQA demonstrated strong financial results both operationally and strategically as we drove our businesses towards achieving higher growth and better returns. While the shape and dynamics of the overall business is changing, TAQA's 2018 results reflect an overall positive operational performance, which reaffirms the successful implementation of our business strategy and is testament to the commitment and hard work of our employees.
TAQA reported profit attributable to equity holders of the parent of AED 398 million, an increase of 149 percent year-on-year. Revenues also grew by 6 percent in 2018 to AED 17.7 billion and EBITDA grew by 6 percent to AED 9.7 billion, mainly driven by an increase in oil and liquid prices in 2018.
Free cash-flow generation remained strong at AED 7.1 billion despite higher capital expenditures, which increased from AED 1.3 billion in 2017 to AED 1. 7 billion in 2018. TAQA's capex was completely self-funded by cash generated from the Company's operations and was focused on sustaining and developing its power & water and oil & gas assets, positioning the company to leverage future growth opportunities.
The Company reduced its total debt by AED 4.0 billion, and reduced interest paid by AED 163 million during 2018. The robust financial performance has resulted in improved leverage ratios where Net Debt-to-EBITDA multiple improved to 6.5 from 7.3 the year before.
Full year 2018 financial highlights:• 2018 profit for the year (TAQA-Share) was AED 398 million
versus AED 160 million for 2017.
• 2018 Group revenues topped AED 17.7 billion, a 6% improvement versus 2017 revenues of AED 16. 7 billion.
• 2018 EBITDA was AED 9.7 billion, a 7% increase versus 2017 (AED 9.1 billion) mainly due to improved performances in Europe, a full year of operation in Iraq, and the recognition of Sohar's insurance proceeds in the current year's results
• Total liquidity at the year-end remains strong at AED 13.1 billion including AED 3.4 billion in cash and cash equivalents, and AED 9.7 billion of undrawn credit facilities.
• Total debt was reduced by AED 4 billion, while total interest paid was reduced by AED 163 million when compared to the same period in 2017.
• Free cash-flow generation remained strong at AED 7.1 billion despite higher capital expenditures, which increased from AED 1.3 billion in 2017 to AED 1. 7 billion in 2018.
Operational highlights: Power and Water• Global power generation for the year was 89,922 GWh, showing
a small improvement on the 89,846 generated in 2017.
• Global technical availability was 93.1% for 2018, compared to 92.1% in 2017.
• The UAE portfolio of assets improved by 0.9% to 93.6% in 2018.
• The UAE power generation remained stable with 63,637 GWh produced in 2018, a slight reduction compared to 64,064 GWh produced in 2017.
• UAE Water desalination was 246,556 million imperial gallons (MIG) for the year, versus 249,469 MIG in 2017.
Operational highlights: Oil and Gas• Average production for the year was 123,100 boe/d, which was
slightly down compared to 126,188 boe/d in 2017.
• Production in North America remained broadly consistent compared to last year at 78,024 boepd, however, the impacts of natural decline and unplanned outages in the Group's North Sea assets has resulted in lower production from our European operations.
• European hydrocarbon production for 2018 was 41,221 boe/d, down from 46,504 boe/d in the prior year.
• Atrush block in Kurdistan entitlement production was 3,855 boe/d in 2018 versus 1,844 boe/d in 2017.
• Increased volumes from the Atrush block in Kurdistan, which commenced operations in July 2017, partially offset the overall decline in volumes.
Saeed Mubarak Al Hajeri Chairman of the BoardAbu Dhabi National Energy Company PJSC (TAQA)
2018 Annual Report
29
Report on the Audit of the Consolidated Financial Statements
OpinionWe have audited the consolidated financial statements of Abu Dhabi National Energy Company PJSC (“TAQA”) and its subsidiaries (the “Group”), which comprise of the consolidated statement of financial position as at 31 December 2018 and the consolidated income statement, consolidated statement of comprehensive income, consolidated statement of changes in equity and consolidated statement of cash flows for the year then ended, and notes to the consolidated financial statements, including a summary of significant accounting policies.
In our opinion, the accompanying consolidated financial statements present fairly, in all material respects the consolidated financial position of the Group as at 31 December 2018, and its consolidated financial performance and its consolidated cash flows for the year then ended in accordance with International Financial Reporting Standards (“IFRSs”).
Basis for opinionWe conducted our audit in accordance with International Standards on Auditing (“ISAs”). Our responsibilities under those standards are further described in the Auditor’s responsibilities for the Audit of the Consolidated Financial Statements section of our report. We are independent of the Group in accordance with the International Ethics Standards Board for Accountants’ Code of Ethics for Professional Accountants (“IESBA Code”) together with the ethical requirements that are relevant to our audit of the consolidated financial statements in the United Arab Emirates, and we have fulfilled our other ethical responsibilities in accordance with these requirements and the IESBA Code. We believe that the audit evidence we have obtained is sufficient and appropriate to provide a basis for our opinion.
Key audit mattersKey audit matters are those matters that, in our professional judgment, were of most significance in our audit of the consolidated financial statements of the current period. These matters were addressed in the context of our audit of the consolidated financial statements as a whole, and in forming our opinion thereon, and we do not provide a separate opinion on these matters. For each matter below, our description of how our audit addressed the matter is provided in that context.
We have fulfilled the responsibilities described in the Auditor’s responsibilities for the Audit of the Consolidated Financial Statements section of our report, including in relation to these matters. Accordingly, our audit included the performance of procedures designed to respond to our assessment of the risks of material misstatement of the consolidated financial statements. The results of our audit procedures, including the procedures performed to address the matters below, provide the basis for our audit opinion on the accompanying consolidated financial statements.
Impairment assessment of oil and gas assets at TAQA North, TAQA Bratani, TAQA Energy and TAQA AtrushThe Group has significant interests in oil and gas assets mainly in Canada, United Kingdom, Netherlands and Iraq. Management performed an impairment test with respect to the oil and gas assets since indicators of impairment existed at the balance sheet date.
This area was important to our audit as the assessment process was complex and judgmental and was based on assumptions that are affected by expected future market or economic conditions. The impairment assessment requires management to make assumptions to be used in the underlying cash flow forecasts. The assumptions include a forecast of oil and gas prices, discount rates, estimation of oil and gas reserves, valuation of contingent resources and overall market and economic conditions, which have been disclosed in note 11 of the consolidated financial statements.
How our audit addressed the area of focusWe have assessed the risk associated with the carrying value of the oil and gas assets, many of which are supported by an assessment of future cash flows by performing audit procedures on impairment assessments undertaken by management.
We worked with our oil and gas and valuation experts and utilised external data in assessing and corroborating the assumptions used in impairment testing, the most significant being future market oil and gas prices, reserves and resources volumes, foreign exchange rates and discount rates. We also performed audit procedures on the mathematical integrity of the impairment models and undertook sensitivity analysis and procedures to evaluate the completeness of the impairment charge and exploration costs write offs.
We also assessed whether the consolidated financial statement disclosures appropriately reflect the requirements of IFRS relating to oil and gas asset impairments.
Impairment assessment of property, plant and equipment for local independent water and power producers (“IWPPs”)Certain components of the Group have entered into a number of Power and Water Purchase Agreements (“PWPA”) locally in the United Arab Emirates, with an offtaker, for periods which are shorter than the economic life of the plants, which was an impairment trigger. Management has performed its impairment test with respect to these assets (classified as property, plant and equipment) with a carrying value of AED 37,395 million as at 31 December 2018. Management’s impairment analysis was significant to our audit because the assessment of the recoverable value of the plants incorporates significant assumptions, mainly relating to cash flows beyond the term of the contracts, including an assumption of the expected extension of the PWPAs and operating costs, availability of new technology, requirements of the country and economic estimates such as discount rates and inflation rates used to project the future cash flows. Further, the carrying amount of property, plant and equipment affected by the above assumptions represents 38% of the total assets of the Group and was therefore material to the consolidated financial statements.
Financial statements Independent auditor’s report to the shareholders of Abu Dhabi National Energy Company PJSC (TAQA)
Abu Dhabi National Energy Company PJSC (TAQA)
30
Report on the Audit of the Consolidated Financial Statements continued
Key audit matters continued
Impairment assessment of property, plant and equipment for local independent water and power producers (“IWPPs”) continued
How our audit addressed the area of focusWe involved component auditors to perform audit procedures in respect of the risk-adjusted models for the plant which included an assessment of the prices used during the expected extension period of the PWPA, operating costs, inflation rates and the discount rates used. We involved the component auditors in the assessment of the probability weightings applied to differing scenarios and the validation of the mathematical integrity of the valuation models developed by management as part of the impairment assessment. The component auditors were involved in analysing the extent to which these assumptions would need to change before the impact was material and assessed the likelihood of these movements occurring. We also assessed the disclosures in note 11 relating to the significant assumptions and analysis performed by management.
Other information included in the Annual ReportOther information consists of the information included in Annual Report, other than the consolidated financial statements and our auditor’s report thereon. We obtained the Board of Directors’ Report, prior to the date of our auditor’s report, and we expect to obtain the remaining sections of the Annual Report after the date of our auditor’s report. Management is responsible for the other information.
Our opinion on the consolidated financial statements does not cover the other information and we do not express any form of assurance conclusion thereon.
In connection with our audit of the consolidated financial statements, our responsibility is to read the other information and, in doing so, consider whether the other information is materially inconsistent with the consolidated financial statements or our knowledge obtained in the audit or otherwise appears to be materially misstated. If, based on the work we have performed, we conclude that there is a material misstatement of this other information, we are required to report that fact. We have nothing to report in this regard.
Responsibilities of the Management and Those Charged with Governance for the Consolidated Financial StatementsManagement is responsible for the preparation and fair presentation of these consolidated financial statements in accordance with IFRSs and in compliance with the applicable provisions of the Company’s Articles of Association and the UAE Federal Law No. (2) of 2015, and for such internal control as management determines is necessary to enable the preparation of consolidated financial statements that are free from material misstatement, whether due to fraud or error.
In preparing the consolidated financial statements, management is responsible for assessing the Group’s ability to continue as a going concern, disclosing, as applicable, matters related to going concern and using the going concern basis of accounting unless management either intends to liquidate the Group or to cease operations, or has no realistic alternative but to do so.
Those charged with governance are responsible for overseeing the Group’s financial reporting process.
Auditor’s Responsibilities for the Audit of the Consolidated Financial Statements Our objective is to obtain reasonable assurance about whether the consolidated financial statements as a whole are free from material misstatement, whether due to fraud or error, and to issue an auditor’s report that includes our opinion. Reasonable assurance is a high level of assurance, but is not a guarantee that an audit conducted in accordance with ISAs will always detect a material misstatement when it exists. Misstatements can arise from fraud or error and are considered material if, individually or in the aggregate, they could reasonably be expected to influence the economic decisions of users taken on the basis of these consolidated financial statements.
As part of an audit in accordance with ISAs, we exercise professional judgment and maintain professional skepticism throughout the audit. We also:
• Identify and assess the risks of material misstatement of the consolidated financial statements, whether due to fraud or error, design and perform audit procedures responsive to those risks, and obtain audit evidence that is sufficient and appropriate to provide a basis for our opinion. The risk of not detecting a material misstatement resulting from fraud is higher than for one resulting from error, as fraud may involve collusion, forgery, intentional omissions, misrepresentations, or the override of internal control.
• Obtain an understanding of internal control relevant to the audit in order to design audit procedures that are appropriate in the circumstances, but not for the purpose of expressing an opinion on the effectiveness of the Group’s internal control.
• Evaluate the appropriateness of accounting policies used and the reasonableness of accounting estimates and related disclosures made by management.
• Conclude on the appropriateness of management’s use of the going concern basis of accounting and, based on the audit evidence obtained, whether a material uncertainty exists related to events or conditions that may cast significant doubt on the Group’s ability to continue as a going concern. If we conclude that a material uncertainty exists, we are required to draw attention in our auditor’s report to the related disclosures in the consolidated financial statements or, if such disclosures are inadequate, to modify our opinion. Our conclusions are based on the audit evidence obtained up to the date of our auditor’s report. However, future events or conditions may cause the Group to cease to continue as a going concern.
• Evaluate the overall presentation, structure and content of the consolidated financial statements, including the disclosures, and whether the consolidated financial statements represent the underlying transactions and events in a manner that achieves fair presentation.
• Obtain sufficient appropriate audit evidence regarding the financial information of the entities or business activities within the Group to express an opinion on the consolidated financial statements. We are responsible for the direction, supervision and performance of the group audit. We remain solely responsible for our audit opinion.
2018 Annual Report
31
Report on the Audit of the Consolidated Financial Statements continued
Auditor’s Responsibilities for the Audit of the Consolidated Financial Statements continuedAuditor’s Responsibilities for the Audit of the Consolidated Financial Statements continued We communicate with those charged with governance regarding, among other matters, the planned scope and timing of the audit and significant audit findings, including any significant deficiencies in internal control that we identify during our audit.
We also provide those charged with governance with a statement that we have complied with relevant ethical requirements regarding independence, and to communicate with them all relationships and other matters that may reasonably be thought to bear on our independence, and where applicable, related safeguards.
From the matters communicated with those charged with governance, we determine those matters that were of most significance in the audit of the consolidated financial statements of the current period and are therefore the key audit matters. We describe these matters in our auditor’s report unless law or regulation precludes public disclosure about the matter or when, in extremely rare circumstances, we determine that a matter should not be communicated in our report because the adverse consequences of doing so would reasonably be expected to outweigh the public interest benefits of such communication.
Report on Other Legal and Regulatory RequirementsAs required by the UAE Federal Law No. (2) of 2015, we report that:
i) we have obtained all the information and explanations we considered necessary for the purposes of our audit;
ii) the consolidated financial statements have been prepared and comply, in all material respects, with the applicable provisions of the UAE Federal Law No. (2) of 2015, and the Articles of Association of the Company;
iii) the Company has maintained proper books of account;iv) the financial information included in the Board of Directors’
report is consistent with the books of account and records of the Company;
v) based on the information that has been made available to us, the Company has not purchased or invested in any shares or stocks during the year ended 31 December 2018;
vi) note 34 reflects the disclosures relating to related party transactions and the terms under which they were conducted;
vii) note 7 reflects the disclosure relating to social contributions made during the year; and
viii) based on the information that has been made available to us nothing has come to our attention which causes us to believe that the Company has contravened, during the financial year ended 31 December 2018, any of the applicable provisions of the UAE Federal Law No. (2) of 2015 or of its Articles of Association which have a material impact on its activities or its financial position as at 31 December 2018.
Further, as required by the Decree of the Chairman of the Abu Dhabi Accountability Authority No. (1) of 2017 pertaining to Auditing the Financial Statements of Subject Entities, we report that based on the information provided to us, nothing has come to our attention that causes us to believe that the Company has not complied, in all material respects, with any of the provisions of the following laws, regulations and circulars as applicable, which would materially affect its activities or the financial statements as at 31 December 2018:
i) Law No. (1) of 2017 concerning the Financial System of the Government of Abu Dhabi and instructions issued by the Department of Finance pertaining to the preparation and implementation of the annual budget of Subject Entities;
ii) Law of establishment; and iii) Relevant provisions of the applicable laws, resolutions and
circulars organising the Company’s operations.
Signed by
Mohammad Mobin KhanPartnerErnst & YoungRegistration No. 532
20 March 2019Abu Dhabi
Financial statementsIndependent auditor’s report to the shareholders of Abu Dhabi National Energy Company PJSC (TAQA) continued
Abu Dhabi National Energy Company PJSC (TAQA)
32
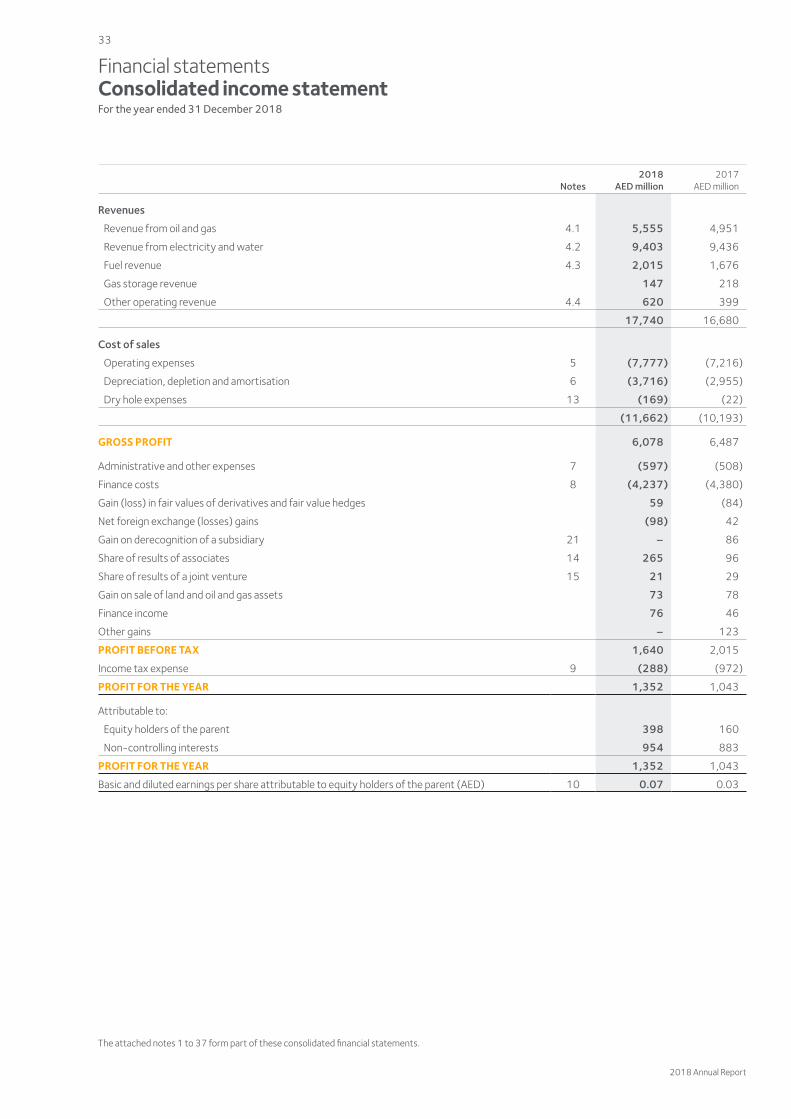
Notes2018
AED million2017
AED million
Revenues
Revenue from oil and gas 4.1 5,555 4,951
Revenue from electricity and water 4.2 9,403 9,436
Fuel revenue 4.3 2,015 1,676
Gas storage revenue 147 218
Other operating revenue 4.4 620 399
17,740 16,680
Cost of sales
Operating expenses 5 (7,777) (7,216)
Depreciation, depletion and amortisation 6 (3,716) (2,955)
Dry hole expenses 13 (169) (22)
(11,662) (10,193)
GROSS PROFIT 6,078 6,487
Administrative and other expenses 7 (597) (508)
Finance costs 8 (4,237) (4,380)
Gain (loss) in fair values of derivatives and fair value hedges 59 (84)
Net foreign exchange (losses) gains (98) 42
Gain on derecognition of a subsidiary 21 – 86
Share of results of associates 14 265 96
Share of results of a joint venture 15 21 29
Gain on sale of land and oil and gas assets 73 78
Finance income 76 46
Other gains – 123
PROFIT BEFORE TAX 1,640 2,015
Income tax expense 9 (288) (972)
PROFIT FOR THE YEAR 1,352 1,043
Attributable to:
Equity holders of the parent 398 160
Non-controlling interests 954 883
PROFIT FOR THE YEAR 1,352 1,043
Basic and diluted earnings per share attributable to equity holders of the parent (AED) 10 0.07 0.03
Financial statements Consolidated income statementFor the year ended 31 December 2018
The attached notes 1 to 37 form part of these consolidated financial statements.
2018 Annual Report
33
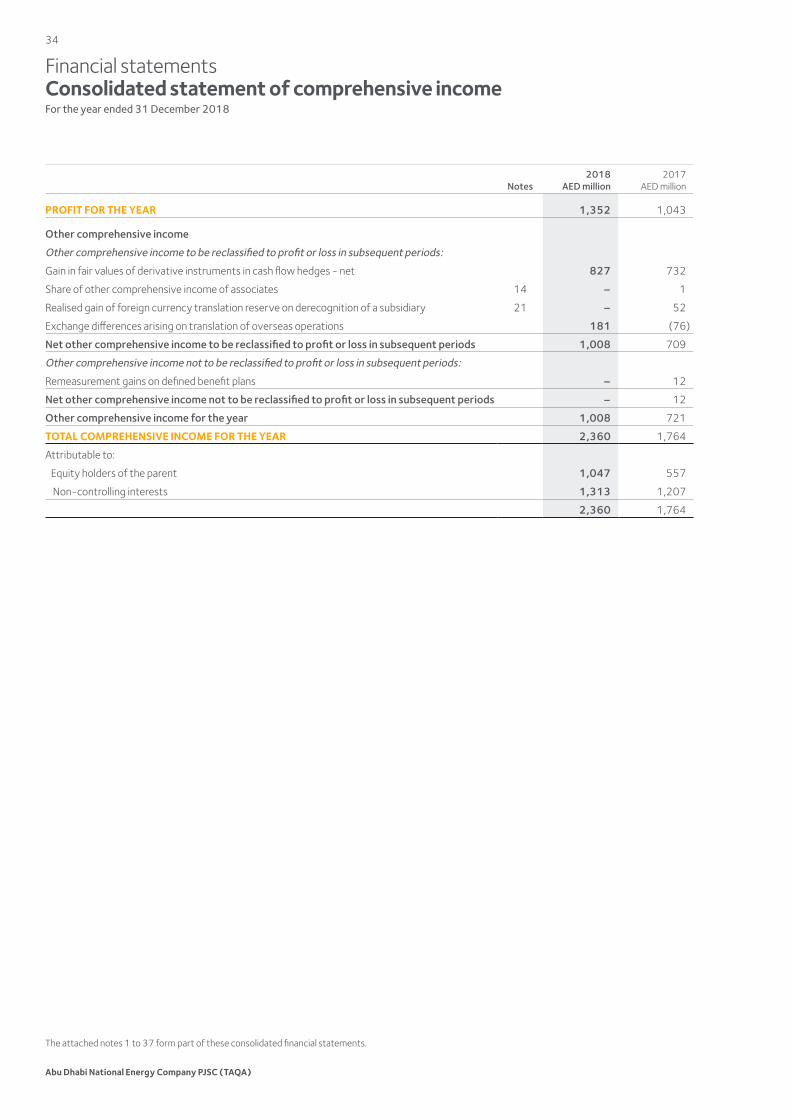
Notes2018
AED million2017
AED million
PROFIT FOR THE YEAR 1,352 1,043
Other comprehensive income
Other comprehensive income to be reclassified to profit or loss in subsequent periods:
Gain in fair values of derivative instruments in cash flow hedges - net 827 732
Share of other comprehensive income of associates 14 – 1
Realised gain of foreign currency translation reserve on derecognition of a subsidiary 21 – 52
Exchange differences arising on translation of overseas operations 181 (76)
Net other comprehensive income to be reclassified to profit or loss in subsequent periods 1,008 709
Other comprehensive income not to be reclassified to profit or loss in subsequent periods:
Remeasurement gains on defined benefit plans – 12
Net other comprehensive income not to be reclassified to profit or loss in subsequent periods – 12
Other comprehensive income for the year 1,008 721
TOTAL COMPREHENSIVE INCOME FOR THE YEAR 2,360 1,764
Attributable to:
Equity holders of the parent 1,047 557
Non-controlling interests 1,313 1,207
2,360 1,764
Financial statements Consolidated statement of comprehensive incomeFor the year ended 31 December 2018
The attached notes 1 to 37 form part of these consolidated financial statements.
Abu Dhabi National Energy Company PJSC (TAQA)
34
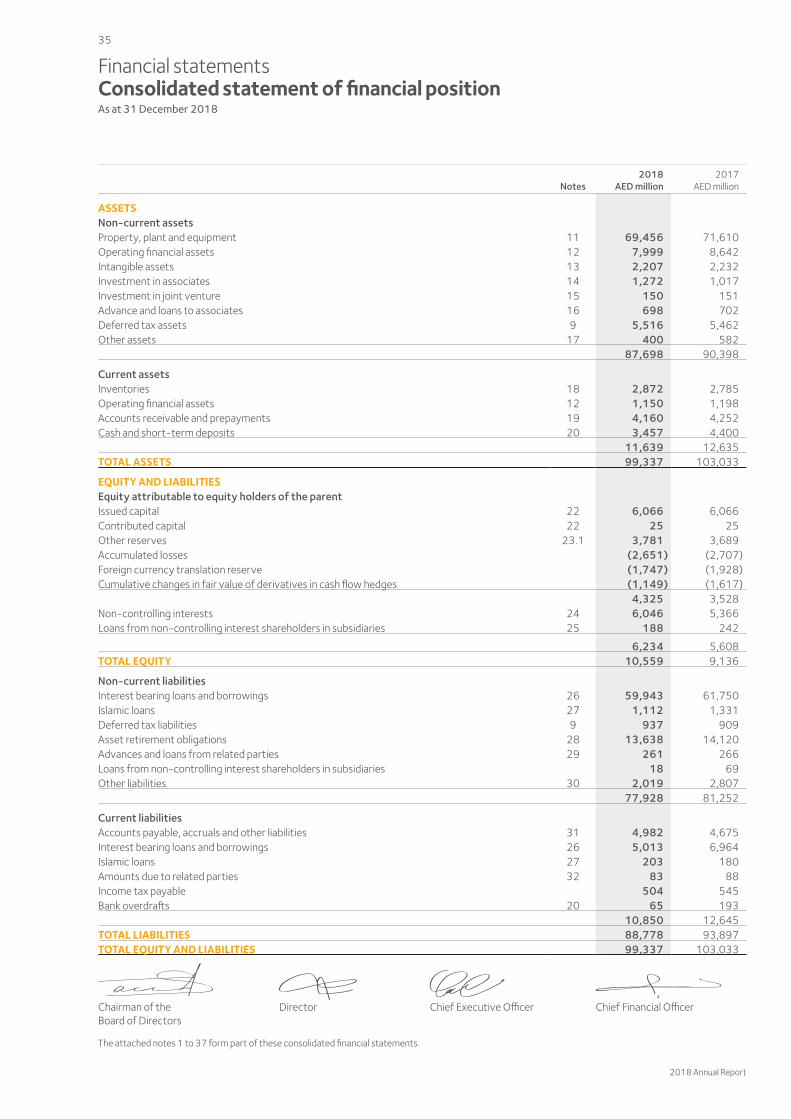
Notes2018
AED million2017
AED million
ASSETSNon-current assetsProperty, plant and equipment 11 69,456 71,610Operating financial assets 12 7,999 8,642Intangible assets 13 2,207 2,232Investment in associates 14 1,272 1,017Investment in joint venture 15 150 151Advance and loans to associates 16 698 702Deferred tax assets 9 5,516 5,462Other assets 17 400 582
87,698 90,398
Current assetsInventories 18 2,872 2,785Operating financial assets 12 1,150 1,198Accounts receivable and prepayments 19 4,160 4,252Cash and short-term deposits 20 3,457 4,400
11,639 12,635TOTAL ASSETS 99,337 103,033
EQUITY AND LIABILITIESEquity attributable to equity holders of the parentIssued capital 22 6,066 6,066Contributed capital 22 25 25Other reserves 23.1 3,781 3,689Accumulated losses (2,651) (2,707)Foreign currency translation reserve (1,747) (1,928)Cumulative changes in fair value of derivatives in cash flow hedges (1,149) (1,617)
4,325 3,528Non-controlling interests 24 6,046 5,366Loans from non-controlling interest shareholders in subsidiaries 25 188 242
6,234 5,608TOTAL EQUITY 10,559 9,136
Non-current liabilitiesInterest bearing loans and borrowings 26 59,943 61,750Islamic loans 27 1,112 1,331Deferred tax liabilities 9 937 909Asset retirement obligations 28 13,638 14,120Advances and loans from related parties 29 261 266Loans from non-controlling interest shareholders in subsidiaries 18 69Other liabilities 30 2,019 2,807
77,928 81,252
Current liabilitiesAccounts payable, accruals and other liabilities 31 4,982 4,675Interest bearing loans and borrowings 26 5,013 6,964Islamic loans 27 203 180Amounts due to related parties 32 83 88Income tax payable 504 545Bank overdrafts 20 65 193
10,850 12,645TOTAL LIABILITIES 88,778 93,897TOTAL EQUITY AND LIABILITIES 99,337 103,033
Chairman of the Board of Directors
Director Chief Executive Officer Chief Financial Officer
Financial statements Consolidated statement of financial positionAs at 31 December 2018
The attached notes 1 to 37 form part of these consolidated financial statements.
2018 Annual Report
35
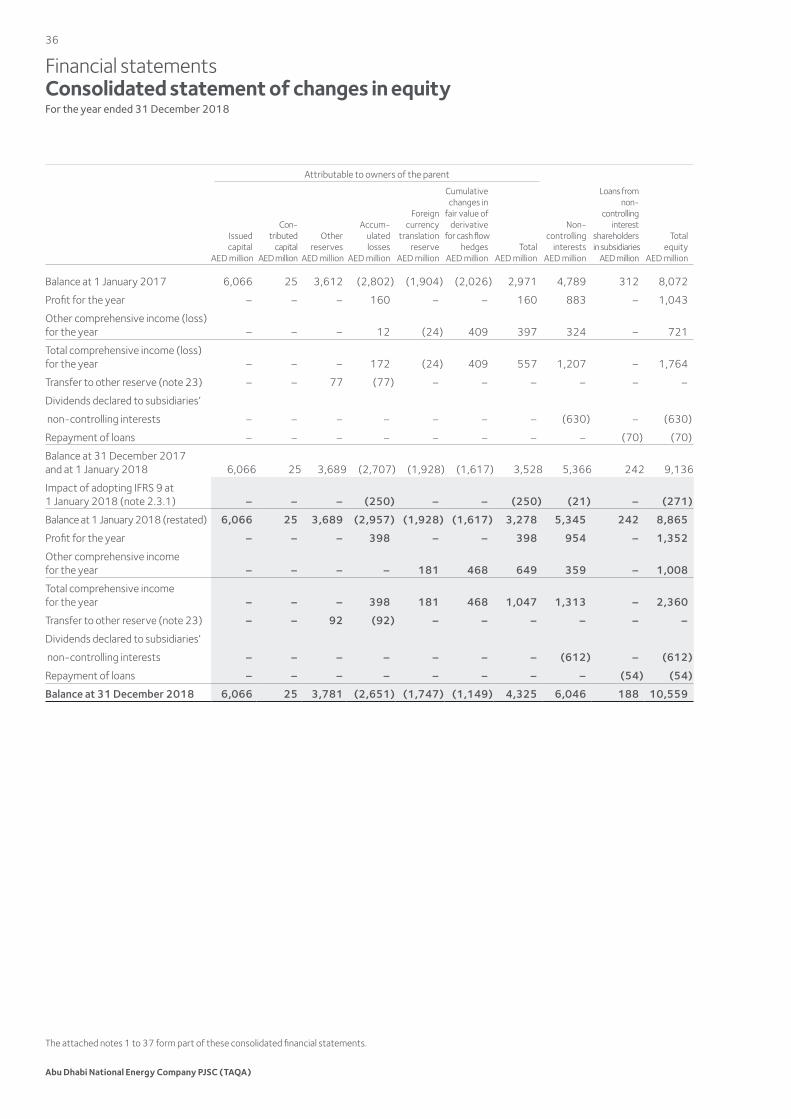
Attributable to owners of the parent
Non-controlling
interestsAED million
Loans fromnon-
controllinginterest
shareholders in subsidiaries
AED million
Totalequity
AED million
Issuedcapital
AED million
Con-tributed
capitalAED million
Otherreserves
AED million
Accum-ulatedlosses
AED million
Foreigncurrency
translationreserve
AED million
Cumulativechanges in
fair value ofderivative
for cash flowhedges
AED millionTotal
AED million
Balance at 1 January 2017 6,066 25 3,612 (2,802) (1,904) (2,026) 2,971 4,789 312 8,072
Profit for the year – – – 160 – – 160 883 – 1,043
Other comprehensive income (loss) for the year – – – 12 (24) 409 397 324 – 721
Total comprehensive income (loss) for the year – – – 172 (24) 409 557 1,207 – 1,764
Transfer to other reserve (note 23) – – 77 (77) – – – – – –
Dividends declared to subsidiaries’
non-controlling interests – – – – – – – (630) – (630)
Repayment of loans – – – – – – – – (70) (70)
Balance at 31 December 2017 and at 1 January 2018 6,066 25 3,689 (2,707) (1,928) (1,617) 3,528 5,366 242 9,136
Impact of adopting IFRS 9 at 1 January 2018 (note 2.3.1) – – – (250) – – (250) (21) – (271)
Balance at 1 January 2018 (restated) 6,066 25 3,689 (2,957) (1,928) (1,617) 3,278 5,345 242 8,865
Profit for the year – – – 398 – – 398 954 – 1,352
Other comprehensive income for the year – – – – 181 468 649 359 – 1,008
Total comprehensive income for the year – – – 398 181 468 1,047 1,313 – 2,360
Transfer to other reserve (note 23) – – 92 (92) – – – – – –
Dividends declared to subsidiaries’
non-controlling interests – – – – – – – (612) – (612)
Repayment of loans – – – – – – – – (54) (54)
Balance at 31 December 2018 6,066 25 3,781 (2,651) (1,747) (1,149) 4,325 6,046 188 10,559
Financial statements Consolidated statement of changes in equityFor the year ended 31 December 2018
The attached notes 1 to 37 form part of these consolidated financial statements.
Abu Dhabi National Energy Company PJSC (TAQA)
36
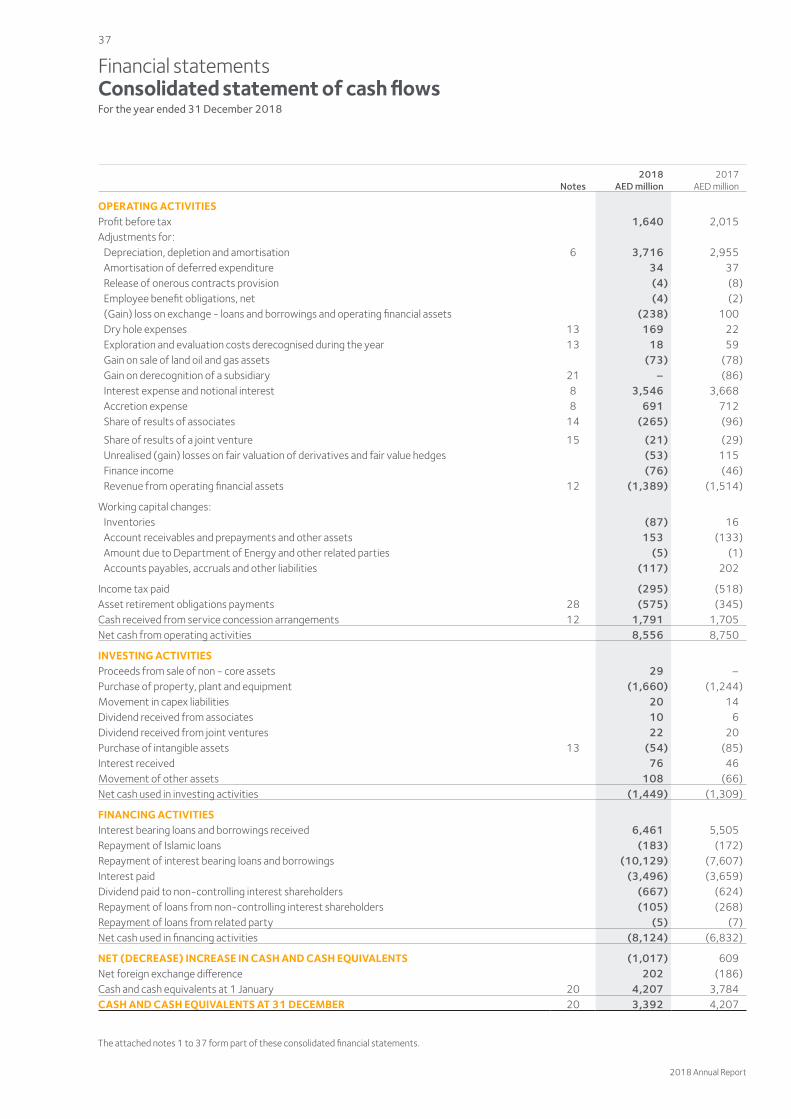
Notes2018
AED million2017
AED million
OPERATING ACTIVITIESProfit before tax 1,640 2,015Adjustments for: Depreciation, depletion and amortisation 6 3,716 2,955 Amortisation of deferred expenditure 34 37 Release of onerous contracts provision (4) (8) Employee benefit obligations, net (4) (2) (Gain) loss on exchange - loans and borrowings and operating financial assets (238) 100 Dry hole expenses 13 169 22 Exploration and evaluation costs derecognised during the year 13 18 59 Gain on sale of land oil and gas assets (73) (78) Gain on derecognition of a subsidiary 21 – (86) Interest expense and notional interest 8 3,546 3,668 Accretion expense 8 691 712 Share of results of associates 14 (265) (96)
Share of results of a joint venture 15 (21) (29) Unrealised (gain) losses on fair valuation of derivatives and fair value hedges (53) 115 Finance income (76) (46) Revenue from operating financial assets 12 (1,389) (1,514)
Working capital changes: Inventories (87) 16 Account receivables and prepayments and other assets 153 (133) Amount due to Department of Energy and other related parties (5) (1) Accounts payables, accruals and other liabilities (117) 202
Income tax paid (295) (518)Asset retirement obligations payments 28 (575) (345)Cash received from service concession arrangements 12 1,791 1,705Net cash from operating activities 8,556 8,750
INVESTING ACTIVITIESProceeds from sale of non - core assets 29 –Purchase of property, plant and equipment (1,660) (1,244)Movement in capex liabilities 20 14Dividend received from associates 10 6Dividend received from joint ventures 22 20Purchase of intangible assets 13 (54) (85)Interest received 76 46Movement of other assets 108 (66)Net cash used in investing activities (1,449) (1,309)
FINANCING ACTIVITIESInterest bearing loans and borrowings received 6,461 5,505Repayment of Islamic loans (183) (172)Repayment of interest bearing loans and borrowings (10,129) (7,607)Interest paid (3,496) (3,659)Dividend paid to non-controlling interest shareholders (667) (624)Repayment of loans from non-controlling interest shareholders (105) (268)Repayment of loans from related party (5) (7)Net cash used in financing activities (8,124) (6,832)
NET (DECREASE) INCREASE IN CASH AND CASH EQUIVALENTS (1,017) 609Net foreign exchange difference 202 (186)Cash and cash equivalents at 1 January 20 4,207 3,784CASH AND CASH EQUIVALENTS AT 31 DECEMBER 20 3,392 4,207
Financial statements Consolidated statement of cash flowsFor the year ended 31 December 2018
The attached notes 1 to 37 form part of these consolidated financial statements.
2018 Annual Report
37
1 Corporate informationAbu Dhabi National Energy Company PJSC (“TAQA” or the “Company”) was established on 21 June 2005 pursuant to the provisions of Emiri Decree number 16/2005 as a public joint stock company with Abu Dhabi Water and Electricity Authority (“ADWEA”) as its founding shareholder and 100% owner. 24.9% of TAQA’s shareholding is held by public and the remaining was retained by ADWEA and, accordingly, the Company was a subsidiary of ADWEA.
In February 2018, Law No. 11 of 2018 on the establishment of the Department of Energy (DOE) was published. Pursuant to the law, all of ADWEA’s assets, rights and obligations were transferred to the Department of Energy and the Department of Energy became their legal successor holding 75.1% shares in TAQA. The Department of Energy is responsible for the control, supervision and regulation of the energy sector in the Emirate of Abu Dhabi, including the Emirate’s energy strategy.
In January 2019, by virtue of Law No. 3 of 2019, the shareholding held by the Department of Energy has been transferred to Abu Dhabi Power Corporation (ADPC). As such, TAQA is now a subsidiary of ADPC.
TAQA owns a number of strategic power generation and water desalination assets in its domestic market in the UAE and operates internationally across the energy value chain from upstream and midstream oil and gas businesses through to power generation. TAQA’s registered head office is at 25th Floor, Al Maqam Tower, Abu Dhabi Global Market Square, PO Box 55224, Abu Dhabi, United Arab Emirates.
The consolidated financial statements of TAQA and its subsidiaries (the “Group”) for the year ended 31 December 2018 include the financial statements of TAQA and all its subsidiaries. Details of the major operating subsidiaries are provided in note 35 to the consolidated financial statements. Information on other related party relationships of the Group are provided in note 34.
The consolidated financial statements of the Group were authorised for issuance by the Board of Directors on 20 March 2019.
2.1 Basis of preparationThe consolidated financial statements of TAQA have been prepared in accordance with International Financial Reporting Standards (“IFRS”) as issued by the International Accounting Standards Board (“IASB”) and the applicable requirements of the UAE Federal Law No. (2) of 2015. The consolidated financial statements are presented in United Arab Emirates Dirhams (AED) and all values are rounded to the nearest million (AED million), except when otherwise indicated.
The consolidated financial statements are prepared on a historical cost basis, except for investment carried at FVOCI financial assets and derivative financial instruments that have been measured at fair value. The carrying values of recognised assets and liabilities that are designed as hedged items in fair value hedges that would otherwise be carried at amortised cost are adjusted to record changes in the fair values attributable to the risks that are being hedged in effective hedge relationships.
During the year, the Group made a profit of AED 1,352 million (2017: AED 1,043 million). The Group has sufficient short to medium term liquidity to meet ongoing commitments and upcoming debt repayments in the ordinary course of business (note 26 and 27). Therefore it is concluded that there is sufficient resources available to support the going concern assumption being appropriate for the preparation of the 2018 consolidated financial statements.
2.2 Basis of consolidationThe group financial statements consolidate the financial statements of TAQA and its subsidiaries drawn up to 31 December each year.
Subsidiaries are consolidated from the date of their acquisition, being the date on which the group obtains control, and continue to be consolidated until the date that control ceases. The financial statements of subsidiaries are prepared for the same reporting year as the parent company, using consistent accounting policies. Intra-group balances and transactions, including unrealized profits arising from intra-group transactions, have been eliminated. Unrealized losses are eliminated unless the transaction provides evidence of an impairment of the asset transferred. Non-controlling interests represent the equity in subsidiaries that is not attributable, directly or indirectly, to TAQA shareholders.
2.3 Changes in accounting policies and disclosuresThe following new and revised IFRSs, which became effective for annual periods beginning on or after 1 January 2018, have been adopted in these consolidated financial statements. The application of these new and revised IFRSs has not had any material impact on the amounts reported for the current and prior years, except for IFRS 9 (refer to note 2.3.1), but may affect the accounting for future transactions or arrangements.
• IFRS 9 Financial Instruments – New Standard• IFRS 15 Revenue with Contracts from Customers – New standard• IFRIC Interpretation 22 Foreign Currency Transactions and
Advance Considerations• Amendments to IAS 28 Investments in Associates and Joint Ventures
2.3.1 Transition to IFRS 9 Financial InstrumentsThe requirements of IFRS 9 represents a significant change from IAS 39 Financial Instruments: Recognition and Measurement. The new standard brings fundamental changes to the accounting for financial assets and to certain aspects of the accounting for financial liabilities.
Changes in accounting policies resulting from the adoption of IFRS 9 have been applied using the modified retrospective approach, accordingly the comparative periods have not been restated. These are disclosed in note 2.5. Differences in the carrying amounts of financial assets and financial liabilities resulting from the adoption of IFRS 9 are recognized in accumulated losses as at 1 January 2018. Accordingly, the information presented for 2017 does not reflect the requirements of IFRS 9 and therefore is not comparable to the information presented for 2018 under IFRS 9.
Impact on components of statements of financial position balances to IFRS 9Explanations in respect of change in measure of categories of financial assets in accordance with IFRS 9 as at 1 January 2018 primarily comprises the following:
• Operating financial assets – an opening accumulated losses adjustment of AED 213 million has resulted in decrease in carrying value of AED 9,840 million at 1 January 2018 to AED 9,627 million;
• Advance and loans to associates – an opening accumulated losses adjustment of AED 4 million has resulted in decrease in carrying value of AED 702 million at 1 January 2018 to AED 698 million;
• Non-current other assets – an opening accumulated losses adjustment of AED 18 million has resulted in decrease in carrying value of AED 582 million at 1 January 2018 to AED 564 million;
• Account receivable and prepayments – an opening accumulated losses adjustment of AED 34 million has resulted in decrease in carrying value of AED 4,252 million at 1 January 2018 to AED 4,218 million; and
• Cash and short term deposits – an opening accumulated losses adjustment of AED 2 million has resulted in decrease in carrying value of AED 4,400 million as at 1 January 2018 to AED 4,398 million.
Financial statements Notes to the consolidated financial statements31 December 2018
Abu Dhabi National Energy Company PJSC (TAQA)
38
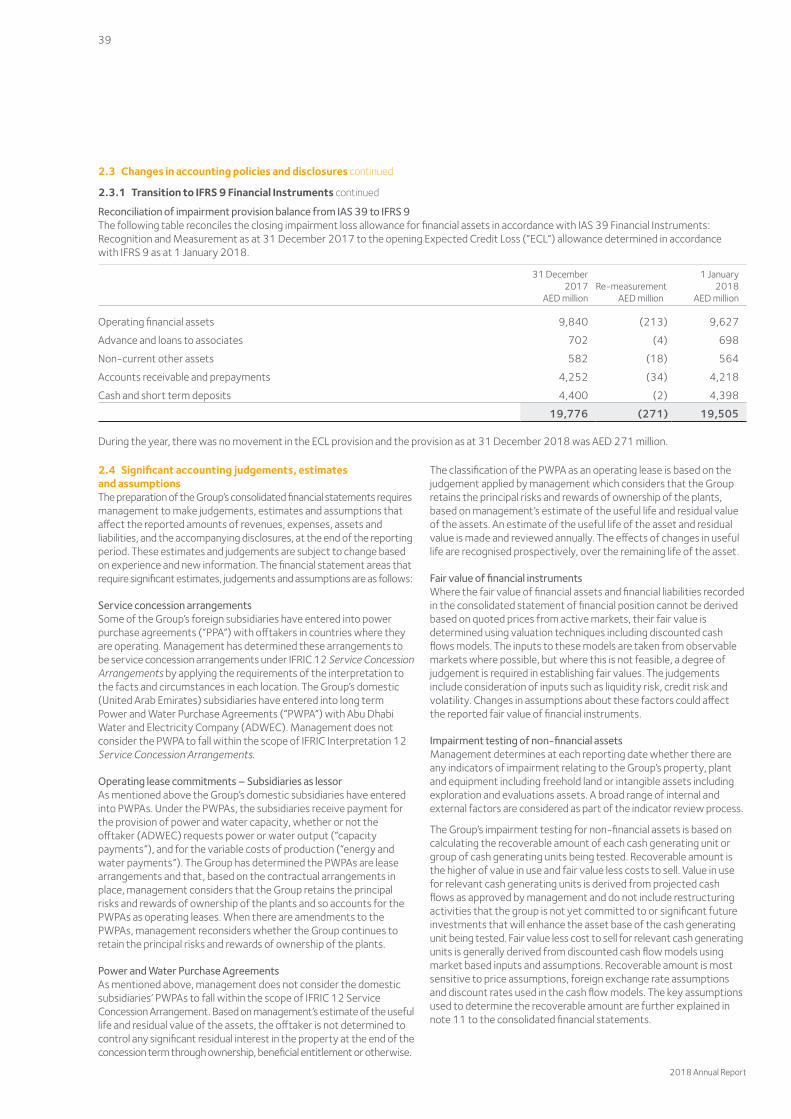
2.3 Changes in accounting policies and disclosures continued
2.3.1 Transition to IFRS 9 Financial Instruments continued
Reconciliation of impairment provision balance from IAS 39 to IFRS 9The following table reconciles the closing impairment loss allowance for financial assets in accordance with IAS 39 Financial Instruments: Recognition and Measurement as at 31 December 2017 to the opening Expected Credit Loss (“ECL”) allowance determined in accordance with IFRS 9 as at 1 January 2018.
31 December2017
AED millionRe-measurement
AED million
1 January2018
AED million
Operating financial assets 9,840 (213) 9,627
Advance and loans to associates 702 (4) 698
Non-current other assets 582 (18) 564
Accounts receivable and prepayments 4,252 (34) 4,218
Cash and short term deposits 4,400 (2) 4,398
19,776 (271) 19,505
During the year, there was no movement in the ECL provision and the provision as at 31 December 2018 was AED 271 million.
2.4 Significant accounting judgements, estimates and assumptionsThe preparation of the Group’s consolidated financial statements requires management to make judgements, estimates and assumptions that affect the reported amounts of revenues, expenses, assets and liabilities, and the accompanying disclosures, at the end of the reporting period. These estimates and judgements are subject to change based on experience and new information. The financial statement areas that require significant estimates, judgements and assumptions are as follows:
Service concession arrangementsSome of the Group’s foreign subsidiaries have entered into power purchase agreements (“PPA”) with offtakers in countries where they are operating. Management has determined these arrangements to be service concession arrangements under IFRIC 12 Service Concession Arrangements by applying the requirements of the interpretation to the facts and circumstances in each location. The Group’s domestic (United Arab Emirates) subsidiaries have entered into long term Power and Water Purchase Agreements (“PWPA”) with Abu Dhabi Water and Electricity Company (ADWEC). Management does not consider the PWPA to fall within the scope of IFRIC Interpretation 12 Service Concession Arrangements.
Operating lease commitments – Subsidiaries as lessorAs mentioned above the Group’s domestic subsidiaries have entered into PWPAs. Under the PWPAs, the subsidiaries receive payment for the provision of power and water capacity, whether or not the offtaker (ADWEC) requests power or water output (“capacity payments”), and for the variable costs of production (“energy and water payments”). The Group has determined the PWPAs are lease arrangements and that, based on the contractual arrangements in place, management considers that the Group retains the principal risks and rewards of ownership of the plants and so accounts for the PWPAs as operating leases. When there are amendments to the PWPAs, management reconsiders whether the Group continues to retain the principal risks and rewards of ownership of the plants.
Power and Water Purchase AgreementsAs mentioned above, management does not consider the domestic subsidiaries’ PWPAs to fall within the scope of IFRIC 12 Service Concession Arrangement. Based on management’s estimate of the useful life and residual value of the assets, the offtaker is not determined to control any significant residual interest in the property at the end of the concession term through ownership, beneficial entitlement or otherwise.
The classification of the PWPA as an operating lease is based on the judgement applied by management which considers that the Group retains the principal risks and rewards of ownership of the plants, based on management’s estimate of the useful life and residual value of the assets. An estimate of the useful life of the asset and residual value is made and reviewed annually. The effects of changes in useful life are recognised prospectively, over the remaining life of the asset.
Fair value of financial instrumentsWhere the fair value of financial assets and financial liabilities recorded in the consolidated statement of financial position cannot be derived based on quoted prices from active markets, their fair value is determined using valuation techniques including discounted cash flows models. The inputs to these models are taken from observable markets where possible, but where this is not feasible, a degree of judgement is required in establishing fair values. The judgements include consideration of inputs such as liquidity risk, credit risk and volatility. Changes in assumptions about these factors could affect the reported fair value of financial instruments.
Impairment testing of non-financial assetsManagement determines at each reporting date whether there are any indicators of impairment relating to the Group’s property, plant and equipment including freehold land or intangible assets including exploration and evaluations assets. A broad range of internal and external factors are considered as part of the indicator review process.
The Group’s impairment testing for non-financial assets is based on calculating the recoverable amount of each cash generating unit or group of cash generating units being tested. Recoverable amount is the higher of value in use and fair value less costs to sell. Value in use for relevant cash generating units is derived from projected cash flows as approved by management and do not include restructuring activities that the group is not yet committed to or significant future investments that will enhance the asset base of the cash generating unit being tested. Fair value less cost to sell for relevant cash generating units is generally derived from discounted cash flow models using market based inputs and assumptions. Recoverable amount is most sensitive to price assumptions, foreign exchange rate assumptions and discount rates used in the cash flow models. The key assumptions used to determine the recoverable amount are further explained in note 11 to the consolidated financial statements.
2018 Annual Report
39
Financial statementsNotes to the consolidated financial statements continued31 December 2018
2.4 Significant accounting judgements, estimates and assumptions continued
Estimation of oil and gas reservesOil and gas reserves and resources used for accounting purposes are estimated using internationally accepted methods and standards. The Group’s annual oil and gas reserves and resources review process includes an external audit process conducted by appropriately qualified parties. All reserve estimates are subject to revision, either upward or downward, based on new information, such as from development drilling and production activities or from changes in economic factors, including product prices, contract terms or development plans. In general, changes in the technical maturity of hydrocarbon reserves resulting from new information becoming available from development and production activities have tended to be the most significant cause of annual revisions. Changes in oil and gas reserves are an important indication of impairment or reversal of impairment and may result in subsequent impairment charges or reversals as well as affecting the unit-of-production depreciation charge in the consolidated income statement.
Provision for decommissioningDecommissioning costs will be incurred by the Group at the end of the operating life of certain of the Group’s facilities and properties. The ultimate decommissioning costs or asset retirement obligations are uncertain and cost estimates can vary in response to many factors including changes to relevant legal requirements, the emergence of new restoration techniques or experience at production sites. The expected timing of expenditure can also change, for example in response to changes in laws and regulations or their interpretation, and/or due to changes in commodity prices.
Income taxesThe Group recognises the net future tax benefit to the extent that it is probable that the deductible temporary differences will reverse in the foreseeable future. Assessing the recoverability of deferred income tax assets requires the Group to make significant assumptions related to expectations of future taxable income. Estimates of future taxable income are based on forecast cash flows from operations and the application of existing tax laws in each jurisdiction. To the extent that future cash flows and taxable income differ significantly from estimates, the ability of the Group to realise the net deferred tax assets recorded at the reporting date could be impacted. Additionally, future changes in tax laws in the jurisdictions in which the Group operates could limit the ability of the Group to obtain tax deductions in future periods.
2.5 Summary of significant accounting policies
Fair value measurementThe Group measures financial instruments, such as, derivatives, and non-financial assets, at fair value at each reporting date. Fair value is the price that would be received to sell an asset or paid to transfer a liability in an orderly transaction between market participants. The group categorizes assets and liabilities measured at fair value into one of three levels depending on the ability to observe inputs employed in their measurement. Level 1 inputs are quoted prices in active markets for identical assets or liabilities. Level 2 inputs are inputs that are observable, either directly and indirectly, other than quoted prices included within level 1 for the asset or liability. Level 3 inputs are unobservable inputs for the asset or liability reflecting significant modification to observable related market data or TAQA’s assumption about pricing by market participants.
Revenue recognitionIFRS 15 establishes a new five-step model that will apply to revenue arising from contracts with customers. Revenue is recognised at an amount that reflects the consideration to which the Group expects to be entitled in exchange for transferring goods or services to a customer.
Step 1 Identify contract(s) with a customer;Step 2 Identify performance obligations in the contract;Step 3 Determine the transaction price;Step 4 Allocate the transaction price to the performance obligations
in the contract; andStep 5 Recognise revenue when (or as) the Company satisfies a
performance obligation.
The Company satisfies a performance obligation and recognises revenue over time, if one of the following criteria is met:
a) The Company’s performance does not create an asset with an alternate use to the Company and the Company has as an enforceable right to payment for performance completed to date.
b) The Company’s performance creates or enhances an asset that the customer controls as the asset is created or enhanced.
c) The customer simultaneously receives and consumes the benefits provided by the Company’s performance as the Company performs.
For performance obligations where one of the above conditions are not met, revenue is recognised at the point in time at which the performance obligation is satisfied.
Revenue is measured at the fair value of the consideration received or receivable, taking into account contractually defined terms of payment and excluding taxes and duty. The Company assesses its revenue arrangements against specific criteria to determine if it is acting as principal or agent.
Revenue is recognised to the extent it is probable that the economic benefits will flow to the Company and the revenue and costs, if applicable, can be measured reliably.
Oil and gasRevenue from the sale of oil and gas is recognised when the performance obligations are met. This generally occurs when the product is physically transferred into a delivery mechanism such as a vessel or a pipeline.
Lifting or offtake arrangements for oil and gas produced by certain of the Group’s jointly owned assets are such that each participant may not receive and sell its precise share of the overall production in each period. The resulting imbalance between cumulative production entitlement and cumulative sales attributable to each participant at a reporting date represents ‘underlift’ or ‘overlift’. Underlift and overlift are valued at market value and included within current assets and current liabilities respectively. Movements during an accounting period are adjusted through cost of sales such that gross profit is recognised on an entitlements basis.
Gas storageThe income from gas storage is recognised when the service is provided and accepted by customers.
Abu Dhabi National Energy Company PJSC (TAQA)
40
2.5 Summary of significant accounting policies continued
Revenue recognition continued
Power and water and fuel revenueThe revenue recognition of the Group’s power and water business is as follows:
i) Where the Group determines that the PWPA/PPA meets the financial asset model requirements for service concession arrangements, consideration receivable is allocated by reference to the relative fair values of the services delivered. Construction revenue is recognised commensurate with completion of construction when the outcome of the contract can be estimated reliably by reference to the stage of completion, operating revenue is recognised as the service is provided and finance revenue is recognised using the effective interest rate method on the financial asset.
ii) Where the Group determines that the PWPA/PPA contains an operating lease, capacity payments are recognised as operating lease rental revenue on a systematic basis to the extent that capacity has been made available to the offtaker during the year. Those payments, which are not included as capacity payments (e.g. fuel revenue), are recognised as revenue in accordance with the contractual terms of the PWPA/PPA.
iii) Energy and water payments are recognised as revenue when the contracted power and water is delivered to the offtaker.
(iv) Fuel revenue represents reimbursements from the offtakers in the power and water subsidiaries at market prices for fuel consumed in power generation in accordance with the terms of the power and water purchase agreements and the power purchase agreements. Fuel revenue is recognised as and when fuel is consumed in the production of power and water.
Taxes
Current income taxCurrent income tax assets and liabilities for the current and prior periods are measured at the amount expected to be recovered from or paid to taxation authorities. The tax rates and tax laws used to compute the amount are those that are enacted or substantively enacted at the reporting date, in the countries where the Group operates and generates taxable income.
Current income tax relating to items recognised directly in equity is recognised in equity and not in the consolidated income statement. Management periodically evaluates positions taken in tax returns with respect to situations in which applicable tax regulations are subject to interpretation and establishes provisions where appropriate.
Deferred income taxDeferred income tax assets and liabilities are measured using enacted or substantively enacted income tax rates as at the balance sheet date that are anticipated to apply to taxable income in the years in which temporary differences are anticipated to be recovered or settled. Changes to these balances are recognized in the consolidated income statement or in other comprehensive income in the period they occur.
The Group recognizes the financial statement impact of a tax filing position when it is probable, based on the technical merits, that the position will be sustained upon audit. The company assesses possible outcomes and their associated probabilities. If the company determines payment is probable, it measures the tax provision at the best estimate of the amount of tax payable.
The carrying amount of deferred income tax assets is reviewed at each reporting date and reduced to the extent that it is no longer probable that sufficient taxable profit will be available to allow all or part of the deferred income tax asset to be utilised. Unrecognised deferred income tax assets are reassessed at each reporting date and are
recognised to the extent that it has become probable that future taxable profits will allow the deferred income tax asset to be recovered.
Deferred income tax assets and liabilities are measured at the tax rates that are expected to apply in the year when the asset is realised or the liability is settled, based on tax rates (and tax laws) that have been enacted or substantively enacted at the reporting date.
Deferred income tax assets and deferred income tax liabilities are offset, if a legally enforceable right exists to set off current tax assets against current income tax liabilities and the deferred income taxes relate to the same taxable entity and the same taxation authority.
Foreign currency translationIn individual subsidiaries, joint ventures and associates, transactions in foreign currencies are initially recorded in the functional currency of those entities at the spot exchange rate on the date of the transaction. Monetary assets and liabilities denominated in foreign currencies are retranslated into the functional currency at the spot exchange rate at the reporting date. Any resulting exchange differences are included in the consolidated income statement, unless hedge accounting is applied. Non-monetary assets and liabilities, other than those measured at fair value are not retranslated subsequent to initial recognition.
In the consolidated financial statements, the assets and liabilities of foreign operations are translated into AED at the rate of exchange prevailing at the reporting date and their income statements are translated at the weighted average exchange rates on a monthly basis. The exchange differences arising on the translation are recognised in other comprehensive income. On disposal of a foreign operation, the deferred cumulative amount recognised in equity relating to that particular foreign operation is recognised in the consolidated income statement.
Investments in associates and joint ventureThe results, assets and liabilities of associates and joint venture are incorporated in these consolidated financial statements using the equity method of accounting.
Under the equity method, an investment is carried on the balance sheet at cost plus post-acquisition changes in the group’s share of net assets of the entity, less distributions received and less any impairment in value of the investment. Loans advanced to equity-accounted entities that have the characteristics of equity financing are also included in the investment on the group balance sheet. The Group consolidated income statement reflects the Group’s share of the results after tax of the equity-accounted entity, adjusted to account for depreciation, amortization and any impairment of the equity-accounted entity’s assets based on their fair values at the date of acquisition. The Group’s consolidated statement of comprehensive income includes the Group’s share of the equity-accounted entity’s other comprehensive income. The Group’s share of amounts recognized directly in equity by an equity-accounted entity is recognized directly in the Group’s consolidated statement of changes in equity.
Unrealized gains on transactions between the Group and its equity-accounted entities are eliminated to the extent of the Group’s interest in the equity-accounted entity.
The Group assesses investments in equity-accounted entities for impairment whenever events or changes in circumstances indicate that the carrying value may not be recoverable. If any such indication of impairment exists, the carrying amount of the investment is compared with its recoverable amount, being the higher of its fair value less costs of disposal and value in use. If the carrying amount exceeds the recoverable amount, the investment is written down to its recoverable amount.
2018 Annual Report
41
Financial statementsNotes to the consolidated financial statements continued31 December 2018
2.5 Summary of significant accounting policies continued
Interests in joint operationsA joint operation is a joint arrangement whereby parties that have joint control of the arrangement have rights to the assets, and obligations for the liabilities, relating to the arrangement. Joint control is the contractually agreed sharing of control of an arrangement, which exists only when decisions about the relevant activities require unanimous consent of the parties sharing control.
The Group accounts for the assets, liabilities, revenues and expenses relating to its interest in a joint operation in accordance with the IFRSs applicable to the particular assets, liabilities, revenues and expenses.
Certain of the Group’s activities in the oil and gas segment are conducted through joint operations where the partners have a direct ownership interest in and jointly control the underlying assets of the joint operation. The Group accounts for its share of the jointly controlled assets, any liabilities it has incurred, its share of any liabilities jointly incurred with other partners, income from the sale or use of its share of the joint operation’s output, together with its share of the expenses incurred by the joint operation, and any expenses it incurs in relation to its interest in the joint operation.
LeasesThe determination of whether an arrangement is, or contains a lease is based on the substance of the arrangement at inception date. The arrangement is assessed for whether the fulfilment of the arrangement is dependent on the use of a specific asset or assets or the arrangement conveys a right to use the asset or assets, even if that right is not explicitly specified in an arrangement.
Group as a lesseeFinance leases, which transfer to the Group substantially all of the risks and benefits incidental to ownership of the leased item, are capitalised at the commencement of the lease at the fair value of the leased property or, if lower, at the present value of the minimum lease payments. Lease payments are apportioned between the finance charges and reduction of the lease liability so as to achieve a constant rate of interest on the remaining balance of the liability. Finance charges are reflected in the consolidated income statement. Leased assets are depreciated over the useful life of the asset. However, if there is no reasonable certainty that the Group will obtain ownership by the end of the lease term, the asset is depreciated over the shorter of the estimated useful life of the asset and the lease term.
Operating lease payments are recognised as an expense in the consolidated income statement on a straight line basis over the lease term.
Group as a lessor - Finance leasesLeases where the Group transfers substantially all the risks and benefits of ownership of the asset are classified as financial leases. The amounts due from the lessee are recorded in the statement of financial position as financial assets and are carried at the amount of the net investment in the lease after making provision for bad and doubtful debts.
Group as a lessor - Operating leasesLeases where the Group does not transfer substantially all the risks and benefits of ownership of the asset are classified as operating leases. Initial direct costs incurred in negotiating an operating lease are added to the carrying amount of the leased asset and recognised over the lease term on the same bases as rental income. Contingent rents are recognised as revenue in the period in which they are earned.
Intangible assetsIntangible assets acquired separately are measured on initial recognition at cost. The cost of intangible assets acquired in a business combination is their fair value at the date of acquisition. Following initial recognition, intangible assets are carried at cost less any accumulated amortisation and any accumulated impairment losses.
The useful lives of intangible assets are assessed to be either finite or indefinite. Amortisation for intangible assets with finite lives is calculated on a straight-line basis as follows:
Tolling agreement 14 years
Connection rights 34 – 40 years
Computer software 3 years
The expected useful lives of assets are reviewed on an annual basis and, if necessary, changes in useful lives are accounted for prospectively.
Gains or losses arising from de-recognition of an intangible asset are measured as the difference between the net disposal proceeds and the carrying amount of the asset and are recognised in the consolidated income statement when the asset is derecognised.
Oil and natural gas exploration, evaluation and development expenditure
Exploration & evaluation costs - capitalisationPre-license costs and geological and geophysical exploration costs incurred prior to obtaining the rights to explore are recognised in the consolidated income statement when incurred. Exploration licences are recognised as an exploration and evaluation (“E&E”) asset. The cost of that licence includes the directly attributable costs of its acquisition. Examples of such costs may include non-refundable taxes and professional and legal costs incurred in obtaining the licence. Costs incurred after the rights to explore have been obtained, such as geological and geophysical costs, drilling costs, appraisal and development study costs and other directly attributable costs of exploration and evaluation activity, including technical and administrative costs for each exploration asset, are capitalised as intangible E&E assets. E&E costs are not amortised prior to the conclusion of appraisal activities.
At completion of appraisal activities if technical feasibility is demonstrated and commercial reserves are discovered then, following development sanction, the carrying value of the relevant E&E asset is reclassified as a development and production (“D&P”) asset. This category reclassification is only performed after the carrying value of the relevant E&E asset has been assessed for impairment, and where appropriate, its carrying value adjusted. If commercial reserves are not discovered at the completion of appraisal activity of each asset and it is not expected to derive any future economic benefits, the E&E asset is written off to the consolidated income statement.
Development costsExpenditure on the construction, installation or completion of infrastructure facilities such as platforms, pipelines and the drilling of development wells, including unsuccessful development or delineation wells, is capitalised within oil and gas properties.
Property, plant and equipment
Property, plant and equipment - generalProperty, plant and equipment is stated at cost less accumulated depreciation and accumulated impairment losses, if any. The present value of the expected cost for the decommissioning obligation of an asset at the end of its useful life is included in the cost of the respective asset if the recognition criteria for a provision are met.
Abu Dhabi National Energy Company PJSC (TAQA)
42
2.5 Summary of significant accounting policies continued
Property, plant and equipment continuedDepreciation is calculated on a straight line basis over the estimated useful lives of assets as follows:
Building, equipment, plant and machinery 20 to 40 years
Oil and gas properties Unit of production
The assets’ residual values, useful lives and methods of depreciation are reviewed, and adjusted if appropriate, at each reporting date.
The cost of spare parts held as essential for the continuity of operations and which are designated as strategic spares are depreciated on a straight line basis over their estimated operating life. Spare parts used for normal repairs and maintenance are expensed when issued.
An item of property, plant and equipment is derecognised upon disposal or when no future economic benefits are expected from its use or disposal. Any gain or loss arising on derecognition of the asset (calculated as the difference between the net disposal proceeds and the carrying amount of the asset) is included in the consolidated income statement in the year the asset is derecognised.
Property, plant and equipment – oil and gas propertiesOil and gas properties in the development and production phase (“D&P” assets) and other related assets are stated at cost, less accumulated depreciation and accumulated impairment losses (net of reversal of previously recognised impairment losses, if any). The initial cost of an asset comprises its purchase price or construction cost, any costs directly attributable to bringing the asset into operation and the initial estimate of the decommissioning obligation. The purchase price or construction cost is the aggregate amount paid and the fair value of any other consideration given to acquire the asset.
Oil and gas properties are depreciated on a unit-of-production basis over the proved and probable (“2P”) reserves of the field concerned. The unit-of-production rate for the amortisation of field development costs takes into account expenditures incurred to date, together with estimated future development expenditure. Depreciation on oil and gas properties does not commence until the commencement of production from the property.
Property, plant and equipment - major maintenance and repairsExpenditure on major maintenance refits or repairs comprises the cost of replacement assets or parts of assets, inspection costs and overhaul costs. Where an asset or part of an asset that was separately depreciated and is now written off is replaced and it is probable that future economic benefits associated with the item will flow to the group, the expenditure is capitalised. Where an asset or part of an asset was not separately considered as a component, the replacement value is used to estimate the carrying amount of the replaced asset (or asset part) which is immediately written off. Inspection costs associated with major maintenance programs are capitalised when the recognition criteria are met and amortised over the period to the next inspection. Day to day servicing and maintenance costs are expensed as incurred.
Property, plant and equipment - capital work in progressCapital work in progress is included in property, plant and machinery at cost on the basis of the percentage completed at the reporting date. The capital work in progress is transferred to the appropriate asset category and depreciated in accordance with the above policies when construction of the asset is completed and commissioned.
Property, plant and equipment – freehold landFreehold land represents freehold rights over certain plots of land in the UAE transferred at nominal amount from DOE (Ex-ADWEA). At the date of transfer, the Company recorded the fair value of these plots of land under property, plant and equipment.
Subsequently, these plots of land are measured at initial fair value being the deemed cost less accumulated impairment losses (net of reversal of previously recognised impairment losses), if any.
Impairment of non-financial assetsThe Group assesses, at each reporting date, whether there is an indication that an asset may be impaired. If any indication exists, or when annual impairment testing for an asset is required, the Group estimates the asset’s recoverable amount. An asset’s recoverable amount is the higher of an asset’s or cash-generating unit’s fair value less costs of disposal and its value in use. Recoverable amount is determined for an individual asset, unless the asset does not generate cash inflows that are largely independent of those from other assets or groups of assets. When the carrying amount of an asset or cash generating unit exceeds its recoverable amount, the asset is considered impaired and is written down to its recoverable amount.
In assessing value in use, the estimated future cash flows are discounted to their present value using a pre-tax discount rate that reflects current market assessments of the time value of money and the risks specific to the asset. In the case of VIU calculations, assumptions are also made regarding the cash flows from each asset’s ultimate disposal. In determining fair value less costs of disposal, recent appropriate market transactions are taken into account, if available.
If no such transactions can be identified, an appropriate valuation model is used. These calculations are corroborated by valuation multiples, quoted share prices for publicly traded subsidiaries or other available fair value indicators. Impairment losses of continuing operations are recognised in the consolidated income statement in those expense categories consistent with the function of the impaired asset.
An assessment is made at each reporting date to determine whether there is any indication that previously recognised impairment losses may no longer exist or may have decreased. If such indication exists, the Group estimates the asset’s or cash-generating unit’s recoverable amount. A previously recognised impairment loss is reversed only if there has been a change in the assumptions used to determine the asset’s recoverable amount since the last impairment loss was recognised. The reversal is limited so that the carrying amount of the asset does not exceed its recoverable amount, nor exceed the carrying amount that would have been determined, net of depreciation, had no impairment loss been recognised for the asset in prior years. Such reversal is recognised in the consolidated income statement.
For the purpose of E&E asset impairment testing, cash generating units are grouped at the operating segment level. An impairment test performed in the E&E phase therefore involves grouping all E&E assets within the relevant segment with the development & production (D&P) assets belonging to the same segment. The combined segment carrying amount is compared to the combined segment recoverable amount and any resulting impairment loss identified within the E&E asset is written off to the consolidated income statement. The recoverable amount of the segment is determined as the higher of its fair value less costs to sell and its value in use.
InventoriesInventories of fuel for the purpose of powering electricity generation facilities are valued at the lower of cost, determined on the basis of weighted average cost, and net realisable value. Costs are those expenses incurred in bringing each item to its present location and condition. Net realisable value is the estimated selling price in the ordinary course of business, less estimated costs of completion and the estimated costs necessary to make the sale. Inventories of oil and oil products, which represent production from oil and gas facilities of the Group which are tanked at storage facilities awaiting sale, are valued at market value.
2018 Annual Report
43
Financial statementsNotes to the consolidated financial statements continued31 December 2018
2.5 Summary of significant accounting policies continued
Service concessionsThe Group accounts for service concession arrangements under IFRIC 12 when the following conditions are met:
• the grantor (usually a government entity) controls or regulates what services the operator must provide with the infrastructure, to whom it must provide them, and at what price; and
• the grantor (usually a government entity) controls – through ownership, beneficial entitlement or otherwise – any significant residual interest in the infrastructure at the end of the term of the arrangement.
In view of the above, concession infrastructure that does not meet the requirements of IFRIC 12 is presented as property, plant and equipment. Under IFRIC 12, the operator’s rights over the plant operated under concession arrangements are accounted for based on the party primarily responsible for payment:
• the “intangible asset model” is applied when users have primary responsibility to pay for the concession services; and
• the “financial asset model” is applied when the grantor has the primary responsibility to pay the operator for the concession services.
Where the grantor guarantees the amounts that will be paid over the term of the contract (e.g. via a guaranteed internal rate of return), the financial asset model is used to account for the concession infrastructure, since the grantor is primarily responsible for payment. The financial asset model is used to account for Build, Operate and Transfer (BOT) contracts entered into with the grantor. The Group recognises financial assets from service concession arrangements in the consolidated statement of financial position as operating financial assets.
Financial instrumentsA financial instrument is any contract that gives rise to a financial asset of one entity and a financial liability or equity instrument of another entity.
Financial assetsFinancial assets are recognized initially at fair value, normally being the transaction price plus, in the case of financial assets not at fair value through profit or loss, directly attributable transaction costs. The subsequent measurement of financial assets depends on their classification, as set out below. The group derecognizes financial assets when the contractual rights to the cash flow expire or the financials asset is transferred to a third party.
Loans and receivablesLoans and receivables are carried at amortized cost using the effective interest method if the time value of money is significant. Gains and losses are recognized in income when the loans and receivables are derecognized or impaired and when interest is recognized using the effective interest method.
Cash and short-term depositsCash and short-term deposits in the consolidated statement of financial position comprise cash at banks and on hand and short term deposits with an original maturity of three months or less. For the purpose of the consolidated cash flow statement, cash and cash equivalents consist of cash and short-term deposits as defined above, net of outstanding bank overdrafts.
Derivative designated as hedging instruments in an effective hedgeThese derivatives are carried on the statement of financial position at fair value. The treatment of gains and losses arising from revaluation is described in the accounting policy of derivative financial instrument and hedging activities.
Financial assets at fair value through OCI (debt instruments)The Group measures debt instruments at fair value through OCI if both of the following conditions are met:
• The financial asset is held within a business model with the objective of both holding to collect contractual cash flows and selling, and
• The contractual terms of the financial asset give rise on specified dates to cash flows that are solely payments of principal and interest on the principal amount outstanding.
For debt instruments at fair value through OCI, interest income, foreign exchange revaluation and impairment losses or reversals are recognised in the statement of profit or loss and computed in the same manner as for financial assets measured at amortised cost. The remaining fair value changes are recognised in OCI. Upon derecognition, the cumulative fair value change recognised in OCI is recycled to profit or loss.
Impairment of financial assetsThe Group recognizes loss allowances for expected credit losses (ECL) on the following financial instruments that are not measured at FVTPL:
• financial assets that are debt instruments;• financial guarantee contracts issued; and• loan commitments issued.
No impairment loss is recognized on equity investments.
The Group measures loss allowances at an amount equal to lifetime ECL, except for those financial instruments on which the counter-party has an investment grade credit rating or credit risk has not increased significantly since their initial recognition, in which case 12-month ECL is measured. 12-month ECL are the portion of ECL that result from default events on a financial instrument that are possible within the 12 months after reporting date
The Group uses a provision matrix to calculate ECLs for financial assets. The provision rates are calculated based on estimates including the probability of default (PD) and the loss incurred in default positions (LGD). These estimates are allocated by assessing the counterparty credit ratings. The Group calibrates the matrix to adjust the provision rates with forward-looking information. For instance, if forecast economic conditions (i.e., gross domestic product) are projected to change then the historical default rates are adjusted. At every reporting date, the counterparty credit ratings are updated and changes in the forward-looking estimates are analysed. The Group’s historical credit loss experience and forecast of economic conditions may also not be representative of customer’s actual default in the future.
Credit-impaired financial assetsAt each reporting date, the Group assesses whether financial assets carried at amortised cost and debt financial assets carried at FVOCI are credit-impaired. A financial asset is ‘credit-impaired’ when one or more events that have a detrimental impact on the estimated future cash flows of the financial asset have occurred. Evidence that a financial asset is credit-impaired includes the following observable data:
• significant financial difficulty of the borrower or issuer;• a breach of contract such as a default or past due event;• the restructuring of a loan or advance by the Group on terms that
the Group would not consider otherwise;• it is becoming probable that the borrower will enter bankruptcy or
other financial reorganization; or• the disappearance of an active market for a security because of
financial difficulties.
Abu Dhabi National Energy Company PJSC (TAQA)
44
2.5 Summary of significant accounting policies continued
Financial liabilitiesFinancial liabilities are classified, at initial recognition, as financial liabilities at fair value through profit or loss, loans and borrowings, payables, or as derivatives designated as hedging instruments in an effective hedge, as appropriate.
All financial liabilities are recognised initially at fair value and, in the case of loans and borrowings and payables, net of directly attributable transaction costs.
The measurement of financial liabilities depends on their classification, as described below:
Financial liabilities at FVTPLFinancial liabilities at fair value through profit or loss include financial liabilities held for trading and financial liabilities designated upon initial recognition as at fair value through profit or loss
Financial liabilities are classified as held for trading if they are incurred for the purpose of repurchasing in the near term. This category also includes derivative financial instruments entered into by the Group that are not designated as hedging instruments in hedge relationships as defined by IFRS 9. Separated embedded derivatives are also classified as held for trading unless they are designated as effective hedging instruments Gains or losses on liabilities held for trading are recognised in the statement of profit or loss.
Financial liabilities designated upon initial recognition at fair value through profit or loss are designated at the initial date of recognition, and only if the criteria in IFRS 9 are satisfied.
Gains or losses on financial guarantee contracts and loan commitments issued by the Group that are designated by the Group as at fair value through profit or loss are recognised in profit or loss. Fair value is determined in the manner described in note 38.
Financial liabilities subsequently measured at amortised costFinancial liabilities that are not held-for-trading and are not designated as at FVTPL are measured at amortised cost at the end of subsequent accounting periods. The carrying amounts of financial liabilities that are subsequently measured at amortised cost are determined based on the effective interest method. Interest expense that is not capitalised as part of costs of an asset is included in the finance costs in the consolidated income statement.
Derivative financial instruments and hedge accountingThe Group enters into a variety of derivative financial instruments to manage its exposure to interest rate and foreign exchange rate risks, including foreign exchange forward contracts and interest rate swaps. Further details of derivative financial instruments are disclosed in note 36.
Derivative financial instruments are initially recognised at fair value on the date on which a derivative contract is entered into and are subsequently remeasured at fair value. Derivatives are carried as financial assets when the fair value is positive and as financial liabilities when the fair value is negative.
Hedge accountingAt the inception of a hedge relationship, the Group formally designates and documents the hedge relationship to which it wishes to apply hedge accounting and the risk management objective and strategy for undertaking the hedge.
Before 1 January 2018, the documentation includes identification of the hedging instrument, the hedged item or transaction, the nature of the risk being hedged and how the Group will assess the effectiveness of changes in the hedging instrument’s fair value in offsetting the exposure to changes in the hedged item’s fair value or cash flows attributable to the hedged risk. Such hedges are expected to be highly effective in achieving offsetting changes in fair value or cash flows and are assessed on an ongoing basis to determine that they actually have been highly effective throughout the financial reporting periods for which they were designated.
Beginning 1 January 2018, the documentation includes identification of the hedging instrument, the hedged item, the nature of the risk being hedged and how the Group will assess whether the hedging relationship meets the hedge effectiveness requirements (including the analysis of sources of hedge ineffectiveness and how the hedge ratio is determined). A hedging relationship qualifies for hedge accounting if it meets all of the following effectiveness requirements:
• There is ‘an economic relationship’ between the hedged item and the hedging instrument.
• The effect of credit risk does not ‘dominate the value changes’ that result from that economic relationship.
• The hedge ratio of the hedging relationship is the same as that resulting from the quantity of the hedged item that the Group actually hedges and the quantity of the hedging instrument that the Group actually uses to hedge that quantity of hedged item.
Hedges that meet all the qualifying criteria for hedge accounting are accounted for, as described below:
Fair value hedgesChanges in the fair value of derivatives that are designated and qualify as fair value hedges are recognised in profit or loss immediately, together with any changes in the fair value of the hedged asset or liability that are attributable to the hedged risk. The change in the fair value of the hedging instrument and the change in the hedged item attributable to the hedged risk are recognised in the line of the consolidated statement of comprehensive income relating to the hedged item.
Hedge accounting is discontinued when the Group revokes the hedging relationship, when the hedging instrument expires or is sold, terminated, or exercised, or when it no longer qualifies for hedge accounting. The fair value adjustment to the carrying amount of the hedged item arising from the hedged risk is amortised to profit or loss from that date.
Cash flow hedgesThe effective portion of changes in the fair value of derivatives that are designated and qualify as cash flow hedges is recognised in other comprehensive income and accumulated under the heading of changes in fair values of derivative instruments in cash flow hedges. The gain or loss relating to the ineffective portion is recognised immediately in profit or loss, and is included in changes in fair values of derivatives and fair value hedges line item.
Amounts previously recognised in other comprehensive income and accumulated in equity are reclassified to profit or loss in the periods when the hedged item is recognised in profit or loss, in the same line of the consolidated statement of comprehensive income as the recognised hedged item. However, when the hedged forecast transaction results in the recognition of a non-financial asset or a non-financial liability, the gains and losses previously recognised in other comprehensive income and accumulated in equity are transferred from equity and included in the initial measurement of the cost of the non-financial asset or non-financial liability.
2018 Annual Report
45
Financial statementsNotes to the consolidated financial statements continued31 December 2018
2.5 Summary of significant accounting policies continued
Derivative financial instruments and hedge accounting continued
Cash flow hedges continuedHedge accounting is discontinued when the Group revokes the hedging relationship, when the hedging instrument expires or is sold, terminated, or exercised, or when it no longer qualifies for hedge accounting. Any gain or loss recognised in other comprehensive income and accumulated in equity at that time remains in equity and is recognised when the forecast transaction is ultimately recognised in profit or loss. When a forecast transaction is no longer expected to occur, the gain or loss accumulated in equity is recognised immediately in profit or loss.
Pensions and other post-employment benefits
Employees’ end of service benefitsThe Group provides end of service benefits to certain employees. The entitlement to these benefits is usually based upon the employees’ length of service and the completion of a minimum service period and year, the expected costs of these benefits are accrued over the years of employment. With respect to its UAE national employees, the Group makes contributions to the Abu Dhabi Retirement Pensions and Benefits Fund calculated as a percentage of the employees’ salaries. Where the Group’s obligations are limited to these contributions made to pension and benefit funds, these contributions are expensed on a monthly basis and paid when due.
Defined benefit pension planThe cost of defined benefit pension plans and other post employment medical benefits and the presnt value of the pension obligation are determined using actuarial valuations. The cost of providing benefits under defined benefit plans is determined using the projected unit credit method. Remeasurements, comprising of actuarial gains and losses, the effect of the asset ceiling, excluding amounts included in net interest on the net defined benefit liability and the return on plan assets (excluding amounts included in net interest on the net defined benefit liability), are recognised immediately in the statement of financial position with a corresponding debit or credit to retained earnings through other comprehensive income in the period in which they occur. Remeasurements are not reclassified to profit or loss in subsequent periods.
Provisions
GeneralProvisions are recognised when the Group has a present obligation (legal or constructive) as a result of a past event, it is probable that an outflow of resources embodying economic benefits will be required to settle the obligation and a reliable estimate can be made of the amount of the obligation. When the Group expects some or all of a provision to be reimbursed, for example under an insurance contract, the reimbursement is recognised as a separate asset but only when the reimbursement is virtually certain. The expense relating to any provision is presented in the consolidated income statement net of any reimbursement. If the effect of the time value of money is material, provisions are discounted using a current pre tax rate that reflects the time value of money and where appropriate, the risks specific to the liability. Where discounting is used, the increase in the provision due to the passage of time is recognised as a finance cost.
Asset retirement obligations/ decommissioning liabilityCertain subsidiaries have legal obligations in respect of site restoration and abandonment of their power generation and water desalination assets and oil and gas properties at the end of their useful lives (decommissioning costs). The Group records a provision for the site restoration and abandonment based upon estimated costs at the end of their useful lives. Accordingly, a corresponding asset is recognised in property, plant and equipment. Decommissioning costs are recorded at the present value of expected costs to settle the obligations using estimated cash flows and are recognised as part of the cost of each specific asset. The cash flows are discounted at a rate that reflects the risks specific to the decommissioning liability. The accretion is expensed as incurred and recognised in the consolidated income statement as a finance cost. The estimated future costs of the asset retirement obligation are reviewed annually and adjusted as appropriate. Changes to provisions based on revised costs estimates or discount rate applied charges are added to or deducted from the cost of the relevant asset.
Production bonusesThe Group’s production sharing contract contains a legal obligation for production bonuses to be paid to the Kurdistan Regional Government when certain production targets are achieved. The Group records a provision for these bonuses when it is probable that an outflow of resources embodying economic benefits will be required to settle the obligation. This is assessed based on the Group’s share of proved and probable reserves under the production sharing contract.
ContingenciesFrom time to time the Group receives claims in the ordinary course of business. Liabilities and contingencies in connection with these matters are periodically assessed based upon the latest information available, usually with the assistance of lawyers and other specialists. A liability is accrued only if an adverse outcome is more likely than not and the amount of the loss can be reasonably estimated. If one of these conditions is not met, the claim is disclosed as a contingent liability, if material. The actual outcome of a claim may differ from the estimated liability and consequently may affect the financial performance and position of the Group.
2.6 Standards issued but not yet effectiveThe following standards and interpretations are issued, but not yet effective, up to the date of issuance of the Group’s consolidated financial statements. With the exception of IFRS 16 which is detailed below, none of the new standards or amendments are expected to have a material impact on the Group’s consolidated financial statements:
• IFRS 16 Leases;• Amendments to IFRS 10/IAS 28: Sale or Contribution of Assets
between an Investor and its Associate or Joint Venture;• Amendments to IFRS 9: Prepayment Features with Negative
Compensation• Amendments to IAS 19: Plan Amendment, Curtailment or Settlement• IFRIC Interpretation 23 Uncertainty over Income Tax treatments; and• Amendments to IAS 28 – Long-term interests in associates and
joint ventures• IFRS 3 Business Combination – Business combination achieved
in stages
Abu Dhabi National Energy Company PJSC (TAQA)
46
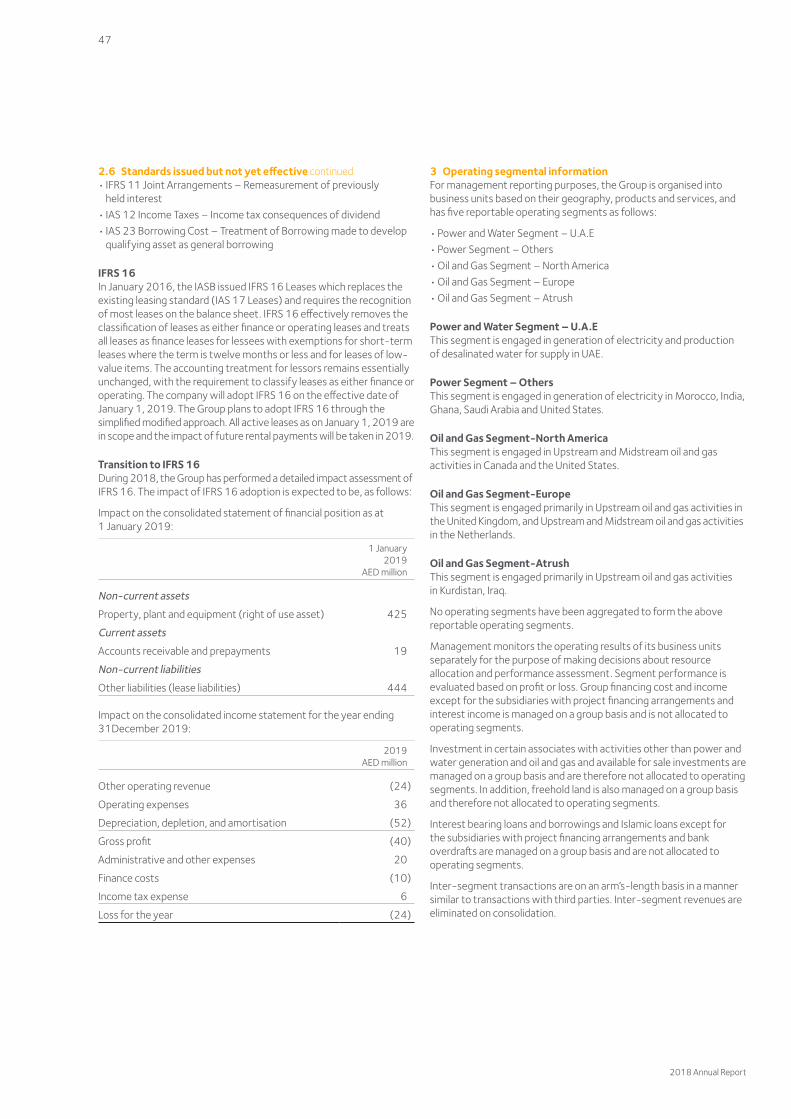
2.6 Standards issued but not yet effective continued• IFRS 11 Joint Arrangements – Remeasurement of previously
held interest• IAS 12 Income Taxes – Income tax consequences of dividend• IAS 23 Borrowing Cost – Treatment of Borrowing made to develop
qualifying asset as general borrowing
IFRS 16In January 2016, the IASB issued IFRS 16 Leases which replaces the existing leasing standard (IAS 17 Leases) and requires the recognition of most leases on the balance sheet. IFRS 16 effectively removes the classification of leases as either finance or operating leases and treats all leases as finance leases for lessees with exemptions for short-term leases where the term is twelve months or less and for leases of low-value items. The accounting treatment for lessors remains essentially unchanged, with the requirement to classify leases as either finance or operating. The company will adopt IFRS 16 on the effective date of January 1, 2019. The Group plans to adopt IFRS 16 through the simplified modified approach. All active leases as on January 1, 2019 are in scope and the impact of future rental payments will be taken in 2019.
Transition to IFRS 16During 2018, the Group has performed a detailed impact assessment of IFRS 16. The impact of IFRS 16 adoption is expected to be, as follows:
Impact on the consolidated statement of financial position as at 1 January 2019:
1 January2019
AED million
Non-current assets
Property, plant and equipment (right of use asset) 425
Current assets
Accounts receivable and prepayments 19
Non-current liabilities
Other liabilities (lease liabilities) 444
Impact on the consolidated income statement for the year ending 31December 2019:
2019AED million
Other operating revenue (24)
Operating expenses 36
Depreciation, depletion, and amortisation (52)
Gross profit (40)
Administrative and other expenses 20
Finance costs (10)
Income tax expense 6
Loss for the year (24)
3 Operating segmental informationFor management reporting purposes, the Group is organised into business units based on their geography, products and services, and has five reportable operating segments as follows:
• Power and Water Segment – U.A.E• Power Segment – Others• Oil and Gas Segment – North America• Oil and Gas Segment – Europe• Oil and Gas Segment – Atrush
Power and Water Segment – U.A.EThis segment is engaged in generation of electricity and production of desalinated water for supply in UAE.
Power Segment – OthersThis segment is engaged in generation of electricity in Morocco, India, Ghana, Saudi Arabia and United States.
Oil and Gas Segment-North AmericaThis segment is engaged in Upstream and Midstream oil and gas activities in Canada and the United States.
Oil and Gas Segment-EuropeThis segment is engaged primarily in Upstream oil and gas activities in the United Kingdom, and Upstream and Midstream oil and gas activities in the Netherlands.
Oil and Gas Segment-AtrushThis segment is engaged primarily in Upstream oil and gas activities in Kurdistan, Iraq.
No operating segments have been aggregated to form the above reportable operating segments.
Management monitors the operating results of its business units separately for the purpose of making decisions about resource allocation and performance assessment. Segment performance is evaluated based on profit or loss. Group financing cost and income except for the subsidiaries with project financing arrangements and interest income is managed on a group basis and is not allocated to operating segments.
Investment in certain associates with activities other than power and water generation and oil and gas and available for sale investments are managed on a group basis and are therefore not allocated to operating segments. In addition, freehold land is also managed on a group basis and therefore not allocated to operating segments.
Interest bearing loans and borrowings and Islamic loans except for the subsidiaries with project financing arrangements and bank overdrafts are managed on a group basis and are not allocated to operating segments.
Inter-segment transactions are on an arm’s-length basis in a manner similar to transactions with third parties. Inter-segment revenues are eliminated on consolidation.
2018 Annual Report
47
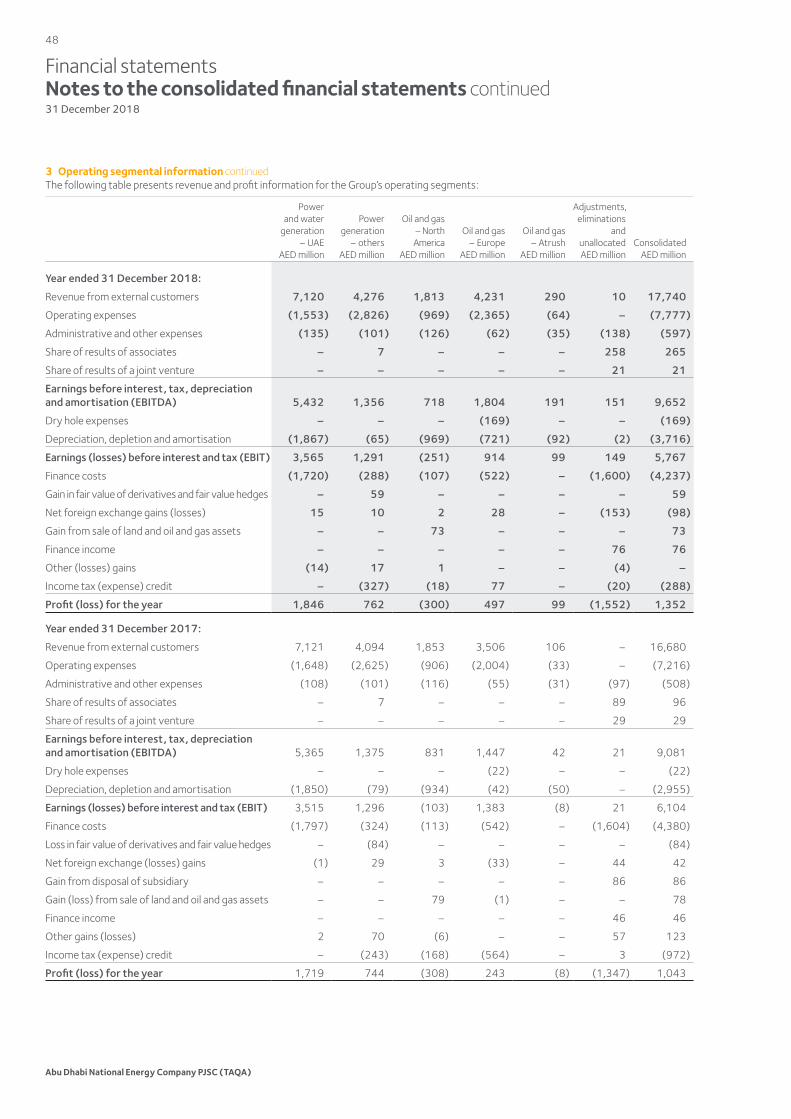
Financial statementsNotes to the consolidated financial statements continued31 December 2018
3 Operating segmental information continuedThe following table presents revenue and profit information for the Group’s operating segments:
Powerand water
generation – UAE
AED million
Powergeneration
– othersAED million
Oil and gas– North
AmericaAED million
Oil and gas– Europe
AED million
Oil and gas– Atrush
AED million
Adjustments,eliminations
andunallocatedAED million
ConsolidatedAED million
Year ended 31 December 2018:
Revenue from external customers 7,120 4,276 1,813 4,231 290 10 17,740
Operating expenses (1,553) (2,826) (969) (2,365) (64) – (7,777)
Administrative and other expenses (135) (101) (126) (62) (35) (138) (597)
Share of results of associates – 7 – – – 258 265
Share of results of a joint venture – – – – – 21 21
Earnings before interest, tax, depreciation and amortisation (EBITDA) 5,432 1,356 718 1,804 191 151 9,652
Dry hole expenses – – – (169) – – (169)
Depreciation, depletion and amortisation (1,867) (65) (969) (721) (92) (2) (3,716)
Earnings (losses) before interest and tax (EBIT) 3,565 1,291 (251) 914 99 149 5,767
Finance costs (1,720) (288) (107) (522) – (1,600) (4,237)
Gain in fair value of derivatives and fair value hedges – 59 – – – – 59
Net foreign exchange gains (losses) 15 10 2 28 – (153) (98)
Gain from sale of land and oil and gas assets – – 73 – – – 73
Finance income – – – – – 76 76
Other (losses) gains (14) 17 1 – – (4) –
Income tax (expense) credit – (327) (18) 77 – (20) (288)
Profit (loss) for the year 1,846 762 (300) 497 99 (1,552) 1,352
Year ended 31 December 2017:
Revenue from external customers 7,121 4,094 1,853 3,506 106 – 16,680
Operating expenses (1,648) (2,625) (906) (2,004) (33) – (7,216)
Administrative and other expenses (108) (101) (116) (55) (31) (97) (508)
Share of results of associates – 7 – – – 89 96
Share of results of a joint venture – – – – – 29 29
Earnings before interest, tax, depreciation and amortisation (EBITDA) 5,365 1,375 831 1,447 42 21 9,081
Dry hole expenses – – – (22) – – (22)
Depreciation, depletion and amortisation (1,850) (79) (934) (42) (50) – (2,955)
Earnings (losses) before interest and tax (EBIT) 3,515 1,296 (103) 1,383 (8) 21 6,104
Finance costs (1,797) (324) (113) (542) – (1,604) (4,380)
Loss in fair value of derivatives and fair value hedges – (84) – – – – (84)
Net foreign exchange (losses) gains (1) 29 3 (33) – 44 42
Gain from disposal of subsidiary – – – – – 86 86
Gain (loss) from sale of land and oil and gas assets – – 79 (1) – – 78
Finance income – – – – – 46 46
Other gains (losses) 2 70 (6) – – 57 123
Income tax (expense) credit – (243) (168) (564) – 3 (972)
Profit (loss) for the year 1,719 744 (308) 243 (8) (1,347) 1,043
Abu Dhabi National Energy Company PJSC (TAQA)
48
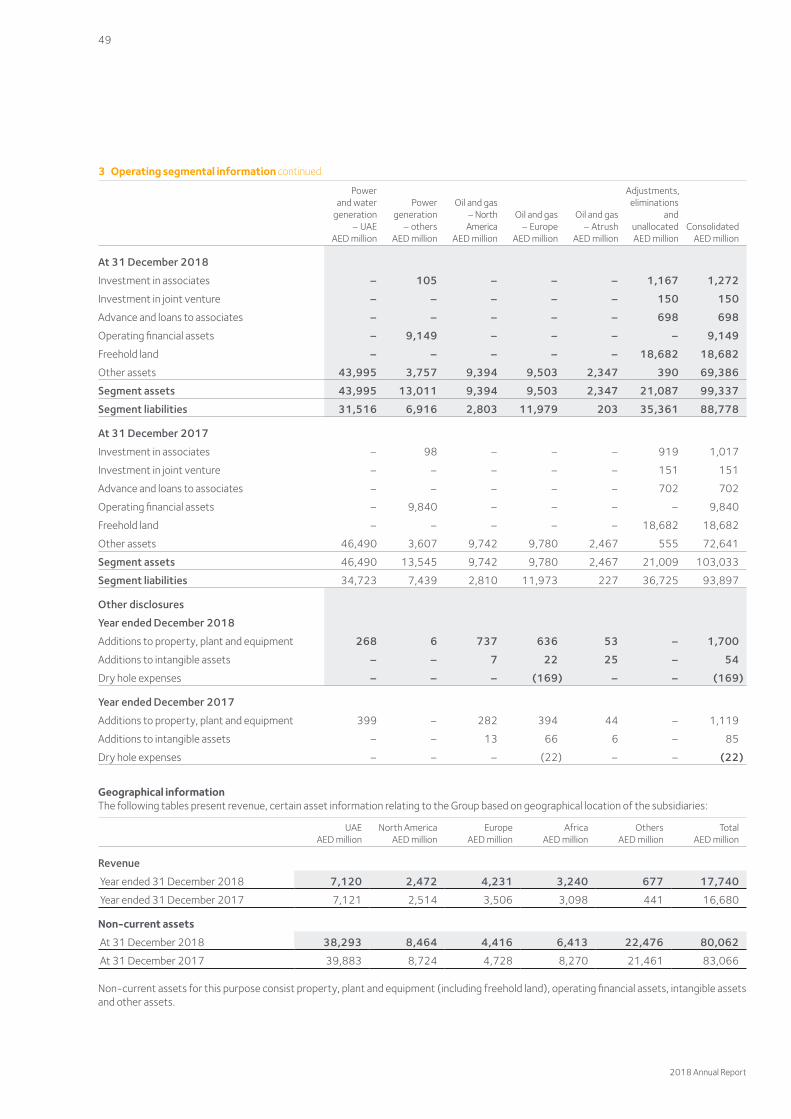
3 Operating segmental information continued
Powerand water
generation – UAE
AED million
Powergeneration
– othersAED million
Oil and gas– North
AmericaAED million
Oil and gas– Europe
AED million
Oil and gas– Atrush
AED million
Adjustments,eliminations
andunallocatedAED million
ConsolidatedAED million
At 31 December 2018
Investment in associates – 105 – – – 1,167 1,272
Investment in joint venture – – – – – 150 150
Advance and loans to associates – – – – – 698 698
Operating financial assets – 9,149 – – – – 9,149
Freehold land – – – – – 18,682 18,682
Other assets 43,995 3,757 9,394 9,503 2,347 390 69,386
Segment assets 43,995 13,011 9,394 9,503 2,347 21,087 99,337
Segment liabilities 31,516 6,916 2,803 11,979 203 35,361 88,778
At 31 December 2017
Investment in associates – 98 – – – 919 1,017
Investment in joint venture – – – – – 151 151
Advance and loans to associates – – – – – 702 702
Operating financial assets – 9,840 – – – – 9,840
Freehold land – – – – – 18,682 18,682
Other assets 46,490 3,607 9,742 9,780 2,467 555 72,641
Segment assets 46,490 13,545 9,742 9,780 2,467 21,009 103,033
Segment liabilities 34,723 7,439 2,810 11,973 227 36,725 93,897
Other disclosures
Year ended December 2018
Additions to property, plant and equipment 268 6 737 636 53 – 1,700
Additions to intangible assets – – 7 22 25 – 54
Dry hole expenses – – – (169) – – (169)
Year ended December 2017
Additions to property, plant and equipment 399 – 282 394 44 – 1,119
Additions to intangible assets – – 13 66 6 – 85
Dry hole expenses – – – (22) – – (22)
Geographical informationThe following tables present revenue, certain asset information relating to the Group based on geographical location of the subsidiaries:
UAEAED million
North AmericaAED million
EuropeAED million
AfricaAED million
OthersAED million
TotalAED million
Revenue
Year ended 31 December 2018 7,120 2,472 4,231 3,240 677 17,740
Year ended 31 December 2017 7,121 2,514 3,506 3,098 441 16,680
Non-current assets
At 31 December 2018 38,293 8,464 4,416 6,413 22,476 80,062
At 31 December 2017 39,883 8,724 4,728 8,270 21,461 83,066
Non-current assets for this purpose consist property, plant and equipment (including freehold land), operating financial assets, intangible assets and other assets.
2018 Annual Report
49
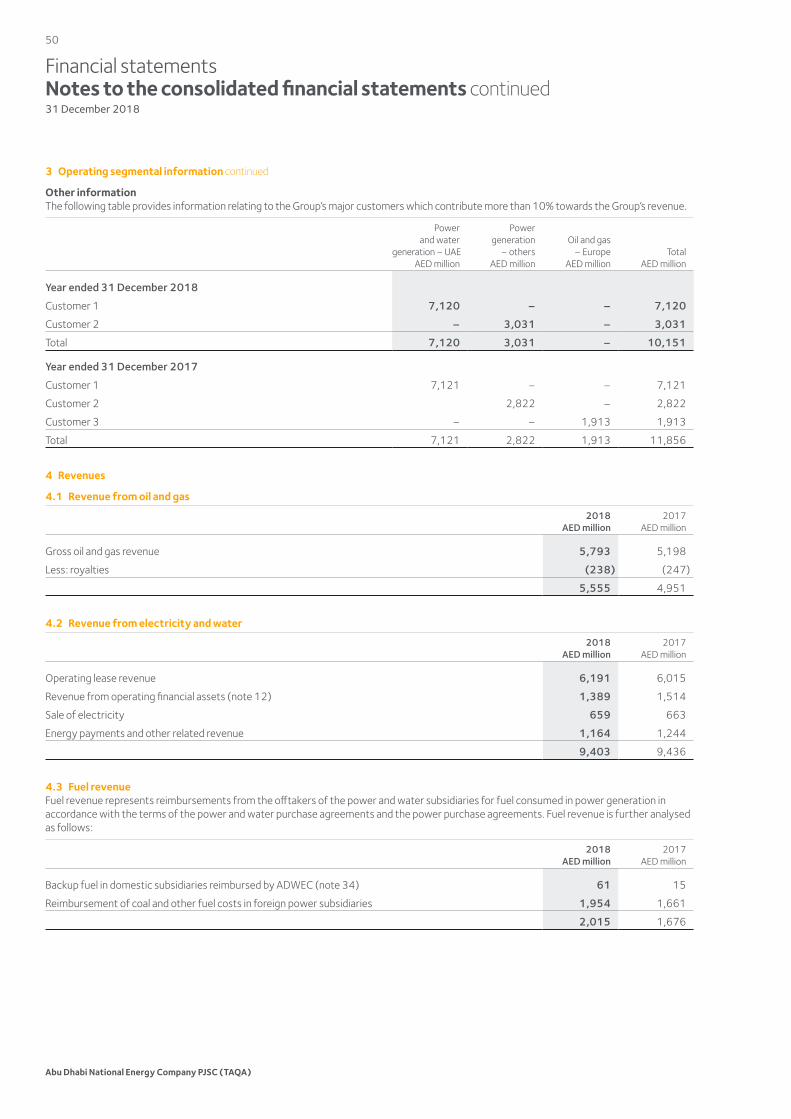
Financial statementsNotes to the consolidated financial statements continued31 December 2018
3 Operating segmental information continued
Other informationThe following table provides information relating to the Group’s major customers which contribute more than 10% towards the Group’s revenue.
Power and water
generation – UAEAED million
Powergeneration
– othersAED million
Oil and gas– Europe
AED millionTotal
AED million
Year ended 31 December 2018
Customer 1 7,120 – – 7,120
Customer 2 – 3,031 – 3,031
Total 7,120 3,031 – 10,151
Year ended 31 December 2017
Customer 1 7,121 – – 7,121
Customer 2 2,822 – 2,822
Customer 3 – – 1,913 1,913
Total 7,121 2,822 1,913 11,856
4 Revenues
4.1 Revenue from oil and gas
2018AED million
2017AED million
Gross oil and gas revenue 5,793 5,198
Less: royalties (238) (247)
5,555 4,951
4.2 Revenue from electricity and water
2018AED million
2017AED million
Operating lease revenue 6,191 6,015
Revenue from operating financial assets (note 12) 1,389 1,514
Sale of electricity 659 663
Energy payments and other related revenue 1,164 1,244
9,403 9,436
4.3 Fuel revenueFuel revenue represents reimbursements from the offtakers of the power and water subsidiaries for fuel consumed in power generation in accordance with the terms of the power and water purchase agreements and the power purchase agreements. Fuel revenue is further analysed as follows:
2018AED million
2017AED million
Backup fuel in domestic subsidiaries reimbursed by ADWEC (note 34) 61 15
Reimbursement of coal and other fuel costs in foreign power subsidiaries 1,954 1,661
2,015 1,676
Abu Dhabi National Energy Company PJSC (TAQA)
50
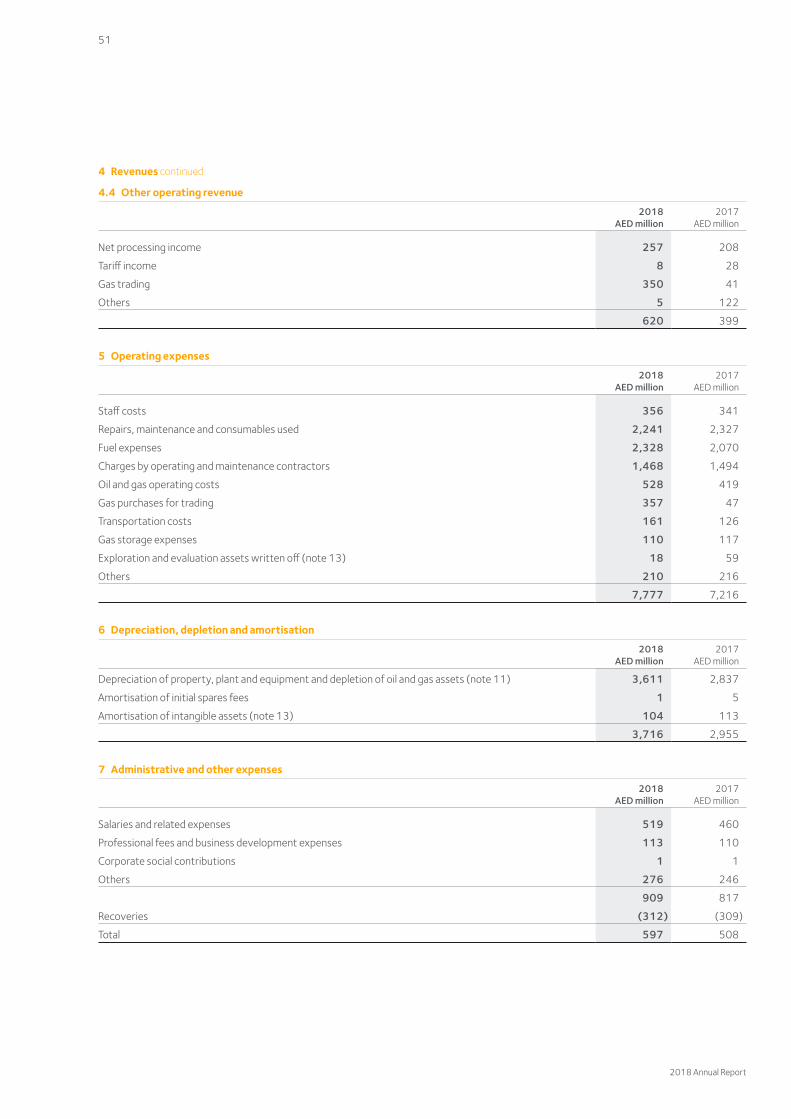
4 Revenues continued
4.4 Other operating revenue
2018AED million
2017AED million
Net processing income 257 208
Tariff income 8 28
Gas trading 350 41
Others 5 122
620 399
5 Operating expenses
2018AED million
2017AED million
Staff costs 356 341
Repairs, maintenance and consumables used 2,241 2,327
Fuel expenses 2,328 2,070
Charges by operating and maintenance contractors 1,468 1,494
Oil and gas operating costs 528 419
Gas purchases for trading 357 47
Transportation costs 161 126
Gas storage expenses 110 117
Exploration and evaluation assets written off (note 13) 18 59
Others 210 216
7,777 7,216
6 Depreciation, depletion and amortisation
2018AED million
2017AED million
Depreciation of property, plant and equipment and depletion of oil and gas assets (note 11) 3,611 2,837
Amortisation of initial spares fees 1 5
Amortisation of intangible assets (note 13) 104 113
3,716 2,955
7 Administrative and other expenses
2018AED million
2017AED million
Salaries and related expenses 519 460
Professional fees and business development expenses 113 110
Corporate social contributions 1 1
Others 276 246
909 817
Recoveries (312) (309)
Total 597 508
2018 Annual Report
51
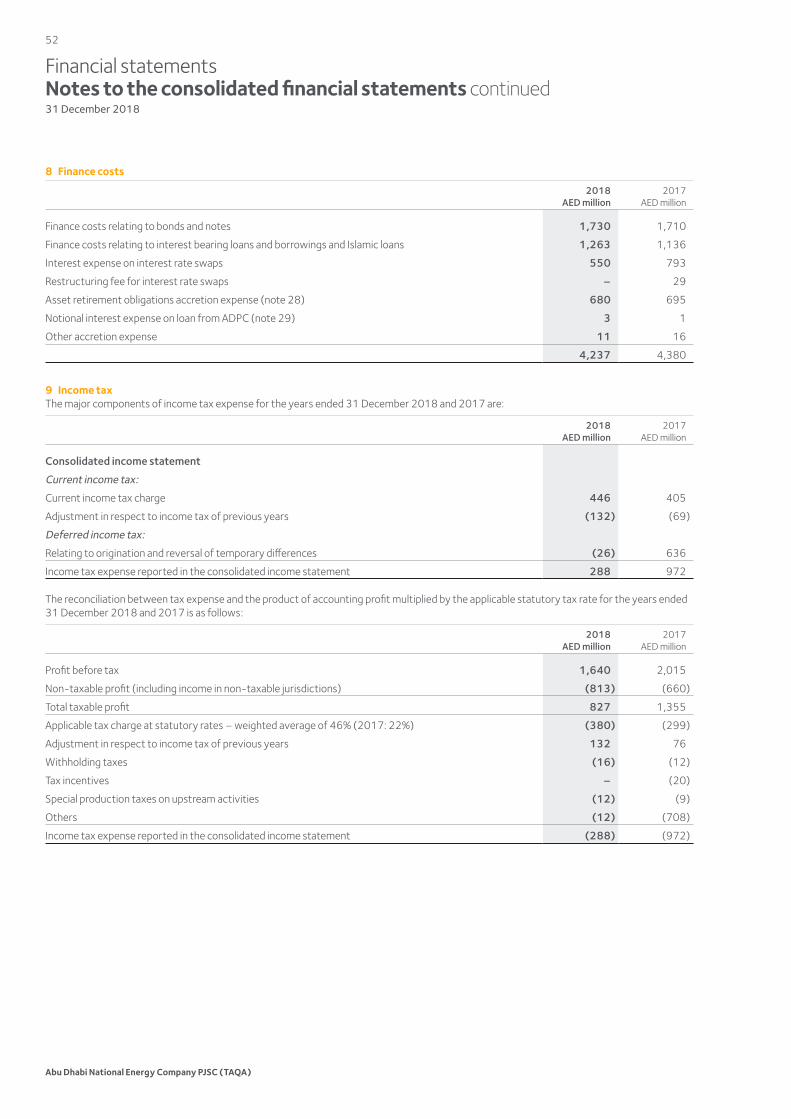
Financial statementsNotes to the consolidated financial statements continued31 December 2018
8 Finance costs
2018AED million
2017AED million
Finance costs relating to bonds and notes 1,730 1,710
Finance costs relating to interest bearing loans and borrowings and Islamic loans 1,263 1,136
Interest expense on interest rate swaps 550 793
Restructuring fee for interest rate swaps – 29
Asset retirement obligations accretion expense (note 28) 680 695
Notional interest expense on loan from ADPC (note 29) 3 1
Other accretion expense 11 16
4,237 4,380
9 Income taxThe major components of income tax expense for the years ended 31 December 2018 and 2017 are:
2018AED million
2017AED million
Consolidated income statement
Current income tax:
Current income tax charge 446 405
Adjustment in respect to income tax of previous years (132) (69)
Deferred income tax:
Relating to origination and reversal of temporary differences (26) 636
Income tax expense reported in the consolidated income statement 288 972
The reconciliation between tax expense and the product of accounting profit multiplied by the applicable statutory tax rate for the years ended 31 December 2018 and 2017 is as follows:
2018AED million
2017AED million
Profit before tax 1,640 2,015
Non-taxable profit (including income in non-taxable jurisdictions) (813) (660)
Total taxable profit 827 1,355
Applicable tax charge at statutory rates – weighted average of 46% (2017: 22%) (380) (299)
Adjustment in respect to income tax of previous years 132 76
Withholding taxes (16) (12)
Tax incentives – (20)
Special production taxes on upstream activities (12) (9)
Others (12) (708)
Income tax expense reported in the consolidated income statement (288) (972)
Abu Dhabi National Energy Company PJSC (TAQA)
52
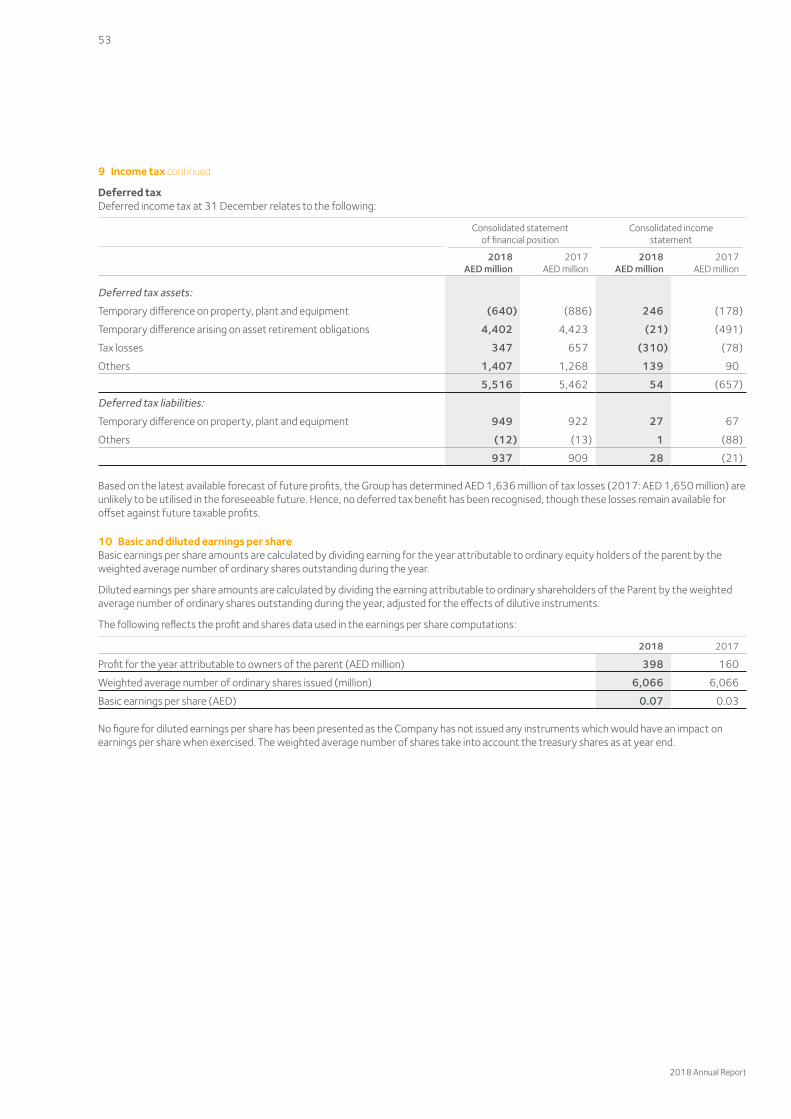
9 Income tax continued
Deferred taxDeferred income tax at 31 December relates to the following:
Consolidated statement of financial position
Consolidated income statement
2018AED million
2017AED million
2018AED million
2017AED million
Deferred tax assets:
Temporary difference on property, plant and equipment (640) (886) 246 (178)
Temporary difference arising on asset retirement obligations 4,402 4,423 (21) (491)
Tax losses 347 657 (310) (78)
Others 1,407 1,268 139 90
5,516 5,462 54 (657)
Deferred tax liabilities:
Temporary difference on property, plant and equipment 949 922 27 67
Others (12) (13) 1 (88)
937 909 28 (21)
Based on the latest available forecast of future profits, the Group has determined AED 1,636 million of tax losses (2017: AED 1,650 million) are unlikely to be utilised in the foreseeable future. Hence, no deferred tax benefit has been recognised, though these losses remain available for offset against future taxable profits.
10 Basic and diluted earnings per shareBasic earnings per share amounts are calculated by dividing earning for the year attributable to ordinary equity holders of the parent by the weighted average number of ordinary shares outstanding during the year.
Diluted earnings per share amounts are calculated by dividing the earning attributable to ordinary shareholders of the Parent by the weighted average number of ordinary shares outstanding during the year, adjusted for the effects of dilutive instruments.
The following reflects the profit and shares data used in the earnings per share computations:
2018 2017
Profit for the year attributable to owners of the parent (AED million) 398 160
Weighted average number of ordinary shares issued (million) 6,066 6,066
Basic earnings per share (AED) 0.07 0.03
No figure for diluted earnings per share has been presented as the Company has not issued any instruments which would have an impact on earnings per share when exercised. The weighted average number of shares take into account the treasury shares as at year end.
2018 Annual Report
53
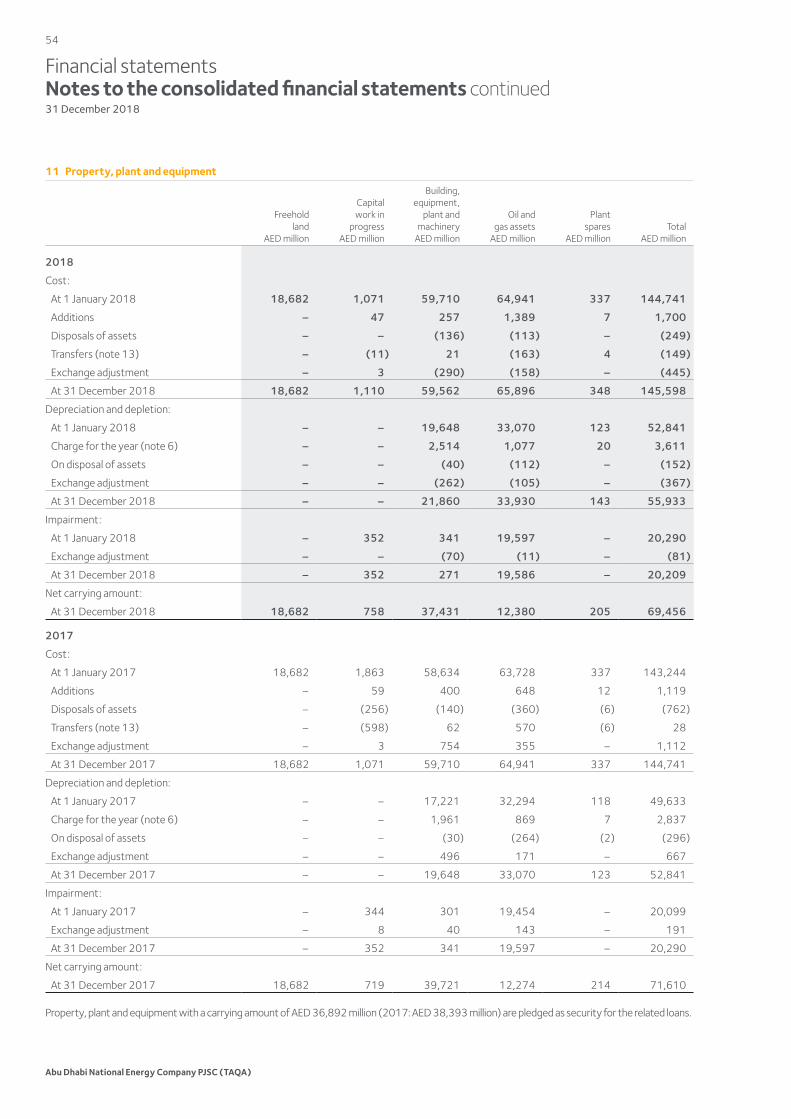
Financial statementsNotes to the consolidated financial statements continued31 December 2018
11 Property, plant and equipment
Freeholdland
AED million
Capitalwork in
progressAED million
Building,equipment,
plant andmachinery
AED million
Oil andgas assets
AED million
Plantspares
AED millionTotal
AED million
2018
Cost:
At 1 January 2018 18,682 1,071 59,710 64,941 337 144,741
Additions – 47 257 1,389 7 1,700
Disposals of assets – – (136) (113) – (249)
Transfers (note 13) – (11) 21 (163) 4 (149)
Exchange adjustment – 3 (290) (158) – (445)
At 31 December 2018 18,682 1,110 59,562 65,896 348 145,598
Depreciation and depletion:
At 1 January 2018 – – 19,648 33,070 123 52,841
Charge for the year (note 6) – – 2,514 1,077 20 3,611
On disposal of assets – – (40) (112) – (152)
Exchange adjustment – – (262) (105) – (367)
At 31 December 2018 – – 21,860 33,930 143 55,933
Impairment:
At 1 January 2018 – 352 341 19,597 – 20,290
Exchange adjustment – – (70) (11) – (81)
At 31 December 2018 – 352 271 19,586 – 20,209
Net carrying amount:
At 31 December 2018 18,682 758 37,431 12,380 205 69,456
2017
Cost:
At 1 January 2017 18,682 1,863 58,634 63,728 337 143,244
Additions – 59 400 648 12 1,119
Disposals of assets – (256) (140) (360) (6) (762)
Transfers (note 13) – (598) 62 570 (6) 28
Exchange adjustment – 3 754 355 – 1,112
At 31 December 2017 18,682 1,071 59,710 64,941 337 144,741
Depreciation and depletion:
At 1 January 2017 – – 17,221 32,294 118 49,633
Charge for the year (note 6) – – 1,961 869 7 2,837
On disposal of assets – – (30) (264) (2) (296)
Exchange adjustment – – 496 171 – 667
At 31 December 2017 – – 19,648 33,070 123 52,841
Impairment:
At 1 January 2017 – 344 301 19,454 – 20,099
Exchange adjustment – 8 40 143 – 191
At 31 December 2017 – 352 341 19,597 – 20,290
Net carrying amount:
At 31 December 2017 18,682 719 39,721 12,274 214 71,610
Property, plant and equipment with a carrying amount of AED 36,892 million (2017: AED 38,393 million) are pledged as security for the related loans.
Abu Dhabi National Energy Company PJSC (TAQA)
54
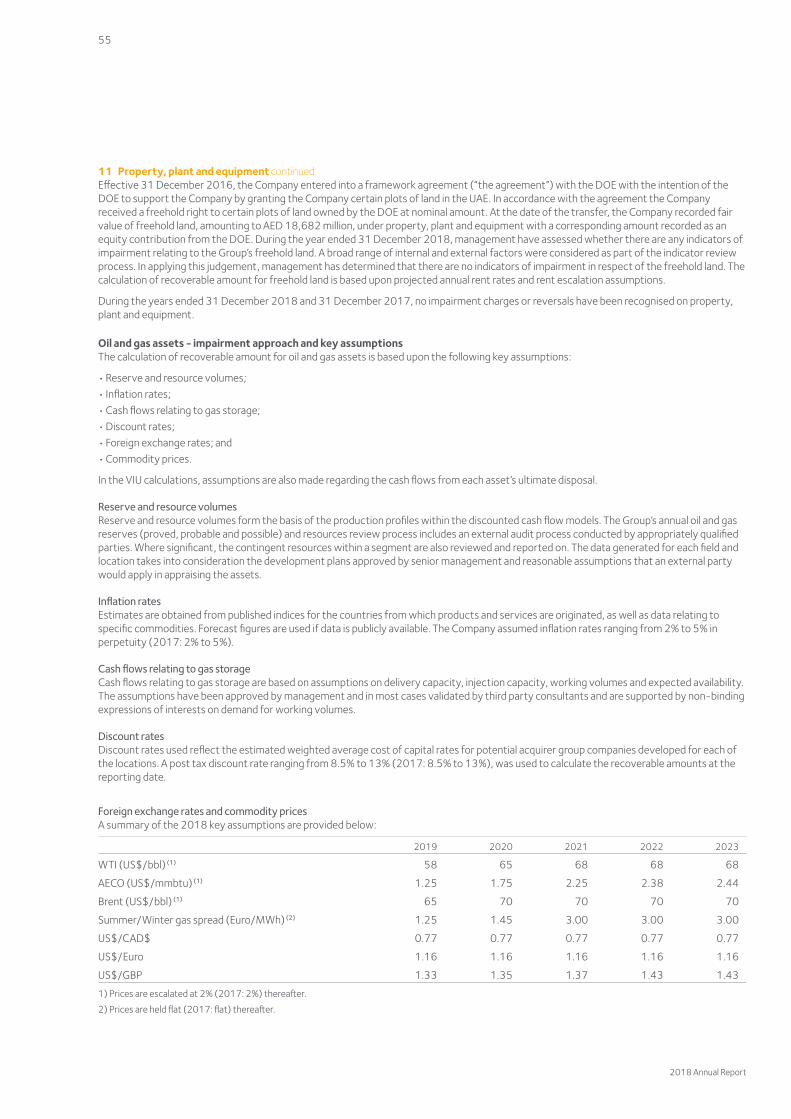
11 Property, plant and equipment continuedEffective 31 December 2016, the Company entered into a framework agreement (“the agreement”) with the DOE with the intention of the DOE to support the Company by granting the Company certain plots of land in the UAE. In accordance with the agreement the Company received a freehold right to certain plots of land owned by the DOE at nominal amount. At the date of the transfer, the Company recorded fair value of freehold land, amounting to AED 18,682 million, under property, plant and equipment with a corresponding amount recorded as an equity contribution from the DOE. During the year ended 31 December 2018, management have assessed whether there are any indicators of impairment relating to the Group’s freehold land. A broad range of internal and external factors were considered as part of the indicator review process. In applying this judgement, management has determined that there are no indicators of impairment in respect of the freehold land. The calculation of recoverable amount for freehold land is based upon projected annual rent rates and rent escalation assumptions.
During the years ended 31 December 2018 and 31 December 2017, no impairment charges or reversals have been recognised on property, plant and equipment.
Oil and gas assets - impairment approach and key assumptionsThe calculation of recoverable amount for oil and gas assets is based upon the following key assumptions:
• Reserve and resource volumes;• Inflation rates;• Cash flows relating to gas storage;• Discount rates;• Foreign exchange rates; and• Commodity prices.
In the VIU calculations, assumptions are also made regarding the cash flows from each asset’s ultimate disposal.
Reserve and resource volumesReserve and resource volumes form the basis of the production profiles within the discounted cash flow models. The Group’s annual oil and gas reserves (proved, probable and possible) and resources review process includes an external audit process conducted by appropriately qualified parties. Where significant, the contingent resources within a segment are also reviewed and reported on. The data generated for each field and location takes into consideration the development plans approved by senior management and reasonable assumptions that an external party would apply in appraising the assets.
Inflation ratesEstimates are obtained from published indices for the countries from which products and services are originated, as well as data relating to specific commodities. Forecast figures are used if data is publicly available. The Company assumed inflation rates ranging from 2% to 5% in perpetuity (2017: 2% to 5%).
Cash flows relating to gas storageCash flows relating to gas storage are based on assumptions on delivery capacity, injection capacity, working volumes and expected availability. The assumptions have been approved by management and in most cases validated by third party consultants and are supported by non-binding expressions of interests on demand for working volumes.
Discount ratesDiscount rates used reflect the estimated weighted average cost of capital rates for potential acquirer group companies developed for each of the locations. A post tax discount rate ranging from 8.5% to 13% (2017: 8.5% to 13%), was used to calculate the recoverable amounts at the reporting date.
Foreign exchange rates and commodity pricesA summary of the 2018 key assumptions are provided below:
2019 2020 2021 2022 2023
WTI (US$/bbl) (1) 58 65 68 68 68
AECO (US$/mmbtu) (1) 1.25 1.75 2.25 2.38 2.44
Brent (US$/bbl) (1) 65 70 70 70 70
Summer/Winter gas spread (Euro/MWh) (2) 1.25 1.45 3.00 3.00 3.00
US$/CAD$ 0.77 0.77 0.77 0.77 0.77
US$/Euro 1.16 1.16 1.16 1.16 1.16
US$/GBP 1.33 1.35 1.37 1.43 1.43
1) Prices are escalated at 2% (2017: 2%) thereafter.
2) Prices are held flat (2017: flat) thereafter.
2018 Annual Report
55
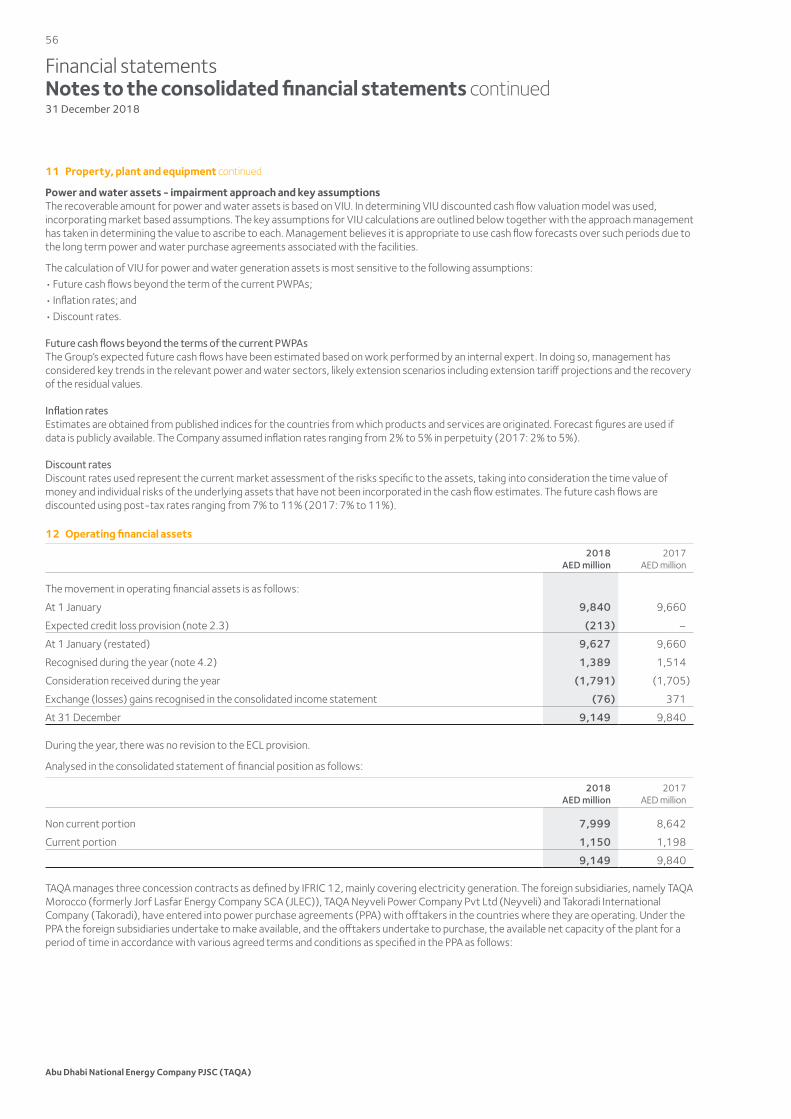
Financial statementsNotes to the consolidated financial statements continued31 December 2018
11 Property, plant and equipment continued
Power and water assets - impairment approach and key assumptionsThe recoverable amount for power and water assets is based on VIU. In determining VIU discounted cash flow valuation model was used, incorporating market based assumptions. The key assumptions for VIU calculations are outlined below together with the approach management has taken in determining the value to ascribe to each. Management believes it is appropriate to use cash flow forecasts over such periods due to the long term power and water purchase agreements associated with the facilities.
The calculation of VIU for power and water generation assets is most sensitive to the following assumptions:• Future cash flows beyond the term of the current PWPAs;• Inflation rates; and• Discount rates.
Future cash flows beyond the terms of the current PWPAsThe Group’s expected future cash flows have been estimated based on work performed by an internal expert. In doing so, management has considered key trends in the relevant power and water sectors, likely extension scenarios including extension tariff projections and the recovery of the residual values.
Inflation ratesEstimates are obtained from published indices for the countries from which products and services are originated. Forecast figures are used if data is publicly available. The Company assumed inflation rates ranging from 2% to 5% in perpetuity (2017: 2% to 5%).
Discount ratesDiscount rates used represent the current market assessment of the risks specific to the assets, taking into consideration the time value of money and individual risks of the underlying assets that have not been incorporated in the cash flow estimates. The future cash flows are discounted using post-tax rates ranging from 7% to 11% (2017: 7% to 11%).
12 Operating financial assets
2018AED million
2017AED million
The movement in operating financial assets is as follows:
At 1 January 9,840 9,660
Expected credit loss provision (note 2.3) (213) –
At 1 January (restated) 9,627 9,660
Recognised during the year (note 4.2) 1,389 1,514
Consideration received during the year (1,791) (1,705)
Exchange (losses) gains recognised in the consolidated income statement (76) 371
At 31 December 9,149 9,840
During the year, there was no revision to the ECL provision.
Analysed in the consolidated statement of financial position as follows:
2018AED million
2017AED million
Non current portion 7,999 8,642
Current portion 1,150 1,198
9,149 9,840
TAQA manages three concession contracts as defined by IFRIC 12, mainly covering electricity generation. The foreign subsidiaries, namely TAQA Morocco (formerly Jorf Lasfar Energy Company SCA (JLEC)), TAQA Neyveli Power Company Pvt Ltd (Neyveli) and Takoradi International Company (Takoradi), have entered into power purchase agreements (PPA) with offtakers in the countries where they are operating. Under the PPA the foreign subsidiaries undertake to make available, and the offtakers undertake to purchase, the available net capacity of the plant for a period of time in accordance with various agreed terms and conditions as specified in the PPA as follows:
Abu Dhabi National Energy Company PJSC (TAQA)
56
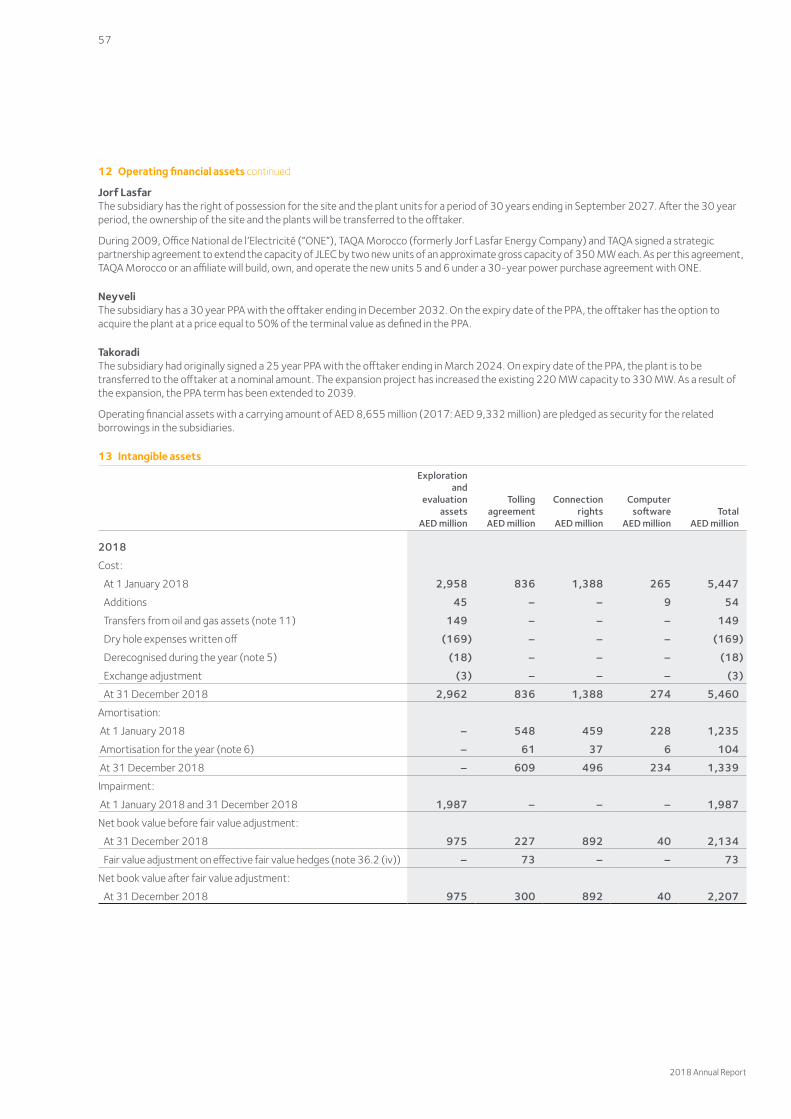
12 Operating financial assets continued
Jorf LasfarThe subsidiary has the right of possession for the site and the plant units for a period of 30 years ending in September 2027. After the 30 year period, the ownership of the site and the plants will be transferred to the offtaker.
During 2009, Office National de l’Electricité (“ONE”), TAQA Morocco (formerly Jorf Lasfar Energy Company) and TAQA signed a strategic partnership agreement to extend the capacity of JLEC by two new units of an approximate gross capacity of 350 MW each. As per this agreement, TAQA Morocco or an affiliate will build, own, and operate the new units 5 and 6 under a 30-year power purchase agreement with ONE.
NeyveliThe subsidiary has a 30 year PPA with the offtaker ending in December 2032. On the expiry date of the PPA, the offtaker has the option to acquire the plant at a price equal to 50% of the terminal value as defined in the PPA.
TakoradiThe subsidiary had originally signed a 25 year PPA with the offtaker ending in March 2024. On expiry date of the PPA, the plant is to be transferred to the offtaker at a nominal amount. The expansion project has increased the existing 220 MW capacity to 330 MW. As a result of the expansion, the PPA term has been extended to 2039.
Operating financial assets with a carrying amount of AED 8,655 million (2017: AED 9,332 million) are pledged as security for the related borrowings in the subsidiaries.
13 Intangible assets
Explorationand
evaluationassets
AED million
TollingagreementAED million
Connectionrights
AED million
Computersoftware
AED millionTotal
AED million
2018
Cost:
At 1 January 2018 2,958 836 1,388 265 5,447
Additions 45 – – 9 54
Transfers from oil and gas assets (note 11) 149 – – – 149
Dry hole expenses written off (169) – – – (169)
Derecognised during the year (note 5) (18) – – – (18)
Exchange adjustment (3) – – – (3)
At 31 December 2018 2,962 836 1,388 274 5,460
Amortisation:
At 1 January 2018 – 548 459 228 1,235
Amortisation for the year (note 6) – 61 37 6 104
At 31 December 2018 – 609 496 234 1,339
Impairment:
At 1 January 2018 and 31 December 2018 1,987 – – – 1,987
Net book value before fair value adjustment:
At 31 December 2018 975 227 892 40 2,134
Fair value adjustment on effective fair value hedges (note 36.2 (iv)) – 73 – – 73
Net book value after fair value adjustment:
At 31 December 2018 975 300 892 40 2,207
2018 Annual Report
57
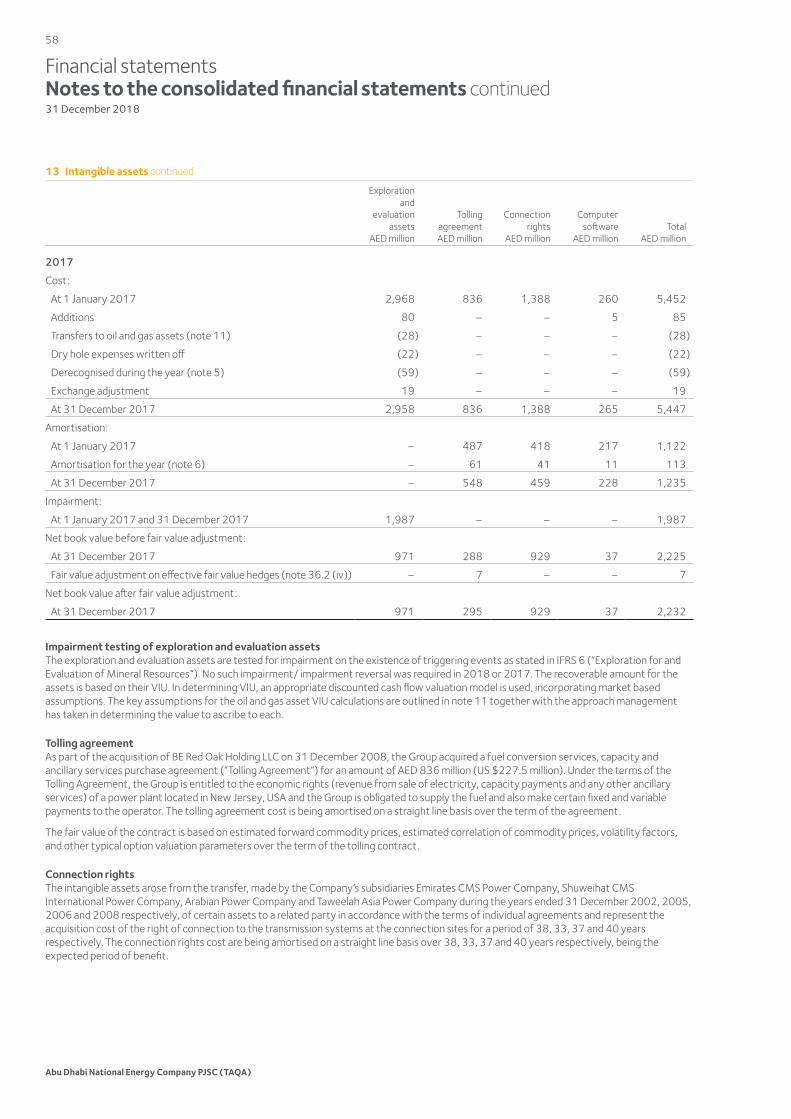
Financial statementsNotes to the consolidated financial statements continued31 December 2018
13 Intangible assets continued
Explorationand
evaluationassets
AED million
TollingagreementAED million
Connectionrights
AED million
Computersoftware
AED millionTotal
AED million
2017
Cost:
At 1 January 2017 2,968 836 1,388 260 5,452
Additions 80 – – 5 85
Transfers to oil and gas assets (note 11) (28) – – – (28)
Dry hole expenses written off (22) – – – (22)
Derecognised during the year (note 5) (59) – – – (59)
Exchange adjustment 19 – – – 19
At 31 December 2017 2,958 836 1,388 265 5,447
Amortisation:
At 1 January 2017 – 487 418 217 1,122
Amortisation for the year (note 6) – 61 41 11 113
At 31 December 2017 – 548 459 228 1,235
Impairment:
At 1 January 2017 and 31 December 2017 1,987 – – – 1,987
Net book value before fair value adjustment:
At 31 December 2017 971 288 929 37 2,225
Fair value adjustment on effective fair value hedges (note 36.2 (iv)) – 7 – – 7
Net book value after fair value adjustment:
At 31 December 2017 971 295 929 37 2,232
Impairment testing of exploration and evaluation assetsThe exploration and evaluation assets are tested for impairment on the existence of triggering events as stated in IFRS 6 (“Exploration for and Evaluation of Mineral Resources”). No such impairment/ impairment reversal was required in 2018 or 2017. The recoverable amount for the assets is based on their VIU. In determining VIU, an appropriate discounted cash flow valuation model is used, incorporating market based assumptions. The key assumptions for the oil and gas asset VIU calculations are outlined in note 11 together with the approach management has taken in determining the value to ascribe to each.
Tolling agreementAs part of the acquisition of BE Red Oak Holding LLC on 31 December 2008, the Group acquired a fuel conversion services, capacity and ancillary services purchase agreement (“Tolling Agreement”) for an amount of AED 836 million (US $227.5 million). Under the terms of the Tolling Agreement, the Group is entitled to the economic rights (revenue from sale of electricity, capacity payments and any other ancillary services) of a power plant located in New Jersey, USA and the Group is obligated to supply the fuel and also make certain fixed and variable payments to the operator. The tolling agreement cost is being amortised on a straight line basis over the term of the agreement.
The fair value of the contract is based on estimated forward commodity prices, estimated correlation of commodity prices, volatility factors, and other typical option valuation parameters over the term of the tolling contract.
Connection rightsThe intangible assets arose from the transfer, made by the Company’s subsidiaries Emirates CMS Power Company, Shuweihat CMS International Power Company, Arabian Power Company and Taweelah Asia Power Company during the years ended 31 December 2002, 2005, 2006 and 2008 respectively, of certain assets to a related party in accordance with the terms of individual agreements and represent the acquisition cost of the right of connection to the transmission systems at the connection sites for a period of 38, 33, 37 and 40 years respectively. The connection rights cost are being amortised on a straight line basis over 38, 33, 37 and 40 years respectively, being the expected period of benefit.
Abu Dhabi National Energy Company PJSC (TAQA)
58
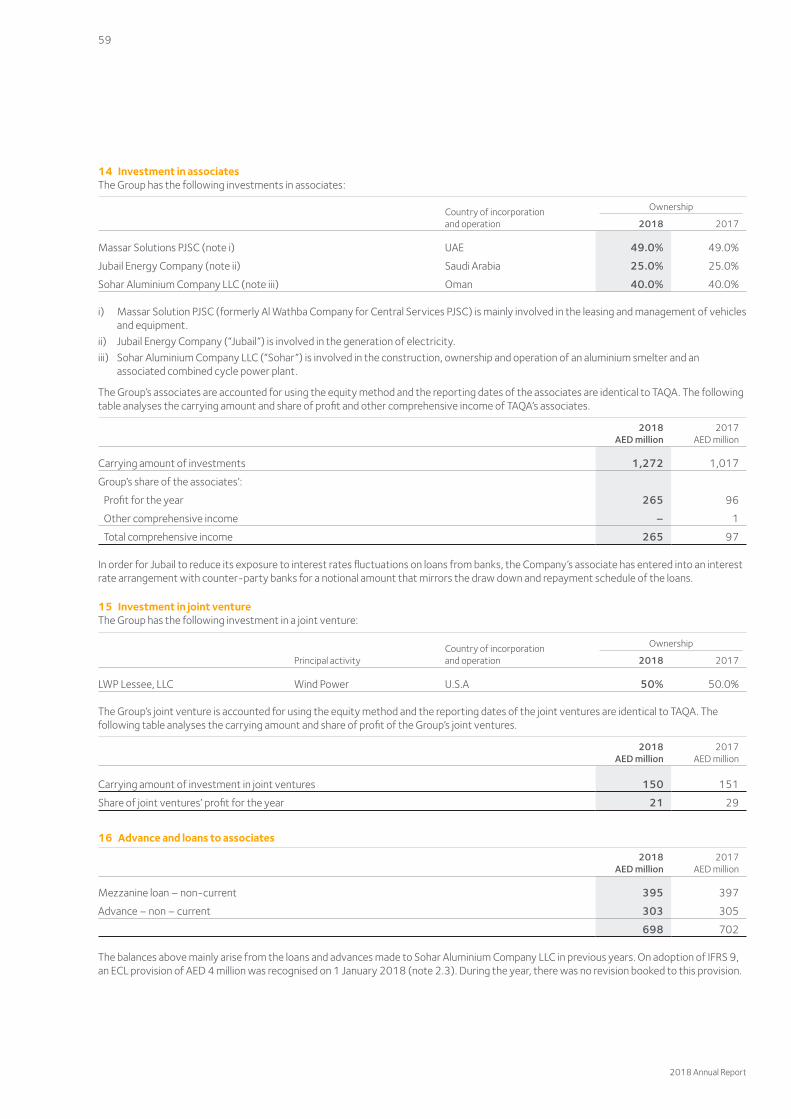
14 Investment in associatesThe Group has the following investments in associates:
Country of incorporation and operation
Ownership
2018 2017
Massar Solutions PJSC (note i) UAE 49.0% 49.0%
Jubail Energy Company (note ii) Saudi Arabia 25.0% 25.0%
Sohar Aluminium Company LLC (note iii) Oman 40.0% 40.0%
i) Massar Solution PJSC (formerly Al Wathba Company for Central Services PJSC) is mainly involved in the leasing and management of vehicles and equipment.
ii) Jubail Energy Company (“Jubail”) is involved in the generation of electricity.iii) Sohar Aluminium Company LLC (“Sohar”) is involved in the construction, ownership and operation of an aluminium smelter and an
associated combined cycle power plant.
The Group’s associates are accounted for using the equity method and the reporting dates of the associates are identical to TAQA. The following table analyses the carrying amount and share of profit and other comprehensive income of TAQA’s associates.
2018AED million
2017AED million
Carrying amount of investments 1,272 1,017
Group’s share of the associates’:
Profit for the year 265 96
Other comprehensive income – 1
Total comprehensive income 265 97
In order for Jubail to reduce its exposure to interest rates fluctuations on loans from banks, the Company’s associate has entered into an interest rate arrangement with counter-party banks for a notional amount that mirrors the draw down and repayment schedule of the loans.
15 Investment in joint ventureThe Group has the following investment in a joint venture:
Principal activityCountry of incorporation and operation
Ownership
2018 2017
LWP Lessee, LLC Wind Power U.S.A 50% 50.0%
The Group’s joint venture is accounted for using the equity method and the reporting dates of the joint ventures are identical to TAQA. The following table analyses the carrying amount and share of profit of the Group’s joint ventures.
2018AED million
2017AED million
Carrying amount of investment in joint ventures 150 151
Share of joint ventures’ profit for the year 21 29
16 Advance and loans to associates
2018AED million
2017AED million
Mezzanine loan – non-current 395 397
Advance – non – current 303 305
698 702
The balances above mainly arise from the loans and advances made to Sohar Aluminium Company LLC in previous years. On adoption of IFRS 9, an ECL provision of AED 4 million was recognised on 1 January 2018 (note 2.3). During the year, there was no revision booked to this provision.
2018 Annual Report
59
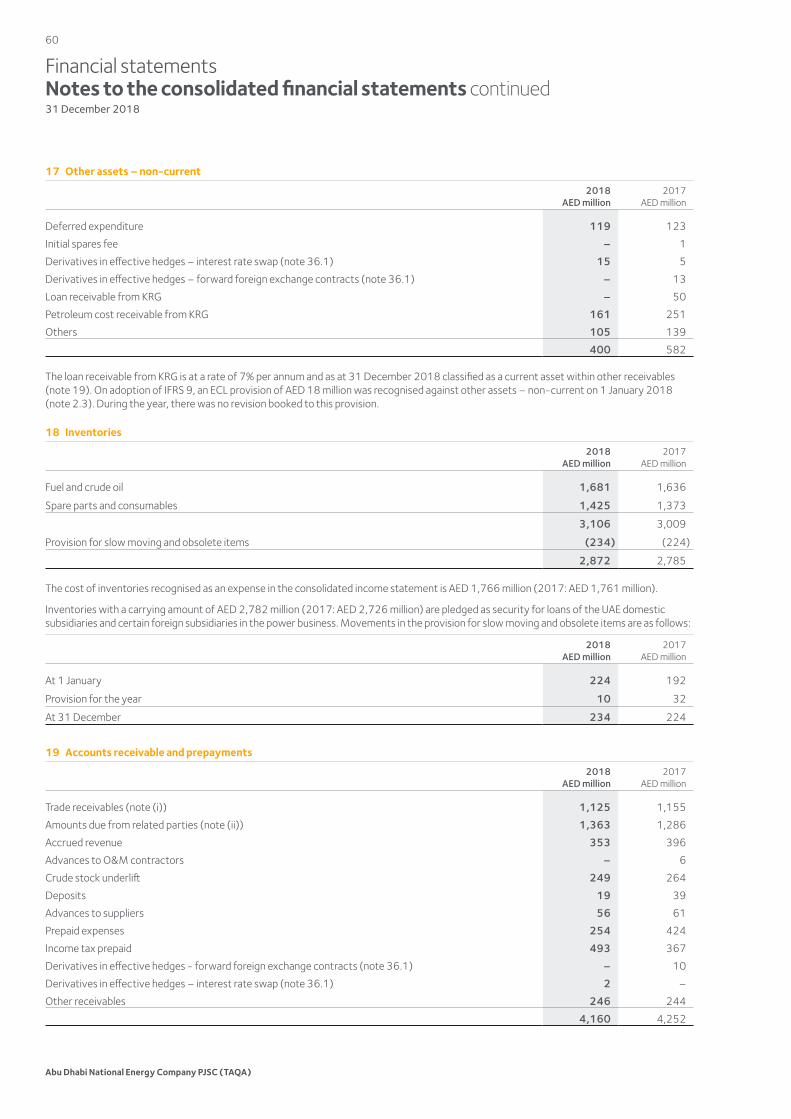
Financial statementsNotes to the consolidated financial statements continued31 December 2018
17 Other assets – non-current
2018AED million
2017AED million
Deferred expenditure 119 123
Initial spares fee – 1
Derivatives in effective hedges – interest rate swap (note 36.1) 15 5
Derivatives in effective hedges – forward foreign exchange contracts (note 36.1) – 13
Loan receivable from KRG – 50
Petroleum cost receivable from KRG 161 251
Others 105 139
400 582
The loan receivable from KRG is at a rate of 7% per annum and as at 31 December 2018 classified as a current asset within other receivables (note 19). On adoption of IFRS 9, an ECL provision of AED 18 million was recognised against other assets – non-current on 1 January 2018 (note 2.3). During the year, there was no revision booked to this provision.
18 Inventories
2018AED million
2017AED million
Fuel and crude oil 1,681 1,636
Spare parts and consumables 1,425 1,373
3,106 3,009
Provision for slow moving and obsolete items (234) (224)
2,872 2,785
The cost of inventories recognised as an expense in the consolidated income statement is AED 1,766 million (2017: AED 1,761 million).
Inventories with a carrying amount of AED 2,782 million (2017: AED 2,726 million) are pledged as security for loans of the UAE domestic subsidiaries and certain foreign subsidiaries in the power business. Movements in the provision for slow moving and obsolete items are as follows:
2018AED million
2017AED million
At 1 January 224 192
Provision for the year 10 32
At 31 December 234 224
19 Accounts receivable and prepayments
2018AED million
2017AED million
Trade receivables (note (i)) 1,125 1,155
Amounts due from related parties (note (ii)) 1,363 1,286
Accrued revenue 353 396
Advances to O&M contractors – 6
Crude stock underlift 249 264
Deposits 19 39
Advances to suppliers 56 61
Prepaid expenses 254 424
Income tax prepaid 493 367
Derivatives in effective hedges - forward foreign exchange contracts (note 36.1) – 10
Derivatives in effective hedges – interest rate swap (note 36.1) 2 –
Other receivables 246 244
4,160 4,252
Abu Dhabi National Energy Company PJSC (TAQA)
60
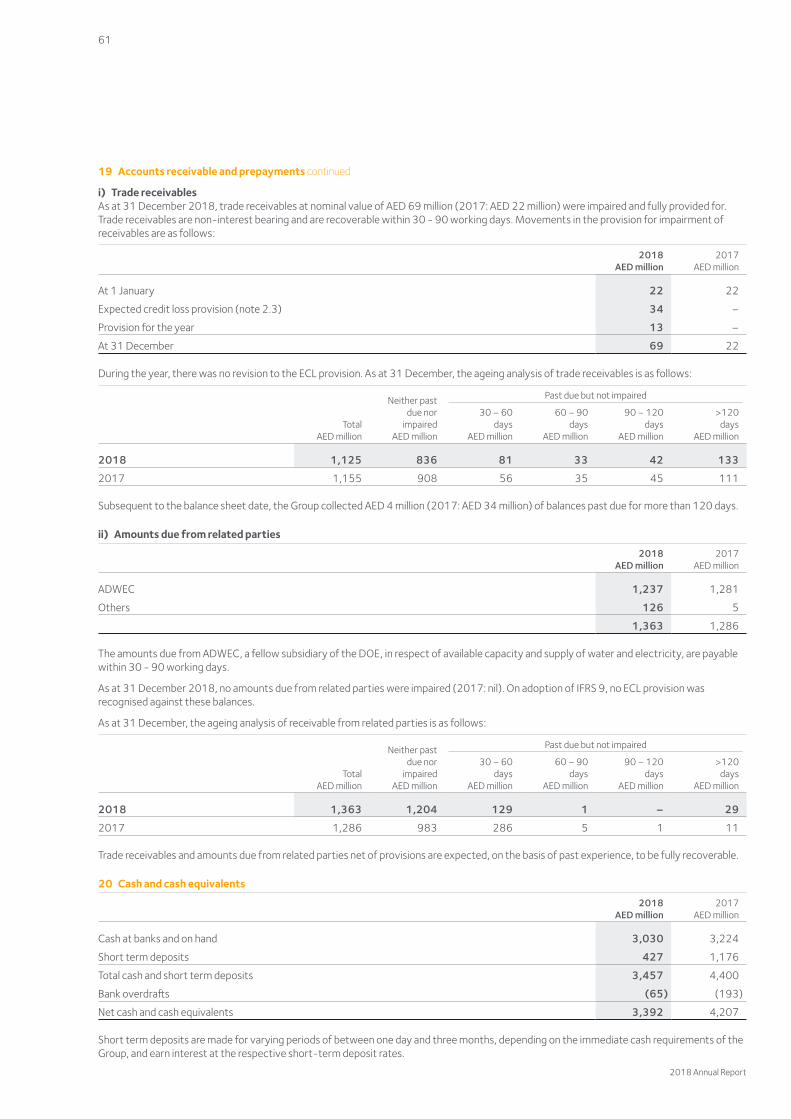
19 Accounts receivable and prepayments continued
i) Trade receivablesAs at 31 December 2018, trade receivables at nominal value of AED 69 million (2017: AED 22 million) were impaired and fully provided for. Trade receivables are non-interest bearing and are recoverable within 30 - 90 working days. Movements in the provision for impairment of receivables are as follows:
2018AED million
2017AED million
At 1 January 22 22
Expected credit loss provision (note 2.3) 34 –
Provision for the year 13 –
At 31 December 69 22
During the year, there was no revision to the ECL provision. As at 31 December, the ageing analysis of trade receivables is as follows:
TotalAED million
Neither pastdue nor
impairedAED million
Past due but not impaired
30 – 60days
AED million
60 – 90days
AED million
90 – 120days
AED million
>120days
AED million
2018 1,125 836 81 33 42 133
2017 1,155 908 56 35 45 111
Subsequent to the balance sheet date, the Group collected AED 4 million (2017: AED 34 million) of balances past due for more than 120 days.
ii) Amounts due from related parties
2018AED million
2017AED million
ADWEC 1,237 1,281
Others 126 5
1,363 1,286
The amounts due from ADWEC, a fellow subsidiary of the DOE, in respect of available capacity and supply of water and electricity, are payable within 30 - 90 working days.
As at 31 December 2018, no amounts due from related parties were impaired (2017: nil). On adoption of IFRS 9, no ECL provision was recognised against these balances.
As at 31 December, the ageing analysis of receivable from related parties is as follows:
TotalAED million
Neither pastdue nor
impairedAED million
Past due but not impaired
30 – 60days
AED million
60 – 90days
AED million
90 – 120days
AED million
>120days
AED million
2018 1,363 1,204 129 1 – 29
2017 1,286 983 286 5 1 11
Trade receivables and amounts due from related parties net of provisions are expected, on the basis of past experience, to be fully recoverable.
20 Cash and cash equivalents
2018AED million
2017AED million
Cash at banks and on hand 3,030 3,224
Short term deposits 427 1,176
Total cash and short term deposits 3,457 4,400
Bank overdrafts (65) (193)
Net cash and cash equivalents 3,392 4,207
Short term deposits are made for varying periods of between one day and three months, depending on the immediate cash requirements of the Group, and earn interest at the respective short-term deposit rates.
2018 Annual Report
61
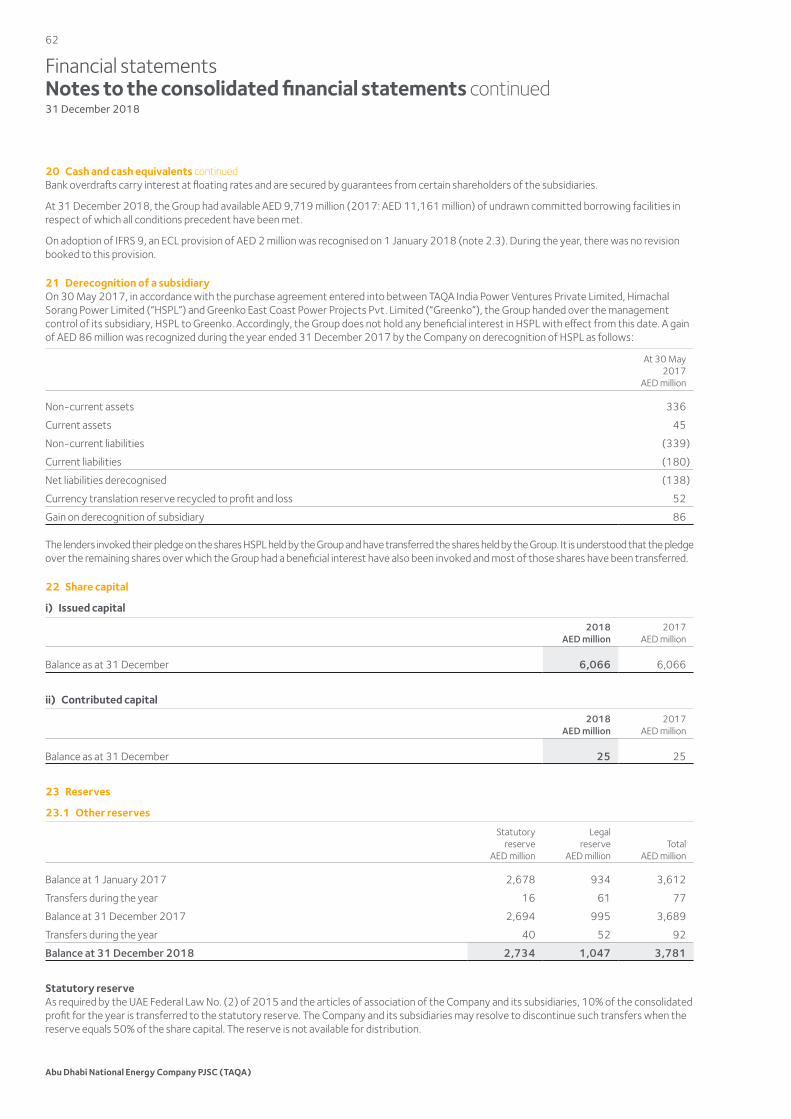
Financial statementsNotes to the consolidated financial statements continued31 December 2018
20 Cash and cash equivalents continuedBank overdrafts carry interest at floating rates and are secured by guarantees from certain shareholders of the subsidiaries.
At 31 December 2018, the Group had available AED 9,719 million (2017: AED 11,161 million) of undrawn committed borrowing facilities in respect of which all conditions precedent have been met.
On adoption of IFRS 9, an ECL provision of AED 2 million was recognised on 1 January 2018 (note 2.3). During the year, there was no revision booked to this provision.
21 Derecognition of a subsidiaryOn 30 May 2017, in accordance with the purchase agreement entered into between TAQA India Power Ventures Private Limited, Himachal Sorang Power Limited (“HSPL”) and Greenko East Coast Power Projects Pvt. Limited (“Greenko”), the Group handed over the management control of its subsidiary, HSPL to Greenko. Accordingly, the Group does not hold any beneficial interest in HSPL with effect from this date. A gain of AED 86 million was recognized during the year ended 31 December 2017 by the Company on derecognition of HSPL as follows:
At 30 May2017
AED million
Non-current assets 336
Current assets 45
Non-current liabilities (339)
Current liabilities (180)
Net liabilities derecognised (138)
Currency translation reserve recycled to profit and loss 52
Gain on derecognition of subsidiary 86
The lenders invoked their pledge on the shares HSPL held by the Group and have transferred the shares held by the Group. It is understood that the pledge over the remaining shares over which the Group had a beneficial interest have also been invoked and most of those shares have been transferred.
22 Share capital
i) Issued capital
2018AED million
2017AED million
Balance as at 31 December 6,066 6,066
ii) Contributed capital
2018AED million
2017AED million
Balance as at 31 December 25 25
23 Reserves
23.1 Other reserves
Statutoryreserve
AED million
Legalreserve
AED millionTotal
AED million
Balance at 1 January 2017 2,678 934 3,612
Transfers during the year 16 61 77
Balance at 31 December 2017 2,694 995 3,689
Transfers during the year 40 52 92
Balance at 31 December 2018 2,734 1,047 3,781
Statutory reserveAs required by the UAE Federal Law No. (2) of 2015 and the articles of association of the Company and its subsidiaries, 10% of the consolidated profit for the year is transferred to the statutory reserve. The Company and its subsidiaries may resolve to discontinue such transfers when the reserve equals 50% of the share capital. The reserve is not available for distribution.
Abu Dhabi National Energy Company PJSC (TAQA)
62
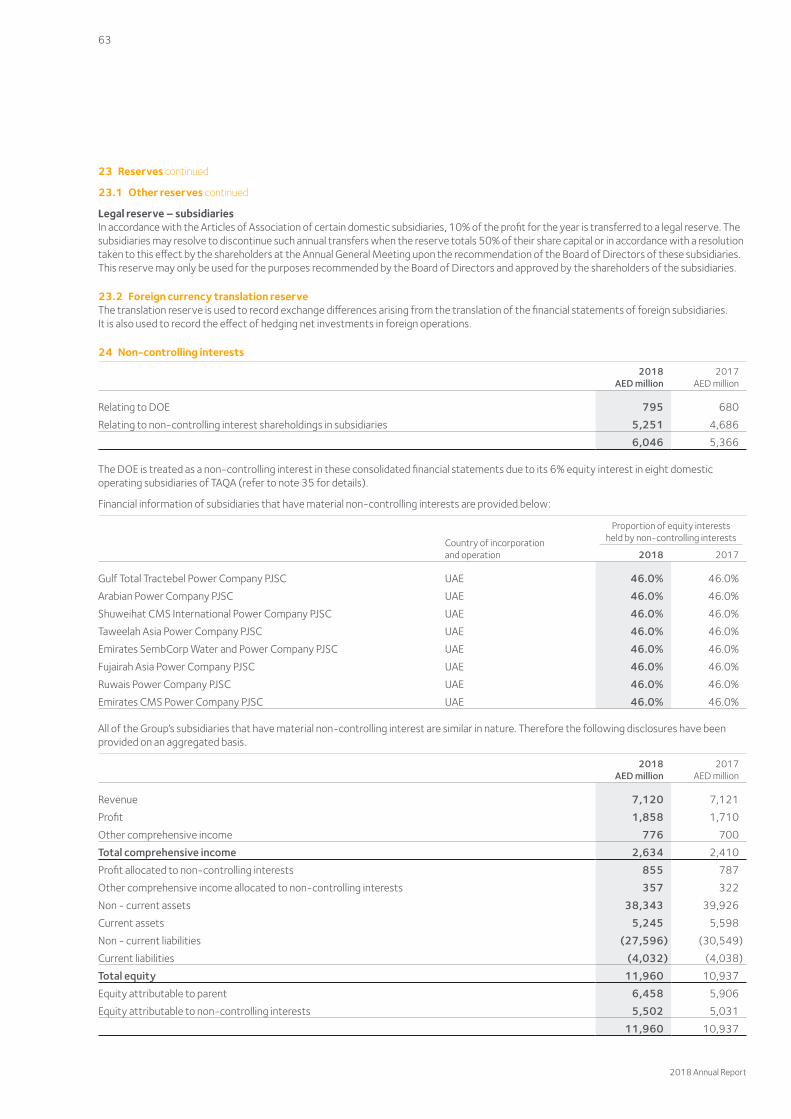
23 Reserves continued
23.1 Other reserves continued
Legal reserve – subsidiariesIn accordance with the Articles of Association of certain domestic subsidiaries, 10% of the profit for the year is transferred to a legal reserve. The subsidiaries may resolve to discontinue such annual transfers when the reserve totals 50% of their share capital or in accordance with a resolution taken to this effect by the shareholders at the Annual General Meeting upon the recommendation of the Board of Directors of these subsidiaries. This reserve may only be used for the purposes recommended by the Board of Directors and approved by the shareholders of the subsidiaries.
23.2 Foreign currency translation reserveThe translation reserve is used to record exchange differences arising from the translation of the financial statements of foreign subsidiaries. It is also used to record the effect of hedging net investments in foreign operations.
24 Non-controlling interests
2018AED million
2017AED million
Relating to DOE 795 680
Relating to non-controlling interest shareholdings in subsidiaries 5,251 4,686
6,046 5,366
The DOE is treated as a non-controlling interest in these consolidated financial statements due to its 6% equity interest in eight domestic operating subsidiaries of TAQA (refer to note 35 for details).
Financial information of subsidiaries that have material non-controlling interests are provided below:
Country of incorporation and operation
Proportion of equity interests held by non-controlling interests
2018 2017
Gulf Total Tractebel Power Company PJSC UAE 46.0% 46.0%
Arabian Power Company PJSC UAE 46.0% 46.0%
Shuweihat CMS International Power Company PJSC UAE 46.0% 46.0%
Taweelah Asia Power Company PJSC UAE 46.0% 46.0%
Emirates SembCorp Water and Power Company PJSC UAE 46.0% 46.0%
Fujairah Asia Power Company PJSC UAE 46.0% 46.0%
Ruwais Power Company PJSC UAE 46.0% 46.0%
Emirates CMS Power Company PJSC UAE 46.0% 46.0%
All of the Group’s subsidiaries that have material non-controlling interest are similar in nature. Therefore the following disclosures have been provided on an aggregated basis.
2018AED million
2017AED million
Revenue 7,120 7,121
Profit 1,858 1,710
Other comprehensive income 776 700
Total comprehensive income 2,634 2,410
Profit allocated to non-controlling interests 855 787
Other comprehensive income allocated to non-controlling interests 357 322
Non - current assets 38,343 39,926
Current assets 5,245 5,598
Non - current liabilities (27,596) (30,549)
Current liabilities (4,032) (4,038)
Total equity 11,960 10,937
Equity attributable to parent 6,458 5,906
Equity attributable to non-controlling interests 5,502 5,031
11,960 10,937
2018 Annual Report
63
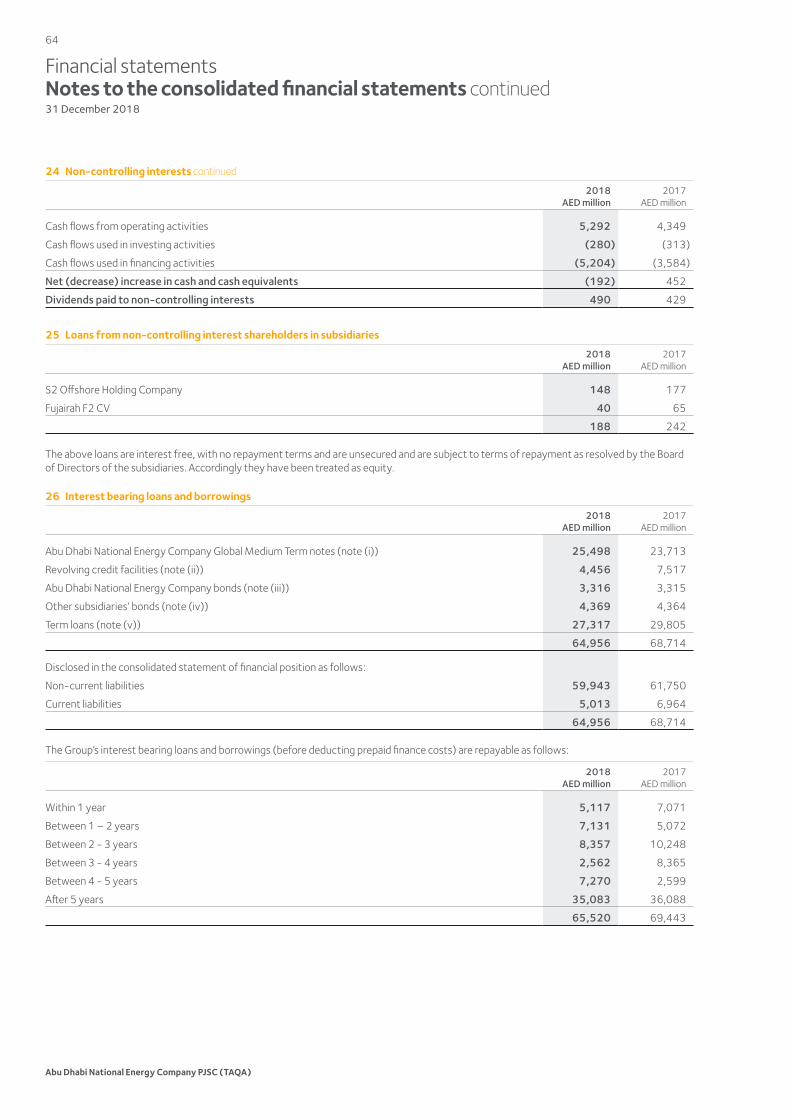
Financial statementsNotes to the consolidated financial statements continued31 December 2018
24 Non-controlling interests continued
2018AED million
2017AED million
Cash flows from operating activities 5,292 4,349
Cash flows used in investing activities (280) (313)
Cash flows used in financing activities (5,204) (3,584)
Net (decrease) increase in cash and cash equivalents (192) 452
Dividends paid to non-controlling interests 490 429
25 Loans from non-controlling interest shareholders in subsidiaries
2018AED million
2017AED million
S2 Offshore Holding Company 148 177
Fujairah F2 CV 40 65
188 242
The above loans are interest free, with no repayment terms and are unsecured and are subject to terms of repayment as resolved by the Board of Directors of the subsidiaries. Accordingly they have been treated as equity.
26 Interest bearing loans and borrowings
2018AED million
2017AED million
Abu Dhabi National Energy Company Global Medium Term notes (note (i)) 25,498 23,713
Revolving credit facilities (note (ii)) 4,456 7,517
Abu Dhabi National Energy Company bonds (note (iii)) 3,316 3,315
Other subsidiaries’ bonds (note (iv)) 4,369 4,364
Term loans (note (v)) 27,317 29,805
64,956 68,714
Disclosed in the consolidated statement of financial position as follows:
Non-current liabilities 59,943 61,750
Current liabilities 5,013 6,964
64,956 68,714
The Group’s interest bearing loans and borrowings (before deducting prepaid finance costs) are repayable as follows:
2018AED million
2017AED million
Within 1 year 5,117 7,071
Between 1 – 2 years 7,131 5,072
Between 2 - 3 years 8,357 10,248
Between 3 - 4 years 2,562 8,365
Between 4 - 5 years 7,270 2,599
After 5 years 35,083 36,088
65,520 69,443
Abu Dhabi National Energy Company PJSC (TAQA)
64
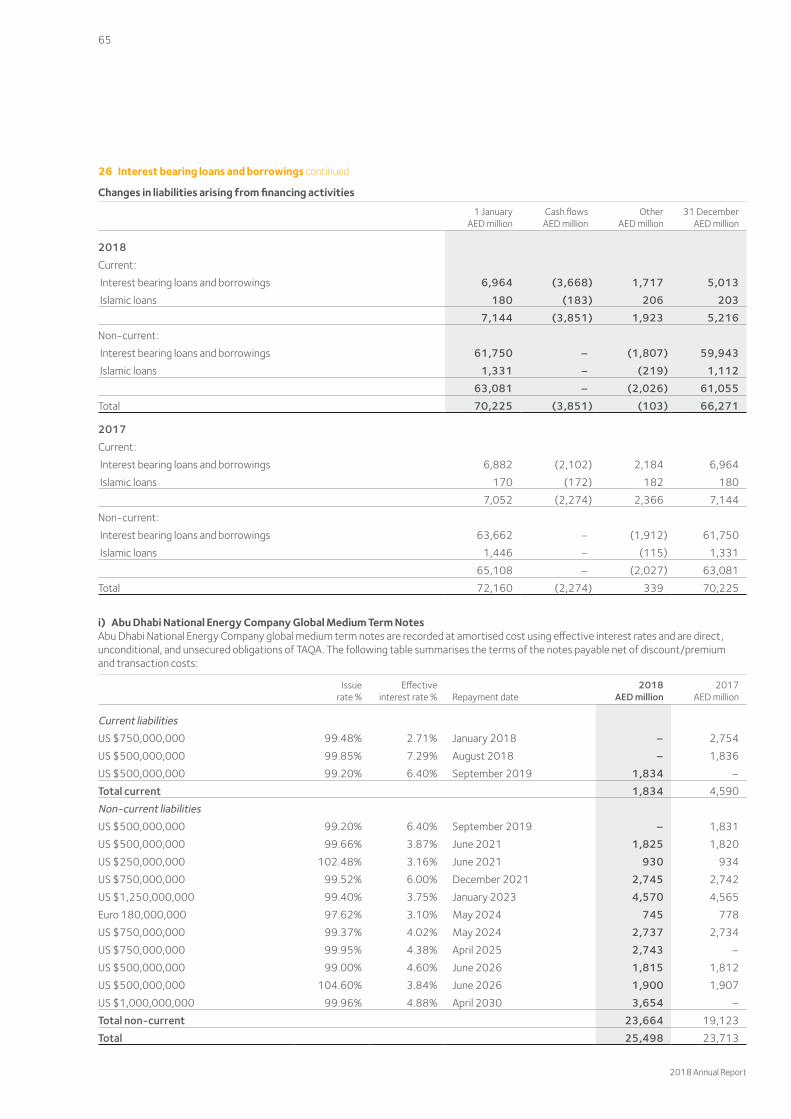
26 Interest bearing loans and borrowings continued
Changes in liabilities arising from financing activities
1 JanuaryAED million
Cash flowsAED million
OtherAED million
31 DecemberAED million
2018
Current:
Interest bearing loans and borrowings 6,964 (3,668) 1,717 5,013
Islamic loans 180 (183) 206 203
7,144 (3,851) 1,923 5,216
Non-current:
Interest bearing loans and borrowings 61,750 – (1,807) 59,943
Islamic loans 1,331 – (219) 1,112
63,081 – (2,026) 61,055
Total 70,225 (3,851) (103) 66,271
2017
Current:
Interest bearing loans and borrowings 6,882 (2,102) 2,184 6,964
Islamic loans 170 (172) 182 180
7,052 (2,274) 2,366 7,144
Non-current:
Interest bearing loans and borrowings 63,662 – (1,912) 61,750
Islamic loans 1,446 – (115) 1,331
65,108 – (2,027) 63,081
Total 72,160 (2,274) 339 70,225
i) Abu Dhabi National Energy Company Global Medium Term NotesAbu Dhabi National Energy Company global medium term notes are recorded at amortised cost using effective interest rates and are direct, unconditional, and unsecured obligations of TAQA. The following table summarises the terms of the notes payable net of discount/premium and transaction costs:
Issuerate %
Effectiveinterest rate % Repayment date
2018AED million
2017AED million
Current liabilities
US $750,000,000 99.48% 2.71% January 2018 – 2,754
US $500,000,000 99.85% 7.29% August 2018 – 1,836
US $500,000,000 99.20% 6.40% September 2019 1,834 –
Total current 1,834 4,590
Non-current liabilities
US $500,000,000 99.20% 6.40% September 2019 – 1,831
US $500,000,000 99.66% 3.87% June 2021 1,825 1,820
US $250,000,000 102.48% 3.16% June 2021 930 934
US $750,000,000 99.52% 6.00% December 2021 2,745 2,742
US $1,250,000,000 99.40% 3.75% January 2023 4,570 4,565
Euro 180,000,000 97.62% 3.10% May 2024 745 778
US $750,000,000 99.37% 4.02% May 2024 2,737 2,734
US $750,000,000 99.95% 4.38% April 2025 2,743 –
US $500,000,000 99.00% 4.60% June 2026 1,815 1,812
US $500,000,000 104.60% 3.84% June 2026 1,900 1,907
US $1,000,000,000 99.96% 4.88% April 2030 3,654 –
Total non-current 23,664 19,123
Total 25,498 23,713
2018 Annual Report
65
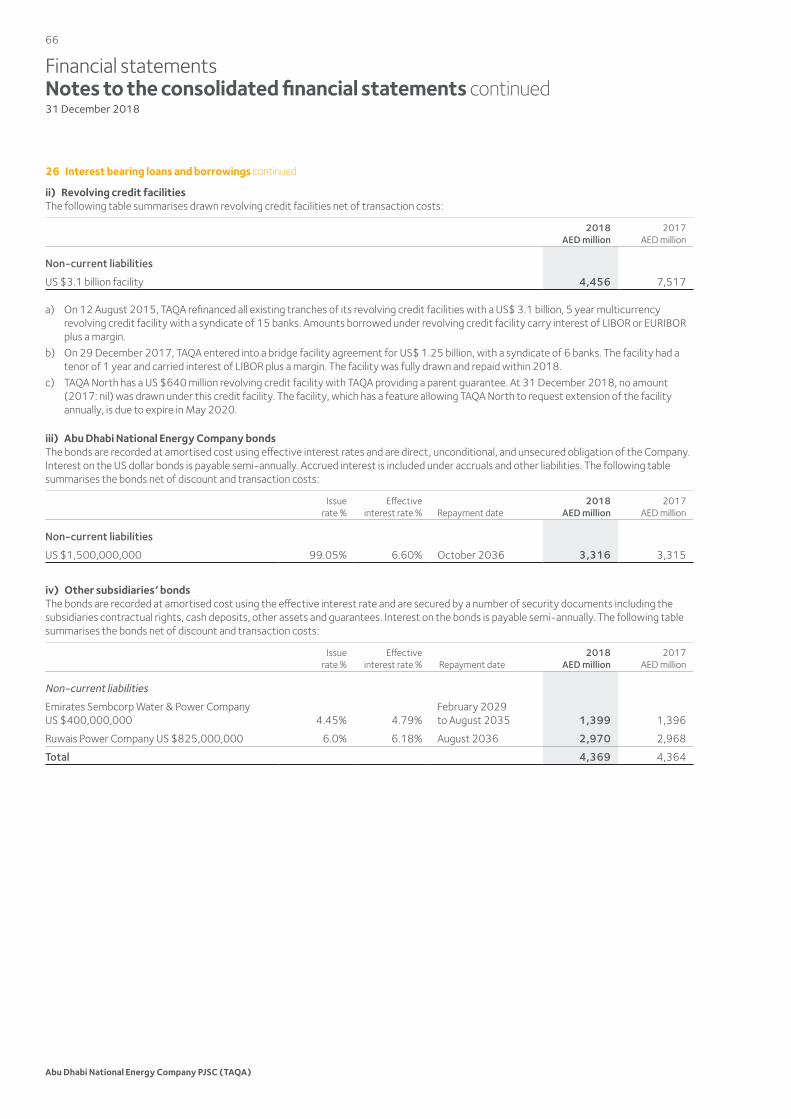
Financial statementsNotes to the consolidated financial statements continued31 December 2018
26 Interest bearing loans and borrowings continued
ii) Revolving credit facilitiesThe following table summarises drawn revolving credit facilities net of transaction costs:
2018AED million
2017AED million
Non-current liabilities
US $3.1 billion facility 4,456 7,517
a) On 12 August 2015, TAQA refinanced all existing tranches of its revolving credit facilities with a US$ 3.1 billion, 5 year multicurrency revolving credit facility with a syndicate of 15 banks. Amounts borrowed under revolving credit facility carry interest of LIBOR or EURIBOR plus a margin.
b) On 29 December 2017, TAQA entered into a bridge facility agreement for US$ 1.25 billion, with a syndicate of 6 banks. The facility had a tenor of 1 year and carried interest of LIBOR plus a margin. The facility was fully drawn and repaid within 2018.
c) TAQA North has a US $640 million revolving credit facility with TAQA providing a parent guarantee. At 31 December 2018, no amount (2017: nil) was drawn under this credit facility. The facility, which has a feature allowing TAQA North to request extension of the facility annually, is due to expire in May 2020.
iii) Abu Dhabi National Energy Company bondsThe bonds are recorded at amortised cost using effective interest rates and are direct, unconditional, and unsecured obligation of the Company. Interest on the US dollar bonds is payable semi-annually. Accrued interest is included under accruals and other liabilities. The following table summarises the bonds net of discount and transaction costs:
Issuerate %
Effectiveinterest rate % Repayment date
2018AED million
2017AED million
Non-current liabilities
US $1,500,000,000 99.05% 6.60% October 2036 3,316 3,315
iv) Other subsidiaries’ bondsThe bonds are recorded at amortised cost using the effective interest rate and are secured by a number of security documents including the subsidiaries contractual rights, cash deposits, other assets and guarantees. Interest on the bonds is payable semi-annually. The following table summarises the bonds net of discount and transaction costs:
Issuerate %
Effectiveinterest rate % Repayment date
2018AED million
2017AED million
Non-current liabilities
Emirates Sembcorp Water & Power Company US $400,000,000 4.45% 4.79%
February 2029 to August 2035 1,399 1,396
Ruwais Power Company US $825,000,000 6.0% 6.18% August 2036 2,970 2,968
Total 4,369 4,364
Abu Dhabi National Energy Company PJSC (TAQA)
66
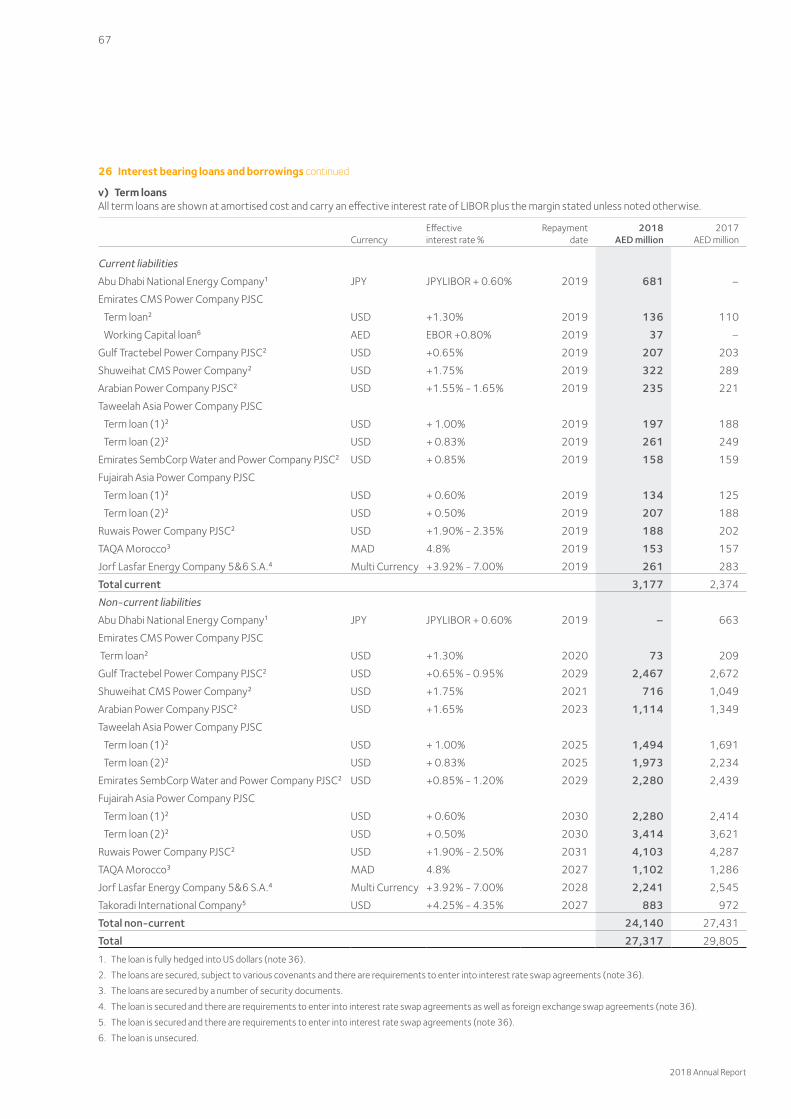
26 Interest bearing loans and borrowings continued
v) Term loansAll term loans are shown at amortised cost and carry an effective interest rate of LIBOR plus the margin stated unless noted otherwise.
CurrencyEffective interest rate %
Repayment date
2018AED million
2017AED million
Current liabilities
Abu Dhabi National Energy Company1 JPY JPYLIBOR + 0.60% 2019 681 –
Emirates CMS Power Company PJSC
Term loan2 USD +1.30% 2019 136 110
Working Capital loan6 AED EBOR +0.80% 2019 37 –
Gulf Tractebel Power Company PJSC2 USD +0.65% 2019 207 203
Shuweihat CMS Power Company2 USD +1.75% 2019 322 289
Arabian Power Company PJSC2 USD +1.55% - 1.65% 2019 235 221
Taweelah Asia Power Company PJSC
Term loan (1)2 USD + 1.00% 2019 197 188
Term loan (2)2 USD + 0.83% 2019 261 249
Emirates SembCorp Water and Power Company PJSC2 USD + 0.85% 2019 158 159
Fujairah Asia Power Company PJSC
Term loan (1)2 USD + 0.60% 2019 134 125
Term loan (2)2 USD + 0.50% 2019 207 188
Ruwais Power Company PJSC2 USD +1.90% - 2.35% 2019 188 202
TAQA Morocco3 MAD 4.8% 2019 153 157
Jorf Lasfar Energy Company 5&6 S.A.4 Multi Currency +3.92% - 7.00% 2019 261 283
Total current 3,177 2,374
Non-current liabilities
Abu Dhabi National Energy Company1 JPY JPYLIBOR + 0.60% 2019 – 663
Emirates CMS Power Company PJSC
Term loan2 USD +1.30% 2020 73 209
Gulf Tractebel Power Company PJSC2 USD +0.65% - 0.95% 2029 2,467 2,672
Shuweihat CMS Power Company2 USD +1.75% 2021 716 1,049
Arabian Power Company PJSC2 USD +1.65% 2023 1,114 1,349
Taweelah Asia Power Company PJSC
Term loan (1)2 USD + 1.00% 2025 1,494 1,691
Term loan (2)2 USD + 0.83% 2025 1,973 2,234
Emirates SembCorp Water and Power Company PJSC2 USD +0.85% - 1.20% 2029 2,280 2,439
Fujairah Asia Power Company PJSC
Term loan (1)2 USD + 0.60% 2030 2,280 2,414
Term loan (2)2 USD + 0.50% 2030 3,414 3,621
Ruwais Power Company PJSC2 USD +1.90% - 2.50% 2031 4,103 4,287
TAQA Morocco3 MAD 4.8% 2027 1,102 1,286
Jorf Lasfar Energy Company 5&6 S.A.4 Multi Currency +3.92% - 7.00% 2028 2,241 2,545
Takoradi International Company5 USD +4.25% - 4.35% 2027 883 972
Total non-current 24,140 27,431
Total 27,317 29,805
1. The loan is fully hedged into US dollars (note 36).
2. The loans are secured, subject to various covenants and there are requirements to enter into interest rate swap agreements (note 36).
3. The loans are secured by a number of security documents.
4. The loan is secured and there are requirements to enter into interest rate swap agreements as well as foreign exchange swap agreements (note 36).
5. The loan is secured and there are requirements to enter into interest rate swap agreements (note 36).
6. The loan is unsecured.
2018 Annual Report
67
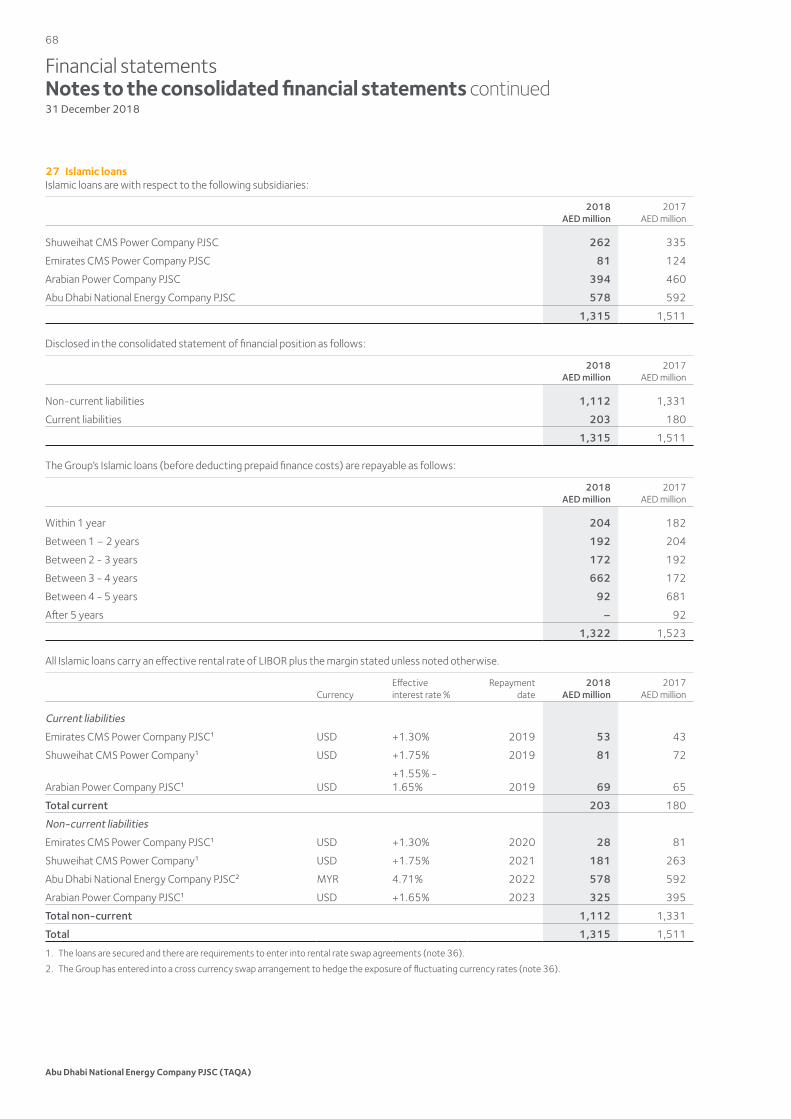
Financial statementsNotes to the consolidated financial statements continued31 December 2018
27 Islamic loansIslamic loans are with respect to the following subsidiaries:
2018AED million
2017AED million
Shuweihat CMS Power Company PJSC 262 335
Emirates CMS Power Company PJSC 81 124
Arabian Power Company PJSC 394 460
Abu Dhabi National Energy Company PJSC 578 592
1,315 1,511
Disclosed in the consolidated statement of financial position as follows:
2018AED million
2017AED million
Non-current liabilities 1,112 1,331
Current liabilities 203 180
1,315 1,511
The Group’s Islamic loans (before deducting prepaid finance costs) are repayable as follows:
2018AED million
2017AED million
Within 1 year 204 182
Between 1 – 2 years 192 204
Between 2 - 3 years 172 192
Between 3 - 4 years 662 172
Between 4 - 5 years 92 681
After 5 years – 92
1,322 1,523
All Islamic loans carry an effective rental rate of LIBOR plus the margin stated unless noted otherwise.
CurrencyEffective interest rate %
Repayment date
2018AED million
2017AED million
Current liabilities
Emirates CMS Power Company PJSC1 USD +1.30% 2019 53 43
Shuweihat CMS Power Company1 USD +1.75% 2019 81 72
Arabian Power Company PJSC1 USD+1.55% - 1.65% 2019 69 65
Total current 203 180
Non-current liabilities
Emirates CMS Power Company PJSC1 USD +1.30% 2020 28 81
Shuweihat CMS Power Company1 USD +1.75% 2021 181 263
Abu Dhabi National Energy Company PJSC2 MYR 4.71% 2022 578 592
Arabian Power Company PJSC1 USD +1.65% 2023 325 395
Total non-current 1,112 1,331
Total 1,315 1,511
1. The loans are secured and there are requirements to enter into rental rate swap agreements (note 36).
2. The Group has entered into a cross currency swap arrangement to hedge the exposure of fluctuating currency rates (note 36).
Abu Dhabi National Energy Company PJSC (TAQA)
68
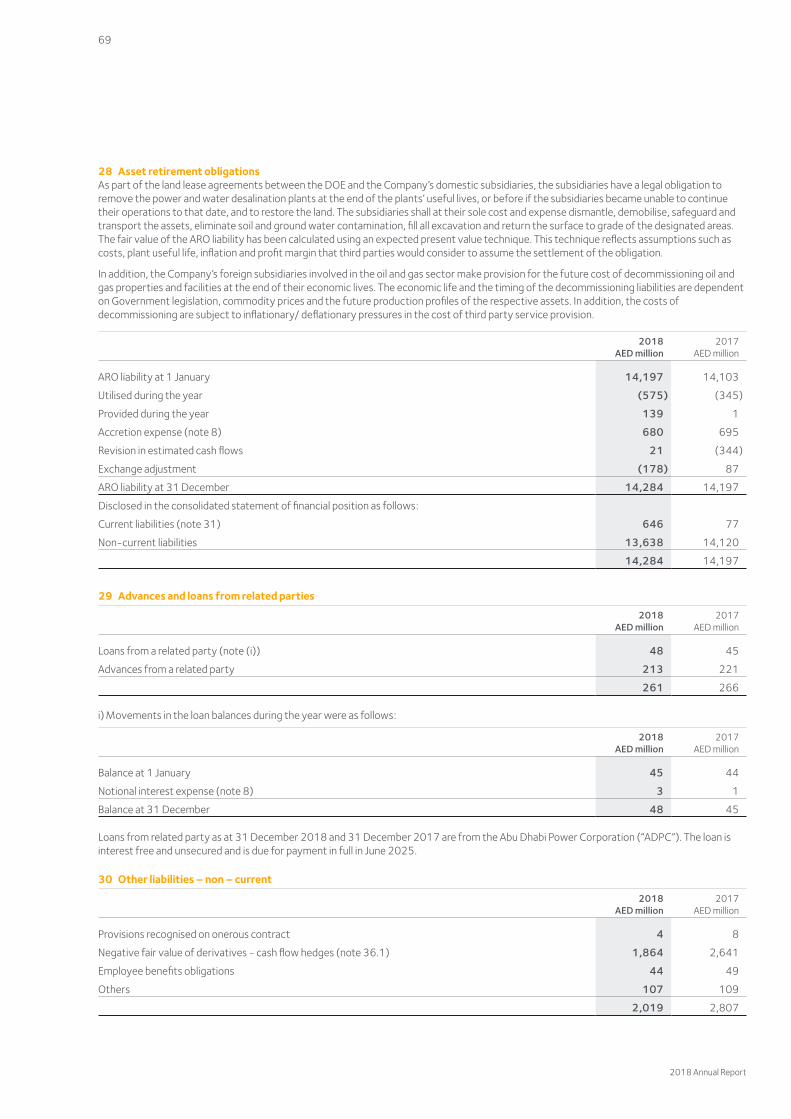
28 Asset retirement obligationsAs part of the land lease agreements between the DOE and the Company’s domestic subsidiaries, the subsidiaries have a legal obligation to remove the power and water desalination plants at the end of the plants’ useful lives, or before if the subsidiaries became unable to continue their operations to that date, and to restore the land. The subsidiaries shall at their sole cost and expense dismantle, demobilise, safeguard and transport the assets, eliminate soil and ground water contamination, fill all excavation and return the surface to grade of the designated areas. The fair value of the ARO liability has been calculated using an expected present value technique. This technique reflects assumptions such as costs, plant useful life, inflation and profit margin that third parties would consider to assume the settlement of the obligation.
In addition, the Company’s foreign subsidiaries involved in the oil and gas sector make provision for the future cost of decommissioning oil and gas properties and facilities at the end of their economic lives. The economic life and the timing of the decommissioning liabilities are dependent on Government legislation, commodity prices and the future production profiles of the respective assets. In addition, the costs of decommissioning are subject to inflationary/ deflationary pressures in the cost of third party service provision.
2018AED million
2017AED million
ARO liability at 1 January 14,197 14,103
Utilised during the year (575) (345)
Provided during the year 139 1
Accretion expense (note 8) 680 695
Revision in estimated cash flows 21 (344)
Exchange adjustment (178) 87
ARO liability at 31 December 14,284 14,197
Disclosed in the consolidated statement of financial position as follows:
Current liabilities (note 31) 646 77
Non-current liabilities 13,638 14,120
14,284 14,197
29 Advances and loans from related parties
2018AED million
2017AED million
Loans from a related party (note (i)) 48 45
Advances from a related party 213 221
261 266
i) Movements in the loan balances during the year were as follows:
2018AED million
2017AED million
Balance at 1 January 45 44
Notional interest expense (note 8) 3 1
Balance at 31 December 48 45
Loans from related party as at 31 December 2018 and 31 December 2017 are from the Abu Dhabi Power Corporation (“ADPC”). The loan is interest free and unsecured and is due for payment in full in June 2025.
30 Other liabilities – non – current
2018AED million
2017AED million
Provisions recognised on onerous contract 4 8
Negative fair value of derivatives - cash flow hedges (note 36.1) 1,864 2,641
Employee benefits obligations 44 49
Others 107 109
2,019 2,807
2018 Annual Report
69
Financial statementsNotes to the consolidated financial statements continued31 December 2018
31 Accounts payable, accruals and other liabilities
2018AED million
2017AED million
Trade payables 747 810
Payable to joint venture partners 61 69
Accrued interest expenses 803 839
Accrual for operating costs 886 867
Payable for capital expenditure 305 281
Provisions recognised on onerous contract 1 1
Negative fair value of derivatives- cash flow hedges (note 36.1) 457 534
Negative fair value of derivatives- fair value hedges (note 36.1) 100 105
Asset retirement obligations (note 28) 646 77
Dividends payable to non-controlling interests 71 126
Crude stock overlift 25 55
Others 880 911
4,982 4,675
Terms and conditions of the above liabilities:
• Trade payables are non-interest bearing and are normally settled between 30 to 60 day terms.• Payables to joint venture partners are non-interest bearing and have an average term of 60 days.• Interest payable is normally settled throughout the financial year in accordance with the terms of the loans.
32 Amounts due to related parties
2018AED million
2017AED million
Amounts due to fellow subsidiaries – ADWEC & ADPC 17 8
Others – amounts due to the DOE and related parties 66 80
83 88
33 Commitments and contingencies
i) Capital expenditure commitmentsThe authorised capital expenditure contracted for at 31 December 2018 but not provided for amounted to AED 1,171 million (2017: AED 752 million).
ii) Operating lease commitments
Group as a lessor:Future capacity payments to be received by the Group under power and water purchase agreements (“PWPA”) based on projected plant availability as at 31 December are as follows:
2018AED million
2017AED million
Within one year 5,769 5,757
After one year but not more than five years 22,651 23,398
More than five years 39,243 43,175
67,663 72,330
Abu Dhabi National Energy Company PJSC (TAQA)
70
33 Commitments and contingencies continued
ii) Operating lease commitments continued
Group as a lessee:Future minimum payments under non-cancellable operating leases as at 31 December are as follows:
2018AED million
2017AED million
Within one year 451 320
After one year but not more than five years 812 932
More than five years 57 111
1,320 1,363
Joint venture:The Group’s joint venture has future minimum rentals payable under a non-cancellable operating lease as at 31 December 2018 amounting to AED 1,357 million (31 December 2017: AED 1,448 million), of which the Group’s share is AED 679 million (31 December 2017: AED 724 million).
Associates:Sohar Aluminium Company LLC, one of the Group’s associates, has future minimum rentals payable under a non-cancellable operating lease as at 31 December 2018 amounting to AED 438 million (2017: AED 838 million), of which the Group’s share is AED 175 million (2017: AED 335 million).
iii) Other commitmentsa) As at the reporting date TAQA North has entered into contractual commitments, mainly pipeline usage and commitments, under which they
are committed to spend AED 904 million as at 31 December 2018 (31 December 2017: AED 737 million).b) On 27 December 2018, TAQA Atrush BV, the Group’s wholly owned subsidiary, agreed with ShaMaran Petroleum Corporation to acquire
50% of the working interest held currently by Marathon Oil Kurdistan BV (“MOKDV”) in the Atrush Block of the Kurdistan Region of Iraq. ShaMaran will acquire the entire share capital of MOKDV from Marathon. Under a seperate asset purchase agreement agreed with it (“APA”), ShaMaran Petroleum Corporation will, subject to fulfilment of conditions precedent, transfer 7.5% of the participating interest in the Atrush Block to TAQA Atrush B.V.. TAQA Atrush BV will contribute its purchase price at the time of closing of the acquisition of MOKDV’s share capital by ShaMaran Petroleum Corporation (“Share Acquisition Closing”). Pending the fulfilment of the conditions precedent for closing under the APA, TAQA Atrush B.V. will, from the date of Share Acquisition Closing, participate economically to the extent of this 7.5% participating interest. With this acquisition, TAQA Atrush B.V’s interest in the Atrush Block will increase from 39.9% to 47.4%.
vi) Contingenciesa) As a result of acquisitions made in prior periods, there are contingent liabilities arising from (a) tax assessments or proposed assessments
and (b) certain other disputes, all of which are being contested. Pursuant to the Purchase and Sale Agreements between TAQA and the sellers, the sellers have provided TAQA and its subsidiaries with indemnity obligations with respect to such contingent liabilities for the periods prior to date of the respective acquisitions.
b) TAQA GEN X LLC (“GENX”) is the owner by assignment of a Fuel Conversion Services, Capacity and Ancillary Services Purchase Agreement dated as of 17 September 1999 (the “Tolling Agreement”) by and between AES Red Oak, L.L.C. (“AES”) and Williams Energy Marketing & Trading Company (succeeded by GENX), as well as other ancillary rights and agreements relating to the Red Oak power plant situated in New Jersey, USA. TigerGenCo LLC, a special purpose acquisition subsidiary of Morgan Stanley Infrastructure, acquired all the shareholding of Red Oak LLC. GENX entered into an Energy Management Agreement (“EMA”) and an International Swap & Derivatives Master Agreement (“ISDA”) both dated 28 December 2010 with Morgan Stanley Capital Group Inc. to manage the energy products under the Tolling Agreement and ancillary rights and agreements. The Group guaranteed the obligations of GENX to Morgan Stanley Capital Group Inc. under the EMA and ISDA agreement. Payments under this guarantee shall not exceed US $100 million (AED 367 million) (31 December 2017: US$ 100 million) over the life of the EMA. No payments have been made to date (31 December 2017: nil).
c) TAQA Bratani Ltd. has entered into decommissioning deeds and other agreements for certain North Sea assets acquired by it, pursuant to which it may be required to provide financial security to the former owners of the assets. As at 31 December 2018, TAQA Bratani Ltd has provided financial security through parent company guarantees from TAQA PJSC in addition to a letter of credit. Under the terms of the letter of credit, TAQA PJSC has provided an undertaking to reimburse any amount called in order to meet certain future decommissioning costs of TAQA Bratani Ltd.
34 Related party transactions and balancesAs stated in note 1 to the financial statements, the Group is a subsidiary of the DOE (and now ADPC), which is wholly owned by the Government of Abu Dhabi and as such the Group is a government related entity as defined by IAS 24. The Group is therefore exempt from disclosing certain information relating to transactions and balances with entities related to the same government.
Collectively but not individually significant transactionsAll domestic power and water production is acquired by ADWEC (a fellow subsidiary of the Group) under long term PWPAs. Natural gas fuel is supplied by ADWEC to the domestic subsidiaries at no cost in accordance with the terms of the PWPAs.
2018 Annual Report
71
Financial statementsNotes to the consolidated financial statements continued31 December 2018
34 Related party transactions and balances continued
Collectively but not individually significant transactions continuedThe following table provides a summary of significant related party transactions included in the consolidated income statement during the year:
2018AED million
2017AED million
Fellow subsidiary (Department of Energy):
Sale of electricity and water 7,033 7,097
Fuel revenue (note 4.3) 61 15
Other revenue 26 9
Others:
Notional interest expense on loan from ADPC (note 8) (3) (1)
Government entities
Licensing fees 17 17
Fuel expense 10 10
Finance cost 43 47
Insurance fees 28 30
Balances with related parties and governmental agenciesBalances with related parties that are disclosed in the consolidated statement of financial position as follows:
2018AED million
2017AED million
Non-current assets:
Advance and loans to associates (note 16) 698 702
Current assets:
Amounts due from fellow subsidiaries (note 19) 1,363 1,286
Bank balance with government owned bank 632 626
Non-current liabilities:
Loan from a fellow subsidiary - ADPC (note 29) 48 45
Advances from a fellow subsidiary (note 29) 213 221
Bank loans with government owned bank 133 139
Current liabilities:
Amounts due to fellow subsidiaries – ADWEC & ADPC (note 32) 17 8
Amounts due to the DOE and other related parties (note 32) 66 80
Overdraft with government owned bank 61 91
At 31 December, the Group had available undrawn bank facilities with government owned entities 290 325
Terms and conditions of transactions with related partiesThe sales to and purchases from related parties are made on terms approved by the management. Outstanding balances at the year end are unsecured, interest free and settlement occurs in cash. There have been no guarantees provided or received for any related party receivables or payables. For the year ended 31 December 2018, the Group has not recorded any impairment of receivables relating to amounts owed by related parties (2017: nil). This assessment is undertaken each financial year through examining the financial position of the related party and the market in which the related party operates.
Abu Dhabi National Energy Company PJSC (TAQA)
72
34 Related party transactions and balances continued
Compensation of key management personnel and board of directorsFor certain subsidiaries, key management personnel are provided by operation and maintenance companies under contractual agreements with the subsidiaries.
The remuneration of senior key management personnel and board of directors of the Group during the year was as follows:
2018AED million
2017AED million
Short-term benefits 12 11
Post-employment benefits – 1
Board of directors’ remuneration 4 –
16 12
35 SubsidiariesThe consolidated financial statements include the financial statements of TAQA and all its subsidiaries. The Group’s major operating subsidiaries are listed below:
Subsidiaries % Country of incorporation Principal activities
Foreign subsidiaries
TAQA Bratani Limited 100% UK Oil & gas production
TAQA North Ltd. 100% Canada Oil & gas production
TAQA Atrush B.V. 100% Netherlands Oil & gas production
TAQA Energy B.V 100% Netherlands Gas storage, oil & gas production
TAQA Morocco 86% Morocco Power generation
Jorf Lasfar Energy Company 5&6 S.A 91% Morocco Power generation
Takoradi International Company 90% Cayman Islands Power generation
TAQA Neyveli Power Company Private Ltd 100% India Power generation
TAQA GEN X 85% USA Gas power tolling interest
Domestic subsidiaries
Emirates CMS Power Company PJSC (ECPC) 54% UAE
Generation of electricity and the production of desalinated water
Gulf Total Tractebel Power Company PJSC (GTTPC) 54% UAE
Arabian Power Company PJSC (APC) 54% UAE
Shuweihat CMS International Power Company PJSC (SCIPCO) 54% UAE
Taweelah Asia Power Company PJSC (TAPCO) 54% UAE
Emirates Semb Corp Water and Power Company PJSC (ESWPC) 54% UAE
Fujairah Asia Power Company PJSC (FAPCO) 54% UAE
Ruwais Power Company PJSC (RPC) 54% UAE
Taweelah Shared Facilities Company LLC * 48% UAE Operating & maintenance
Shuweihat Shared Facilities Company LLC* 38% UAE Operating & maintenance
* These entities are treated as subsidiaries even though TAQA’s holding in these entities are below 50% due to the Group’s control through the direct holding in these subsidiaries by two of the Group’s subsidiaries being above 50%, thus enabling TAQA to have the ability to exercise control in the Board.
During the year ended 31 December 2018 and 2017, there were no changes in the group’s major operating subsidiaries as listed above.
2018 Annual Report
73
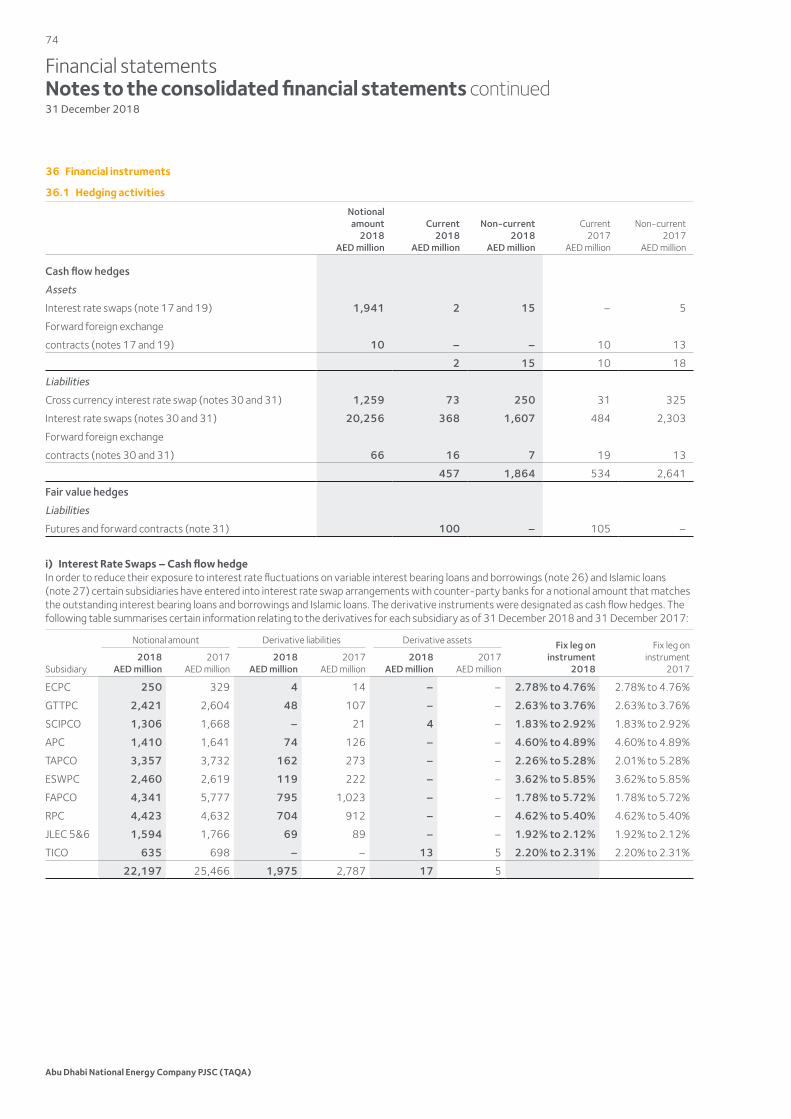
Financial statementsNotes to the consolidated financial statements continued31 December 2018
36 Financial instruments
36.1 Hedging activities
Notionalamount
2018AED million
Current2018
AED million
Non-current2018
AED million
Current2017
AED million
Non-current2017
AED million
Cash flow hedges
Assets
Interest rate swaps (note 17 and 19) 1,941 2 15 – 5
Forward foreign exchange
contracts (notes 17 and 19) 10 – – 10 13
2 15 10 18
Liabilities
Cross currency interest rate swap (notes 30 and 31) 1,259 73 250 31 325
Interest rate swaps (notes 30 and 31) 20,256 368 1,607 484 2,303
Forward foreign exchange
contracts (notes 30 and 31) 66 16 7 19 13
457 1,864 534 2,641
Fair value hedges
Liabilities
Futures and forward contracts (note 31) 100 – 105 –
i) Interest Rate Swaps – Cash flow hedgeIn order to reduce their exposure to interest rate fluctuations on variable interest bearing loans and borrowings (note 26) and Islamic loans (note 27) certain subsidiaries have entered into interest rate swap arrangements with counter-party banks for a notional amount that matches the outstanding interest bearing loans and borrowings and Islamic loans. The derivative instruments were designated as cash flow hedges. The following table summarises certain information relating to the derivatives for each subsidiary as of 31 December 2018 and 31 December 2017:
Subsidiary
Notional amount Derivative liabilities Derivative assets Fix leg oninstrument
2018
Fix leg oninstrument
20172018
AED million2017
AED million2018
AED million2017
AED million2018
AED million2017
AED million
ECPC 250 329 4 14 – – 2.78% to 4.76% 2.78% to 4.76%
GTTPC 2,421 2,604 48 107 – – 2.63% to 3.76% 2.63% to 3.76%
SCIPCO 1,306 1,668 – 21 4 – 1.83% to 2.92% 1.83% to 2.92%
APC 1,410 1,641 74 126 – – 4.60% to 4.89% 4.60% to 4.89%
TAPCO 3,357 3,732 162 273 – – 2.26% to 5.28% 2.01% to 5.28%
ESWPC 2,460 2,619 119 222 – – 3.62% to 5.85% 3.62% to 5.85%
FAPCO 4,341 5,777 795 1,023 – – 1.78% to 5.72% 1.78% to 5.72%
RPC 4,423 4,632 704 912 – – 4.62% to 5.40% 4.62% to 5.40%
JLEC 5&6 1,594 1,766 69 89 – – 1.92% to 2.12% 1.92% to 2.12%
TICO 635 698 – – 13 5 2.20% to 2.31% 2.20% to 2.31%
22,197 25,466 1,975 2,787 17 5
Abu Dhabi National Energy Company PJSC (TAQA)
74
36 Financial instruments continued
36.1 Hedging activities continued
ii) Cross currency Swaps – Cash flow hedgesDuring 2012, the Group entered into a cross currency rate swap agreement to hedge the Group’s exposure on the Malaysian Ringgit Sukuk issued during the year (note 27). Under the terms of the cross currency rate swap, TAQA is required to pay a fixed rate of 5.3% per annum on an initial exchange amount of US $ 215 million and receive a fixed rate of 4.65% per annum on an amount of MYR 650 million. The derivative instrument had a negative fair value of AED 261 million at 31 December 2018 (2017: negative fair value AED 281 million), which was included within other liabilities, accounts payables, accruals and other liabilities in the consolidated financial position.
During April 2014, the Group entered into a cross currency interest rate swap agreement with Mitsubishi UFJ Securities International plc to hedge the Group’s exposure on the Samurai term loan facility issued during the period (note 26). Under the terms of the cross currency interest rate swap, TAQA is required to pay a variable rate equal to LIBOR plus margin on an initial exchange amount of US$ 200 million and receive a variable rate equal to JPY LIBOR plus margin on an amount of JPY 20 billion. The swap has been designated as a cash flow hedge and the effective portion of gain and losses is recorded in equity. The derivative instrument had a negative fair value of AED 62 million as at 31 December 2018 (2017: negative fair value of AED 75 million), which is included within other liabilities, accounts payables, accruals and other liabilities, in the consolidated statement of financial position.
iii) Forward Foreign Exchange Contracts
Shuweihat CMS International Power Company PJSC (SCIPCO)SCIPCO uses forward foreign exchange contracts to hedge its risk associated with foreign currency fluctuations relating to scheduled maintenance cost payments to an overseas supplier. The outstanding forward foreign exchange commitment at 31 December 2018 amounted to AED 9 million (2017: AED 153 million).
The derivative instruments which are entered into for the purpose of cash flow hedge had a negative fair value of AED 8 million at 31 December 2018 (2017: positive fair value of AED 9 million). An amount of AED 7 million representing the non-current derivative liability (2017: non-current derivative asset AED 5 million), has been included within other liabilities (note 30) and the current portion amounting to AED 1 million is included within accounts payable, accruals, and other liabilities (note 31) (2017: other assets AED 4 million).
Fujairah Asia Power Company PJSC (FAPCO)FAPCO uses forward foreign exchange contracts to hedge its risk associated with foreign currency fluctuations relating to scheduled maintenance cost payments to an overseas supplier. The notional amount outstanding at 31 December 2018 was nil (2017: AED 92 million).
The derivative instrument had a fair value of AED nil (2017: AED 14 million) as of 31 December 2018
Ruwais Power Company PJSC (RPC)RPC uses forward foreign exchange contracts to hedge its risk associated with foreign currency fluctuations relating to scheduled maintenance cost payments to an overseas supplier. The notional amount outstanding at 31 December 2018 was AED 57 million (2017: AED 139 million).
The derivative instrument had a negative fair value of AED 15 million (2017: AED 29 million) as of 31 December 2018. An amount of AED nil (2017: AED 12 million), representing the non-current portion of the derivative liability and the current portion amounting to AED 15 million (2017: AED 17 million) is included within accounts payable, accruals and other liabilities (note 31).
Emirates CMS Power Company PJSC (ECPC)During the year ended 31 December 2015, ECPC entered into forward foreign exchange contracts to hedge its risk associated with foreign currency fluctuation relating to schedule maintenance cost payments to an overseas suppliers. The notional amount outstanding at 31 December 2018 was AED 10 million (2017: AED 34 million).
The derivative instrument had a positive fair value of less than a million AED (2017: negative fair value of AED 3 million) as of 31 December 2018.
36.2 Hedging activities – Fair Value hedges
iv) OtherTAQA GEN X LLC, a subsidiary of TAQA utilises derivative instruments, which include futures and forwards as a hedging strategy to manage the exposure in the fair value of the underlying Tolling Agreement. Forward and future transactions are contracts for delayed delivery of commodity instruments in which the counterpart agrees to make or take delivery at a specified price.
As at 31 December 2018, the net fair value of exchange-traded derivative instruments was AED 100 million shown under accruals and other liabilities (note 31) (2017: AED 105 million). The net realised and unrealised loss recognised in the consolidated income statement relating to such instruments are AED 8 million for the year ended 31 December 2018 (2017: loss of AED 23 million).
As at 1 January 2014, following the early adoption of IFRS 9, TAQA GEN X LLC designated a new hedge relationship. The Tolling Agreement recognised as an intangible at acquisition was adjusted for the change in fair value for movements in the designated hedge risk in a fair value hedge relationship. The changes in the fair value of the Tolling Agreement attributable to the hedged risk (note 13), for the year ended 31 December 2018 was a gain of AED 67 million (2017: AED 61 million loss) which was recognised in the consolidated income statement.
2018 Annual Report
75
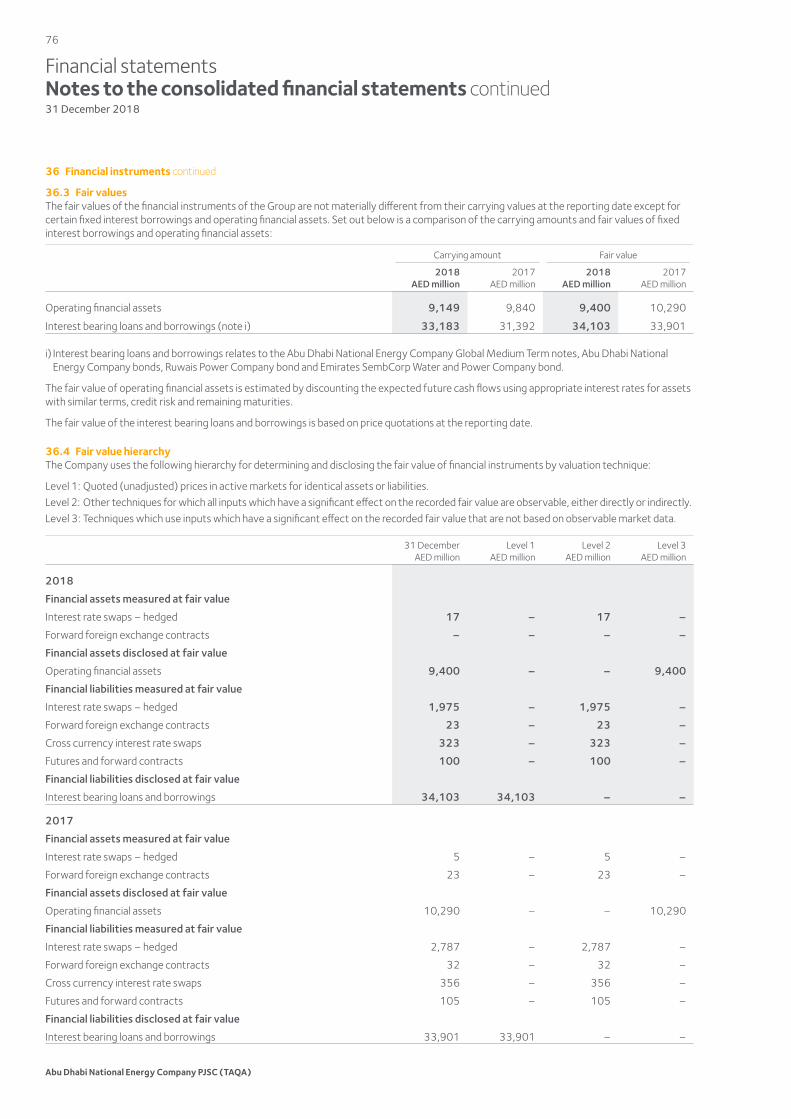
Financial statementsNotes to the consolidated financial statements continued31 December 2018
36 Financial instruments continued
36.3 Fair valuesThe fair values of the financial instruments of the Group are not materially different from their carrying values at the reporting date except for certain fixed interest borrowings and operating financial assets. Set out below is a comparison of the carrying amounts and fair values of fixed interest borrowings and operating financial assets:
Carrying amount Fair value
2018AED million
2017AED million
2018AED million
2017AED million
Operating financial assets 9,149 9,840 9,400 10,290
Interest bearing loans and borrowings (note i) 33,183 31,392 34,103 33,901
i) Interest bearing loans and borrowings relates to the Abu Dhabi National Energy Company Global Medium Term notes, Abu Dhabi National Energy Company bonds, Ruwais Power Company bond and Emirates SembCorp Water and Power Company bond.
The fair value of operating financial assets is estimated by discounting the expected future cash flows using appropriate interest rates for assets with similar terms, credit risk and remaining maturities.
The fair value of the interest bearing loans and borrowings is based on price quotations at the reporting date.
36.4 Fair value hierarchyThe Company uses the following hierarchy for determining and disclosing the fair value of financial instruments by valuation technique:
Level 1: Quoted (unadjusted) prices in active markets for identical assets or liabilities.Level 2: Other techniques for which all inputs which have a significant effect on the recorded fair value are observable, either directly or indirectly.Level 3: Techniques which use inputs which have a significant effect on the recorded fair value that are not based on observable market data.
31 DecemberAED million
Level 1AED million
Level 2AED million
Level 3AED million
2018
Financial assets measured at fair value
Interest rate swaps – hedged 17 – 17 –
Forward foreign exchange contracts – – – –
Financial assets disclosed at fair value
Operating financial assets 9,400 – – 9,400
Financial liabilities measured at fair value
Interest rate swaps – hedged 1,975 – 1,975 –
Forward foreign exchange contracts 23 – 23 –
Cross currency interest rate swaps 323 – 323 –
Futures and forward contracts 100 – 100 –
Financial liabilities disclosed at fair value
Interest bearing loans and borrowings 34,103 34,103 – –
2017
Financial assets measured at fair value
Interest rate swaps – hedged 5 – 5 –
Forward foreign exchange contracts 23 – 23 –
Financial assets disclosed at fair value
Operating financial assets 10,290 – – 10,290
Financial liabilities measured at fair value
Interest rate swaps – hedged 2,787 – 2,787 –
Forward foreign exchange contracts 32 – 32 –
Cross currency interest rate swaps 356 – 356 –
Futures and forward contracts 105 – 105 –
Financial liabilities disclosed at fair value
Interest bearing loans and borrowings 33,901 33,901 – –
Abu Dhabi National Energy Company PJSC (TAQA)
76
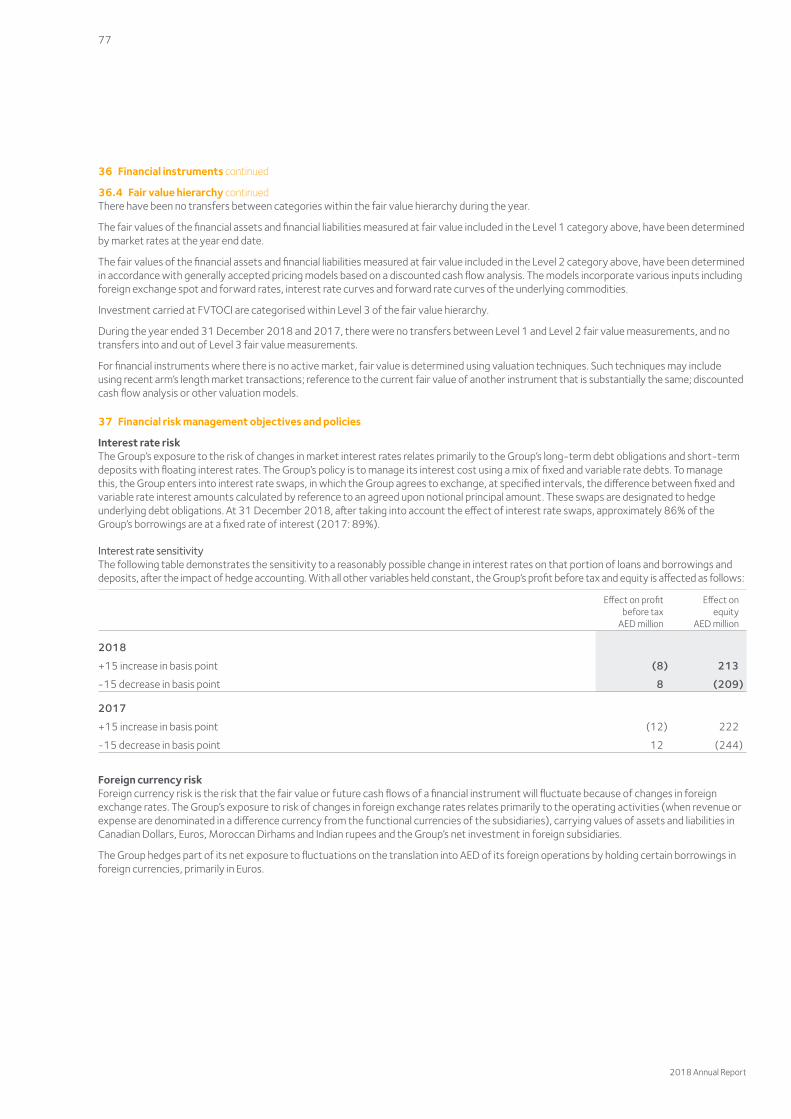
36 Financial instruments continued
36.4 Fair value hierarchy continuedThere have been no transfers between categories within the fair value hierarchy during the year.
The fair values of the financial assets and financial liabilities measured at fair value included in the Level 1 category above, have been determined by market rates at the year end date.
The fair values of the financial assets and financial liabilities measured at fair value included in the Level 2 category above, have been determined in accordance with generally accepted pricing models based on a discounted cash flow analysis. The models incorporate various inputs including foreign exchange spot and forward rates, interest rate curves and forward rate curves of the underlying commodities.
Investment carried at FVTOCI are categorised within Level 3 of the fair value hierarchy.
During the year ended 31 December 2018 and 2017, there were no transfers between Level 1 and Level 2 fair value measurements, and no transfers into and out of Level 3 fair value measurements.
For financial instruments where there is no active market, fair value is determined using valuation techniques. Such techniques may include using recent arm’s length market transactions; reference to the current fair value of another instrument that is substantially the same; discounted cash flow analysis or other valuation models.
37 Financial risk management objectives and policies
Interest rate riskThe Group’s exposure to the risk of changes in market interest rates relates primarily to the Group’s long-term debt obligations and short-term deposits with floating interest rates. The Group’s policy is to manage its interest cost using a mix of fixed and variable rate debts. To manage this, the Group enters into interest rate swaps, in which the Group agrees to exchange, at specified intervals, the difference between fixed and variable rate interest amounts calculated by reference to an agreed upon notional principal amount. These swaps are designated to hedge underlying debt obligations. At 31 December 2018, after taking into account the effect of interest rate swaps, approximately 86% of the Group’s borrowings are at a fixed rate of interest (2017: 89%).
Interest rate sensitivityThe following table demonstrates the sensitivity to a reasonably possible change in interest rates on that portion of loans and borrowings and deposits, after the impact of hedge accounting. With all other variables held constant, the Group’s profit before tax and equity is affected as follows:
Effect on profitbefore tax
AED million
Effect onequity
AED million
2018
+15 increase in basis point (8) 213
-15 decrease in basis point 8 (209)
2017
+15 increase in basis point (12) 222
-15 decrease in basis point 12 (244)
Foreign currency riskForeign currency risk is the risk that the fair value or future cash flows of a financial instrument will fluctuate because of changes in foreign exchange rates. The Group’s exposure to risk of changes in foreign exchange rates relates primarily to the operating activities (when revenue or expense are denominated in a difference currency from the functional currencies of the subsidiaries), carrying values of assets and liabilities in Canadian Dollars, Euros, Moroccan Dirhams and Indian rupees and the Group’s net investment in foreign subsidiaries.
The Group hedges part of its net exposure to fluctuations on the translation into AED of its foreign operations by holding certain borrowings in foreign currencies, primarily in Euros.
2018 Annual Report
77
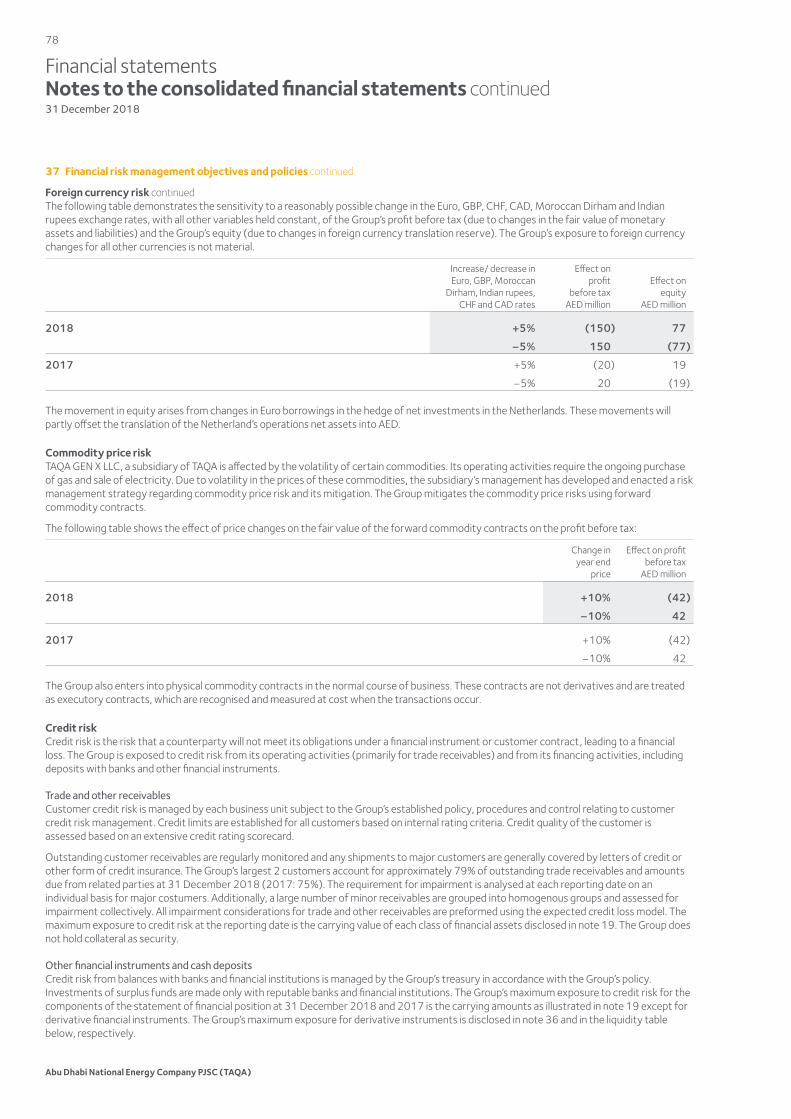
Financial statementsNotes to the consolidated financial statements continued31 December 2018
37 Financial risk management objectives and policies continued
Foreign currency risk continuedThe following table demonstrates the sensitivity to a reasonably possible change in the Euro, GBP, CHF, CAD, Moroccan Dirham and Indian rupees exchange rates, with all other variables held constant, of the Group’s profit before tax (due to changes in the fair value of monetary assets and liabilities) and the Group’s equity (due to changes in foreign currency translation reserve). The Group’s exposure to foreign currency changes for all other currencies is not material.
Increase/ decrease in Euro, GBP, Moroccan
Dirham, Indian rupees, CHF and CAD rates
Effect onprofit
before taxAED million
Effect onequity
AED million
2018 +5% (150) 77
–5% 150 (77)
2017 +5% (20) 19
–5% 20 (19)
The movement in equity arises from changes in Euro borrowings in the hedge of net investments in the Netherlands. These movements will partly offset the translation of the Netherland’s operations net assets into AED.
Commodity price riskTAQA GEN X LLC, a subsidiary of TAQA is affected by the volatility of certain commodities. Its operating activities require the ongoing purchase of gas and sale of electricity. Due to volatility in the prices of these commodities, the subsidiary’s management has developed and enacted a risk management strategy regarding commodity price risk and its mitigation. The Group mitigates the commodity price risks using forward commodity contracts.
The following table shows the effect of price changes on the fair value of the forward commodity contracts on the profit before tax:
Change inyear end
price
Effect on profitbefore tax
AED million
2018 +10% (42)
–10% 42
2017 +10% (42)
–10% 42
The Group also enters into physical commodity contracts in the normal course of business. These contracts are not derivatives and are treated as executory contracts, which are recognised and measured at cost when the transactions occur.
Credit riskCredit risk is the risk that a counterparty will not meet its obligations under a financial instrument or customer contract, leading to a financial loss. The Group is exposed to credit risk from its operating activities (primarily for trade receivables) and from its financing activities, including deposits with banks and other financial instruments.
Trade and other receivablesCustomer credit risk is managed by each business unit subject to the Group’s established policy, procedures and control relating to customer credit risk management. Credit limits are established for all customers based on internal rating criteria. Credit quality of the customer is assessed based on an extensive credit rating scorecard.
Outstanding customer receivables are regularly monitored and any shipments to major customers are generally covered by letters of credit or other form of credit insurance. The Group’s largest 2 customers account for approximately 79% of outstanding trade receivables and amounts due from related parties at 31 December 2018 (2017: 75%). The requirement for impairment is analysed at each reporting date on an individual basis for major costumers. Additionally, a large number of minor receivables are grouped into homogenous groups and assessed for impairment collectively. All impairment considerations for trade and other receivables are preformed using the expected credit loss model. The maximum exposure to credit risk at the reporting date is the carrying value of each class of financial assets disclosed in note 19. The Group does not hold collateral as security.
Other financial instruments and cash depositsCredit risk from balances with banks and financial institutions is managed by the Group’s treasury in accordance with the Group’s policy. Investments of surplus funds are made only with reputable banks and financial institutions. The Group’s maximum exposure to credit risk for the components of the statement of financial position at 31 December 2018 and 2017 is the carrying amounts as illustrated in note 19 except for derivative financial instruments. The Group’s maximum exposure for derivative instruments is disclosed in note 36 and in the liquidity table below, respectively.
Abu Dhabi National Energy Company PJSC (TAQA)
78
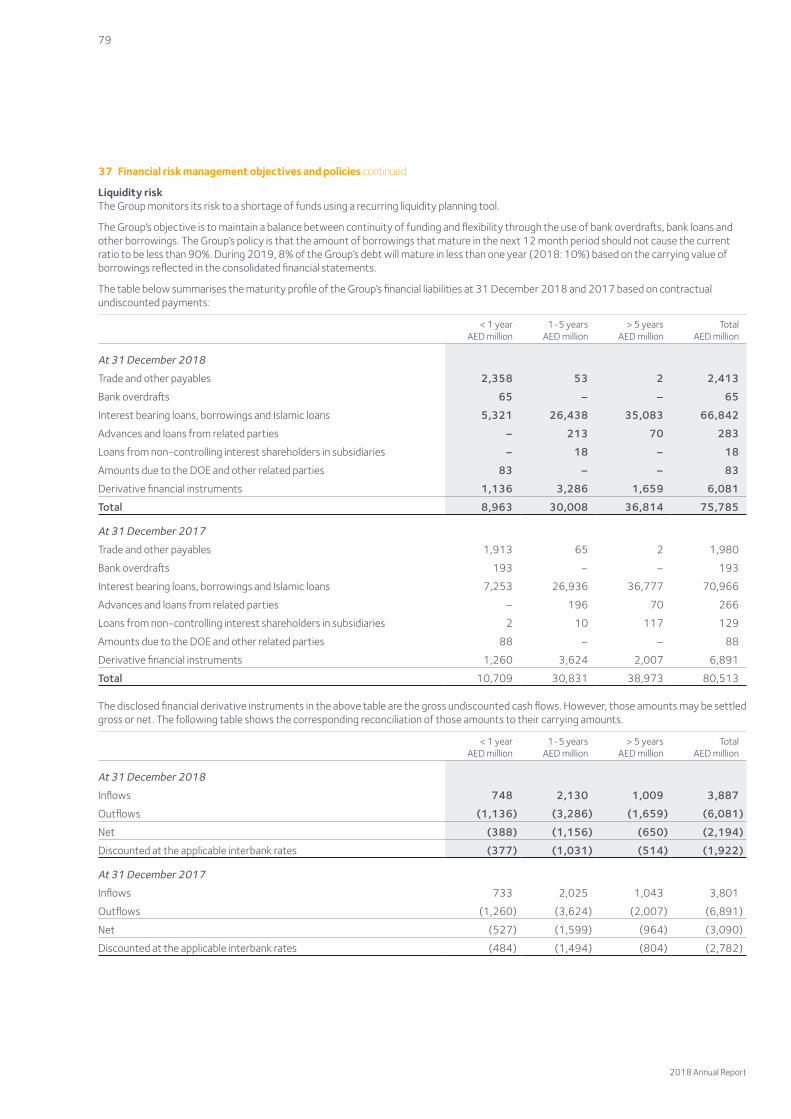
37 Financial risk management objectives and policies continued
Liquidity riskThe Group monitors its risk to a shortage of funds using a recurring liquidity planning tool.
The Group’s objective is to maintain a balance between continuity of funding and flexibility through the use of bank overdrafts, bank loans and other borrowings. The Group’s policy is that the amount of borrowings that mature in the next 12 month period should not cause the current ratio to be less than 90%. During 2019, 8% of the Group’s debt will mature in less than one year (2018: 10%) based on the carrying value of borrowings reflected in the consolidated financial statements.
The table below summarises the maturity profile of the Group’s financial liabilities at 31 December 2018 and 2017 based on contractual undiscounted payments:
< 1 yearAED million
1-5 yearsAED million
> 5 yearsAED million
TotalAED million
At 31 December 2018
Trade and other payables 2,358 53 2 2,413
Bank overdrafts 65 – – 65
Interest bearing loans, borrowings and Islamic loans 5,321 26,438 35,083 66,842
Advances and loans from related parties – 213 70 283
Loans from non-controlling interest shareholders in subsidiaries – 18 – 18
Amounts due to the DOE and other related parties 83 – – 83
Derivative financial instruments 1,136 3,286 1,659 6,081
Total 8,963 30,008 36,814 75,785
At 31 December 2017
Trade and other payables 1,913 65 2 1,980
Bank overdrafts 193 – – 193
Interest bearing loans, borrowings and Islamic loans 7,253 26,936 36,777 70,966
Advances and loans from related parties – 196 70 266
Loans from non-controlling interest shareholders in subsidiaries 2 10 117 129
Amounts due to the DOE and other related parties 88 – – 88
Derivative financial instruments 1,260 3,624 2,007 6,891
Total 10,709 30,831 38,973 80,513
The disclosed financial derivative instruments in the above table are the gross undiscounted cash flows. However, those amounts may be settled gross or net. The following table shows the corresponding reconciliation of those amounts to their carrying amounts.
< 1 yearAED million
1-5 yearsAED million
> 5 yearsAED million
TotalAED million
At 31 December 2018
Inflows 748 2,130 1,009 3,887
Outflows (1,136) (3,286) (1,659) (6,081)
Net (388) (1,156) (650) (2,194)
Discounted at the applicable interbank rates (377) (1,031) (514) (1,922)
At 31 December 2017
Inflows 733 2,025 1,043 3,801
Outflows (1,260) (3,624) (2,007) (6,891)
Net (527) (1,599) (964) (3,090)
Discounted at the applicable interbank rates (484) (1,494) (804) (2,782)
2018 Annual Report
79
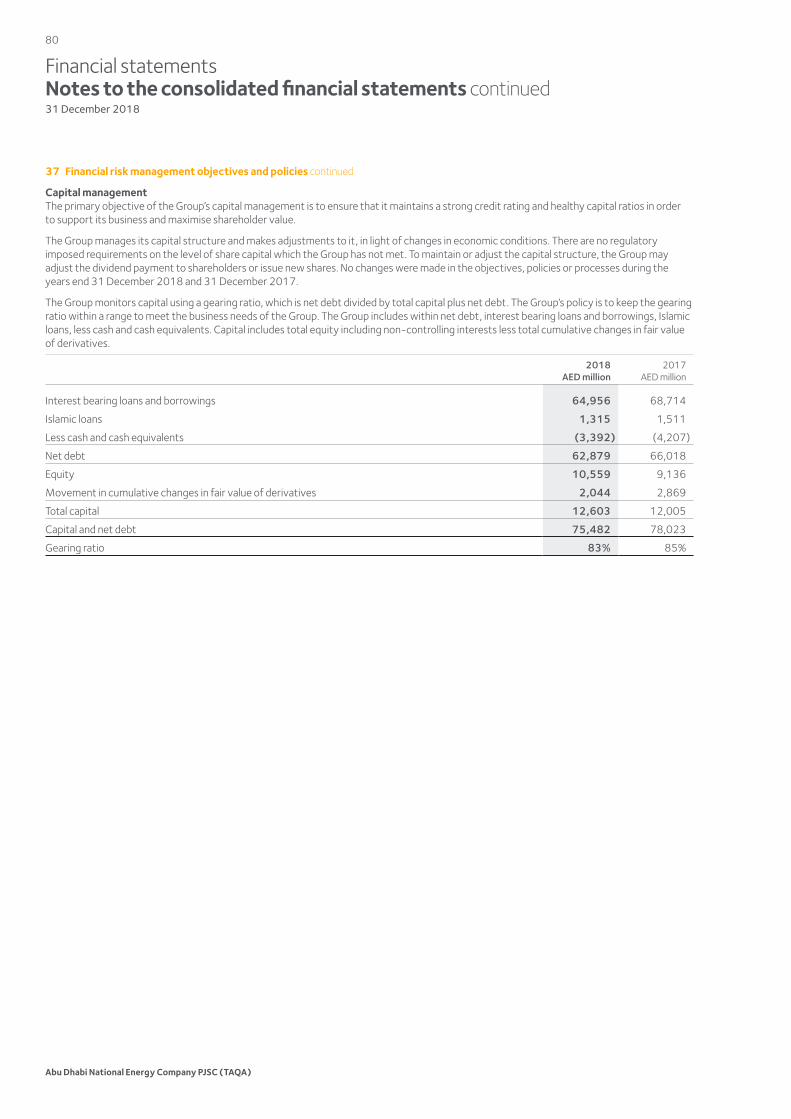
Financial statementsNotes to the consolidated financial statements continued31 December 2018
37 Financial risk management objectives and policies continued
Capital managementThe primary objective of the Group’s capital management is to ensure that it maintains a strong credit rating and healthy capital ratios in order to support its business and maximise shareholder value.
The Group manages its capital structure and makes adjustments to it, in light of changes in economic conditions. There are no regulatory imposed requirements on the level of share capital which the Group has not met. To maintain or adjust the capital structure, the Group may adjust the dividend payment to shareholders or issue new shares. No changes were made in the objectives, policies or processes during the years end 31 December 2018 and 31 December 2017.
The Group monitors capital using a gearing ratio, which is net debt divided by total capital plus net debt. The Group’s policy is to keep the gearing ratio within a range to meet the business needs of the Group. The Group includes within net debt, interest bearing loans and borrowings, Islamic loans, less cash and cash equivalents. Capital includes total equity including non-controlling interests less total cumulative changes in fair value of derivatives.
2018AED million
2017AED million
Interest bearing loans and borrowings 64,956 68,714
Islamic loans 1,315 1,511
Less cash and cash equivalents (3,392) (4,207)
Net debt 62,879 66,018
Equity 10,559 9,136
Movement in cumulative changes in fair value of derivatives 2,044 2,869
Total capital 12,603 12,005
Capital and net debt 75,482 78,023
Gearing ratio 83% 85%
Abu Dhabi National Energy Company PJSC (TAQA)
80

Abu Dhabi National Energy Company PJSC (TAQA)P.O. Box 55224, Abu DhabiUnited Arab Emirates
www.taqaglobal.com
Abu Dhabi N
ational Energy Com
pany PJSC (TAQ
A)
20
18
Annual Report


