29
Research Report No 1 to DSD on outcomes of Stage 2 and progress on Stage 3: Cohort 1 BtGP team 2
REPORT ON THE OUTCOMES OF STAGE 2: COHORT 1 AND
PROGRESS OF STAGE 3: COHORT 1
31st January 2017 to 30th September 2017
Prepared for the Department of State Development
This project is supported by funding from the South Australian Government through the Department of State Development and the Flinders University of South Australia.
Acknowledgement: Many people have been involved both directly and indirectly in the Bridging the Gap project and the accompanying research, not the least of whom have been the pre-service teachers of secondary science, the mentor teachers in Government, Catholic and Independent schools, as well as the many secondary students in science classes taught by the Bridging the Gap pre-service teachers. Thanks also, must go to the industry mentors who so graciously gave of their time and resources to help the pre-service teachers identify a STEM industry problem and also to Flinders Partners in so ably assisting the pre-service teachers in the translation and communication of the industry problem, with the help of Flinders research scientists, into some possible solutions.
Flinders Project Team: Carol Aldous, Aidan Cornelius-Bell, David Jeffries, Simon Leonard, Narmon Tulsi, Stella Vosniadou.
Department of State Development: Ben Samy
Industry Partners: APA Group-Australian Gas Networks, BAE Systems Australia, Basil Hetzel Institute for Translational Health Research, Beach Energy, Department of Human Services, Flinders Partners, New Venture Institute, REDARC, SAGE Automation, SA Power Networks, Arrium (now SIMEC Mining).
© 2017 Carol R. Aldous, Flinders University
Cover design and layout by Aidan Cornelius-Bell
Published online by Flinders University (Bridging the Gap Project)
https://bridgingthegap.edu.au/publications/
ISBN: 978-1-925562-27-9
Research Report No 1 to DSD on outcomes of Stage 2 and progress on Stage 3: Cohort 1 BtGP team 3
EXECUTIVE SUMMARY: RESEARCH REPORT NO 1 Background to the Report
What is the Bridging the Gap Project (BtGP)?
BtGP is an innovation1 in pre-service teacher education involving student teachers of secondary science undertaking a short-term STEM2 industry engagement experience. The project is jointly funded by the Department of State Development and Flinders University.
Project Vision
To investigate the potential to increase secondary school student interest in STEM by forging connections between different communities of practice namely university teacher education, schools, centres of innovation, business and industry and government departments by engaging preservice teachers in an industry placement (see Figure 1 page 9).
Project Objectives
Equip a cohort of future STEM teachers with the skills and confidence to build effective and sustainable partnerships with industry, congruent with a spirit of enterprise;
Strengthen these teachers’ ability to interpret and translate how STEM is utilised in the workplace into inspiring and stimulating contexts for students;
Enhance these pre-service teachers’ capacity to innovate and create new curricula and resources for the learning and teaching of secondary science that is congruent with creative problem-solving and contemporary science; and
Enable a shift in secondary school students’ mindset regarding the relevance of STEM in society.
Project Structure
The project occurs in three-stages.
Stage 1: create and maintain a web-based platform of resources;
Stage 2: preservice science teachers undertake a STEM industry placement for 3 weeks at 4 hours per week and subsequently develop units of work (see Figure 3 page 14); and
Stage 3: preservice teachers undertake final teaching practicum in STEM-focused school.
Three cohorts of student teachers are cycling through the project stages.
Cohort 1: commence Stage 2 in October 2016 and Stage 3 in May 2017;
Cohort 2: commence Stage 2 in October 2017 and Stage 3 in May 2018; and
Cohort 3: commence Stage 2 in October 2018 and Stage 3 in May 2019.
1Innovation in an education context is defined as the process of assembling and maintaining a novel alignment of ideas, practices and actors to respond to site-specific issues and or to pursue a vision (Tytler, R., Symington, D., Smith, C. and Rodrigues, S.(2008) An innovation framework based on best practice exemplars from the Australian School Innovation in Science, Technology and Mathematics (ASISTM) Project Canberra: Common wealth of Australia. 2STEM refers to Science, Technology, Engineering and Mathematics
Research Report No 1 to DSD on outcomes of Stage 2 and progress on Stage 3: Cohort 1 BtGP team 4
Research Method and Plan
Question: “What is the relationship between pre-service teacher industry engagement, entrepreneurial creative thinking and secondary student engagement and entry into STEM?”.
Data Collection Stage 2: pre-service teachers respond to a purpose-designed questionnaire and focus group interviews, pre and post the industry experience.
Stage 3: secondary school students respond to the PISA3 2006/2015 attitudes, engagement and motivation in science inventory, pre and post the preservice teacher practicum. Interviews were conducted with mentor teachers and focus groups with pre-service teachers post the teaching practicum.
Foci for Research Report No 1 Stage 2: Industry Placement Results: Cohort 1 Nineteen pre-service teachers working in groups of two or three, engaged with nine industry partners viz APA Australian Gas Works, Arrium (now SIMEC Mining), BAE Systems, Beach Energy, Basil Hetzel Institute, Human Services, SAGE Automation and SA Power Networks.
Findings concerning the Pre-service teacher perceptions of the industry experience 1. Survey Results Pre-service teachers were surveyed along four dimensions pre (n=18) and post (n=7)4 the industry engagement activity. Dimensions surveyed: Confidence going into a STEM Industry, Teaching and Learning Innovations, View of STEM and STEM Industries, Creativity and Problem-Solving in STEM.
Pre-service teachers felt more confident and prepared going into the industry experience (by 14 mean percentage points) than they did after the experience;
Pre-service teachers felt more cognitively enabled with skills and abilities in teaching and learning STEM (by 8 mean percentage points), before the industry placement, than they did after the experience;
Pre-service teachers’ perceptions of STEM Industries increased positively (by 20 mean percentage points) after the industry experience compared with what they were before the experience;
Pre-service teachers’ perceptions of creativity in STEM were marginally lower (by three percentage points) after the industry experience than they were before it; and
The largest percentage agreement of any of the dimensions either pre or post was that for the post View of STEM and STEM Industries with 88 per cent agreement.
2. Focus Group Interviews Focus group interviews were conducted pre (n=10 people) and post (n=10 people) the industry experience with the pre-service teacher using open-ended questions based on the themes/dimensions stated above.
3 PISA stands for the Programme for International Student Assessment conducted among OECD nations in Science, Mathematics and Reading in three yearly cycles. 4A post response rate of 37% indicates that the activity requires replication.
Research Report No 1 to DSD on outcomes of Stage 2 and progress on Stage 3: Cohort 1 BtGP team 5
The pre-service teachers experienced some mismatch with reality in what they thought they knew about STEM Industries before the visit, with what they learned on the industry visit.
Bridging the Gap project is positively impacting pre-service teachers’ perceptions of their View of STEM and STEM industries. Stage 3: Progress on School Placement Findings: Cohort 1
Fifteen BtGP pre-service teachers distributed across 13 schools, completed their final year teaching practicum. Secondary students in science classes taught by the pre-service teacher answered the PISA 2006/2015 attitudes, engagement and motivation in science inventory pre and post the pre-service teachers’ practicum.
Findings concerning the Secondary school students 3. Preliminary secondary students survey results (Matched sample) In a matched sample of n= 63 cases, a paired sample T-test revealed 4 dimensions of the PISA 2006/2015 attitudes, engagement and motivation in science inventory to be highly significant pre to post viz: Self-efficacy in science, Science-related activities, Science uses investigations and Future-oriented science motivation.
Preliminary findings indicate that Bridging the Gap project is positively impacting students in secondary schools through its pre-service teachers.
Research Report No 1 to DSD on outcomes of Stage 2 and progress on Stage 3: Cohort 1 BtGP team 6
Table of Contents Executive Summary: Research Report No 1 ........................................................................................................ 3
List of Tables ........................................................................................................................................................ 7
List of Figures ....................................................................................................................................................... 7
1. Purpose of the report ................................................................................................................................. 8
1.1 Principle foci for reporting .................................................................................................................... 9
1.2 The stated Project requirements ........................................................................................................... 9
2. The Research Method and Plan ............................................................................................................... 10
2.1 Stage 2: ................................................................................................................................................ 10
2.2 Stage 3: STEM School Placement ........................................................................................................ 12
3. The Industry Experience Explained .......................................................................................................... 14
3.1 The Industries and the Issues .............................................................................................................. 14
4. Stage 2: Industry Engagement Results: Cohort 1 ..................................................................................... 15
4.1 Pre-service teacher surveys and focus group interviews conducted pre and post ............................. 15
4.2 Summarising the Differences in Mean Percentage Agreement Pre to Post ....................................... 17
4.3 The Size and Direction of the Difference Pre to Post Industry Engagement ....................................... 22
4.4 Discussion and Conclusion................................................................................................................... 23
5. Stage 3: Progress made with school placement results: Cohort 1 .......................................................... 23
5.1 Secondary student surveys preliminary findings ................................................................................ 23
6. Final reflection .......................................................................................................................................... 24
Appendix 1 ........................................................................................................................................................ 26
Research Report No 1 to DSD on outcomes of Stage 2 and progress on Stage 3: Cohort 1 BtGP team 7
LIST OF TABLES
Table 1: Industry issues and questions addressed by the pre-service teachers ............................................... 14
Table 2: Industry Experience Survey Results Pre (n=18), Post (n=7) ................................................................ 18
Table 3: Industry Survey Results Pre (n=18), Post (n=7) with Percentage Not Sure ......................................... 20
Table 4: Mean percentage agreement Pre to Post Industry experience .......................................................... 22
Table 5: Paired samples T-testing conducted on n=63, pre and post student teacher practicum. .................. 24
LIST OF FIGURES
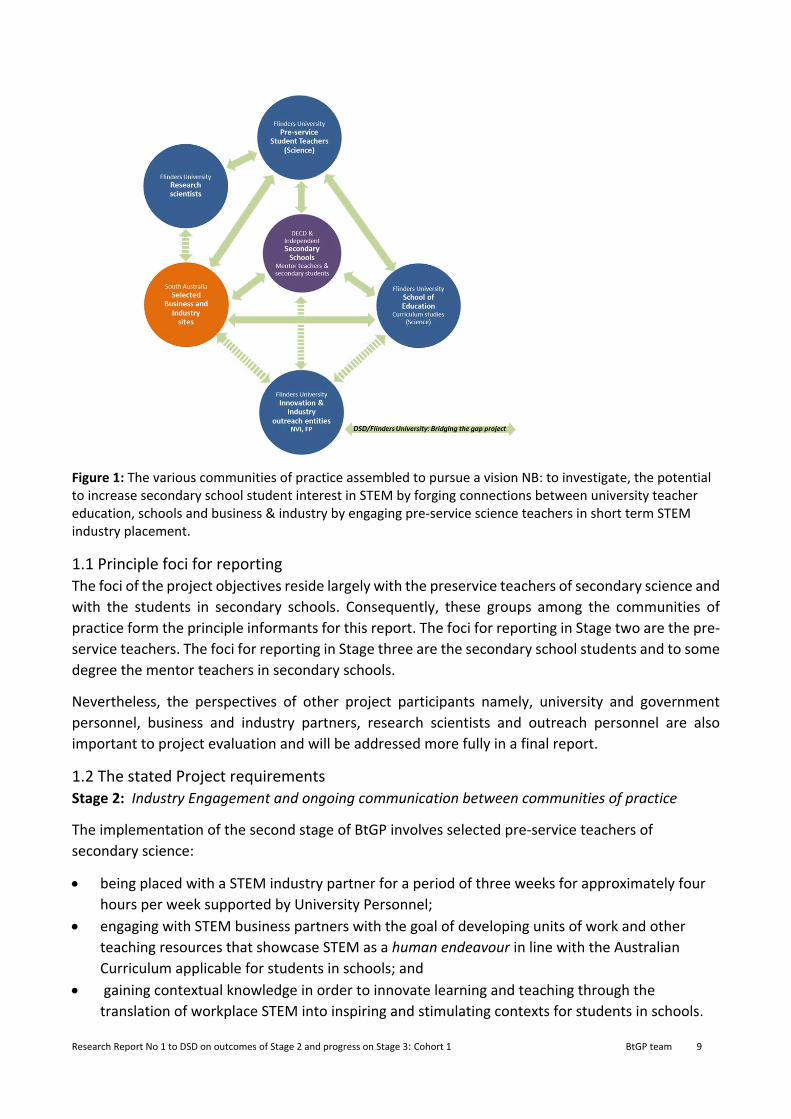
Figure 1: The various communities of practice assembled to pursue a vision NB: to investigate, the potential to increase secondary school student interest in STEM by forging connections between university teacher education, schools and business & industry by engaging pre-service science teachers in short term STEM industry placement .............................................................................................................................................. 9
Figure 2: Stylised view of the Research Plan for Stage 2 and Stage 3 of BtGP ................................................. 10
Figure 3: Phases of pre-service teacher industry engagement .......................................................................... 14
Figure 4: Bar graph showing mean percentage agreement pre and post the industry experience for each of the four dimensions .......................................................................................................................................... 22
Figure 5: Direction and size of difference pre to post industry engagement. ................................................. 22
Research Report No 1 to DSD on outcomes of Stage 2 and progress on Stage 3: Cohort 1 BtGP team 8
1. Purpose of the report
This paper reports on Stage 2 and progress made on Stage 3 of a three-stage project entitled Improving student interest in STEM through Preservice Teacher Industry Engagement: Bridging the Gap between knowledge creation and its application in industry and society (herein referred to as Bridging the Gap Project: BtGP) funded by the South Australian Department of State Development (primary sponsor) and Flinders University, Adelaide Australia.
The project elaborates four objectives. These are to:
(1) Equip a cohort of future STEM teachers with the skills and confidence to build effective and sustainable partnerships with industry, congruent with a spirit of enterprise;
(2) Strengthen these teachers’ ability to interpret and translate how STEM is utilised in the workplace into inspiring and stimulating contexts for students;
(3) Enhance these pre-service teachers’ capacity to innovate and create new curricula and resources for the learning and teaching of secondary science that is congruent with creative Problem-Solving and contemporary science; and
(4) Enable a shift in secondary school students’ mindset regarding the relevance of STEM in society.
The outcomes of Stage 2 and progress made in Stage 3 of the BtGP are reported against these four objectives. The purpose of the evaluation is to gather some baseline data for the successful development of future improvements to the South Australian based, pre-service science teacher, curriculum innovation termed BtGP, whose goal it is to not only, bridge the gap between theoretical science knowledge and its application in society but also to impact secondary school students’ future orientation to the learning of STEM.
In the education context, an innovation may be defined as “the process of assembling and maintaining a novel alignment of ideas, practices and actors to respond to site-specific issues and/or to pursue a vision” (Tytler, Symington, Smith & Rodrigues, 2008). A diagram depicting the novel alignment of players and communities of practice within the BtGP is given in Figure 1.
Since each stage of the project is interdependent on every other stage, the project is best viewed in its entirety as an integrated, interacting system or whole. The synergy arising from different communities of practice working together at every stage of the project, has the likelihood of giving rise to outcomes that are more than the sum of any individual stage or part. Consequently, the partial findings of this report will be both refined and built upon by the future findings of the final report.
Research Report No 1 to DSD on outcomes of Stage 2 and progress on Stage 3: Cohort 1 BtGP team 9
Figure 1: The various communities of practice assembled to pursue a vision NB: to investigate, the potential to increase secondary school student interest in STEM by forging connections between university teacher education, schools and business & industry by engaging pre-service science teachers in short term STEM industry placement.
1.1 Principle foci for reporting The foci of the project objectives reside largely with the preservice teachers of secondary science and with the students in secondary schools. Consequently, these groups among the communities of practice form the principle informants for this report. The foci for reporting in Stage two are the pre-service teachers. The foci for reporting in Stage three are the secondary school students and to some degree the mentor teachers in secondary schools.
Nevertheless, the perspectives of other project participants namely, university and government personnel, business and industry partners, research scientists and outreach personnel are also important to project evaluation and will be addressed more fully in a final report.
1.2 The stated Project requirements Stage 2: Industry Engagement and ongoing communication between communities of practice
The implementation of the second stage of BtGP involves selected pre-service teachers of secondary science:
• being placed with a STEM industry partner for a period of three weeks for approximately four hours per week supported by University Personnel;
• engaging with STEM business partners with the goal of developing units of work and other teaching resources that showcase STEM as a human endeavour in line with the Australian Curriculum applicable for students in schools; and
• gaining contextual knowledge in order to innovate learning and teaching through the translation of workplace STEM into inspiring and stimulating contexts for students in schools.

Research Report No 1 to DSD on outcomes of Stage 2 and progress on Stage 3: Cohort 1 BtGP team 10
Stage 3: Placement of pre-service teachers in STEM Industry focused schools
The implementation of the third stage of BtGP requires that at least 10 pre-service teachers of secondary science:
• undertake their final six-week practicum in a school with an established industry partner; • are mentored by schoolteachers with experience in industry partnership along with creating
innovative science learning and teaching practices in order to assist pre-service teachers trialling the curriculum and teaching resources developed during Stage 2 of the project.
Finally, mentor teachers engaging with industry partners are to be:
• invited to participate in a half-day conference to enable dialogue between the University and schools regarding the proposed industry engagement.
2. The Research Method and Plan
The overarching research question for the project is “What is the relationship between pre-service teacher industry engagement, entrepreneurial and creative thinking and student engagement and entry into STEM”.
The research schema for Stage 2 and Stage 3 of the BtGP project is given in Figure 2.
Figure 2: Stylised view of the research plan for Stage 2 and Stage 3 of BtGP.
2.1 Stage 2: 2.1.1 Population under study: Cohort 1. Participants comprised 19 pre-service teachers undertaking curriculum studies in secondary science. Of these, 14 were graduate students enrolled in the first year of a Master of Teaching degree and 5 were enrolled in their third year of a double degree, Bachelor of Education/ Bachelor of Science.
Stage 2: STEM Industry EngagementStage 3 : Pre-service Teacher
Placement
Pre Post Pre Post
Questionnaire and Focus Group
Pre-service Teachers
Questionnaire Industry Experts
Telephone Survey Mentor Teachers + field notes booklet
Questionnaire and Focus Groups–
School Students
Questionnaire and Focus Group
Pre-service Teachers
Questionnaire and Focus Group
Pre-service Teachers
Questionnaire Industry Experts
Questionnaire School
Students
Questionnaire Research Scientists
Research Report No 1 to DSD on outcomes of Stage 2 and progress on Stage 3: Cohort 1 BtGP team 11
The participants ranged in age between 21 to 34 years with a mean age of 24 years for the cohort. Of these 9 were male and 10 were female.
2.1.2 Data collection Survey data were collected from pre-service teachers, pre and post the industry experience using an online format through the BtGP website. A paper-based questionnaire was also distributed to business and industry experts and to research scientists engaged in the project with an online survey option through the BtGP portal.
Focus group interviews with the pre-service teachers were also conducted pre and post the industry engagement visits.
In all instances and in line with the requirements of the Flinders University Social and Behavioural Research Ethics Committee, participation in the research component of the project was entirely voluntary.
2.1.3 Instruments and Questions for Interview A purpose-designed questionnaire was developed for the study. Items were written to tap the following dimensions. These are:
• Confidence going into a STEM industry; • Teaching and learning innovations; • View of STEM and STEM Industries; and • Creativity and Problem-Solving in STEM
Students responded to each of the items on a five-point, Likert scale, ranging from strongly disagree, disagree, not sure, agree and strongly agree. Strongly disagree was rated 1, disagree 2, not sure 3, agree 4 and strongly agree 5.
Focus group interviews conducted pre and post, probed student thinking around the following points:
• What they hoped to get out of the industry placement; • How the industry placement may benefit their understanding of the connection between
science knowledge and its application in society in terms of, o their own teaching and their future students o what they understood by STEM;
• What they understood about science as a human endeavour; • Is creativity needed in science; • How they have been innovative and creative in their science teaching; and • How confident and prepared did they feel going into the industry placement.
2.1.4 Response Rate: Eighteen student teachers completed the pre-survey (n= 18). Of these 9 were male and 9 were female. Seven pre-service teachers completed the post-survey (n=7). Of these 2 were male and 5 were female.

Research Report No 1 to DSD on outcomes of Stage 2 and progress on Stage 3: Cohort 1 BtGP team 12
Three focus groups (n=2, n=4, n=4) comprising 10 students intotal were conducted prior to the industry experience. Of these 4 were male, 6 were female and 7 were Masters’ students and 3 Double degree students.
Two focus groups (n=5, n=5) totalling 10 students were conducted post the industry engagement. Of the 10 participants, 2 were male, 8 were female, 8 were Master of teaching students and 2 were Double degree students.
2.2 Stage 3: STEM School Placement In all instances approval to conduct Stage 3 of the research was obtained from the Department of Education and Child Development (DECD), the Catholic Education Office and from each Independent School involved in the project; as well as from the Flinders University Social and Behavioural Research Ethics Committee.
2.2.1 Populations under study: Cohort 1 Fifteen BtGP students in cohort 1 completed their final year teaching practicum. Twelve undertook a 6-week block and three a 10-week extended block. The extended placements were undertaken by students specially selected for that purpose. Two of the extended placements were undertaken in the country and one in the city. The 15 students were distributed across 13 schools with one large metropolitan school taking three BtGP students. Of the 13 schools involved, 10 were DECD schools, 2 Catholic and 1 Independent. All the project schools had a special interest in STEM and had agreed to mentor the student teachers in the context of the project and its requirements.
Consequently, participants under survey in Stage 3 of the project were secondary school students in classes taught by the BtGP student teachers who were undertaking their final year practicum.
2.2.2 Data collection Pre and post survey data were collected from secondary school students who had agreed to participate in the research; in secondary schools who had volunteered to be part of the BtGP project. Some of these were done online using the BtGP portal, others were conducted by paper. The choice to use the paper or the online version was left up to each individual school. However, this meant that data from the paper surveys had to be entered by hand, a process that is ongoing.
Embedded into the research plan was the opportunity to conduct follow up focus group interviews with individual secondary school students. To date, however, this opportunity has not been enacted upon, although prospective students have been identified.
Both telephone and face to face interviews, depending on opportunity and preference for the interviewee, were conducted (and indeed are still being conducted) with mentor teachers involved in the project. In addition, mentor teachers were invited to complete a field notes booklet of the observations that they had made of the pre-service teachers teaching activities.
2.2.3 Instruments Items from the PISA 2006/ 2015 survey relating to student engagement and motivation in science were used in developing the secondary student questionnaire. The following scales grouped by category were used: Student Views of Science
Research Report No 1 to DSD on outcomes of Stage 2 and progress on Stage 3: Cohort 1 BtGP team 13
• Interest in science • Enjoyment of Science, • Science self-efficacy, • General value of science, • Personal value of science, and • Science-related activities
Careers and Science • Preparation for a science-related career, • Informed about science-related careers, and • Future science motivation
Teaching and Learning Science • Science uses Interaction activities, • Science is hands-on, • Science uses investigations, • Science focuses on applications, • Instrumental motivation for science, and • Science self-concept.
As with the previous questionnaire, students responded on a five-point Likert scale ranging from strongly disagree through to strongly agree. Mentor teacher interviews invited discussion around aspects of the pre-service teacher’s placement and their unit of work with respect to each of the following:
• engagement and relationship with students; • utilization of Science as a human endeavor; • Pedagogy, teaching strategies and innovative and creative approaches; • Links to STEM Industries; and • Science inquiry skills.
2.2.4 Response Rates: To date, 141 pre-surveys and 250 post surveys have been received. Of these, 63 surveys have been matched pre and post for detailed analyses. However, when all data entry is finalised this figure is expected to rise. Robust structural equation modelling procedures can then be employed in the specific analyses of data.
Nevertheless, a paired population of n= 63 yields a Power = 0.8 able to detect medium-sized effects at the critical level of α =0.05 (Cohen, 1992). Consequently, some preliminary analyses have been conducted on this sample population and are reported briefly here.
Separate interviews with 10 mentor teachers from across five schools have been conducted.
Research Report No 1 to DSD on outcomes of Stage 2 and progress on Stage 3: Cohort 1 BtGP team 14
3. The Industry Experience Explained
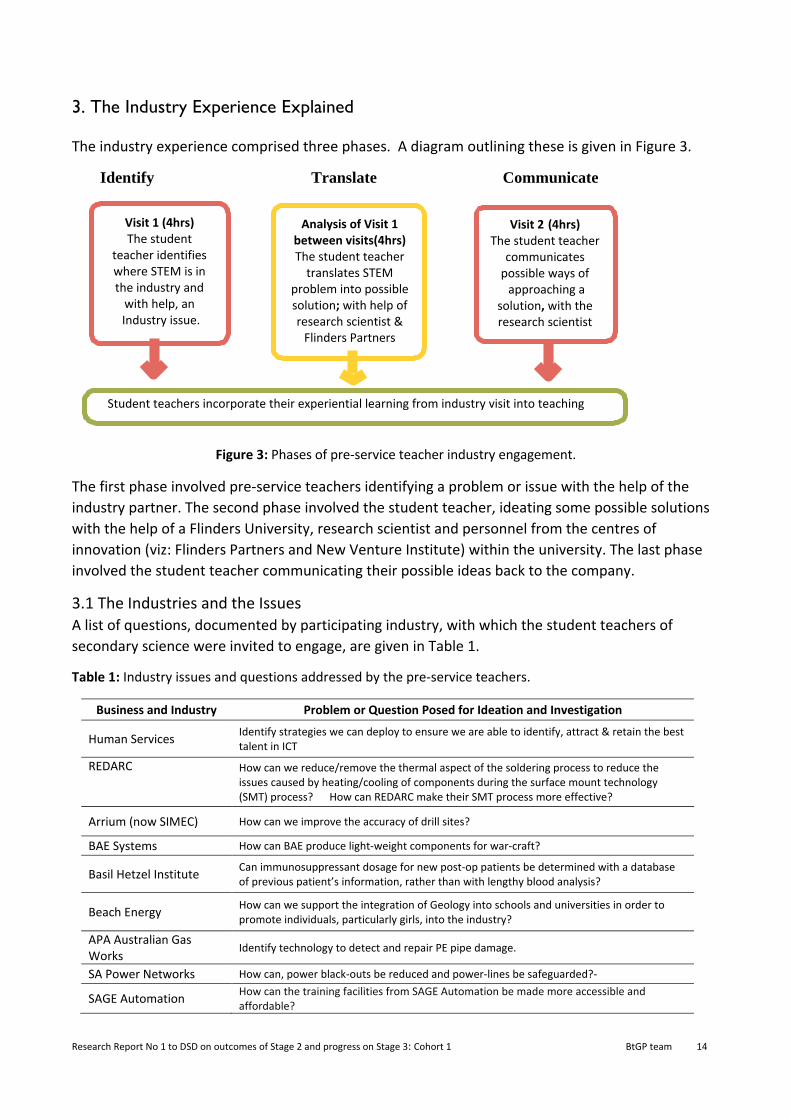
The industry experience comprised three phases. A diagram outlining these is given in Figure 3.
Identify Translate Communicate
Figure 3: Phases of pre-service teacher industry engagement.
The first phase involved pre-service teachers identifying a problem or issue with the help of the industry partner. The second phase involved the student teacher, ideating some possible solutions with the help of a Flinders University, research scientist and personnel from the centres of innovation (viz: Flinders Partners and New Venture Institute) within the university. The last phase involved the student teacher communicating their possible ideas back to the company.
3.1 The Industries and the Issues A list of questions, documented by participating industry, with which the student teachers of secondary science were invited to engage, are given in Table 1.
Table 1: Industry issues and questions addressed by the pre-service teachers.
Business and Industry Problem or Question Posed for Ideation and Investigation
Human Services Identify strategies we can deploy to ensure we are able to identify, attract & retain the best talent in ICT
REDARC
How can we reduce/remove the thermal aspect of the soldering process to reduce the issues caused by heating/cooling of components during the surface mount technology (SMT) process? How can REDARC make their SMT process more effective?
Arrium (now SIMEC) How can we improve the accuracy of drill sites?
BAE Systems How can BAE produce light-weight components for war-craft?
Basil Hetzel Institute Can immunosuppressant dosage for new post-op patients be determined with a database of previous patient’s information, rather than with lengthy blood analysis?
Beach Energy How can we support the integration of Geology into schools and universities in order to promote individuals, particularly girls, into the industry?
APA Australian Gas Works
Identify technology to detect and repair PE pipe damage.
SA Power Networks How can, power black-outs be reduced and power-lines be safeguarded?-
SAGE Automation How can the training facilities from SAGE Automation be made more accessible and affordable?
Visit 1 (4hrs) The student
teacher identifies where STEM is in the industry and
with help, an Industry issue.
Analysis of Visit 1 between visits(4hrs) The student teacher
translates STEM problem into possible solution; with help of research scientist &
Flinders Partners
Visit 2 (4hrs) The student teacher
communicates possible ways of approaching a
solution, with the research scientist
Student teachers incorporate their experiential learning from industry visit into teaching
Research Report No 1 to DSD on outcomes of Stage 2 and progress on Stage 3: Cohort 1 BtGP team 15
4. Stage 2: Industry Engagement Results: Cohort 1
4.1 Pre-service teacher surveys and focus group interviews conducted pre and post The pre-service teachers of secondary science were surveyed according to four dimensions before entering the industry experience. These were Confidence going into a STEM industry, Teaching and learning skills related to innovation in STEM, Views of STEM and STEM industries as well as Creativity and Problem-Solving in STEM.
The dimension of Confidence was selected as an indicator of student self-efficacy to engage with new and challenging environments within the STEM industry setting. It was also used as an indicator of how well prepared the student teachers were feeling going into the industry placement. It comprises 10 items.
Skills related to Teaching and learning were selected as an indicator of how well students were cognitively engaging with the processes of science teaching and learning such as science inquiry skills, science as a human endeavour and STEM applications to society. It comprises 13 items.
The dimension on Views of STEM Industries was selected as an indicator of the value that students placed on STEM-based industries and their relevance and importance both to society and their own science teaching. These views may help to formulate future orientations to learning science. It comprises 11 items.
Since creativity has often-times been viewed as the antithesis of scientific rigour (Mc William, Poronnik & Taylor, 2008), the dimension of Creativity in STEM was selected as an indicator of student understanding about creativity, creative Problem-Solving and innovation in STEM and STEM Industries. It comprises 12 items.
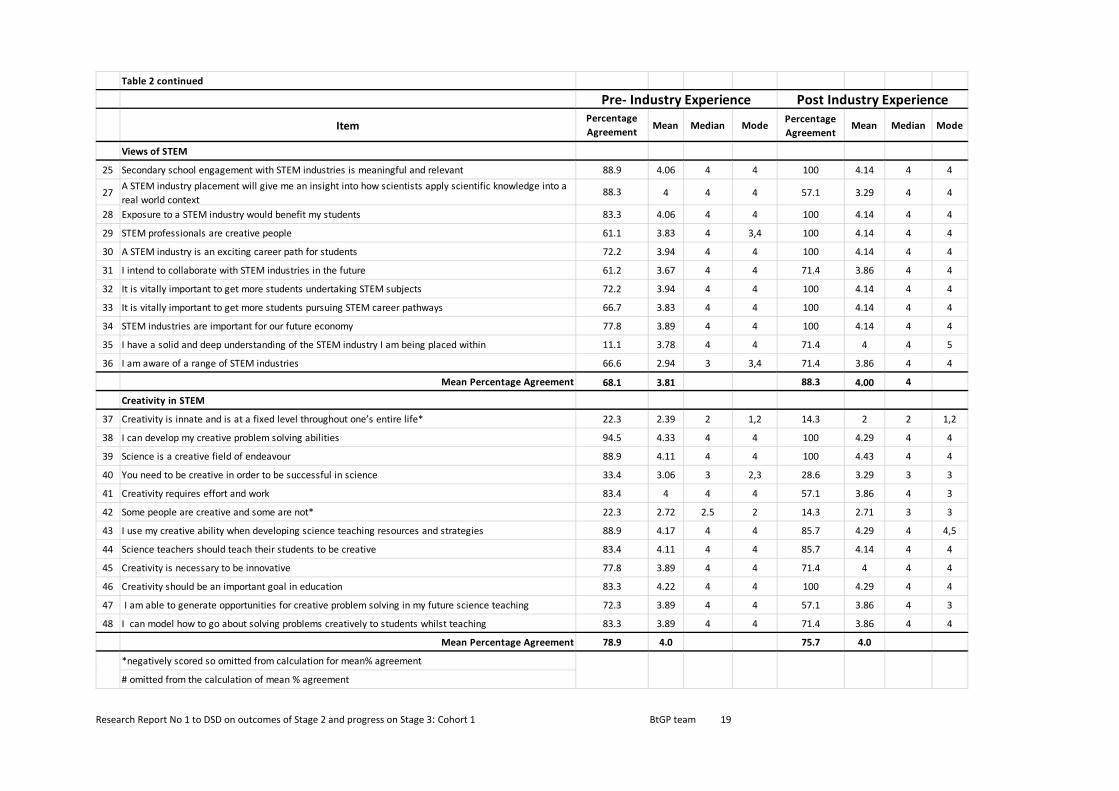
The percentage agreement for each of the items, pre and post the industry engagement together with the mean, median and mode for each item is given in Table 2. The percentage agreement comprised the percentage of strongly agree and agree categories combined.
Table 3 documents the percentage agreement, percentage not sure, the mean and the standard deviation. What follows is a discussion around each of the stated dimensions.
4.1.1 Confidence The data presented in Tables 2 and 3 would seem to indicate that student teachers felt more confident and prepared going into the industry experience than they had coming out of it. Apart from item 4, I feel confident to teach content from my science major to students at a range of secondary school levels, the percentage agreement had declined from pre to post. This is backed up by discussions in focus group interviews:
You’ve set us up really-well to understand what we are walking into and you have, to prepare us for the type of thinking we are going to have to do.
It’s exciting, it should be good. I feel very prepared.
Of particular interest are items 3 and 9, I feel confident to engage in scientific discussions with industry experts and I feel confident to make a contribution to the industry that I will be placed within, since in the pre-focus group interviews comments such as the following were heard:
Research Report No 1 to DSD on outcomes of Stage 2 and progress on Stage 3: Cohort 1 BtGP team 16
…but we, are all teachers, so we have, to be, people persons, we have, to talk, to them, draw stuff out of them that they are not ready to bring out. I see that as a challenge and that really excites me.
…you don’t have a long time to break the ice. It’s a four-hour stint then we go and problem-solve then we take it back.
I’m fairly, prepared, I’ll feel more prepared when I know what the problem is but, yes, I feel prepared.
The following comments were among those expressed in the post industry interview:
They were incredibly welcoming and initially I was really, nervous, walking into a big industry and how … can I fix your problem ….
The whole company, in general, was very streamlined... I thought we would be there for 3 hours desperately trying to find something to do but the whole time was planned out perfectly. They presented us with problems in every department we went to … but again we couldn’t help with a lot of them [problems].
4.1.2 Teaching and learning As with the dimension of Confidence, students were more cognitively enabled with skills and abilities in teaching and learning in the context of STEM going into the industry placement than in coming out. Importantly however, for the objectives of the project, the following four items all increased while a fifth remained the same, that being a 100 percent agreement both pre and post. These items were item 13, It is vitally important to teach science as a human endeavor; item 18, It’s important to understand how STEM industries operate in order to teach science, item 19, Adding real-world examples of STEM industry processes into science unit plans would be beneficial and item 22, I am well prepared to engage with ‘Science as a Human Endeavour’ in my future science teaching and lastly item 24, Science Inquiry skills are important in science teaching.
In consideration of particular items that had decreased from pre to post it is in perhaps important to highlight, with respect to the findings on confidence outlined above, that item 20 I have a solid and deep understanding of how my teaching major is applied in a real-world context also decreased. Consistent with this are items 16, I find it easy to use real-world STEM examples in my teaching and item 15, this placement will increase my ability to effectively teach science also having decreased from pre to post.
4.1.3 Views of STEM and STEM Industries The dimension with the biggest gains in student teachers self- reported perceptions from pre to post was that concerning Views of STEM industries. An increase in percentage agreement was observed for 10 of the 11 items from pre to post. Of note is the shift in item 35 I have a solid and deep understanding of the STEM industry I am being placed within with the largest gain of 60% increase. But the other items are equally important, these being items 25, 28, 29, 30, 31, 32, 33, 34 and 36 which are listed below:
Secondary school engagement with STEM industries is meaningful and relevant;
Exposure to a STEM industry would benefit my students;
STEM professionals are creative people;
Research Report No 1 to DSD on outcomes of Stage 2 and progress on Stage 3: Cohort 1 BtGP team 17
A STEM industry is an exciting career path for students;
I intend to collaborate with STEM industries in the future;
It is vitally important to get more students undertaking STEM subjects;
It is vitally important to get more students pursuing STEM career pathways;
STEM industries are important for our future economy; and
I am aware of a range of STEM industries.
4.1.4 Creativity in STEM Interpreting the percentage agreement pre and post is difficult to report in this dimension as some items require a negative response, these being items 37 and 42. Consequently one would hope to see a decrease in percentage agreement in these items. Of note are the positive increases in item 46 Creativity should be an important goal in education, in item 39 Science is a creative field of endeavour and importantly for learning and teaching, item 38 I can develop my creative problem-solving abilities.
4.2 Summarising the Differences in Mean Percentage Agreement Pre to Post The overall mean percentage agreement for each of the dimensions described above are represented pictorially in Figure 4.

Research Report No 1 to DSD on outcomes of Stage 2 and progress on Stage 3: Cohort 1 BtGP team 18
Table 2: Industry Experience Survey Results Pre (n=18), Post (n=7)
1= strongly disagree, 2, = disagree, 3 = not sure, 4= agree, 5= strongly agree
No Confidence
1 I feel confident going into the industry placement 3.72 4 3 42.9 3.43 3 3 2 I feel confident doing practical science activities with my students 3.94 4 4 71.4 3.86 4 4 3 I feel confident to engage in scientific discussions with industry experts 3.67 4 3,4 28.6 3.14 3 3 4 I feel confident to teach content from my science major to students at a range of secondary school levels 4 4 4 85.7 4.14 4 4 5 I feel confident to be innovative in creating new approaches to teaching in science 3.78 4 4 57.1 3.57 4 2,4,5 6 I feel confident in my level of science knowledge and understanding# 3.72 4 4 Missing 7 I feel confident to make science an engaging and meaningful subject for students 4.22 4 4 71.4 4 4 4 8 I feel confident to make STEM an attractive option for students 3.67 4 3 a 42.9 3.71 3 3 9 I feel confident to make a contribution to the industry that I will be placed within 3.61 3.5 3 28.6 3.29 3 3
10 I feel confident inquiring into phenomena and testing ideas within my field of expertise 4 4 3,4 57.1 3.86 4 3 Mean Percentage Agreement 3.85 54.0 3.67
Teaching and Learning 11 I model thinking and acting like a scientist with my students whilst teaching 3.72 4 4 66.7 3.83 4 4 12 I have the skills to enable school students to think and act like scientists 3.72 4 4 71.4 3.86 4 4 13 It is vitally important to teach science as a human endeavour 4.39 4 4 100 4.57 5 5 14 Entrepreneurship skills are vitally important in science teaching and learning 3.94 4 4 42.9 3.43 3 3 15 This placement will increase my ability to effectively teach science 4 4 4 42.9 3.14 3 2 16 I find it easy to use real-world STEM examples in my teaching 3.61 4 4 42.9 3.43 3 2,3,5 18 It’s important to understand how STEM industries operate in order to teach science 4 4 4 86.7 4.14 4 4 19 Adding real-world examples of STEM industry processes into science unit plans would be beneficial 4.22 4 4 100 4.57 5 5 20 I have a solid and deep understanding of how my teaching major is applied in a real-world context 2.83 3 3 42.9 2.86 3 5 22 I am well prepared to engage with ‘Science as a Human Endeavour’ in my future science teaching 3.5 3 3 71.4 4 4 5 23 I can develop innovative teaching resources in science 3.83 4 4 57.1 3.86 4 3 24 Science Inquiry skills are important in science teaching 4.5 4.5 4,5 100 4.57 5 5
Mean Percentage Agreement 3.86 68.7 3.9 # omitted from the calculation of mean % agreement
Table continues ….
100
94.4 77.8 77.8 55.5 83.4 94.4 72.3 44.4 72.2
Mode Mode Percentage Agreement
72.3
55.5 77.8 66.7 72.2 94.5 55.5 50
83.4 67.9
72.3
76.4
Pre- Industry Experience Post Industry Experience
72.2
Item Percentage Agreement Mean Median
55.5
Mean Median
Research Report No 1 to DSD on outcomes of Stage 2 and progress on Stage 3: Cohort 1 BtGP team 19
Table 2 continued
Item Mean Median Mode Percentage Agreement
Mean Median Mode
Views of STEM
25 Secondary school engagement with STEM industries is meaningful and relevant 4.06 4 4 100 4.14 4 4
27 A STEM industry placement will give me an insight into how scientists apply scientific knowledge into a real world context
4 4 4 57.1 3.29 4 4
28 Exposure to a STEM industry would benefit my students 4.06 4 4 100 4.14 4 4
29 STEM professionals are creative people 3.83 4 3,4 100 4.14 4 4
30 A STEM industry is an exciting career path for students 3.94 4 4 100 4.14 4 4
31 I intend to collaborate with STEM industries in the future 3.67 4 4 71.4 3.86 4 4
32 It is vitally important to get more students undertaking STEM subjects 3.94 4 4 100 4.14 4 4
33 It is vitally important to get more students pursuing STEM career pathways 3.83 4 4 100 4.14 4 4
34 STEM industries are important for our future economy 3.89 4 4 100 4.14 4 4
35 I have a solid and deep understanding of the STEM industry I am being placed within 3.78 4 4 71.4 4 4 5
36 I am aware of a range of STEM industries 2.94 3 3,4 71.4 3.86 4 4
Mean Percentage Agreement 3.81 88.3 4.00 4
Creativity in STEM
37 Creativity is innate and is at a fixed level throughout one’s entire life* 2.39 2 1,2 14.3 2 2 1,2
38 I can develop my creative problem solving abilities 4.33 4 4 100 4.29 4 4
39 Science is a creative field of endeavour 4.11 4 4 100 4.43 4 4
40 You need to be creative in order to be successful in science 3.06 3 2,3 28.6 3.29 3 3
41 Creativity requires effort and work 4 4 4 57.1 3.86 4 3
42 Some people are creative and some are not* 2.72 2.5 2 14.3 2.71 3 3
43 I use my creative ability when developing science teaching resources and strategies 4.17 4 4 85.7 4.29 4 4,5
44 Science teachers should teach their students to be creative 4.11 4 4 85.7 4.14 4 4
45 Creativity is necessary to be innovative 3.89 4 4 71.4 4 4 4
46 Creativity should be an important goal in education 4.22 4 4 100 4.29 4 4
47 I am able to generate opportunities for creative problem solving in my future science teaching 3.89 4 4 57.1 3.86 4 3
48 I can model how to go about solving problems creatively to students whilst teaching 3.89 4 4 71.4 3.86 4 4
Mean Percentage Agreement 4.0 75.7 4.0
*negatively scored so omitted from calculation for mean% agreement
# omitted from the calculation of mean % agreement
78.9
94.5
88.9
33.4
83.4
22.3
88.9
83.4
77.8
83.3
72.3
83.3
22.3
83.3
61.1
72.2
61.2
72.2
66.7
77.8
11.1
66.6
68.1
88.3
Pre- Industry Experience Post Industry ExperiencePercentage Agreement
88.9

Research Report No 1 to DSD on outcomes of Stage 2 and progress on Stage 3: Cohort 1 BtGP team 20
Table 3: Industry Survey Results Pre (n=18), Post (n=7) with Percentage Not Sure
No Percentage Agreement
Percentage Not sure
Mean of responses
Standard Deviation
Percentage Agreement
Percentage Not sure Mean Standard
Deviation Confidence
1 I feel confident going into the/another industry placement 55.5 38.9 3.72 0.895 42.9 42.9 3.43 0.976 2 I feel confident doing practical science activities with my students 72.2 27.8 3.94 0.725 71.4 14.3 3.86 1.069 3 I feel confident to engage in scientific discussions with industry experts 55.5 33.3 3.67 0.97 28.6 42.9 3.14 1.069 4 I feel confident to teach content from my science major to students at a range of secondary school levels 77.8 22.2 4 0.686 85.7 14.3 4.14 0.69 5 I feel confident to be innovative in creating new approaches to teaching in science 66.7 27.8 3.78 0.808 57.1 14.3 3.57 1.272 6 I feel confident in my level of science knowledge and understanding # 72.2 22.2 3.72 0.895 7 I feel confident to make science an engaging and meaningful subject for students 94.5 5.5 4.22 0.548 71.4 28.6 4 0.816 8 I feel confident to make STEM an attractive option for students 55.5 44.5 3.67 0.686 42.9 57.1 3.71 0.951 9 I feel confident to make a contribution to the industry that I will be placed within 50 44.4 3.61 0.85 28.6 57.1 3.29 0.951
10 I feel confident inquiring into phenomena and testing ideas within my field of expertise 83.4 16.6 4 0.594 57.1 42.9 3.86 0.9 Grand Mean 67.9 28.4 3.85 54.0 34.9 3.67
Teaching and Learning 11 I model thinking and acting like a scientist with my students whilst teaching 72.3 22.2 3.72 0.669 66.7 33.3 3.83 0.753 12 I have the skills to enable school students to think and act like scientists 72.3 22.2 3.72 0.669 71.4 28.6 3.86 0.69 13 It is vitally important to teach science as a human endeavour 94.4 5.6 4.39 0.608 100 - 4.57 0.535 14 Entrepreneurship skills are vitally important in science teaching and learning 77.8 22.2 3.94 0.639 42.9 42.9 3.43 0.976 15 This placement will/has increase(d) my ability to effectively teach science 77.8 22.2 4 0.686 42.9 14.3 3.14 1.215 16 I find it easy to use real-world STEM examples in my teaching 55.5 38.9 3.61 0.778 42.9 28.6 3.43 1.272 18 It’s important to understand how STEM industries operate in order to teach science 83.4 16.6 4 0.594 86.7 14.3 4.14 0.69 19 Adding real-world examples of STEM industry processes into science unit plans would be beneficial 94.4 5.6 4.22 0.548 100 - 4.57 0.535 20 I have a solid and deep understanding of how my teaching major is applied in a real-world context 72.2 27.8 3.87 0.548 42.9 14.3 2.86 1.574 22 I am well prepared to engage with ‘Science as a Human Endeavour’ in my future science teaching 44.4 50 3.5 0.786 71.4 14.3 4 1.155 23 I can develop innovative teaching resources in science 72.2 27.8 3.83 0.618 57.1 42.9 3.86 0.9 24 Science Inquiry skills are important in science teaching 100 - 4.5 0.514 100 - 4.57 0.535
Grand Mean 76.4 21.8 3.9 68.7 19.5 3.9 # Item omitted from calculation
Item Pre Industry Experience Post Industry Experience
Missing

Research Report No 1 to DSD on outcomes of Stage 2 and progress on Stage 3: Cohort 1 BtGP team 21
Table 3 continued
NosPercentage Agreement
Percentage Unsure
MeanStandard Deviation
Percentage Agreement
Percentage Unsure
MeanStandard Deviation
Views of STEM
25 Secondary school engagement with STEM industries is meaningful and relevant 88.9 11.1 4.06 0.539 100 - 4.14 0.378
27 A STEM industry placement will/has give(n) me an insight into how scientists apply scientific knowledge into a real world context
88.3 11.7 4 0.5 57.1 14.3 3.29 1.38
28 Exposure to a STEM industry would benefit my students 83.3 16.7 4.06 0.639 100 - 4.14 0.378
29 STEM professionals are creative people 61.1 38.9 3.83 0.786 100 - 4.14 0.378
30 A STEM industry is an exciting career path for students 72.2 27.8 3.94 0.725 100 - 4.14 0.378
31 I intend to collaborate with STEM industries in the future 61.2 38.8 3.67 0.594 71.4 28.6 3.86 0.69
32 It is vitally important to get more students undertaking STEM subjects 72.2 27.8 3.94 0.725 100 - 4.14 0.378
33 It is vitally important to get more students pursuing STEM career pathways 66.7 33.3 3.83 0.707 100 - 4.14 0.378
34 STEM industries are important for our future economy 77.8 22.2 3.89 0.583 100 - 4.14 0.378
35 I have a solid and deep understanding of the STEM industry I am being/completed placed/placement within 11.1 61.1 3.78 0.548 71.4 14.3 4 1.574
36 I am aware of a range of STEM industries 66.6 33.3 2.94 0.938 71.4 28.6 3.86 0.69
Grand Mean 68.1 29.3 3.8 88.3 7.8 4.00
Creativity in STEM
37 Creativity is innate and is at a fixed level throughout one’s entire life* 22.3 11.1 2.39 1.461 14.3 - 2 1.414
38 I can develop my creative problem solving abilities 94.5 5.5 4.33 0.594 100 - 4.29 0.488
39 Science is a creative field of endeavour 88.9 11.1 4.11 0.583 100 - 4.43 0.535
40 You need to be creative in order to be successful in science 33.4 33.3 3.06 0.938 28.6 57.1 3.29 0.951
41 Creativity requires effort and work 83.4 5.6 4 0.907 57.1 42.9 3.86 0.9
42 Some people are creative and some are not* 22.3 27.8 2.72 1.018 14.3 42.9 2.71 1.254
43 I use my creative ability when developing science teaching resources and strategies 88.9 11.1 4.17 0.618 85.7 14.3 4.29 0.756
44 Science teachers should teach their students to be creative 83.4 16.6 4.11 0.676 85.7 14.3 4.14 0.69
45 Creativity is necessary to be innovative 77.8 11.1 3.89 1.079 71.4 28.6 4 0.816
46 Creativity should be an important goal in education 83.3 16.7 4.22 0.732 100 - 4.29 0.488
47 I am able to generate opportunities for creative problem solving in my future science teaching 72.3 27.7 3.89 0.676 57.1 42.9 3.86 0.9
48 I can model how to go about solving problems creatively to students whilst teaching 83.3 16.7 3.89 0.676 71.4 14.3 3.86 1.069
Grand Mean 78.9 15.5 4.0 75.7 21.4 4.0
*negatively scored so omitted from calculation for mean% agreement
ItemPre Industry Experience Post Industry Experience

Research Report No 1 to DSD on outcomes of Stage 2 and progress on Stage 3: Cohort 1 BtGP team 22
Figure 4: Bar graph showing mean percentage agreement pre and post the industry experience for each of the four dimensions.
It can be seen from Figure 4 that the largest mean percent agreement of any of the dimensions listed either pre or post the industry engagement experience is that for post View of STEM.
4.3 The Size and Direction of the Difference Pre to Post Industry Engagement The direction and size of the mean differences in percentage agreement indicated graphically in Figure 4 are given in Table 4 and represented diagrammatically in Figure 5.
Table 4: Mean percentage agreement Pre to Post the Industry experience.
Dimension Pre Mean Percentage
Agreement
Post Mean Percentage
Agreement
Size of Difference
Creativity in STEM 78.9 75.7 -3.2 View of STEM 68.1 88.3 20.2 Teaching and Learning 76.4 68.7 -7.7 Confidence 67.9 54 -13.9
Figure 5: Direction and size of difference pre to post the industry engagement.
ConfidenceTeaching and
Learning
Views of STEM
Creativity in STEM
-20
-10
0
10
20
30
Perc
enta
ge c
hang
e in
mea
n ag
reem
ent
Percentage Change in Mean Agreement Pre to Post
Research Report No 1 to DSD on outcomes of Stage 2 and progress on Stage 3: Cohort 1 BtGP team 23
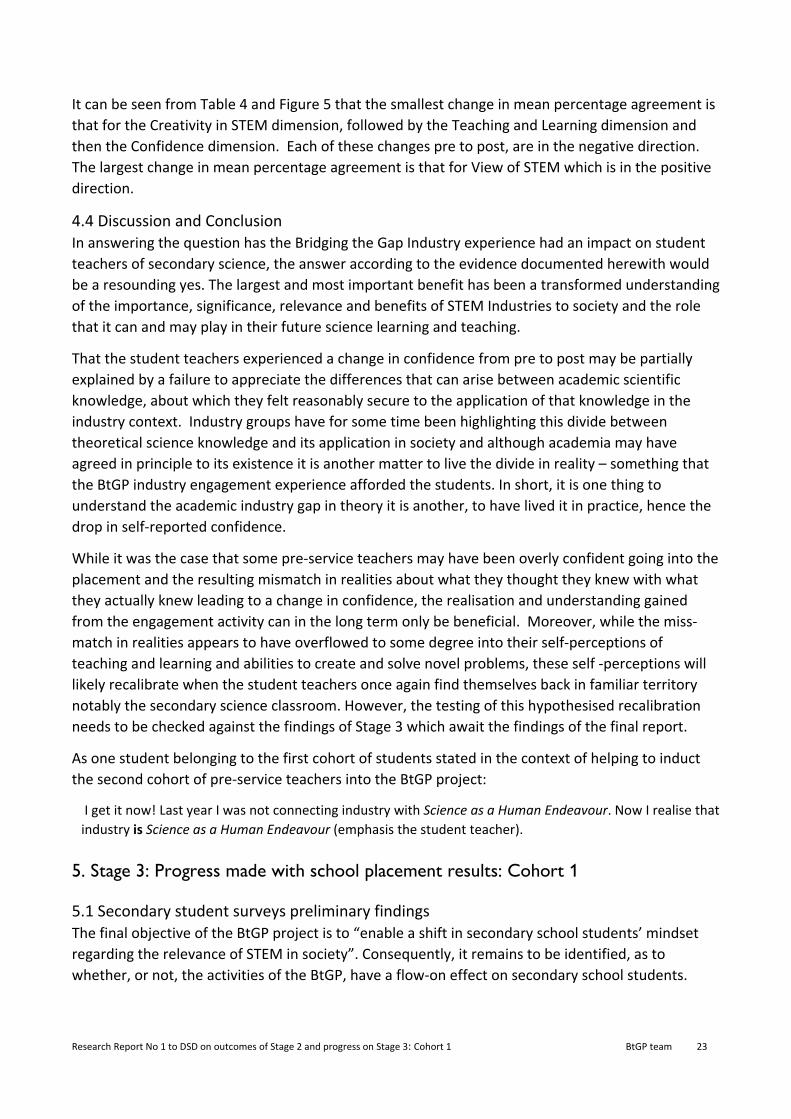
It can be seen from Table 4 and Figure 5 that the smallest change in mean percentage agreement is that for the Creativity in STEM dimension, followed by the Teaching and Learning dimension and then the Confidence dimension. Each of these changes pre to post, are in the negative direction. The largest change in mean percentage agreement is that for View of STEM which is in the positive direction.
4.4 Discussion and Conclusion In answering the question has the Bridging the Gap Industry experience had an impact on student teachers of secondary science, the answer according to the evidence documented herewith would be a resounding yes. The largest and most important benefit has been a transformed understanding of the importance, significance, relevance and benefits of STEM Industries to society and the role that it can and may play in their future science learning and teaching.
That the student teachers experienced a change in confidence from pre to post may be partially explained by a failure to appreciate the differences that can arise between academic scientific knowledge, about which they felt reasonably secure to the application of that knowledge in the industry context. Industry groups have for some time been highlighting this divide between theoretical science knowledge and its application in society and although academia may have agreed in principle to its existence it is another matter to live the divide in reality – something that the BtGP industry engagement experience afforded the students. In short, it is one thing to understand the academic industry gap in theory it is another, to have lived it in practice, hence the drop in self-reported confidence.
While it was the case that some pre-service teachers may have been overly confident going into the placement and the resulting mismatch in realities about what they thought they knew with what they actually knew leading to a change in confidence, the realisation and understanding gained from the engagement activity can in the long term only be beneficial. Moreover, while the miss-match in realities appears to have overflowed to some degree into their self-perceptions of teaching and learning and abilities to create and solve novel problems, these self -perceptions will likely recalibrate when the student teachers once again find themselves back in familiar territory notably the secondary science classroom. However, the testing of this hypothesised recalibration needs to be checked against the findings of Stage 3 which await the findings of the final report.
As one student belonging to the first cohort of students stated in the context of helping to induct the second cohort of pre-service teachers into the BtGP project:
I get it now! Last year I was not connecting industry with Science as a Human Endeavour. Now I realise that industry is Science as a Human Endeavour (emphasis the student teacher).
5. Stage 3: Progress made with school placement results: Cohort 1
5.1 Secondary student surveys preliminary findings The final objective of the BtGP project is to “enable a shift in secondary school students’ mindset regarding the relevance of STEM in society”. Consequently, it remains to be identified, as to whether, or not, the activities of the BtGP, have a flow-on effect on secondary school students.
Research Report No 1 to DSD on outcomes of Stage 2 and progress on Stage 3: Cohort 1 BtGP team 24
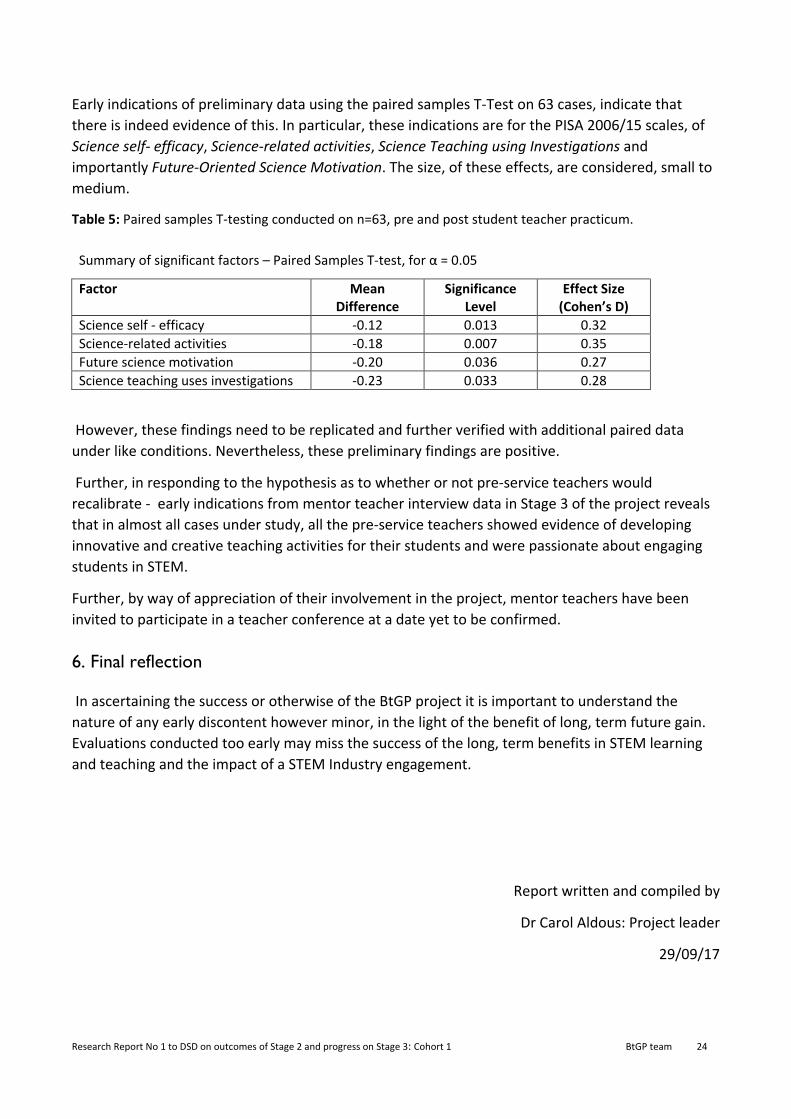
Early indications of preliminary data using the paired samples T-Test on 63 cases, indicate that there is indeed evidence of this. In particular, these indications are for the PISA 2006/15 scales, of Science self- efficacy, Science-related activities, Science Teaching using Investigations and importantly Future-Oriented Science Motivation. The size, of these effects, are considered, small to medium.
Table 5: Paired samples T-testing conducted on n=63, pre and post student teacher practicum.
Summary of significant factors – Paired Samples T-test, for α = 0.05
Factor Mean Difference
Significance Level
Effect Size (Cohen’s D)
Science self - efficacy -0.12 0.013 0.32 Science-related activities -0.18 0.007 0.35 Future science motivation -0.20 0.036 0.27 Science teaching uses investigations -0.23 0.033 0.28
However, these findings need to be replicated and further verified with additional paired data under like conditions. Nevertheless, these preliminary findings are positive.
Further, in responding to the hypothesis as to whether or not pre-service teachers would recalibrate - early indications from mentor teacher interview data in Stage 3 of the project reveals that in almost all cases under study, all the pre-service teachers showed evidence of developing innovative and creative teaching activities for their students and were passionate about engaging students in STEM.
Further, by way of appreciation of their involvement in the project, mentor teachers have been invited to participate in a teacher conference at a date yet to be confirmed.
6. Final reflection
In ascertaining the success or otherwise of the BtGP project it is important to understand the nature of any early discontent however minor, in the light of the benefit of long, term future gain. Evaluations conducted too early may miss the success of the long, term benefits in STEM learning and teaching and the impact of a STEM Industry engagement.
Report written and compiled by
Dr Carol Aldous: Project leader
29/09/17
Research Report No 1 to DSD on outcomes of Stage 2 and progress on Stage 3: Cohort 1 BtGP team 25
References
Cohen J. (1992) Quantitative methods in psychology: A power Primer Psychological Bulletin 112 (1) 155-159.
Mc William, E. Poronnik, P. &Taylor P. G (2008) Re-designing science pedagogy: Reversing the flight from science. Journal of Science Education and Technology, 17: 226-235.
Tytler, R. Symington, D., Smith, C. & Rodrigues, S. (2008) An innovation framework, based on best practice exemplars from the Australian School Innovation in Science, Technology and Mathematics (ASISTM) Project Department of Education, Employment and Workplace Relations, Canberra: Commonwealth of Australia.
Progress Report to DSD on Completion of Stage 1: Cohort 2 BtGP team 26
APPENDIX 1
PROGRESS REPORT ON THE COMPLETION OF STAGE 1: COHORT 2
31st May 2017 to 30 September 2017.
KPI: Consolidating the Management Group
The Management Committee for Cohort 2 of the Improving student interest in STEM through Preservice Teacher Industry Engagement: Bridging the Gap between knowledge creation and its application in industry and society (herein referred to as Bridging the Gap Project: BtGP) project has been expanded to include members of the practicum office, the university research office, the College of Science and Engineering and the University of Canberra. A meeting of the Management Committee was held on 31st May 2017.
A list of the committee members in attendance at the 31st May meeting is documented below.
• Professor Lindsey Conner • Professor Stella Vosniadou -Project Team • Associate Professor Simon Leonard University of Canberra – Project Team • Ben Samy - DSD • Sam Pearse - DECD • Jackie Thomson Director Professional Services (Practicum Office) • Dr Kirstin Ross - College of Science and Engineering • Amy Batchelor - New Venture Institute • Brodie Beales - Research Services Office • Dr Carol Aldous - Project Leader • Narmon Tulsi - Project Team • Aidan Cornelius- Bell Project Team • David Jeffries – Project Team
NB New members have been highlighted in bold.
A list of invited management group members not in attendance at the last meeting:
• Prof Martin Westwell – Science 21 • Ben Flink - New Venture Institute • Margaret Ledwith – New Venture Institute • Emma Handford – DECD • Jayne Heath – ASMS • Karla Pobke - ASMS
Progress Report to DSD on Completion of Stage 1: Cohort 2 BtGP team 27
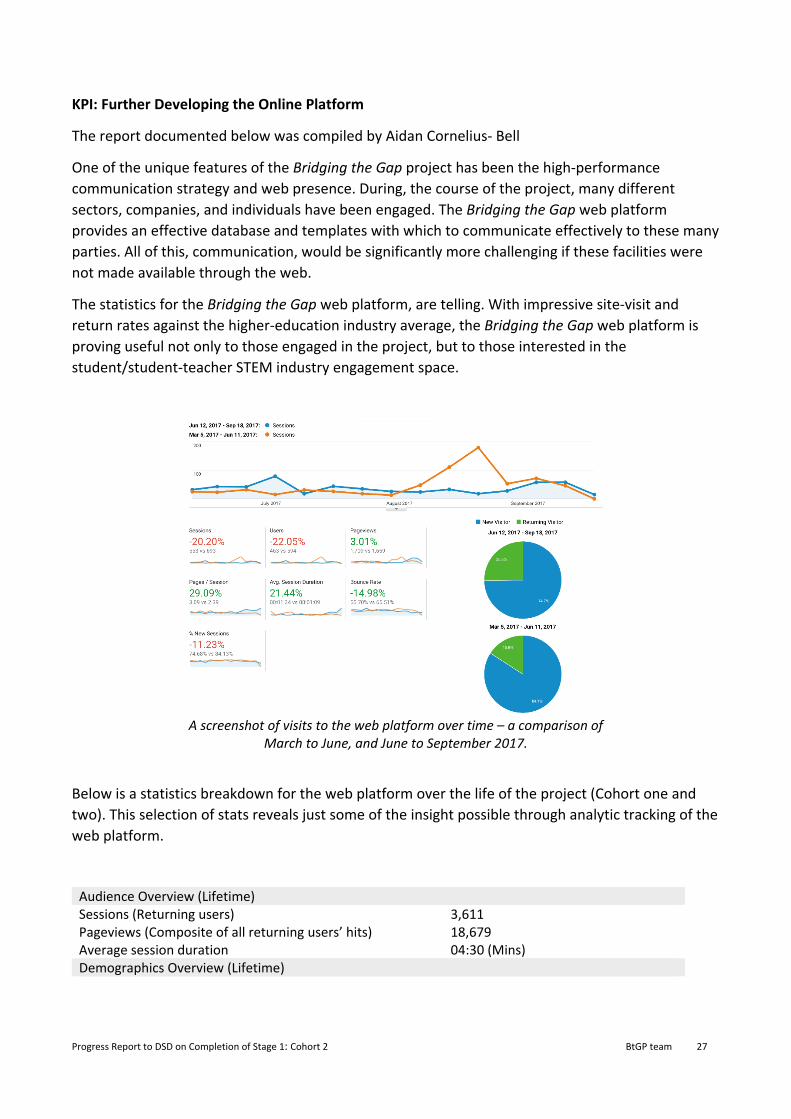
KPI: Further Developing the Online Platform
The report documented below was compiled by Aidan Cornelius- Bell
One of the unique features of the Bridging the Gap project has been the high-performance communication strategy and web presence. During, the course of the project, many different sectors, companies, and individuals have been engaged. The Bridging the Gap web platform provides an effective database and templates with which to communicate effectively to these many parties. All of this, communication, would be significantly more challenging if these facilities were not made available through the web.
The statistics for the Bridging the Gap web platform, are telling. With impressive site-visit and return rates against the higher-education industry average, the Bridging the Gap web platform is proving useful not only to those engaged in the project, but to those interested in the student/student-teacher STEM industry engagement space.
A screenshot of visits to the web platform over time – a comparison of March to June, and June to September 2017.
Below is a statistics breakdown for the web platform over the life of the project (Cohort one and two). This selection of stats reveals just some of the insight possible through analytic tracking of the web platform.
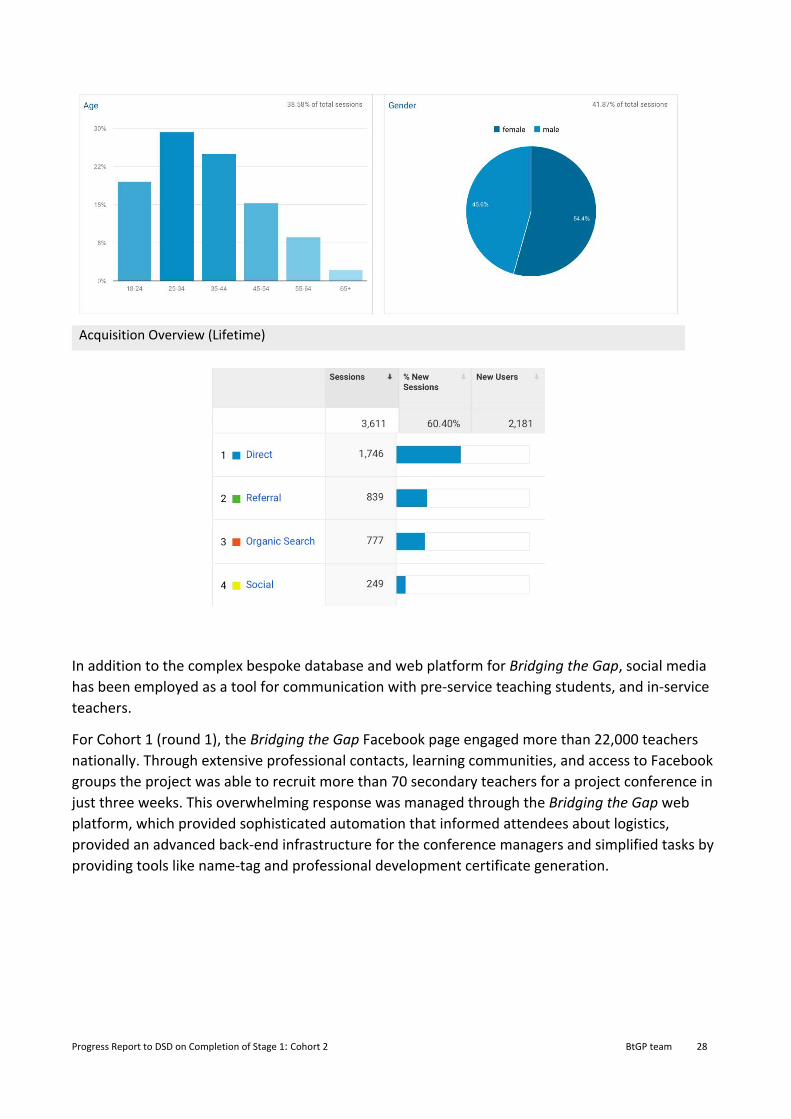
Audience Overview (Lifetime) Sessions (Returning users) 3,611 Pageviews (Composite of all returning users’ hits) 18,679 Average session duration 04:30 (Mins) Demographics Overview (Lifetime)
Progress Report to DSD on Completion of Stage 1: Cohort 2 BtGP team 28
Acquisition Overview (Lifetime)
In addition to the complex bespoke database and web platform for Bridging the Gap, social media has been employed as a tool for communication with pre-service teaching students, and in-service teachers.
For Cohort 1 (round 1), the Bridging the Gap Facebook page engaged more than 22,000 teachers nationally. Through extensive professional contacts, learning communities, and access to Facebook groups the project was able to recruit more than 70 secondary teachers for a project conference in just three weeks. This overwhelming response was managed through the Bridging the Gap web platform, which provided sophisticated automation that informed attendees about logistics, provided an advanced back-end infrastructure for the conference managers and simplified tasks by providing tools like name-tag and professional development certificate generation.
Progress Report to DSD on Completion of Stage 1: Cohort 2 BtGP team 29
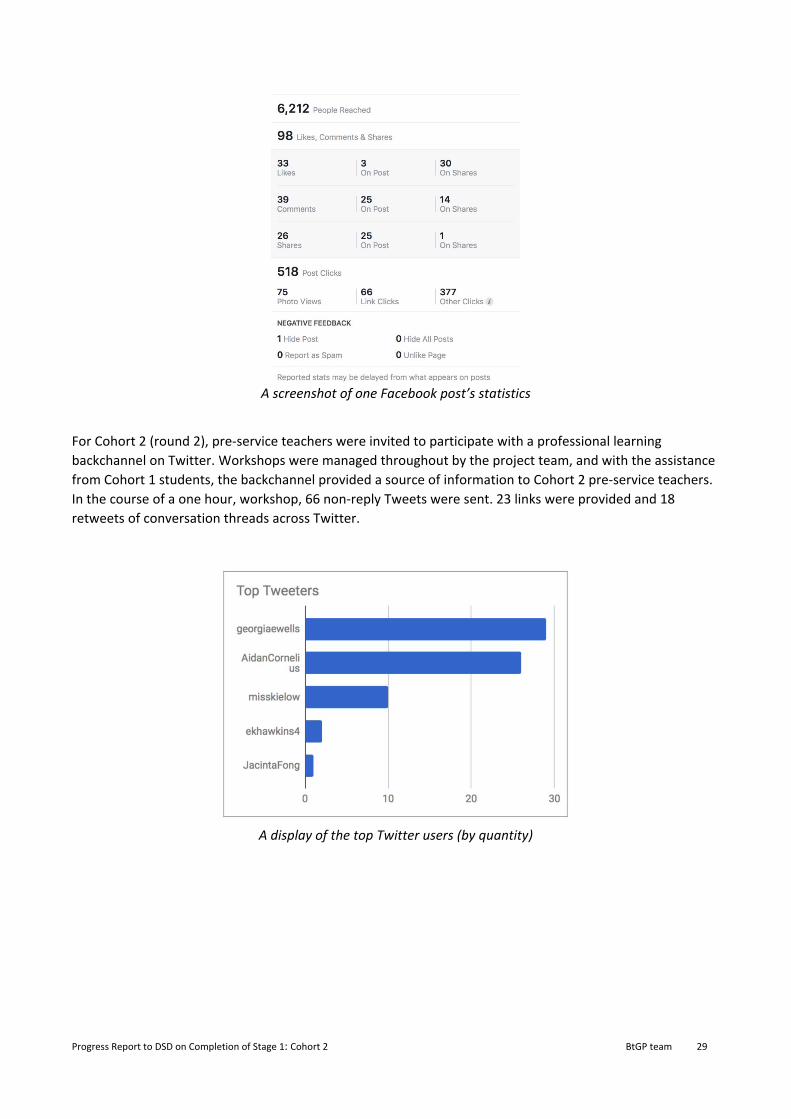
A screenshot of one Facebook post’s statistics
For Cohort 2 (round 2), pre-service teachers were invited to participate with a professional learning backchannel on Twitter. Workshops were managed throughout by the project team, and with the assistance from Cohort 1 students, the backchannel provided a source of information to Cohort 2 pre-service teachers. In the course of a one hour, workshop, 66 non-reply Tweets were sent. 23 links were provided and 18 retweets of conversation threads across Twitter.
A display of the top Twitter users (by quantity)


