77 Name: _____________________________________________ Class: ____________ Date: ____________ Exercise 10.1 Weather Conditions Within a Cyclone A visible satellite image of a cyclone over the central United States is shown above. The dashed line is the 0°C isotherm at the surface. Assume that the Colorado Cyclone occurred during the first week of March. 1. Place an L at the location of the low-pressure center. 2. Draw a line along the leading front to the southeast of the surface low-pressure center. 3. Draw station models that show wind direction, cloud cover, temperature and weather (use standard weather symbols) near the seven points labeled A through G on the image. For temperature, identify if the value is above (> 32) or below freezing (< 32). 4. Of the seven locations, which might be reporting snow?___________________________________________ 5. Of the seven locations, which might be reporting rain? ____________________________________________ 6. Of the seven locations, which might be reporting sleet or freezing rain? ______________________________ Copyright 2008 Kendall/Hunt Publishing Company
A visible satellite image of a cyclone over the central United States is shown above. The dashed line is the 0°Cisotherm at the surface. Assume that the Colorado Cyclone occurred during the first week of March.
1. Place an L at the location of the low-pressure center.
2. Draw a line along the leading front to the southeast of the surface low-pressure center.
3. Draw station models that show wind direction, cloud cover, temperature and weather (use standard weathersymbols) near the seven points labeled A through G on the image. For temperature, identify if the value isabove (> 32) or below freezing (< 32).
4. Of the seven locations, which might be reporting snow?___________________________________________
5. Of the seven locations, which might be reporting rain? ____________________________________________
6. Of the seven locations, which might be reporting sleet or freezing rain? ______________________________
Rauber et al_Severe Weather03E_PAK01_89183_EX10.pdf 4/29/08 1:45 PM Page 77
Copyright 2008 Kendall/Hunt Publishing Company
Rauber et al_Severe Weather03E_PAK01_89183_EX10.pdf 4/29/08 1:45 PM Page 78
Exercise 10.2 Jetstreaks, Troughs, and Surface Low-Pressure Centers
Four 300 mb maps covering a 36-hour period during which a strong cyclone developed and moved across theGreat Plains are shown below. On each map, place an “L” at the most likely position of the surface low-pressurecenter based on the position and orientation of the jetstream. Sketch a cold front and a warm front in a reasonableposition on each diagram.
Rauber et al_Severe Weather03E_PAK01_89183_EX10.pdf 4/29/08 1:45 PM Page 79
Copyright 2008 Kendall/Hunt Publishing Company
Rauber et al_Severe Weather03E_PAK01_89183_EX10.pdf 4/29/08 1:45 PM Page 80
The map to the left shows a typical cyclone on the Great Plains.
The soundings at the bottom of the page were taken at each of thesix points labeled A through F on the map. Write a letter in theblank on each of the soundings to indicate which sounding corre-sponds to each point A through F.
snow
Middle and High clouds
sleetfreezing rainrain
Rauber et al_Severe Weather03E_PAK01_89183_EX10.pdf 4/29/08 1:45 PM Page 81
Copyright 2008 Kendall/Hunt Publishing Company
Rauber et al_Severe Weather03E_PAK01_89183_EX10.pdf 4/29/08 1:45 PM Page 82
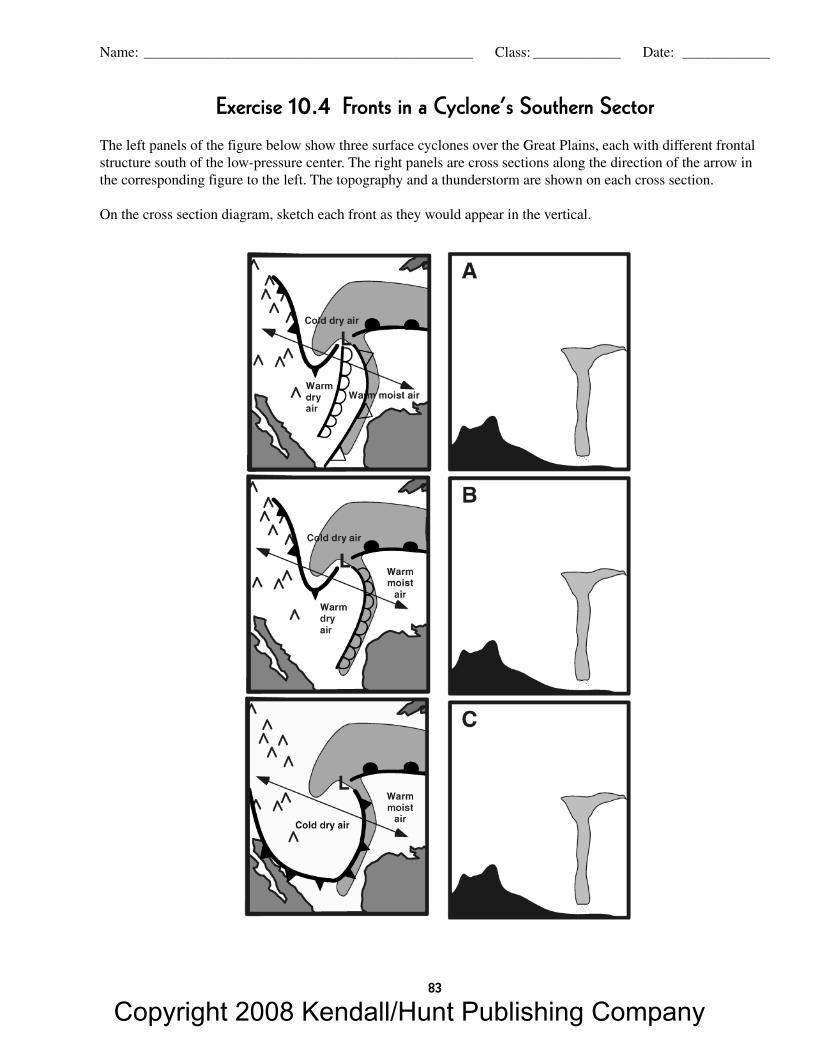
Exercise 10.4 Fronts in a Cyclone’s Southern Sector
The left panels of the figure below show three surface cyclones over the Great Plains, each with different frontalstructure south of the low-pressure center. The right panels are cross sections along the direction of the arrow inthe corresponding figure to the left. The topography and a thunderstorm are shown on each cross section.
On the cross section diagram, sketch each front as they would appear in the vertical.
Rauber et al_Severe Weather03E_PAK01_89183_EX10.pdf 4/29/08 1:45 PM Page 83
Copyright 2008 Kendall/Hunt Publishing Company
Rauber et al_Severe Weather03E_PAK01_89183_EX10.pdf 4/29/08 1:45 PM Page 84