Page 1
Heriot-Watt University Research Gateway
Heriot-Watt University
Experimental and DFT Approach on the Determination of Natural Gas Hydrate Equilibriumwith the use of Excess N2 and Choline-Chloride Ionic Liquid as an InhibitorTariq, Mohammad; Atilhan, Mert; Khraisheh, Majeda; Othman, Enas; Castier, Marcelo;García, Gregorio; Aparicio, Santiago; Tohidi Kalorazi, BahmanPublished in:Energy and Fuels
DOI:10.1021/acs.energyfuels.6b00117
Publication date:2016
Document VersionPeer reviewed version
Link to publication in Heriot-Watt University Research Portal
Citation for published version (APA):Tariq, M., Atilhan, M., Khraisheh, M., Othman, E., Castier, M., García, G., ... Tohidi Kalorazi, B. (2016).Experimental and DFT Approach on the Determination of Natural Gas Hydrate Equilibrium with the use ofExcess N2 and Choline-Chloride Ionic Liquid as an Inhibitor. Energy and Fuels, 30(4), 2821–2832. DOI:10.1021/acs.energyfuels.6b00117
General rightsCopyright and moral rights for the publications made accessible in the public portal are retained by the authors and/or other copyright ownersand it is a condition of accessing publications that users recognise and abide by the legal requirements associated with these rights.
If you believe that this document breaches copyright please contact us providing details, and we will remove access to the work immediatelyand investigate your claim.
Page 2
Download date: 10. Jun. 2018
Page 3
1
Experimental and DFT Approach on the Determination of Natural Gas Hydrate
Equilibrium with the use of Excess N2 and Choline-Chloride Ionic Liquid as an Inhibitor
Mohammad Tariq1ξ, Mert Atilhan1* and Majeda Khraisheh1*
Enas Othman2ξ and Marcelo Castier2*
Gregorio García3 and Santiago Aparicio3
Bahman Tohidi4
*Corresponding authors ([email protected] ; [email protected] ; [email protected] )
ξ
Equal contribution
1Department of Chemical Engineering, Qatar University
2Chemical Engineering Department, Texas A&M University at Qatar
3Department of Chemistry, University of Burgos, Spain
4Institute of Petroleum Engineering, Heriot Watt-University, United Kingdom
Abstract. This work presents characterization of hydrate forming conditions of a Qatari natural
gas type mixture, QNG-S1 obtained using two different experimental methods namely: a bench
top reactor and a gas hydrate autoclave (GHA). The obtained experimental results were found in
agreement to each other. Another mixture where the QNG-S1 sample was diluted with nitrogen
(N2) in a 1:1 ratio was also characterized for hydrate dissociation conditions using rocking cell
apparatus only. The thermodynamic hydrate inhibition effect of a biocompatible ionic liquid,
choline chloride (ChCl) has been tested for both QNG-S1 and QNG-S1+N2 at two concentrations
(1 and 5 wt%) using rocking cell apparatus. It has been found thatthe ChCl is showing a typical
classical thermodynamic inhibitor behavior for both the tested mixtures QNG-S1 and QNG-
S1+N2 by shifting the hydrate equilibrium towards lower temperature and higher pressure.
Likewise, the interaction between ChCl and model hydrate cages was analyzed using Density
Functional Theory for characterizing the ionic liquid inhibition mechanism at nanoscopic level.
Keywords: Gas hydrates, ionic liquids, inhibitors, DFT
Page 1 of 33
ACS Paragon Plus Environment
Energy & Fuels
123456789101112131415161718192021222324252627282930313233343536373839404142434445464748495051525354555657585960
Page 4
2
1. Introduction
Gas hydrates are ice-like crystalline structures where gas components such as methane, carbon
dioxide and ethane named as guest molecules are entrapped into the cavities formed by hydrogen
bonded network of water.1-3 Whenever a system of natural gas and water exists at specific
conditions of low temperature and high pressure, it is expected that hydrates will form. These
conditions often exist during gas processing thereby gas hydrates are serious problem for oil and
gas industry.4,5 The vast development in deep water activities carried out in many locations
globally including Qatar, flow assurance has become one of the critically important challenges in
overcoming hydrates problem.6 The formation of stable gas hydrates in the production and
transmission pipelines in oil and gas industries can cause operational and safety hazards, as well
as production and massive economical loss.7
Qatar holds the world's third-largest proven reserves of natural gas at 885 trillion cubic
feet. Because of its desert climate, gas hydrate formation may seem an unlikely event in Qatar.
However, its natural gas reservoirs are located 80 km offshore and the production of liquefied
natural gas (LNG) depends on reliable flow from offshore wellheads to onshore processing
facilities. Classical methods for inhibiting hydrate formation are used in order to prevent pipeline
plugging but changing gas concentrations and operating conditions make flow assurance
challenging in the North Field from both economically and processing perspectives.8
Generally, industries avoid hydrate formation by injecting thermodynamic inhibitors
(THIs), commonly methanol and mono-ethylene glycol, which create unfavorable conditions for
hydrate formation.6,9-11 However, due to the reported health, safety, and environmental concerns
that have been affiliated with the use of THIs, an alternative class known as low dosage hydrate
inhibitors (LDHIs) have been developed in the recent years and have been used in the field of
flow assurance and gas hydrate mitigation in both oil and gas pipelines.6,12,13 A new class of
novel environmentally friendly inhibitors, known as ionic liquids (ILs) have recently caught the
attention of researchers but still there are several critical issues which needs to be addressed for
their implementation as a promising solution for hydrate inhibition as discussed in a recent
review by Tariq et al.14 Most of the ILs tested so far for hydrate inhibition belongs to
imidazolium cation based family, which is known to be toxic.15 Thus, it is advisable to test ILs,
which are non-toxic and biodegradable for hydrate inhibition purposes. The tunable nature of ILs
allows us to design them as environmentally friendly compounds by carefully selecting the
Page 2 of 33
ACS Paragon Plus Environment
Energy & Fuels
123456789101112131415161718192021222324252627282930313233343536373839404142434445464748495051525354555657585960
Page 5
3
cation/anion combinations. In the current work, we have used one such compound known as 2-
hydroxy-N,N,N-trimethylethnnminium chloride, also known as choline chloride (ChCl), which
belongs to environmental benign and bio-compatible class of IL.15
Nitrogen rich gas mixtures are available in considerable amounts in many parts of the
world such as: California Great Valley (USA), the Volga-Ural basin (Russia), the Yinggehai
basin (China), the Central European basin (Northern Germany and Western Poland) and many
more.16 These nitrogen rich natural gases contain N2 in approx. 10 – 85 vol% concentrations.
These mixtures are being used either as pipeline quality fuel by upgrading them through N2
removal or used directly as low quality fuel or an additive in certain amount to the high CH4 gas
network.17
It is interesting to note that in a recent work, Obanijesu et al.18 reported that the presence
of N2 and/or H2 in specific conditions act as hydrate inhibitor for natural gas in pipelines.
Although N2 is a hydrate former itself but the pressure and temperature (P,T) conditions required
for hydrate formation are relatively high (in the temperature range of -1 to 13.2 °C for 144 to
554.2 bars pressure region) compared to hydrocarbons.19 The idea is very interesting given the
fact that nitrogen is relatively economical and requires less sophisticated infrastructure as
compared to flammable chemical inhibitors like methanol. This study encourages us also to test
the reported theory by measuring the hydrate forming conditions in a natural gas sample, which
is rich in nitrogen and its comparison to undiluted sample. Effect of ChCl inhibitor on both the
samples was also observed.
Thus the objectives of this work are manifold: (i) It presents the investigation on the
hydrate formation/dissociation conditions in a synthetic multi-component gas mixture whose
composition is typical of a Qatari natural gas (Table 1) and another sample mixture diluted to
half of its composition with N2 referred as QNG-S1 and QNG-S1+N2, respectively. (ii) ChCl
ionic liquid at two percentages (1 wt% and 5 wt%) was tested for its hydrate inhibition efficiency
for both the gas mixtures (QNG-S1 and QNG-S1+N2) using rocking cell apparatus. (iii)
Moreover, to unravel the mechanism of hydrate formation, dissociation and inhibition in both
QNG-S1 and QNG-S1+N2 systems the borescope camera images installed in gas hydrate
autoclave have been used and (iv) The characterization of the effect of ChCl on hydrates
structure is analyzed at nanoscopic level using Density Functional Theory (DFT). Thus, this
study will complete the first detailed characterization of hydrate forming conditions for Qatari
Page 3 of 33
ACS Paragon Plus Environment
Energy & Fuels
123456789101112131415161718192021222324252627282930313233343536373839404142434445464748495051525354555657585960
Page 6
4
natural gas type mixture, its nitrogen rich version, gas hydrate inhibition performance of a
biocompatible ionic liquid and possibility of N2 in acting as hydrate inhibitor.
2. Experimental and theoretical methods
2.1. Materials. The sample of synthetic Qatar Natural Gas type mixture (QNG-S1) was procured
from Quality Specialty Gases, Qatar with a stated mixtures composition accuracy of ±2%.
Details about the various components and their relative uncertainty are furnished in Table 1.
Nitrogen was purchased from Buzware Scientific and Technical Gases, Qatar, with a stated
purity of 99.9%. Choline Chloride with a stated purity of ≥99% has been purchased from Iolitec.
Throughout the experiments Millipore Quality water has been used for making solutions. All the
IL inhibitor solutions were prepared by weighing on an electronic balance with a precision of
±0.00001 g.
Scheme 1: Structure of (2-hydroxyethyl)trimethylammonium chloride or Choline Chloride
(ChCl).
2.2. Experimental methods. Micro bench top reactor (Parr, USA), gas hydrate autoclave and
rocking cell apparatuses (both from PSL Systemtechnik, Germany)have been calibrated using
grade methane and ultra-pure-grade carbon dioxide gases with known HLVE data to check their
performances and validation. Then, QNG-S1mixture was tested alone and in presence of various
concentration of hydrate inhibitor to obtain HLVE data. Isochoric pressure search method22 has
been used to get the hydrate liquid-vapor equilibrium data in all the apparatuses.
2.2.1. Micro bench top reactor. The high pressure Parr reactor with an internal volume of 600 ml
was modified for the experiments by adding a whisk like stirrer and removal of internal cooling
coil and dip tube. The reactor was filled with 180 ml water and the headspace of the reactor was
then purged with a gas composition employed to form gas hydrates. The reactor was sealed and
pressurized to the desired pressure with the gas mixture. The pressure of the reactor was
maintained and the contents mixed with a high rate of stirring for 2 hours. The reactor was
Page 4 of 33
ACS Paragon Plus Environment
Energy & Fuels
123456789101112131415161718192021222324252627282930313233343536373839404142434445464748495051525354555657585960
Page 7
5
placed in a cooling bath set to 20 °C. After this equilibration stage, the reactor was re-pressurized
to the same pressure, sealed completely, and the stirring rate reduced. The automated computer
interface was enabled, and the data logger was set to collect temperature, pressure and torque
measurements every 2 seconds. The temperature of the reactor was held at 20 °C for an
additional hour. The automated chiller program was then initiated to cool the reactor down to 2
°C. The reactor was held at the final temperature of 2°C, for 24 hours. The reactor was the
warmed back to 20 °C (at a rate of 0.1°C per minute) and maintained there for few hours.
2.2.2. Gas hydrate autoclave. The high-pressure autoclave cell (PSL Systemtechnik, Germany)
having a total volume of 400 ml can withstand pressure upto 200 bars. Autoclave lid and all
mounted head connections such as borescope-camera, temperature/pressure sensors and
inlet/outlet gas valves were detached from the vessel after discharging any internal pressure via
opening the gas release valve. The magnet housing of the autoclave was washed carefully several
times from inside with distilled water and filled with 135 ml of the aqueous solution to be
studied (i.e., water with/without inhibitors). Lid thread was also cleaned from foreign particles
and well-greased with the lubricant. Then the magnet housing was sealed properly through
mounting the head connections and carefully closing the lid by hand. The aqueous content within
the vessel was flushed twice by purging it with the tested gas up to the full bottle pressure to
ensure that the vessel didn’t have any gas impurities. The vessel was charged with the tested
sample of QNG up to 60 bar (bottle maximum pressure) and in order to reach the desired/started
pressure the system was connected to a high pressure generator, which is a manually operated
piston screw pump used to compress the tested gas within a small volume to develop high
pressure (i.e., up to 650 bar). Temperature/pressure conditions within the cell were monitored via
display of Hydrate software until they were stabilized. Hydrate software main window was
opened to design the whole experimental protocol. The script was edited depending on
isothermal cooling method according to following steps (a) initialization phase of the experiment
was started to adjust autoclave temperature to 20 °C (start temperature) and to make an overall
check for experiment - mainly cell leakage. This was completed with fast stirring (500 rpm) in
order to equilibrate and saturate liquid/gas mixture. (b) The experimental phase of the
experiment was then started by cooling the fluid inside the vessel rapidly with rate (1.8 °C/hr)
from 20oC to 2°C with agitation (150 rpm), then the system was left for two days (48 hours) at
Page 5 of 33
ACS Paragon Plus Environment
Energy & Fuels
123456789101112131415161718192021222324252627282930313233343536373839404142434445464748495051525354555657585960
Page 8
6
2°C to form hydrate. By the time hydrates were formed, stirrer was stopped, as it plugged the
cell. In autoclave, gas mixture took longer time to form hydrate plug, this is mainly due to its
large volume 400 ml compared to bench top reactor 100 ml. (c) After hydrate was formed,
heating process was started back to the initial temperature with tremendously slow rate (0.18 °C/hr) for complete hydrate melting. Step-wise heating method was used during the hydrate
dissociation period and 12 hours of intermission has been given at every 12 hours for the
experiments. This makes approximately heating rate of 1.44 °C per day. However, in a recent
work, Semenov et al.20 have reported that up to a certain range (0.5 K/hr) heating rate does not
affect the determination of equilibrium dissociation point of methane and argon hydrates using
the rocking cell assembly. We have provided some P-T loops (Fig. 2 of Supporting Information)
showing the absence of any metastability issue using the aforementioned heating rate. While the
script is running, pressure, temperature and time can be monitored in the main window of data
acquiring software.
2.2.3. Rocking Cell assembly. The rocking rig assembly (PSL Systemtechnik, Germany),
Figures 1 and 2, used in this study contains five test cells. This means that five runs can be
performed simultaneously. However, the only variables possible, for these simultaneous runs,
can be the composition of the sample and pressure. To start a fresh experiment the test cell was
removed from its platform axis after it was depressurized and the temperature sensor and
pressure supply tube were disconnected. Then it was mounted on the assembling aid and the
screw lid was opened with a jaw wrench. The ball casing of the test cell and the mixing ball were
washed carefully for several times with distilled water, ethanol and dried then filled with the
prepared test mixture (i.e., ultrapure water and inhibitors) according to the experimental
requirement. Then the test cell was sealed properly in the same way it was opened, reinstalled to
its corresponding place on the platform axis in RC5 bath, and reconnected to the temperature
sensor and pressure supply. The test procedure with this experimental set-up was started with
filling each cell (with maximum volume of 40 cm3) with 15 ml of ultrapure water, then
pressurized it directly with the sample gas QNG-S1 to the target pressure, as desired by each set
of the experiments.
Page 6 of 33
ACS Paragon Plus Environment
Energy & Fuels
123456789101112131415161718192021222324252627282930313233343536373839404142434445464748495051525354555657585960
Page 9
7
Figure 1. A typical opened up rocking rig assembly test cell after detachment from the
mounting.
Each test cell with its aqueous content was flushed, filled with tested sample of QNG-S1
and pressurized up to the desired/started pressure following the same manner applied in high
pressure autoclave vessel. After temperature/pressure conditions within the each test cell were
stabilized, RC-5 software was started to design the whole experimental protocol. The script was
edited depending on isothermal cooling method following the same initialization and
experimental phases applied in autoclave except the hold time required forming hydrate plug and
the way of creating turbulence and agitation. Liquid vapor mixture within each cell was left for
24 hour at 2 °C after it was cooled from 20 °C, half the time required for the same mixture within
autoclave. This is mainly due to its small volume (40 ml) compared to autoclave (400 ml).
Moreover the mixing module was programmed according to the following parameter: Rocking
rate: 10 rocks/ min, Rocking angle: 30o. While the script is running, pressure, temperature and
time data can be monitored in RC-5 main window. Further details on rocking cell assembly can
be found elsewhere.23-25
Page 7 of 33
ACS Paragon Plus Environment
Energy & Fuels
123456789101112131415161718192021222324252627282930313233343536373839404142434445464748495051525354555657585960
Page 10
8
Figure 2. Schematic diagram of the rocking cell (RC-5) assembly.
2.2.4. Preparation of diluted sample of Qatar Natural Gas type mixture with N2. The nitrogen
mixing was carried out both in autoclave and rocking cell apparatuses. In order to do so, first the
cells of both autoclave and RC-5 were filled with the QNG-S1 mixture up to the maximum bottle
pressure (60 bars). Later both the apparatuses were connected to a high pressure nitrogen
cylinder having a pressure of 200 bars. Using the high pressure regulator the nitrogen was
released into the cells until the pressure within each cell of autoclave and RC-5 reached to 120
bars. The mixture was the mixed properly with stirring and the new composition calculated using
the precise pressure and temperature readings from the software windows.
2.3. Theoretical methods. Theoretical study through DFT simulations on the interaction
mechanism between ChCl IL and hydrate cages is divided in two sections: i) analysis of isolated
IL-hydrate cage systems and ii) analysis of the interactions between one ionic pair and small
hydrate clusters. As starting point, DFT simulations were focussed on 512 and 51262 water cages
(with single occupancy), with methane (CH4) was selected as guest molecule. Then, system
composed by one isolated molecule (i.e., choline cation, chloride anion and CH4), ChCl ionic
liquid, both host-guest systems (CH4@512 and CH4@51262) as well as IL-CH4@512 and IL-
CH4@51262 systems were optimized. For IL-hydrate systems, different relative dispositions
Page 8 of 33
ACS Paragon Plus Environment
Energy & Fuels
123456789101112131415161718192021222324252627282930313233343536373839404142434445464748495051525354555657585960
Page 11
9
between the ionic liquid and the hydrate were essayed as starting points for the optimizations,
focusing our attention on the dispositions of minimal energy. Optimized minima were checked
through their vibrational frequencies. In addition, empty 512 and 51262 water cages were also
optimized.
Previous results dealing with DFT simulations on hydrate systems showed the need of
including dispersion terms in the selected functional for obtaining reliable results.26,27 The
importance of including dispersion corrections in the applied functional for a correct description
of host-guest interactions was previously reported.28 In a previous work, the interaction energies
were calculated using B97D functional,29 which led to reliable results for hydrates systems,30,31
with no remarkable errors regarding to MP2 calculations.28 It is also well known that a
remarkable accuracy has been achieved by hybrid functional.32 On the other hand, ωB97X has
shown improved accuracy in thermochemistry, kinetic and non covalent interactions than
common (hybrid) density functional.33 This functional could be defined as the long range
corrected (LC) version of B97 functional, which contains a small fraction of the short range HF
exchange, as well as long range corrections. Hence, in this work, all optimizations were done at
ωB97XD/6-311+G(d,p) theoretical level. ωB97XD functional is a re-optimization of ωB97X
functional to include dispersion correction according to D2-approach, with satisfactory accuracy
for non-covalent interactions.34 In our opinion, ωB97XD would be an adequate functional to
describe both host-guest interactions as well as IL-hydrate ones. Energies computed in this first
approximation were corrected according to counterpoise method to avoid basis set superposition
error.35 All these calculation were carried out using Gaussian 09 (Revision D.01) package.36
In a second approximation, systems composed by one ionic pair + hydrate clusters were
studied. For this purpose, a small cluster of 218 atoms taken from the crystal structure was
selected as hydrate model. Firstly, we selected a DFT method (together with the basis set) able to
carry out the required simulations with a moderate computational cost. After several attempts
over the model cluster, geometry optimization carried out a PBE/DZP37 theoretical level as
implemented in SIESTA 3.2 package38 provided the best compromise between optimized
structures (in comparison with experimental ones) and computational cost. Then, systems
composed by one ionic pair and the hydrate cluster were optimized at this level. For IL-cluster
systems, different relative disposition between the ionic liquid and the hydrate cluster were used
as starting points for the optimizations, which were obtained placing the IL over different regions
Page 9 of 33
ACS Paragon Plus Environment
Energy & Fuels
123456789101112131415161718192021222324252627282930313233343536373839404142434445464748495051525354555657585960
Page 12
10
of the model cluster. Based on the optimized structures (some of them led to the same optimized
structure), single point calculations were performed at ωB97X-D3/6-311+G(d,p)39 theoretical
level as implemented in ORCA package,40 and molecular properties computed at this level were
used for the discussion.
3. Results and Discussion
3.1. QNG-S1 gas hydrate phase characterization. It can be inferred from Table 1 that the
synthetic mixture of QNG-S1 is a complex one containing several hydrate promoters and
inhibitors. The mixture is rich in methane up to 85% (in moles) with presence of many other
hydrate formers such as CO2, C2H6, C3H8 and N2 where these individual components’s hydrate
forming conditions differ from each other. Gas compositions were checked with GCMS for the
the uncertainties and are in agreement with the ones provided by the vendor. It is expected that
there will be formation of several/complex crystals in the system given the fact that the
components differ in size and nucleation conditions also differ for individual component.
Hydrate simulator software HydraFLASH21 predicts that the QNG-S1 mixture will form type II
hydrates that assert the previous assumption. Moreover, the borescope camera images are also
indicative of this phenomenon (Section 3.5). Reproducibility of the measurements has been
conducted for the validation of the measurement points. Methane + water system has been
measured repeatedly by using all the above-mentioned apparatus and no significant effect has
been observed. Moreover, the values of hydrate dissociation points obtained for methane agree
well with the values reported in the literature, which validate the apparatus for this study (Fig. 1
Supporting Information).
Table 1 shows the relative uncertainties in various components, which will directly affect
the global composition of the QNG-S1. These large uncertainties were reflected in the
experimentally obtained values using different apparatuses. It must be stressed here that the
prime objective of this work is to provide the evidence of hydrate formation in the complex gas
mixture of QNG-S1 which has never been reported before. The strategy to mitigate the QNG-S1
hydrates using ChCl and/or N2 dilution is another important aspect of this work.
Page 10 of 33
ACS Paragon Plus Environment
Energy & Fuels
123456789101112131415161718192021222324252627282930313233343536373839404142434445464748495051525354555657585960
Page 13
11
Table 1. Composition of Qatari Natural Gas type mixture (QNG-S1) and relative uncertainties as claimed by the
suppliers.
Component Composition in mol % methane 0.84990 ethane 0.05529
propane 0.02008 iso-butane 0.00401 n-butane 0.00585
iso-pentane 0.00169 n pentane 0.00147 n octane 0.00152 toluene 0.00090
methyl cyclopentane 0.00102 nitrogen 0.03496
carbon dioxide 0.02331 * Relative uncertainty for samples: CH4 0.2%, C2 to C4 2.0%, C5 plus higher 5%, N2 and CO2 2%.
For the dilution experiments (next section) N2 was mixed to the current sample and
composition was calculated. The new composition of the QNG-S1 mixture after nitrogen mixing
becomes almost equimolar. Such that the mixture is diluted to almost half of its composition and
becomes nitrogen rich (0.5QNG-S1:0.5QNG-S1+N2). It should be emphasized here that N2 also
forms the hydrates but at much extreme (P, T) conditions compared to other hydrate forming
components found in the QNG-S1 mixture used in this study.19
40
60
80
100
120
16 18 20 22 24
P/bar
T/oC
BTR
GHA
Page 11 of 33
ACS Paragon Plus Environment
Energy & Fuels
123456789101112131415161718192021222324252627282930313233343536373839404142434445464748495051525354555657585960
Page 14
12
Figure 3. Hydrate vapour-liquid equilibrium curve for Type I Qatari Natural Gas (QNG-S1). Points are
experimental data measured from bench top reactor (BTR) and gas hydrate autoclave (GHA). Solid line is guide to
the eye.
Figure 3 presents the results of hydrate vapour-liquid equilibrium points of QNG-S1
mixture extracted from the P-T loops obtained from two different experimental apparatuses (Fig
2 Supporting Information). It is evident that although, the results depicted are not in excellent
agreement of each other. however, the disagreement between the two experimental apparatuses
values is easy to understand since the bench top reactor has poor temperature precision and there
are large uncertainties (±2.2 °C) associated with the thermocouple. QNG-S1 contains almost
~85% methane however compared to methane it is easier to form hydrates in QNG-S1 because
of the presence of high molecular weight components in the mixture. This whole scenario
suggests that one has to be careful in handling and measurements while dealing with such a
complex mixture. Nevertheless, this whole practice proves that QNG-S1 is capable of forming
hydrates. Useful data have been collected which might be valuable for the Qatar oil and gas
industries to design their flow assurance strategies.
3.2. Choline Chloride as QNG-S1 hydrate inhibitor. It is evident that the choline chloride
(Scheme 1) is an ionic liquid from ammonium family, having a structure similar to
tetraalkylammonium salts but an additional –OH functional group attached to it. It is showing
typical thermodynamic inhibitors characteristics by shifting the hydrate equilibria towards higher
pressures and lower temperatures (Figure 4). However, it seems that at higher pressures the
effectiveness of 1 wt% ChCl is not as much as at lower pressures. It is also obvious that 5 wt%
ChCl is more effective compared to 1 wt% ChCl. The presence of –OH group is very important
in order to make hydrogen bonds with ‘free water’ and shifts the thermodynamic equilibrium
through preferential hydrogen bonding.41,42 These results are encouraging since choline based
ILs are mostly biocompatible thus falls into the category of green inhibitors. Although, the
inhibition effect is not as great as the conventional ones yet the results pave a way to design more
biocompatible ionic liquids which can more strongly participate in hydrogen bonded network of
water thereby with enhanced hydrate inhibition effectiveness.43-45
Page 12 of 33
ACS Paragon Plus Environment
Energy & Fuels
123456789101112131415161718192021222324252627282930313233343536373839404142434445464748495051525354555657585960
Page 15
13
Table 2: Experimentally obtained Hydrate dissociation conditions for Qatari Natural Gas (QNG)
in absence and presence of ChCl ionic liquid and (ChCl+N2) as inhibitors.
QNGa QNG + 1 wt% ChCl
c QNG + 5 wt% ChCl
c
T/ °C P/bar T/
°C P/bar T/
°C P/bar
19.97 89.82 19.00 78.88 19.6 93.76
18.77 70.26 18.00 65.97 18.51 77.73
17.78 57.23 17.00 55.84 16.51 59.62
16.58 47.81 16.00 48.32
21.07b 92.69 b
21.86 b 102.97b
QNG + 1 wt% ChCl+ N2c QNG + 5 wt% ChCl+ N2
c QNG-S1+ N2
c
12.64 55.69 13.94 77.56 13.06 59.61
13.77 63.41 16.00 102.96 15.45 82.23
14.61 72.09 16.86 121.61 16.43 98.86
17.57 116.46
aData obtained using Gas Hydrate Autoclave; bData obtained using bench top reactor; cData
obtained using rocking cell apparatus.
Page 13 of 33
ACS Paragon Plus Environment
Energy & Fuels
123456789101112131415161718192021222324252627282930313233343536373839404142434445464748495051525354555657585960
Page 16
14
Figure 4. Experimental hydrate vapor-liquid equilibrium curve for Type I Qatari Natural Gas
(QNG-S1)obtained using gas hydrate autoclave compared to the curves in presence of 1 and 5
wt% choline chloride obtained using rocking-cell apparatus.
3.3. Choline Chloride as hydrate inhibitor for diluted QNG-S1. As discussed earlier the
N2 has been mixed into the system containing QNG-S1 to form an equimolar N2 diluted QNG-S1
mixture, QNG-S1+N2. The mixture was characterized for hydrate dissociating conditions using
RC-5 assembly followed by ChCl testing as hydrate inhibitors on this mixture as done previously
for QNG-S1. Figure 5 shows the hydrate dissociation curves for QNG-S1, QNG-S1+N2 alone
and also in presence of 1 and 5 wt% ChCl. It can be immediately inferred from the plots that this
mixture will form hydrates but at relatively high pressures since it is diluted with N2, which does
form hydrates but at much extreme conditions as stated earlier. The shifting results for the
mixture in presence of ChCl are a bit different compared to undiluted QNG-S1. Almost no
inhibition effect for 1 wt% ChCl and there is a typical thermodynamic effect for 5 wt% ChCl has
been observed. We will further analyze the data in next section to understand the probable cause
of these trends.
40
60
80
100
15 16 17 18 19 20 21
P/bar
T/oC
QNG-S1
1wt%ChCl
5wt%ChCl
Page 14 of 33
ACS Paragon Plus Environment
Energy & Fuels
123456789101112131415161718192021222324252627282930313233343536373839404142434445464748495051525354555657585960
Page 17
15
Figure 5. Experimental hydrate vapour-liquid equilibrium curve for Qatari Natural Gas (QNG-
S1) obtained using gas hydrate autoclave compared to the curves without/with nitrogen dilution
(QNG-S1+N2) in presence of 1 and 5 wt% ChCl obtained using rocking cell apparatus.
3.4. Analysis of HLVE Data. In this section we have analyzed the HLVE curves by
converting them to the trends of hydrate suppression temperatures in presence of ChCl in various
concentrations for diluted QNG-S1+N2 and QNG-S1 alone. The results are depicted in Figure 6
(A-D). Four different conditions arise with all the data set: (A) Where the effect of ChCl in
different concentrations at QNG-S1 hydrates dissociation conditions is depicted; (B) Where the
inhibition effect of N2 on QNG-S1 hydrate forming conditions is shown, also one can translate it
into the relatively different conditions required to form the hydrates for this dilute mixture; (C)
where the combined effectiveness of both (ChCl+N2) in QNG-S1 hydrate inhibition is
considered; and (D) When the hydrate inhibition effect of different concentrations of ChCl on the
diluted mixture is observed.
40
60
80
100
120
12 13 14 15 16 17 18 19 20 21
P/bar
T/oC
QNG-S1
1 wt% ChCl+N2
5 wt% ChCl+N2
QNG-S1+N2
Page 15 of 33
ACS Paragon Plus Environment
Energy & Fuels
123456789101112131415161718192021222324252627282930313233343536373839404142434445464748495051525354555657585960
Page 18
16
Figure 6. Hydrate suppression temperature as a function of pressure for Qatari Natural Gas
hydrates in presence of ChCl (1 and 5 wt%) with/without N2 purging.
Some important points can be extracted from the trends of hydrate suppression temperature in
the above-mentioned four conditions and in presence of various amount/type of inhibitors. At a
given pressure in this study ChCl+N2 are much more effective in shifting the QNG
hydrate phase boundaries compared to ChCl alone (Fig. 6 A and C). On the other hand, the
magnitude of hydrate suppression temperature caused by ChCl+N2 is in the range of 5-6 °C at
lower pressures compared to 0.7-1.7 °C for ChCl in similar pressure range (45-60 bars) compared
to almost constant 0.1°C for undiluted QNG-S1 in similar pressure range (Fig. 6 A and C). It is
0.0
0.4
0.8
1.2
1.6
2.0
40 60 80 100 120
∆∆ ∆∆T/oC
P/bars
1 wt% ChCl (QNG-S1)
5 wt% ChCl (QNG-S1)
A
3.5
4.5
5.5
40 60 80 100 120
∆∆ ∆∆T/oC
P/bars
(0.5QNG-S1+0.5N2)-QNG-S1
B
3.5
4.5
5.5
6.5
40 60 80 100 120
∆∆ ∆∆T/oC
P/bars
(1wt% ChCl+N2) QNG-S1
(5wt% ChCl+N2) QNG-S1
C
-0.4
0.0
0.4
0.8
1.2
40 60 80 100 120
∆∆ ∆∆T/oC
P/bars
1wt% ChCl
(0.5QNG-
S1+0.5N2)
D
Page 16 of 33
ACS Paragon Plus Environment
Energy & Fuels
123456789101112131415161718192021222324252627282930313233343536373839404142434445464748495051525354555657585960
Page 19
17
also observed that at higher pressures (80-100 bars) the magnitude of suppression temperature
considerably decreases indicating that with increasing pressure the hydrate inhibition ability of
both inhibitor systems deteriorate (Fig. 6 A and C). Moreover, as found in Fig. 4 and 5, the
difference between the 1 and 5 wt% ChCl in shifting the hydrate equilibrium is also evident here
in terms of ∆T. The difference is smaller for ChCl compared to ChCl+N2 (Fig. 6 A and C). As
can be seen from Fig. 6 B, it is evident that mixing N2 alone can be an effective strategy for
hydrate inhibition. N2 is showing a suppression temperature of ~5 °C at lower pressures (40-60
bars) and ~4 °C at higher pressures (80-100 bars). Yet, Fig. 6 D reveals that ChCl is not as
effective in inhibiting the hydrate formation in the diluted (N2 rich) mixture of QNG-S1 as
compared to undiluted QNG-S1. The trends are also reversed with pressure, at lower pressures
the ChCl inhibiton is less effective and at higher pressures it is relatively more. For 1 wt% ChCl
the data seems a bit puzzling, showing negative values of T at lower pressures and as the
pressure is increasing the magnitude of T is tending towards positive values. As the magnitude
is very small (~0.2) this can be accounted for the uncertainty in calculation of hydrate
suppression temperature obtained through fitting the experimental data points. Thus, in our
opinion this strange behavior can be neglected given the uncertainty associated with the dilution
experiments.
3.5. Borescope Camera Image analysis. In Figure 7 we have presented some of the images
for QNG-S1 hydrate formation-dissociation cycle with and without inhibitor. As one can see in
the left panel the QNG-S1 without any inhibitor starts forming hydrates at around 270 mins. It
can also be referred roughly as induction time and later the crystal growth start taking place until
the hydrate blocks the pipeline at around 4410 min. It seems a rock like structure. As indicated
previously Hydraflash predicted QNG-S1 hydrates will form a type II crystal structure.
Page 17 of 33
ACS Paragon Plus Environment
Energy & Fuels
123456789101112131415161718192021222324252627282930313233343536373839404142434445464748495051525354555657585960
Page 20
18
QNG-S1: No Inhibitor QNG-S1 + N2 with 1wt% ChCl
t = 0 min (initial mixing) t = 0 min (initial mixing)
t = 270 min (Initial hydrate formation) t = 360 min (Initial hydrate formation)
t = 4410 min (Maximum Hydrates) t = 4410 min ( Maximum Hydrates)
t = 9780 min (Hydrates Dissociation) t = 8970 min (Hydrates Dissociation)
t = 10530 min (End of Experiment) t = 10530 min (End of Experiment)
Figure 7. Borescope camera images from gas hydrate autoclave (GHA) showing the cycle of Qatari type natural gas hydrate formation and dissociation without any inhibitor (left panel) and in presence of 1 wt% ChCl+N2 rich environment (right panel) at various time intervals.
Page 18 of 33
ACS Paragon Plus Environment
Energy & Fuels
123456789101112131415161718192021222324252627282930313233343536373839404142434445464748495051525354555657585960
Page 21
19
Whereas, in the right panel, system contains diluted sample, QNG-S1+N2 in presence of 1 wt%
ChCl is shown. Here the situation is very different compared to the previous one. As one can see
the first sign of hydrate formation (induction time) is around 360 min compared to 270 min of
QNG-S1 alone. It shows there is a clear delay in hydrate formation in presence of ChCl+/N2.
Later after prolonged time in the experiment the hydrates formed but not as much as in the
previous case. Even the formed hydrates at 4410 min (same time frame) doesn’t look similar to
hydrates of QNG alone. They seem more like slurry or not so strongly associated. This could be
due to the reason that ChCl is analogous to quarternary ammonium salts known for their anti-
agglomerant characteristics. Another plausible reason for this phenomena could be the presence
of N2 in the system. It also suggests that the ChCl+/N2 system is a unique option for hydrate
inhibition for Qatari natural gas. However, more systematic and detailed studies are needed in
order to unravel the mechanism of the inhibition phenomena of this synergistic system.
3.6. DFT Analysis on IL-hydrate interactions. Analysis of IL-hydrate cage systems has been
done in terms of geometrical changes on hydrates geometries upon interactions with ChCl ionic
liquid, energetic of host/guest system in presence and absence of selected IL. The optimized
geometries of CH4@512 and CH4@51262 cages are shown in Figure 8. In this work, the strength
of host-guest interactions has been assessed trough its interaction energy (∆EHG), which has been
defined as:
∆EHG = E(CH4@512) – [E(CH4) + E(512)] (1)
where E(CH4@512
), E(CH4) and E(512
) stand for the energies of CH4@512, methane molecule
and 512 empty cage, respectively. An Analogous expression can be defined for CH4@51262
system. These interaction energies are one key property to characterize clathrate type systems. In
this work, interaction energies are -7.27 kcal mol-1 and -6.42 kcal mol-1 for CH4@512 and
CH4@51262 cages, respectively, at ωB97XD/6-311+G(d,p) theoretical level. These values are in
concordance with those previously reported at MP2/6-311++G(d,p) level (-7.78 kcal mol-1 and -
6.80 kcal mol-1).28 Small differences point out to the quality of ωB97XD/6-311+G(d,p) level to
describe host-guest interactions. More negative energies of CH4@512 system agrees with the
more favoured formation of this cage.31
Page 19 of 33
ACS Paragon Plus Environment
Energy & Fuels
123456789101112131415161718192021222324252627282930313233343536373839404142434445464748495051525354555657585960
Page 22
20
Figure 8. Optimized Structures of CH4@512 and CH4@51262 cages. Host-guest interaction energies (∆EHG) of both
systems are also included. Red dotted lines stand for water-water H-bonds.
Optimized structures of ChCl interacting with CH4@512 and CH4@51262 cages are
displayed in Figure 9. In both cases, two different arrangements between the IL and the clathrate
were found (labelled as I and II / III and IV for 512 / 51262 cages). For these optimized structures
two different interaction energies can be defined. The first one can be used to assess the
magnitude of IL··· clathrate interactions (∆EIL-C), which has been defined as follow:
∆EIL-C = E(IL-CH4@512) – [E(IL) + E(CH4@512)] (2)
where E(IL-CH4@512) is the energy of the optimized IL-CH4@512 structure (an analogous
expression can be obtained for CH4@51262 cage). The second one measures host-guest
interactions (∆EHG, Eq. 1) taking into account the new arrangement of CH4@512 system upon
interaction with choline chloride ionic liquid. For this, single point calculations were carried out
over different filled cages using their coordinated obtained from optimized IL-CH4@512 and IL-
CH4@51262 systems. Estimated ∆EIL-C values (Figure 9) of both I and II (IL-CH4@512) / III and
IV (IL-CH4@51262) optimized geometries systems lie between -59.82 kJ×mol-1 and or 118.21
??kJ×mol-1 / -162.64 kJ×mol-1 and -155.37 kJ×mol-1. IL-cage interaction energies are much
higher than host-guest ones obtained in absence of ChCl, which points out that selected ionic
liquid strongly interact with both cages. For example, ∆EIL-C
of structure I (which is the smallest
one) is about twice than ∆EHG of CH4@512. Since, ChCl strongly interact with water molecules
breaking the cage, ∆EHG values become less negative, i.e., the cage is much less stable in
presence of the ionic liquid. Only for structure I, ∆EHG < 0 are obtained (for CH4@512, ∆E
HG = -
5.35 kJ×mol-1), please see Fig. 9. The most important changes upon interaction with ChCl are
Page 20 of 33
ACS Paragon Plus Environment
Energy & Fuels
123456789101112131415161718192021222324252627282930313233343536373839404142434445464748495051525354555657585960
Page 23
21
noted for structure IV, which yields ∆EHG = 31.73 kJ×mol-1. These high values of ∆E
HG point out
the possibility that the hydrate structure is broken. An examination of the difference between
∆EHG of both cages in absence of the ionic liquid, as well as ∆E
HG and ∆EIL-C of structures I-IV
shows that lower stability of CH4@51262 allows stronger interaction with ChCl ionic liquid,
whereas the hydrate structure would also be more easily opened.
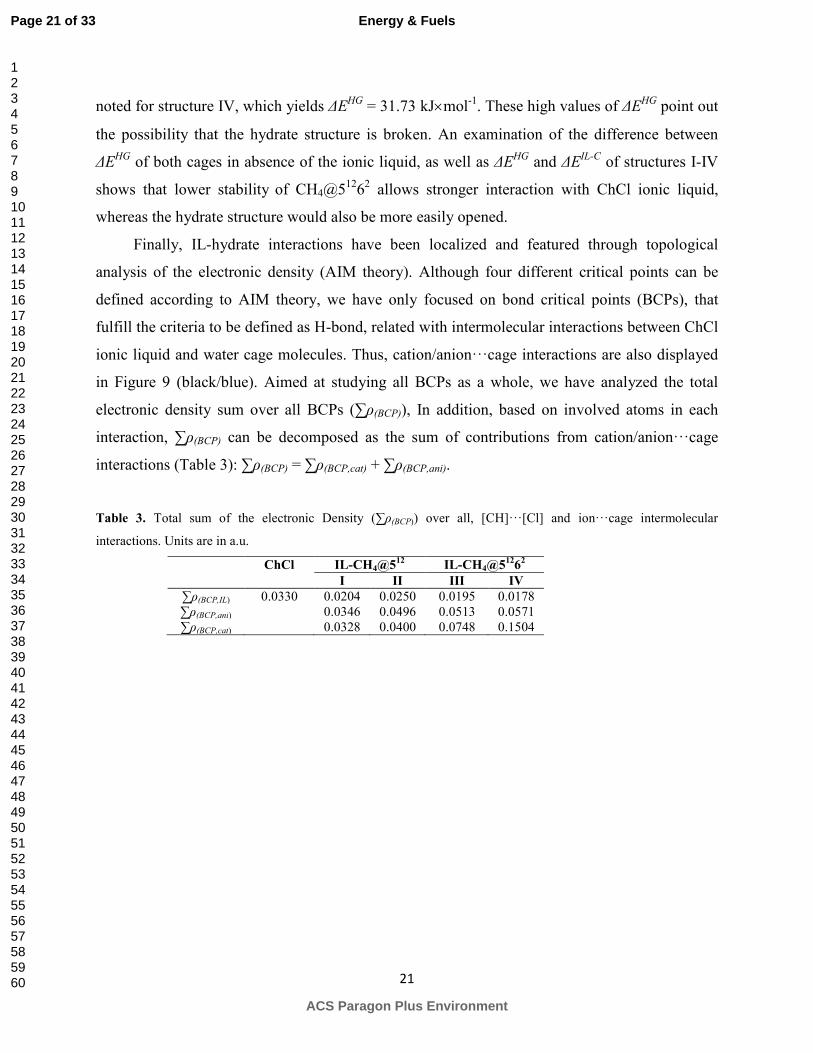
Finally, IL-hydrate interactions have been localized and featured through topological
analysis of the electronic density (AIM theory). Although four different critical points can be
defined according to AIM theory, we have only focused on bond critical points (BCPs), that
fulfill the criteria to be defined as H-bond, related with intermolecular interactions between ChCl
ionic liquid and water cage molecules. Thus, cation/anion···cage interactions are also displayed
in Figure 9 (black/blue). Aimed at studying all BCPs as a whole, we have analyzed the total
electronic density sum over all BCPs (∑ρ(BCP)), In addition, based on involved atoms in each
interaction, ∑ρ(BCP) can be decomposed as the sum of contributions from cation/anion···cage
interactions (Table 3): ∑ρ(BCP) = ∑ρ(BCP,cat) + ∑ρ(BCP,ani).
Table 3. Total sum of the electronic Density (∑ρ(BCP)) over all, [CH]···[Cl] and ion···cage intermolecular
interactions. Units are in a.u.
ChCl IL-CH4@512
IL-CH4@512
62
I II III IV
∑ρ(BCP,IL) 0.0330 0.0204 0.0250 0.0195 0.0178 ∑ρ(BCP,ani) 0.0346 0.0496 0.0513 0.0571 ∑ρ(BCP,cat) 0.0328 0.0400 0.0748 0.1504
Page 21 of 33
ACS Paragon Plus Environment
Energy & Fuels
123456789101112131415161718192021222324252627282930313233343536373839404142434445464748495051525354555657585960
Page 24
22
Figure 9. Optimized Structures of IL-CH4@512 (up) and IL-CH4@51262 (bottom) systems. IL-hydrate interaction energies (∆E
IL-C) and Host-guest interaction energies (∆EHG) are also shown. Red dotted lines represent water-water
H-bonds, while green / black / blue stand for the main [CH]···[Cl] / anion··cage / cation···cage interactions. Only BCP (blue points) corresponds to cation-anion and ion-water intermolecular interactions are shown. Intermolecular bond lengths are in Ǻ.
In addition, the main interaction for ChCl has been also characterized both in presence and
absence of hydrate cages (Figure 9 and Table 3). The main interactions between both ions are H-
bond between chloride atoms and H of hydroxyl group. Based on our simulations, this H-bond
yield a length equal to 2.125 Ǻ and electronic density ρ = 0.0330 a.u. As seen in Figure 9 and
Table 3, this H-bond is only scarcely weakened upon hydrate presence. For structure I, a strong
H-bond is found between chloride atom and one water molecule, which is the largest
Page 22 of 33
ACS Paragon Plus Environment
Energy & Fuels
123456789101112131415161718192021222324252627282930313233343536373839404142434445464748495051525354555657585960
Page 25
23
contribution to the ∑ρ(BCP). Nonetheless, there are also four week H-bonds between methyl H and
O atoms from water molecules. Although those H-bond yield long lengths (~ 2.582 Ǻ) and low
electronic density values (∑ρ(BCP) = 0.0328), they also represent an important contribution to the
cage destabilization. Similar trends are noted for the remaining hydrates. Even if, there are two
or three clorhide···water cage intermolecular H-bond, while choline···water H-bond provide
increasing strengths (lower distances and ∑ρ(BCP) values). These factors agree with ∆EHG and
∆EIL-C. The most dramatic effects were found in structure IV. As seen in Figure 9, there are three
/ eight chloride/choline···water H-bonds, which bring out that three water molecules clearly
broke the cage arrangement. In fact, the more negative ∆EHG energies are obtained for this
structure.
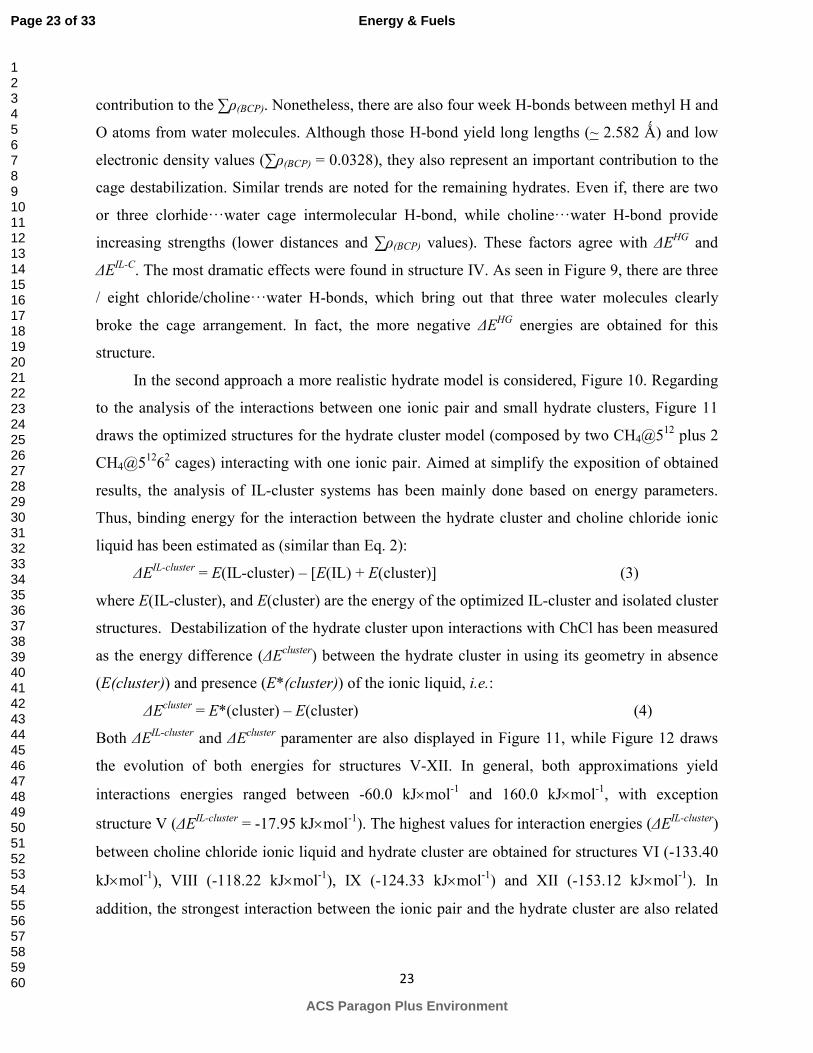
In the second approach a more realistic hydrate model is considered, Figure 10. Regarding
to the analysis of the interactions between one ionic pair and small hydrate clusters, Figure 11
draws the optimized structures for the hydrate cluster model (composed by two CH4@512 plus 2
CH4@51262 cages) interacting with one ionic pair. Aimed at simplify the exposition of obtained
results, the analysis of IL-cluster systems has been mainly done based on energy parameters.
Thus, binding energy for the interaction between the hydrate cluster and choline chloride ionic
liquid has been estimated as (similar than Eq. 2):
∆EIL-cluster = E(IL-cluster) – [E(IL) + E(cluster)] (3)
where E(IL-cluster), and E(cluster) are the energy of the optimized IL-cluster and isolated cluster
structures. Destabilization of the hydrate cluster upon interactions with ChCl has been measured
as the energy difference (∆Ecluster) between the hydrate cluster in using its geometry in absence
(E(cluster)) and presence (E*(cluster)) of the ionic liquid, i.e.:
∆Ecluster
= E*(cluster) – E(cluster) (4)
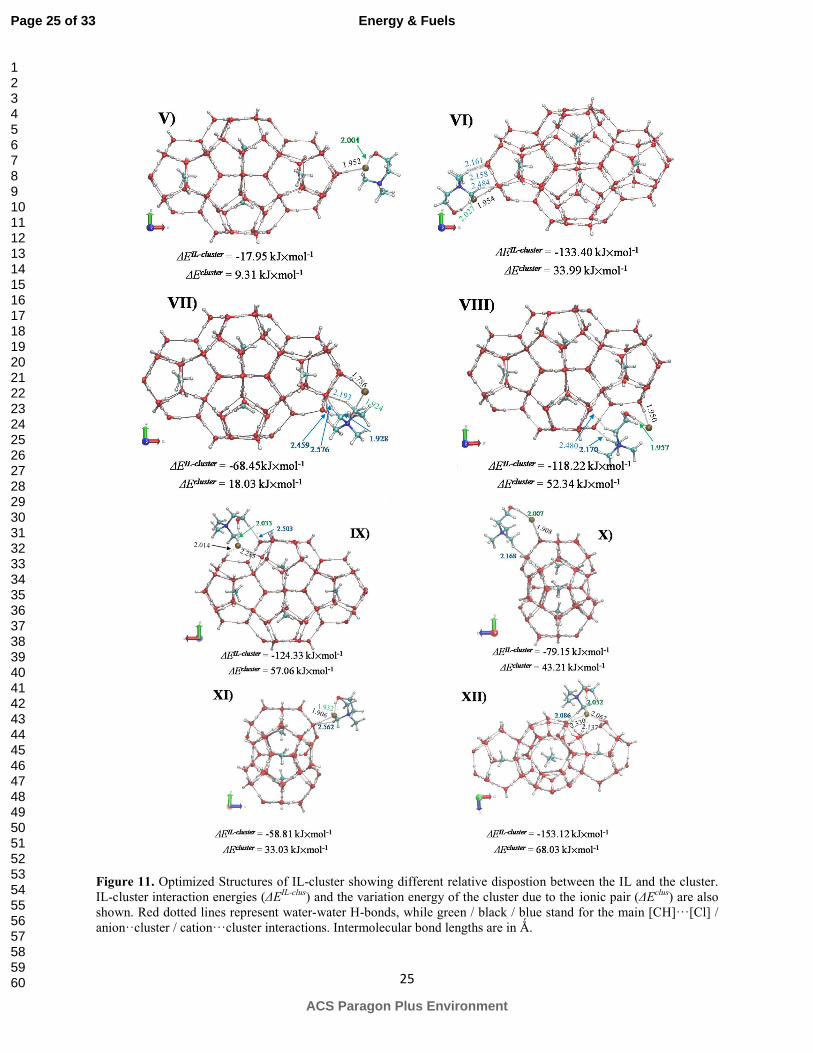
Both ∆EIL-cluster
and ∆Ecluster paramenter are also displayed in Figure 11, while Figure 12 draws
the evolution of both energies for structures V-XII. In general, both approximations yield
interactions energies ranged between -60.0 kJ×mol-1 and 160.0 kJ×mol-1, with exception
structure V (∆EIL-cluster = -17.95 kJ×mol-1). The highest values for interaction energies (∆E
IL-cluster)
between choline chloride ionic liquid and hydrate cluster are obtained for structures VI (-133.40
kJ×mol-1), VIII (-118.22 kJ×mol-1), IX (-124.33 kJ×mol-1) and XII (-153.12 kJ×mol-1). In
addition, the strongest interaction between the ionic pair and the hydrate cluster are also related
Page 23 of 33
ACS Paragon Plus Environment
Energy & Fuels
123456789101112131415161718192021222324252627282930313233343536373839404142434445464748495051525354555657585960
Page 26
24
with the largest destabilization of the hydrate (measured through ∆Ecluster). Thus, the largest
destabilization are noted for structure XII (∆EIL-cluster = 68.03 kJ×mol-1).
Figure 10. Optimized Structures of hydrate model cluster used in the second part of DFT simulations.
Page 24 of 33
ACS Paragon Plus Environment
Energy & Fuels
123456789101112131415161718192021222324252627282930313233343536373839404142434445464748495051525354555657585960
Page 27
25
Figure 11. Optimized Structures of IL-cluster showing different relative dispostion between the IL and the cluster. IL-cluster interaction energies (∆E
IL-clus) and the variation energy of the cluster due to the ionic pair (∆Eclus) are also
shown. Red dotted lines represent water-water H-bonds, while green / black / blue stand for the main [CH]···[Cl] / anion··cluster / cation···cluster interactions. Intermolecular bond lengths are in Ǻ.
Page 25 of 33
ACS Paragon Plus Environment
Energy & Fuels
123456789101112131415161718192021222324252627282930313233343536373839404142434445464748495051525354555657585960
Page 28
26
Figure 12. Computed IL-cluster interaction energies (∆EIL-clus) and variation energy of the cluster due to the ionic
pair (∆Eclus).
The interaction mechanism has been inferred from the molecular disposition between ChCl
regarding the hydrate. As seen in Figure 11, choline chloride ionic pair is interacting with one
face of cage 512, where the main interaction is taking place between the chloride anion. This
interaction mechanism is similar to those described for structures I and II. Nonetheless, in
structures VIII, IX and XII the ionic pair is simultaneously interacting with both 512 and 51262
cages. Instead of the analyzed structure, the main interactions between the ionic pair and the
hydrate are hydrogen bonds, where the chloride anion plays as hydrogen bond acceptor. Note
that ∆EIL-cluster values are increasing as a function of the number of hydrogen bonds between
chloride anion and the hydrate. Structure VIII only yields one hydrogen bonds between chloride
anion and the hydrate (concretely with one cage 512, while interactions with cage 51262 takes
places between methyl hydrogen and O atoms of the cage). Structure IX / XII leads to two / three
hydrogen bonds, one of them with a cage 512, while the remaining bond are formed between the
anion and cage 51262. Accordingly, structures VIII, IX and VII yield one hydrogen bond between
chloride anion and cage 512, while increase of ∆EIL-cluster values are due to interaction between
chloride anion and one cage 51262. Those results agree with those obtained from structures I-IV,
which pointed out to stronger interactions between ChCl and 51262. In short, this second
approximation has been allowed the study of the interaction mechanism in a more realistic
environment. However based on interaction energies, both approximations lead to similar
conclusions.
Page 26 of 33
ACS Paragon Plus Environment
Energy & Fuels
123456789101112131415161718192021222324252627282930313233343536373839404142434445464748495051525354555657585960
Page 29
27
4. Conclusions
Qatari natural gas type mixture and a diluted sample of it using nitrogen have been
characterized for their hydrate formation and dissociation conditions using two different
experimental methods. A biocompatible ionic liquid: choline chloride at 1 and 5 wt%
concentration was tested for its hydrate inhibition efficiency for both Qatari natural gas hydrates
and those from diluted sample. The IL acts similar to thermodynamic inhibitor at both
concentrations. However, it was not as effective as classical inhibitors. The other way of looking
at this data was to consider N2 as hydrate inhibitor itself, which was used for making the system,
diluted (N2 rich). It was found that mixing N2 is an effective and economic way of inhibiting gas
hydrates compared to chemical inhibition for the studied system. The used computational
approach based on DFT allowed inferring the mechanism of interaction between the ionic liquid
and model hydrate cages. The obtained results are useful and could be helpful for the Qatar oil
and gas industries to plan the flow assurance strategies.
ACKNOWLEDGEMENT
This work was made possible by NPRP grant #6-330-2-140 and #5-590-2-238 from the Qatar
National Research Fund (a member of Qatar Foundation). The statements made herein are solely
the responsibility of the authors.
Page 27 of 33
ACS Paragon Plus Environment
Energy & Fuels
123456789101112131415161718192021222324252627282930313233343536373839404142434445464748495051525354555657585960
Page 30
28
References
1. Sloan, E. D., Jr., Fundamental principles and applications of natural gas hydrates, Nature
2003, 426, 353 - 359.
2. Kondo, W.; Ohtsuka, K.; Ohmura, R.; Takeya, S.; Mori, Y. H. Clathrate-hydrate
formation from a hydrocarbon gas mixture: compositional evolution of formed hydrate
during an isobaric semi-batch hydrate-froming operations. Appl. Energy 2014, 113, 864 –
871.
3. Ludwig, R. Water: from clusters to the bulk. Angew. Chem. Int. Ed. 2001, 40, 1808 –
1828.
4. Moon, C.; Taylor, P. C.; Rodger, P. M. Molecular dynamics study of gas hydrate
formation. J. Am. Chem. Soc. 2003, 125, 4706 – 4707.
5. Anderson, R.; Chapoy, A.; Tohidi, B. Phase relations and binary clathrate hydrate
formation in the system H2-THF-H2O. Langmuir 2007, 23, 3440 – 3444.
6. Mohamed, N. A. Avoiding Gas Hydrate Problems in Qatar Oil and Gas Industry:
Environmentally Friendly Solvents for Gas Hydrate Inhibition, M. S. Thesis, Qatar
University, Qatar, Nov. 2014.
7. Giavarini, C.; Hester, K. Hydrates seen as a problem for oil and gas industry, In Gas
Hydrates: Immense energy potential and environmental challenges 2011, pp 97 – 116.
8. The world’s biggest natural gas reserves (12th Nov 2013), Hydrocarbons-technology.com
(retrieved on 7th April 2015).
9. Mokhatab, S.; Poe, W. A.; Speight, J. G. Handbook of natural gas transmission and
processing; Elsevier Inc., 2006.
10. Anderson, F. E.; Prausnitz, J. M. Inhibition of gas hydrates by methanol. AIChE J. 1986,
32, 1321 – 1333.
11. Lafond, P. G.; Olcott, K. A.; Sloan, E. D.; Koh, C. A.; Sum, A. K. Measurements of
methane hydrate equilibrium in systems inhibited with NaCl and methanol. J. Chem.
Thermodyn. 2012, 48, 1 – 6.
12. Kelland, M. A. History of the development of low dosage hydrate inhibitors, Energy
Fuels 2006, 20, 825 – 847.
13. Perfeldt, C. M.; Chua, P. C.; Daraboina, N.; Friis, D.; Kristiansen, E.; Ramlov, H.;
Woodley, J. M.; Kelland, M. A.; Solms, N. V. Inhibition of gas hydrate nucleation and
Page 28 of 33
ACS Paragon Plus Environment
Energy & Fuels
123456789101112131415161718192021222324252627282930313233343536373839404142434445464748495051525354555657585960
Page 31
29
growth: Efficacy of an antifreeze protein from the longhorn beetle Rhagiummordax.
Energy Fuels 2014, 28, 3666 - 3672.
14. Tariq, M.; Rooney, D.; Othman, E.; Aparicio, S.; Atilhan, M.; Khraisheh, M. Gas hydrate
inhibition: a review of the role of ionic liquids, Ind. Eng. Chem. Res. 2014, 53, 17855 –
17868.
15. Petkovic, M.; Seddon, K. R.; Rebelo, L. P. N.; Pereira, C. S. Ionic liquids: a pathway to
environmental acceptability, Chem. Soc. Rev., 2011, 40, 1383 – 1403.
16. Zhu, Y.; Shi, B.; Fang, C. The isotopic composition of molecular nitrogen: Implications
on their origins in natural gas accumulations. Chem. Geol. 2000, 164, 321 - 330.
17. Czechowicz, D.; Skutil, K.; Taniewski, M. Nitrogen rich natural gases as a potential
direct feedstock for some novel methane transformation process. Part 1: Oxidative
processes, Energy Fuels 2009, 23, 4438 – 4448.
18. Obanijesu, E. O.; Barifcani, A.; Pareek, V. K.; Tade, M. O. Experimental study on
feasibility of H2 and N2 as hydrate inhibitors in natural gas pipelines, J. Chem. Eng.
Data 2014, 59, 3756 – 3766.
19. Bahadori, A. Correlation accurately predicts hydrate forming pressure of pure
components, J. Can. Pet. Technol. 2008, 47, 13 – 16.
20. Semenov, A. P.; Medvedev, V. I.; Gushchin, P. A.; Yakushev, V. S. Effect of heating rate
on the accuracy of measuring equilibrium conditions for methane and argon hydrates,
Chem. Eng. Sci. 2015, 137, 161 – 169.
21. HYDRAFLASH® URL: http://www.hydrafact.com/index.php?page=software (last
retrieved on 7th April 2015).
22. Tohidi, B.; Burgass, R. W.; Danesh, A.; Østergaard, K. K.; Todd, A. C. Improving the
Accuracy of Gas Hydrate Dissociation Point Measurements. Ann. N.Y. Acad. Sci. 2000,
912, 924–931.
23. Daraboina, N.; Malmos, C.; Solms, N. V. Synergistic kinetic inhibition of natural gas
hydrate formation. Fuel 2013, 108, 749 - 757.
24. Lone A.; Kelland, M. A. Exploring kinetic hydrate inhibitor test methods and conditions
using a multicell stell rocker rig. Energy Fuels 2013, 27, 2536 – 2547.
Page 29 of 33
ACS Paragon Plus Environment
Energy & Fuels
123456789101112131415161718192021222324252627282930313233343536373839404142434445464748495051525354555657585960
Page 32
30
25. Mady, M. F.; Bak, J. M.; Lee, H.; Kelland, M. A. The first kinetic hydrate inhibition
investigation on fluorinated polymers: Poly(fluoroalkylacrylamide)s. Chem. Eng. Sci.
2014, 119, 230 – 235.
26. Wang, J.; Lu, H.; Ripmeester, J. A. Raman spectroscopy and cage occupancy of
hydrogen clathrate hydrate from first-principle calculations. J. Am. Chem. Soc. 2009, 131,
14132-14133.
27. Ramya, K. R.; Kumar, G. V. P.; Venkatnathan, A. Raman spectra of vibrational and
librational modes in methane clathrate hydrates using density functional theory. J. Chem.
Phys. 2012, 136, 174305.
28. Atilhan, M.; Pala, N.; Aparicio, S. A quantum chemistry study of natural gas hydrates. J.
Mol. Mod. 2014, 20, 1-15.
29. Grimme, S. Semiempirical GGA-type density functional constructed with a long-range
dispersion correction. J. Comput. Chem. 2006, 27, 1787-1799.
30. Tang, L.; Su, Y.; Liu, Y.; Zhao, J.; Qiu, R. Nonstandard cages in the formation process of
methane clathrate: Stability, structure, and spectroscopic implications from first-
principles. J. Chem. Phys. 2012, 136, 224508.
31. Ramya, K. R.; Venkatnathan, A. Stability and reactivity of methane clathrate hydrates:
insights from density functional theory. J. Phys. Chem. A 2012, 116, 7742-7745.
32. Cohen, A. J.; Mori-Sánchez, P.; Yang, W. Challenges for density functional theory.
Chem. Rev. 2012, 112, 289-320.
33. Chai, J. D.; Head-Gordon, M., Systematic optimization of long-range corrected hybrid
density functionals. J. Chem. Phys. 2008, 128, 084106.
34. Chai, J. D. ; Head-Gordon, M. Long-range corrected hybrid density functionals with
damped atom-atom dispersion corrections. Phys. Chem. Chem. Phys. 2008, 10, 6615-
6620.
35. Boys, S. F.; Bernardi, F. The calculation of small molecular interactions by the
differences of separate total energies. Some procedures with reduced errors. Mol. Phys.
1970, 19, 553-566.
36. Frisch, M. J.; Trucks, G. W.; Schlegel, H. B.; Scuseria, G. E.; Robb, M. A.; Cheeseman,
J. R.; Scalmani, G.; Barone, V.; Mennucci, B.; Petersson, G. A.; Nakatsuji, H.; Caricato,
M.; Li, X.; Hratchian, H. P.; Izmaylov, A. F.; Bloino, J.; Zheng, G.; Sonnenberg, J. L.;
Page 30 of 33
ACS Paragon Plus Environment
Energy & Fuels
123456789101112131415161718192021222324252627282930313233343536373839404142434445464748495051525354555657585960
Page 33
31
Hada, M.; Ehara, M.; Toyota, K.; Fukuda, R.; Hasegawa, J.; Ishida, M.; Nakajima, T.;
Honda, Y.; Kitao, O.; Nakai, H.; Vreven, T.; Montgomery Jr., J. A.; Peralta, J. E.;
Ogliaro, F. O.; Bearpark, M. J.; Heyd, J.; Brothers, E. N.; Kudin, K. N.; Staroverov, V.
N.; Kobayashi, R.; Normand, J.; Raghavachari, K.; Rendell, A. P.; Burant, J. C.; Iyengar,
S. S.; Tomasi, J.; Cossi, M.; Rega, N.; Millam, N. J.; Klene, M.; Knox, J. E.; Cross, J. B.;
Bakken, V.; Adamo, C.; Jaramillo, J.; Gomperts, R.; Stratmann, R. E.; Yazyev, O.;
Austin, A. J.; Cammi, R.; Pomelli, C.; Ochterski, J. W.; Martin, R. L.; Morokuma, K.;
Zakrzewski, V. G.; Voth, G. A.; Salvador, P.; Dannenberg, J. J.; Dapprich, S.; Daniels,
A. D.; Farkas, A. D. N.; Foresman, J. B.; Ortiz, J. V.; Cioslowski, J.; Fox, D. J. Gaussian
09, Gaussian, Inc.: Wallingford, CT, USA, 2009.
37. Perdew, J. P.; Ernzerhof, K. B. Generalized gradient approximation made simple. Phys.
Rev. Lett. 1996, 77, 3865.
38. Soler, J. M.; Artacho, E.; Gale, J. D.; García, A.; Junquera, J.; Ordejón, P.; Sánchez-
Portal, D. The SIESTA method for ab initio order-N materials simulation. J. Phys.
Condens. Mat. 2002, 14, 2745.
39. Lin, Y. S.; Li, G. D.; Mao, S. P.; Chai, J. D. Long-range corrected hybrid density
functionals with improved dispersion corrections. J. Chem. Theory Comput. 2013, 9, 263-
272.
40. Neese, F. The ORCA program system. Wiley Interdisciplinary Reviews: Computational
Molecular Science 2012, 2, 73-78.
41. Sa, J-H.; Kwak, G-H.; Lee, B. R.; Ahn, D.; Lee, K-H. Abnormal incorporation of amino
acids into the gas hydrate crystal lattice. Phys. Chem. Chem. Phys. 2014, 16, 26730 –
26734.
42. Walker, V. K.; Zeng, H.; Ohno, H.; Daraboina, N.; Sharifi, H.; Bagherzadeh, S. A.;
Alavi, S.; Englezos, P. Antifreeze proteins as gas hydrate inhibitors. Can. J. Chem. (doi:
10.1139/cjc-2014-0538)
43. Perrin, A.; Musa, O. M.; Steed, J. W. The chemistry of low dosage clathrate hydrate
inhibitors. Chem. Soc. Rev. 2013, 42, 1996 – 2015.
44. Kang, S-P.; Kim, E. S.; Shin, J-Y.; Kim, H-T.; Kang, J. W.; Cha, J-H.; Kim, K-S.
Unusual synergy effect on methane hydrates inhibition when ionic liquid meets polymer.
RSC Adv. 2013, 3, 19920 – 19923.
Page 31 of 33
ACS Paragon Plus Environment
Energy & Fuels
123456789101112131415161718192021222324252627282930313233343536373839404142434445464748495051525354555657585960
Page 34
32
45. Park, S.; Lim, D.; Seo, Y.; Lee, H. Incorporation of ammonium fluoride into clathrate
hydrate lattices and its significance in inhibiting hydrate formation. Chem. Comm. 2015,
51, 8761 – 8764.
Page 32 of 33
ACS Paragon Plus Environment
Energy & Fuels
123456789101112131415161718192021222324252627282930313233343536373839404142434445464748495051525354555657585960
Page 35
33
Experimental and DFT Approach on the Determination of Natural Gas Hydrate
Equilibrium with the use of Excess N2 and Choline-Chloride Ionic Liquid as an Inhibitor
Mohammad Tariq1ξ, Mert Atilhan1* and Majeda Khraisheh1*
Enas Othman2ξ and Marcelo Castier2*
Gregorio García3 and Santiago Aparicio3
Bahman Tohidi4
*Corresponding authors ([email protected] ; [email protected] ; [email protected] )
ξ
Equal contribution
1Department of Chemical Engineering, Qatar University
2Chemical Engineering Department, Texas A&M University at Qatar
3Department of Chemistry, University of Burgos, Spain
4Institute of Petroleum Engineering, Heriot Watt-University, United Kingdom
GRAPHICAL TOC
Page 33 of 33
ACS Paragon Plus Environment
Energy & Fuels
123456789101112131415161718192021222324252627282930313233343536373839404142434445464748495051525354555657585960