Page 1
Abstract—Laser metal deposition (LMD) is a manufacturing
process, which can be used to manufacture a complete, fully
functional part by building it up layer-by-layer using the data from a
Computer-Aided-Design (CAD) file. The layer-by-layer addition
can also be used to rebuild worn-out sections of existing parts, as
well as to deposit protective coatings to protect parts in surface
engineering. In order to produce parts with high geometrical
tolerances and desirable material properties, the process parameters
have to be carefully controlled. Since the LMD process requires the
interaction of parameters, it is not always easy to predict the output
geometry. In this paper, the laser metal deposition process was
modelled in ANSYS Parametric-Design-Language (APDL), using a
transient thermal analysis, in order to determine the geometrical
properties of the clad, that is, the width and the height of the
resulting clad. The simulated results were then compared
experimentally by depositing Commercially Pure (CP) titanium
powder onto a Ti-6Al-4V substrate, in order to verify the
simulation. The varying parameter in the experimental process was
the powder flow rate, which was varied between 0.5-2.5g/min. In
addition to the geometrical properties, the microstructure,
microhardness; and the porosity levels of the deposited clads were
also analyzed, in order to better determine the clad quality and
integrity. The model showed good agreement in predicting both the
height and the width of the clads. Porosity was noticed in all the
samples with the exception of the clad deposited at the lowest
powder flow rate setting of 0.5 g/min. An increase in the powder
flow rate also led to a smaller fusion zone, due to a lower laser-
material interaction period, which was the result of the increase in
the quantity of powder causing attenuation of the beam, and less
laser power being absorbed by the substrate.
Keywords— ANSYS, Heat-Affected Zone, laser metal deposition,
microhardness, microstructure, porosity, powder flow rate,
titanium.
Manuscript revised on March 25 2016
Esther T. Akinlabi is an Associate Professor and the Head of Department
of the Department of Mechanical Engineering Science, Auckland Park
Kingsway Campus, University of Johannesburg, Johannesburg, South
Africa, 2006. (E-mail: [email protected] )
Mohammed A. Tayob is a Graduate Candidate in the Department of
Mechanical Engineering Science, Auckland Park Kingsway Campus,
University of Johannesburg, Johannesburg, South Africa, 2006. (E-mail:
[email protected] ).
Francesco Pietra is a Senior Lecturer in the Department of Mechanical
and Aeronautical Engineering, University of Pretoria, South Africa. (Email:
[email protected] )
I. INTRODUCTION
he modern manufacturing era has called for a reduction
in manufacturing costs; yet at the same time, it requires
constant development of components. Traditional
machining, especially in the case of small complex
components is time consuming and expensive. Additive
manufacturing methods such as Laser Metal Deposition
(LMD) have therefore found favor in recent times as it
allows small complex components to be developed at a much
faster and cheaper rate compared to traditional manufacturing
methods [1]. This is especially true in the case of titanium
which is classified as a difficult-to-machine material. LMD is
an additive manufacturing method that works by irradiating
the surface of a substrate material, using a high-power laser
beam, which is shielded by an inert gas to prevent oxidation,
to form a melt pool on the substrate material, into which a
powder is fed [2] [3] [4]. The powder is partially melted by
passing through the laser; and it also melts, along with a
portion of the base material, thereby forming a metallurgical
bonded layer similar to a weld, but with a higher mechanical
strength and improved material properties. The layer-by-
layer addition of material is extremely versatile and can not
only be used to build complete components but can also be
used to rebuild damaged or worn out sections allowing LMD
to be used as a repair process as well [1]. A schematic of the
LMD process can be seen in Figure 1.
Fig. 1: Schematic of the LMD process
As with all techniques, constant research is being done to
improve the process. Due to the complex inter-relationships
that exist between the processing parameters, it is often
difficult to successfully predict the geometrical properties of
the clad. Therefore, researchers have attempted to simulate
the LMD process in order to better predict the geometry.
Experimental and Numerical Analysis of
Geometrical Properties of Laser Metal
Deposited Titanium
Esther T. Akinlabi IAENG MEMBER, Mohammed A. Tayob and Francesco Pietra
T
Proceedings of the World Congress on Engineering 2016 Vol II WCE 2016, June 29 - July 1, 2016, London, U.K.
ISBN: 978-988-14048-0-0 ISSN: 2078-0958 (Print); ISSN: 2078-0966 (Online)
WCE 2016
Page 2
Numerous approaches have been taken. Some researchers
have developed analytical models; some have developed
numerical models, and some have used a combination of
both analytical and numerical techniques. Lalas et al [5]
developed an analytical model to determine the clad
geometry. The model took into account the scanning speed
and the powder flow rate. The model works in two steps: the
first step assumes that the clad is liquid and that the substrate
is solid; while the second step assumes that both the clad and
substrate are liquid. The assumption used to determine the
clad characteristics was based on the phenomenon of surface
tension. The model was shown to be capable of predicting
clad accuracy with reasonable accuracy at medium to low-to-
medium process speeds. Cheikh et al [6] had noticed that the
cross-sectional geometry of the clad forms a disk shape – due
to surface tension forces. Therefore, if one could determine
the shape of the disk, one could effectively determine the
shape of the clad. This observation was used to develop an
analytical relationship between the radius and the centre of
the disk, on the one hand, and the process parameters, on the
other hand. The circle centre position and the radius were
related to the powder efficiency and width; where the width
could be obtained, either by using a parametric relationship,
or by using a thermal analytical relationship; while the
powder efficiency could only be obtained parametrically.
The model was shown to be able to predict the geometry with
a reasonable degree of certainty. Peyre et al. [7] developed
an analytical and numerical model of the LMD process. The
model only considered experimental parameters, such as the
powder flow rate, laser power and scanning speed as input
data. The main assumption of the model is that the powder
flow rate contributes to clad formation, provided that the
incoming powder interacts with the molten pool, and that the
energy inside the melt pool is high enough to melt the
powder. The melt-pool geometry, which is also the clad
width, is calculated by using steady-state finite element
calculations; while the height was calculated analytically.
The model was shown to reproduce experiments rather well.
Fallah et al. [8] developed a transient finite element approach
to simulate the clad geometry. The model did not require any
assumptions of the general shape to determine the clad
geometry. The addition of powder was numerically carried
out in a coupled manner by activating a new set of elements
within each time step. The model was shown to be highly
accurate in determining the clad geometry.
In this study the LMD process was modelled in ANSYS
APDL using a transient thermal analysis in order to
determine the geometrical properties of a single layer clad.
To validate the model outputs produced by the simulation CP
titanium was deposited onto a Ti-6Al-4V substrate and the
geometry was measured macroscopically. In order to
determine the integrity of the clads produced during the
LMD process, further experimental work was performed to
evaluate the effect of the parameters on the microstructure,
microhardness and porosity levels in the clads.
II. EXPERIMENTAL SETUP
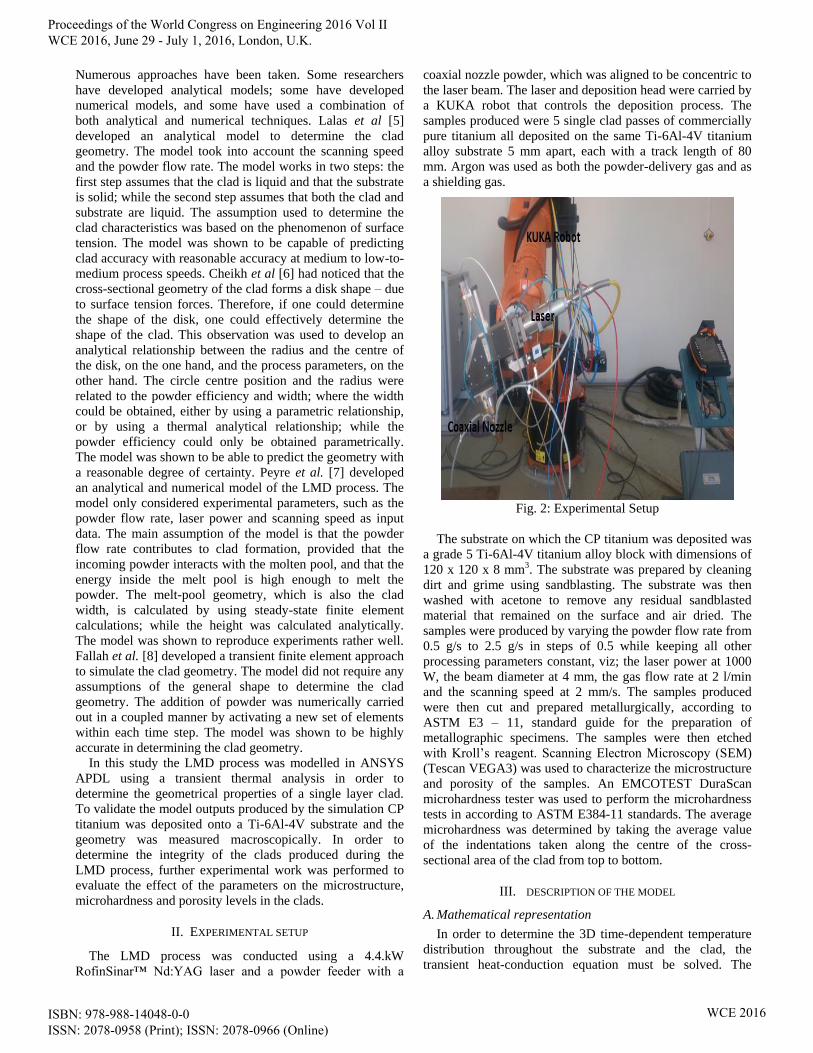
The LMD process was conducted using a 4.4.kW
RofinSinar™ Nd:YAG laser and a powder feeder with a
coaxial nozzle powder, which was aligned to be concentric to
the laser beam. The laser and deposition head were carried by
a KUKA robot that controls the deposition process. The
samples produced were 5 single clad passes of commercially
pure titanium all deposited on the same Ti-6Al-4V titanium
alloy substrate 5 mm apart, each with a track length of 80
mm. Argon was used as both the powder-delivery gas and as
a shielding gas.
Fig. 2: Experimental Setup
The substrate on which the CP titanium was deposited was
a grade 5 Ti-6Al-4V titanium alloy block with dimensions of
120 x 120 x 8 mm3. The substrate was prepared by cleaning
dirt and grime using sandblasting. The substrate was then
washed with acetone to remove any residual sandblasted
material that remained on the surface and air dried. The
samples were produced by varying the powder flow rate from
0.5 g/s to 2.5 g/s in steps of 0.5 while keeping all other
processing parameters constant, viz; the laser power at 1000
W, the beam diameter at 4 mm, the gas flow rate at 2 l/min
and the scanning speed at 2 mm/s. The samples produced
were then cut and prepared metallurgically, according to
ASTM E3 – 11, standard guide for the preparation of
metallographic specimens. The samples were then etched
with Kroll’s reagent. Scanning Electron Microscopy (SEM)
(Tescan VEGA3) was used to characterize the microstructure
and porosity of the samples. An EMCOTEST DuraScan
microhardness tester was used to perform the microhardness
tests in according to ASTM E384-11 standards. The average
microhardness was determined by taking the average value
of the indentations taken along the centre of the cross-
sectional area of the clad from top to bottom.
III. DESCRIPTION OF THE MODEL
A. Mathematical representation
In order to determine the 3D time-dependent temperature
distribution throughout the substrate and the clad, the
transient heat-conduction equation must be solved. The
Proceedings of the World Congress on Engineering 2016 Vol II WCE 2016, June 29 - July 1, 2016, London, U.K.
ISBN: 978-988-14048-0-0 ISSN: 2078-0958 (Print); ISSN: 2078-0966 (Online)
WCE 2016
Page 3
equation is represented by the formula below [9] [10] [11]
[12]:
𝜕
𝜕𝑥 𝑘
𝜕𝑇
𝜕𝑥 +
𝜕
𝜕𝑦 𝑘
𝜕𝑇
𝜕𝑦 +
𝜕
𝜕𝑧 𝑘
𝜕𝑇
𝜕𝑧 + 𝑄 =
𝜕(𝜌𝐶𝑝𝑇)
𝜕𝑡 ……equation 1
Where k is thermal conductivity (W/mK), Q is Power
generated per unit volume (W/m3), ρ is density (kg/m3), Cp is
Specific heat Capacity (J/kg.K) and T is Temperature (K).
The solution can be obtained by substituting the
appropriate initial and boundary conditions. The initial
condition is that when the process has not started (t=0), the
temperature is assumed to be at room temperature. For x,y,
and z, this can be mathematically represented as:
Initial conditions for the substrate;
𝑇 𝑥,𝑦, 𝑧, 0 = 𝑇0
Initial conditions for the newly added material in each
solution time step [8] [10] [11] [12]:
𝑇 𝑥,𝑦, 𝑧, 𝑡𝑎𝑐𝑡𝑖𝑣𝑎𝑡𝑖𝑜𝑛 = 𝑇0
For both the substrate and the activated material:
𝑇 𝑥,𝑦, 𝑧,∞ = 𝑇0
The convection and radiation boundary conditions are
applied to all the outer surfaces:
𝐾 ∇𝑇.𝒏 = −ℎ 𝑇 − 𝑇0 − 𝜖𝑟𝜍𝑟 𝑇4 − (𝑇)4
The effect of the moving laser can be added into the
boundary conditions; and therefore, the area of the substrate
under the laser beam irradiation can be defined as [8] [10]
[12]:
𝐾 ∇𝑇.𝒏 = −𝛽𝐼 − ℎ 𝑇 − 𝑇0 − 𝜖𝑟𝜍𝑟 𝑇4 − (𝑇)4
Where T0 is the ambient temperature (K), tactivation is the time
of addition of deposited material into the system, n = normal
vector of the surface, I is the laser-power distribution on the
substrate (W/m2), σr is the Stefan-Boltzmann constant =
5.670 x 10⁻⁸ W/m2 K4, h is the heat convection coefficient
(W/m2K), T is the Temperature (K) and εr is the emissivity
B. Assumptions and Adjustments
(1) The laser-power intensity distribution is defined as a
circular Gaussian TEM00 mode [8]:
𝐼 𝑟 = 2𝑃
𝜋𝑟𝐿2 𝑒𝑥𝑝
−2𝑟2
𝑟𝐿2
Where I is the laser power intensity (W/m2), P is the laser
power (W), rL is laser beam radius (m) and r is the distance
from the centre of the laser beam (m).
(2) Absorption rate is only varied between 30-50%. [13]
(3) The base and track are assumed to be isotropic.
(4) The laser moves with a constant velocity.
(5) The evaporation of material is not taken into
consideration.
(6) Material properties are independent of temperature
(linear-material model)
(7) The effect of latent heat of is fusion ignored.
(8) The thermal conductivity value was multiplied by a
factor of 2.5 for temperatures higher than the melting
temperature to take into account the effect of Marangoni
flow.
(9) The heat convection coefficient is taken as 40W/m2K
for all temperatures.
(10) The powder-catchment efficiency is taken to be 50%.
C. Solution Strategy
The simulation process begins by deactivating the track
elements and solving the heat transfer equations for the
irradiated substrate, which is at room temperature. The
temperature distribution in the material will therefore be
obtained and the melt-pool boundary can be approximated
based on the melting temperature of the powder material.
Within the melt-pool boundary; wherever the temperature of
the material exceeds the melting temperature of the powder
material, a set of elements will be activated to form the track
and it is based on the height of the deposited particles which
is calculated using the following term [8]:
∆ℎ = 𝑚 𝐶∆𝑡
𝜌𝑝 𝜋𝑟𝐿2 + 2𝑟𝐿𝑉∆𝑡
Where ∆t= the solution-time step (s), m is the powder flow
rate (kg/s), ρp is powder density (kg/m3), V is the laser-scan
velocity (m/s) and rL is the laser radius (m).
IV. RESULTS AND DISCUSSION
A. Geometrical evaluation
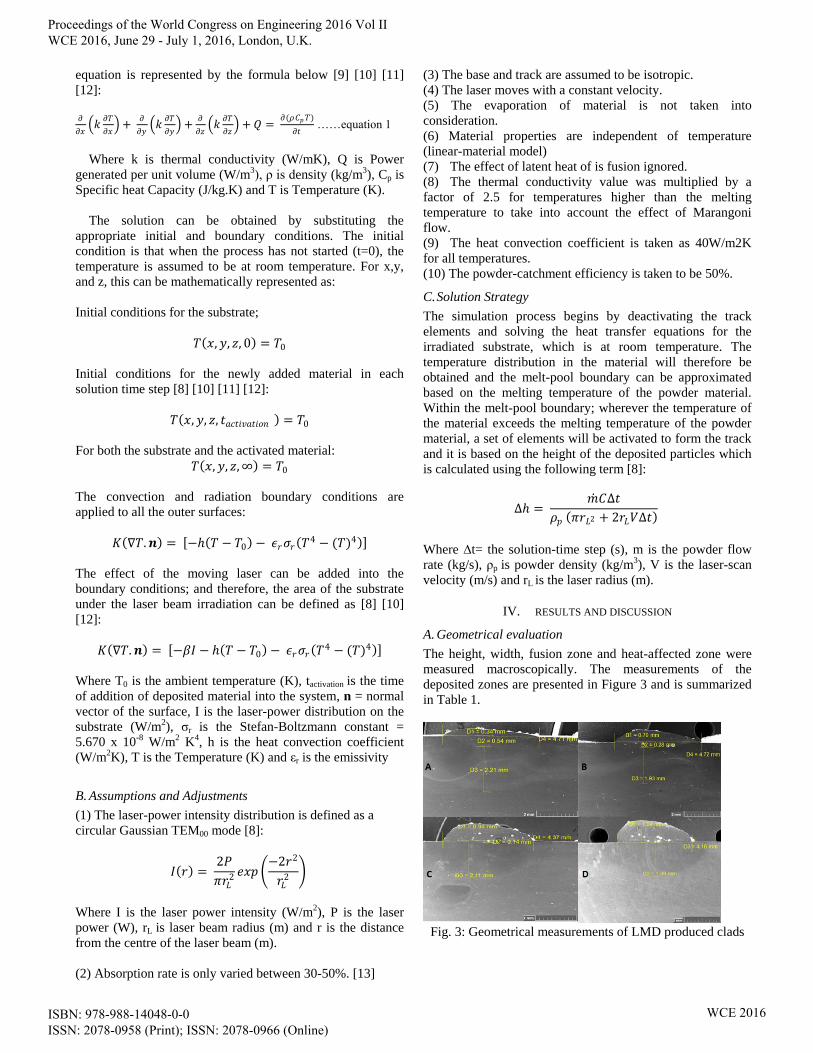
The height, width, fusion zone and heat-affected zone were
measured macroscopically. The measurements of the
deposited zones are presented in Figure 3 and is summarized
in Table 1.
Fig. 3: Geometrical measurements of LMD produced clads
Proceedings of the World Congress on Engineering 2016 Vol II WCE 2016, June 29 - July 1, 2016, London, U.K.
ISBN: 978-988-14048-0-0 ISSN: 2078-0958 (Print); ISSN: 2078-0966 (Online)
WCE 2016
Page 4
TABLE 1
GEOMETRICAL MEASUREMENTS
Sample Width
(mm)
Height
(mm)
Fusion
zone
(mm)
HAZ
(mm)
1 4.71 0.34 0.54 2.21
2 4.72 0.70 0.28 1.93
3 4.37 0.94 0.14 2.11
4 4.16 1.24 - 1.89
5 - - - -
It was observed that as the powder flow rate increased, the
width of the clads decreased, while the height increased. A
good understanding of this phenomenon is related to the
laser-material interaction during the LMD process. The un-
melted powder particles first pass through the laser beam
before landing in the melt-zone [14] [15]. This causes the
powder to melt before reaching the melt-pool; but it
attenuates some of the laser power, which means that less
power is available to melt the substrate. Due to the less
power being available to the substrate, a narrower melt-pool
is created, which means that naturally the width of the clad
would also be narrower. Effectively by increasing the powder
flow rate, it has the same effect as decreasing the laser power
to the substrate. The height, however, continues to increase;
because there is sufficient energy to melt the incoming
powder particles on the substrate. In order to confirm why
the width was decreasing – due to less power input to the
substrate to cause melting, it would be useful to have a look
at the fusion zone. The fusion zone, as expected, decreases
with an increase in the powder flow rate. It reaches a point
where there is actually no fusion zone; and the clad is being
deposited on the substrate without forming a proper bond or
fusing to the substrate. Sample 4, produced at a powder flow
rate setting of 2.0 g/min, had no measurable fusion zone; but
it managed to bond onto the substrate. Sample 5, produced at
a powder flow rate setting of 2.5 g/min, also had no fusion
zone, which led to a defective clad; as the clad fell off the
substrate, and hence its properties could not be evaluated
further. The fusion zone in sample one was more
representative of an alloying process; whilst the remaining
samples had a fusion zone that was more representative of
the cladding process.
The heat from the laser penetrated quite deep into the
substrate; and, although not very clearly defined, the
measured heat-affected-zones (HAZs) were similar, and
ranged between 1.89-2.21mm between the samples, which is
a range difference of less than 17%.
B. Microstructures of the deposited zone
In order to determine the effect of the LMD process on the
microstructure of CP titanium, the cladded layers were
analyzed. The micrographs of the cladded layers were taken
in the deposit zone (positive bead area) from around the
centre of the clad.
The micrographs of the cladded zone of the samples are
presented in Figure 4. The LMD process requires both the
substrate and the metal powder to melt, which means that it
has to be heated to over 1400°C for the process to occur,
which is above the 882°C transition temperature from a
hexagonal-close-packed (HCP) structure to a body-centred
cubic (BCC) structure; and then typical of the LMD process,
it has a rapid cooling rate. When titanium is heated above the
transition temperature and cooled rapidly from above 900°C,
it forms hexagonal alpha martensite.
Fig. 4: Micrographs of clad zones. A) 0.5g/s B)1.0g/s
C)1.5g/s D)2.0g/s
The microstructure in the clad zone was consistent for all
the samples, which is an acicular alpha martensite
microstructure, which is also commonly referred to as the
alpha-prime microstructure. This consists of an alpha phase
microstructure with a thin needle-like microstructure as
expected and earlier reported in the literature [15].
C. Microhardness profiling
The average hardness of the clad layer for all the samples
produced is presented in Figure 5.
Fig. 5: Average Vickers microhardness of clads and substrate
The average microhardness of the clad zone starts out
quite high on the sample produced at a low powder flow rate
of 0.5 g/min; but it decreases, as the powder flow rate
increases. With reference to the fusion zone, a correlation
between microhardness and the size of the fusion zone was
observed. As the fusion zone decreases, the microhardness
also starts to decrease. In order to explain this phenomenon,
it should be noted that commercially pure (CP) titanium, in
sintered form, has a microhardness value of around 200HV;
whereas Ti6-Al-4V in sintered form has a microhardness of
approximately 350 [16]. Therefore, when the fusion zone is
high, it means that the clad formed is actually an alloy of CP
Proceedings of the World Congress on Engineering 2016 Vol II WCE 2016, June 29 - July 1, 2016, London, U.K.
ISBN: 978-988-14048-0-0 ISSN: 2078-0958 (Print); ISSN: 2078-0966 (Online)
WCE 2016
Page 5
titanium and Ti-6Al-4V (due to the thermo-capillary flow
causing them to mix).
The microhardness of an alloy of Ti-6Al-4V and CP titanium
would naturally be higher than the microhardness of just CP
titanium. It is important to note that the microhardness for the
samples is higher than both CP titanium and Ti-6Al-4V in
ordinary form – that is not heat-treated [17] [18]. Sample 4
(flow rate of 2.0 g/min) is basically a clad consisting of only
CP titanium; and it has a microhardness value of almost
double that of sintered CP titanium, which illustrates the
effect of the laser on microhardness. The microhardness of
the HAZ is not significantly higher than that of the average
microhardness of the substrate – with only an increase of
around 15% higher compared to the substrate material. This
highlights the significance of the LMD process compared to
other processes; as the HAZ is very controlled.
D. Defect Characterization
With the exception of sample one, the lowest powder flow
rate, all of the samples contained porosity. Porosity could
form because of the unmelted powder particles, or as a result
of gas entrapment. The spherical or blow-hole kind of shape
of the porosity, which is shown in Figure 6 (B, C and D), is
indicative of gas porosity.
Fig. 6: Porosity in samples A)0.5g/s B)1.0g/s C)1.5g/s
D)2.0g/s
Gas porosity can originate from a few sources. The gas
could come from gas trapped in the powder feeders, it could
be released from the powder particles themselves or it could
be picked up from the environment since the experimental
setup is not completely shielded from the environment. The
porosity is also affected by the turbulence in the melt pool
[19] [20]. The higher the turbulence, the greater the chance
of gases to merge together. In this case, it was noticed that
the porosity was present in all the samples, except the first
one. The first sample (A) differs in two noticeable aspects
from the other samples, in that it had the lowest powder flow
rate; and secondly, the clad height formed is also the lowest.
This can be attributed to the fact that as the powder flow rate
increases, there is less laser material interaction leading to
porosity; and secondly, as the height of the clad increases, it
also leads to the emergence of porosity. This could indicate
two things: the first is that either the powder itself contributes
to the porosity due to the fact that more powder is deposited
because more gas is released from the powder [21]. The
second is that the increase in height could mean that any gas
entering the system, either from the powder itself or from the
environment, could not escape fast enough because of the
increase in the height, especially because the LMD has rapid
solidification rates.
Although, porosity is desirable for biomedical
applications, it is a limitation for structural applications [20].
However, both the increase in the powder flow rate and the
height are directly caused by an increase in the powder flow
rate; and therefore, an increase in the powder flow rate led to
porosity.
E. Simulation Results and Model Verification
The simulation was verified by comparing the output
height and width of the simulated LMD process to the actual
clad height and width obtained during the actual deposition
process. The optimum mesh size selected was a mesh size of
0.2mm as it gave good accuracy while allowing the
simulation to run within a feasible timeframe. It should also
be noted that the model used linear material properties; the
material properties did not change with a change in
temperature. The cross-section of the clads produced using
the simulation are presented in Figure 7.
Fig. 7: Cross-section of clads obtained using simulation
The results of the simulated height are compared to the
results of the actual height in Table 2.
TABLE 2
SIMULATED HEIGHT VS. ACTUAL HEIGHT
Powder
flow rate
(g/s)
Simulated
height
(mm)
Actual
height
(mm)
Difference
(mm)
Error
(%)
0.5 0.40 0.34 +0.06 +16.7
1.0 0.80 0.70 +0.10 +14.3
1.5 1.00 0.94 +0.06 +6.4
2.0 1.00 1.24 - 0.24 - 19.4
From Table 2, it was observed that at the lowest powder
flow rate, there is a positive error of approximately 17%.
This means that the model is building the height, more than it
should. A logical explanation for the error is due to the
lowest powder flow rate having the lowest height, coupled
with a large element size, which means that it is the most
vulnerable to errors. At a slightly higher powder flow rate,
the actual difference is larger when compared to the lowest
powder flow setting; but since it is not as sensitive, the error
is reduced slightly. The simulated results at the powder flow
rate setting of 1.5g/min showed the best results, with an error
of only 6.4%. At the highest powder flow rate, the error
Proceedings of the World Congress on Engineering 2016 Vol II WCE 2016, June 29 - July 1, 2016, London, U.K.
ISBN: 978-988-14048-0-0 ISSN: 2078-0958 (Print); ISSN: 2078-0966 (Online)
WCE 2016
Page 6
changes from a positive error to a negative error, which
means that instead of overbuilding, the model is now
underbuilding the geometry. A possible explanation for the
underbuilding of the model is caused by using a linear
material model, which does not take into consideration
titanium’s large increase in conductivity at temperatures
higher than its melting temperature.
The comparison of the simulated width to the actual width is
presented in Table 3.
TABLE 3
SIMULATED WIDTH VS. ACTUAL WIDTH
Powder
flow rate
(g/s)
Simulated
width
(mm)
Actual
width
(mm)
Difference
(mm)
Error
(%)
0.5 4.00 4.71 -0.71 -15.1
1.0 4.00 4.72 - 0.72 -15.3
1.5 4.40 4.37 -0.03 -0.7
2.0 4.40 4.16 +0.24 +5.8
Contrary to what happened with the height, the width
showed a negative error for the powder flow rate settings of
0.5 -1.5g/min. However, at the powder flow rate setting of
1.5g/min, the model was able to simulate the width with an
accuracy greater than 99%. At the highest powder flow rate,
the simulated width was larger than the actual width by
approximately 6%. Overall, the model was shown to simulate
both the height and width with good accuracy. The model
could determine both height and width with an accuracy of
within 80% of the actual height and width; with accuracy
increasing to over 90% in the case of the powder flow rate of
1.5g/min.
V. CONCLUSION
Using a transient finite-element approach, it was illustrated
that it was possible to simulate the LMD process for varying
powder flow rates with a high degree of accuracy. Additional
experimental work revealed important information with
regard to the clad quality. The first observation was that as
the powder flow rate increased, it resulted in an increase in
porosity and this can be attributed to more trapped gas being
released from the gas atomized powder, as the powder flow
rate increases, the increasing height reduces the chance of
entrapped bubbles escaping or a combination of both factors.
However, both factors are directly a consequence of an
increase in the powder flow rate. The increase in the powder
flow rate also had other detrimental effects; as it led to poor
adhesion between the clad and the substrate. The results of
this study form a basis to simulate clad geometries.
ACKNOWLEDGEMENT
The authors acknowledge the staff members of National
Laser Centre that assisted with operating the machine and the
University of Johannesburg Research Fund. Esther Akinlabi
acknowledges the Johannesburg Institute of Advanced Study
for the writing fellowship award (February to May, 2016)
during when this manuscript was developed.
REFERENCES
[1] A. Angelastro, S. L. Campanelli, G. Casalino and A. D.
Ludovico, ―Analysis of a tool steel sample obtained by
direct laser deposition,‖ in Annals of DAAAM for 2007
and Proceedings of the 18th International DAAAM
symposium, Zadar, Croatia, 2007.
[2] R. M. Mahamood, E. T. Akinlabi, M. Shukla and S.
Pityana, ―Laser Metal Deposition of Ti6Al4V: A study
on the effects of Laser Power on Microstructure and
Microhardness,‖ in International MultiConference of
Engineers and Computer Scientists, Hong Kong, 2013.
[3] F. W. Liou, ―Direct Laser Deposition,‖ in Rapid
Prototyping and Engineering Applications: A Toolbox
for Prototype Development, NW, USA, CRC Press,
2008, pp. 281-283.
[4] A. Kumar, C. P. Paul, A. K. Pathak, L. M. Bhargava and
L. M. Kukreja, ―A finer modeling approach for
numerically predicting single track geometry in two
dimensions during Laser Rapid Manufacturing,‖ Optics
& Laser Technology, vol. 44, pp. 555-565, 2012.
[5] C. Lalas, K. Tsirbas, K. Salonitis and G. Chryssolouris ,
―An analytical model of the laser clad geometry,‖
International Journal of Advanced Manufacturing
Technology, vol. 32, pp. 34-41, 2007.
[6] H. E. Cheikh, B. Courant, J. Y. Hascoet and R. Guillen,
―Prediction and analytical description of the single laser
track geometry in direct laser fabrication from process
parameters and energy-balanced reasoning,‖ Journal of
materials processing technology, no. 212, pp. 1832-
1839, 2012.
[7] P. Peyre, P. Aubry, R. Fabbro, R. Neveu and A.
Longuet, ―Analytical and Numerical modelling of the
direct metal deposition laser process,‖ Journal of
Physics D: Applied Physics, vol. 41, pp. 1-10, 2008.
[8] V. Fallah, M. Alimardani, S. F. Corbin and A.
Khajepour, ―Temporal Development of melt-pool
morphology and clad geometry in laser powder
deposition,‖ Computational Materials Science, vol. 50,
pp. 2124-2134, 2011.
[9] T. Amine, J. W. Newkirk and F. Liou, ―An investigation
of the effect of Direct metal depostion parameters on the
characteristics of the deposited layers,‖ Cases Studies in
Thermal Engineering, vol. 3, pp. 21-34, 2014.
[10] M. R. Frewin and D. A. Scott, ―Finite Element Model of
pulsed laser welding,‖ Welding Research Supplement,
NSW Australia, 1999.
[11] G. Zhu, A. Zhang, D. Li, Y. Tang, Z. Tong and Q. Lu,
―Numerical simulation of thermal behaviour during
laser direct metal deposition,‖ International Journal of
Advanced Manufacturing technology, vol. 55, pp. 945-
954, 2011.
[12] Y. Li and D. Gu, ―Thermal Behaviour during selective
laser melting of commercially pure titanium powder:
Numerical simulation and experimental study,‖ Additive
Manufacturing, vol. (Accepted manuscript) , no.
http://dx.doi.org/10.1016/j.addma.2014.09.001, 2014.
Proceedings of the World Congress on Engineering 2016 Vol II WCE 2016, June 29 - July 1, 2016, London, U.K.
ISBN: 978-988-14048-0-0 ISSN: 2078-0958 (Print); ISSN: 2078-0966 (Online)
WCE 2016
Page 7
[13] D. G. Mixon and W. P. Roach, ―A thermal model for
laser absorption,‖ in Conference on optical interactions
with Tissue and cells, San Jose, California, 2007.
[14] I. Tabernero, A. Lamikiz, S. Martinez, E. Ukar and L.
N. Lopez de Lacalle, ―Modelling of energy attenuation
due to powder flow-laser beam interaction due to the
cladding process,‖ Journal of materials processing
technology, vol. 212, pp. 516-522, 2012.
[15] J. Dong, F. Li and C. Wang, ―Micromechanical
behaviour study of alpha phase with different
morphologies of Ti-6Al-4V alloy by micro indentation,‖
Material Science and Engineering A, vol. 580, pp. 105-
113, 2013.
[16] A. R. Hamad, J. H. Abboud, F. M. Shuaeib and K. Y.
Benyounis, ―Surface hardening of commercially pure
titanium by laser nitriding: Response surface analysis,‖
Advances in engineering software, vol. 41, pp. 674-679,
2010.
[17] S. S. Da Rocha, G. L. Adabo, G. E. Henriques and M.
A. Nobilo, ―Vickers Hardness of cast commercially pure
titanium and T-6Al-4V Alloy submitted to heat
treatments,‖ Brazilian Dental Journal, vol. 17, no. 2, pp.
126-129, 2006.
[18] K. G. Budinski and M. K. Budinski, Engineering
Materials: Properties and Selection, New Jersey:
Pearson , 2010.
[19] P. A. Kobryn, E. H. Moore and S. L. Semiatin, ―The
Effect of Laser Power and Traverse Speed on
Microstructure, porosity, and build height in laser-
deposited Ti-6Al-4V,‖ Scripta Materialia, vol. 43, no.
4, pp. 299-305, 2000.
[20] R. M. Mahamood, E. T. Akinlabi, M. Shukla and S.
Pityana, ―Parameters on the Porosity of Laser deposited
titanium alloy powder,‖ in IMECS: Proceedings of the
international MultiConference of Engineers and
Computer Scientists , Hong Kong, 2014.
[21] C. G. McCracken, C. Motchenbacher and D. P. Barbis,
―Review of Titanium-powder-production methods,‖
international journal of powder metallurgy, vol. 46, no.
5, pp. 19-26, 2010.
Proceedings of the World Congress on Engineering 2016 Vol II WCE 2016, June 29 - July 1, 2016, London, U.K.
ISBN: 978-988-14048-0-0 ISSN: 2078-0958 (Print); ISSN: 2078-0966 (Online)
WCE 2016