EXPERIMENTAL AND SIMULATION STUDY ON THE EFFECT OF FRICTION IN A FOUR-POINT BENDING TEST (4PB) ABDUL ZARIF BIN ABDUL MALEK Report submitted in partial fulfilment of the requirements for the award of Bachelor of Mechanical Engineering Faculty of Mechanical Engineering UNIVERSITI MALAYSIA PAHANG JUNE 2012
Transcript
EXPERIMENTAL AND SIMULATION STUDY ON THE EFFECT OF FRICTION IN A
FOUR-POINT BENDING TEST (4PB)
ABDUL ZARIF BIN ABDUL MALEK
Report submitted in partial fulfilment of the requirements
for the award of Bachelor of Mechanical Engineering
Faculty of Mechanical Engineering
UNIVERSITI MALAYSIA PAHANG
JUNE 2012
v
ABSTRACT
Finite element evaluation is one of the methods in predicting the strain value in sheet metal
bending. Predicting the strain value is sometimes used in areas of plastic deformation, which is
the integral of the ratio of the incremental change in length to the instantaneous length of a
plastically deformed. This thesis aims to evaluate the reliability of finite element method by
comparing the results with experimental results. The effect of parameters such as length of
displacement after bend also has been studied. Abaqus software has been used to simulate the
bending process and the mechanical properties provided from the Solidwork data will be used to
run the simulation. In the four-point bending experiment, the test rig was clamped on Shimadzu
machine and the mild steel sheets was assembled with strain gauge before bend process was run.
Strain value being measured with Dasylab software. The results from the experiment and
simulation is slightly different for value of strain, which the simulation shows the value of strain
higher than strain value that was get from the experiment. For the free force four-point bending,
value length displacement after bend almost the same on the simulation and experimental. Finite
element method can be used to make comparison since the pattern of the graphs are nearly the
same and percentages of error are below 10 %. The further study on parameters that effected
bending process will make the finite element method is important in the future.
vi
ABSTRAK
Kaedah analisis simulasi merupakan salah satu kaedah untuk meramal nilai terikan dalam
pembengkokan kepingan logam. Ramalan nilai terikan kadang-kadang digunakan dalam bidang
ubah bentuk plastik, yang penting nisbah perubahan pertambahan panjang panjang ketika plastik
cacat. Laporan ini bertujuan untuk menilai kebolehan kaedah simulasi dengan membandingkan
keputusan simulasi dengan keputusan eksperimen. Kesan parameter seperti panjang anjakan
selepas selekoh juga dikaji. Perisian Abaqus telah digunakan untuk mensimulasikan proses
lenturan dan sifat-sifat mekanik yang disediakan dalam data perisian Solidwork akan digunakan
untuk menjalankan simulasi. Dalam eksperimen lentur empat mata, rig ujian telah dikepit pada
mesin Shimadzu dan kunci keluli lembut telah dipasang dengan tolok terikan sebelum proses
lenturan dijalankan. Nilai terikan diukur dengan memggunakan perisian Dasylab. Hasil dari
eksperimen dan simulasi adalah sedikit berbeza untuk nilai terikan, di mana simulasi
menunjukkan nilai ketegangan yang lebih tinggi daripada nilai terikan yang telah didapati dari
eksperimen. Untuk tenaga bebas empat mata lenturan, nilai anjakan panjang selepas selekoh
yang hampir sama pada simulasi dan eksperimen. Kaedah simulasi boleh digunakan untuk
membuat pembandingan kerana corak graf adalah hamper sama dan peratusan ralat di bawah 10
%. Kajian lanjut mengenai parameter yang mempengaruhi proses pembengkokan adalah penting
pada masa akan datang.
vii
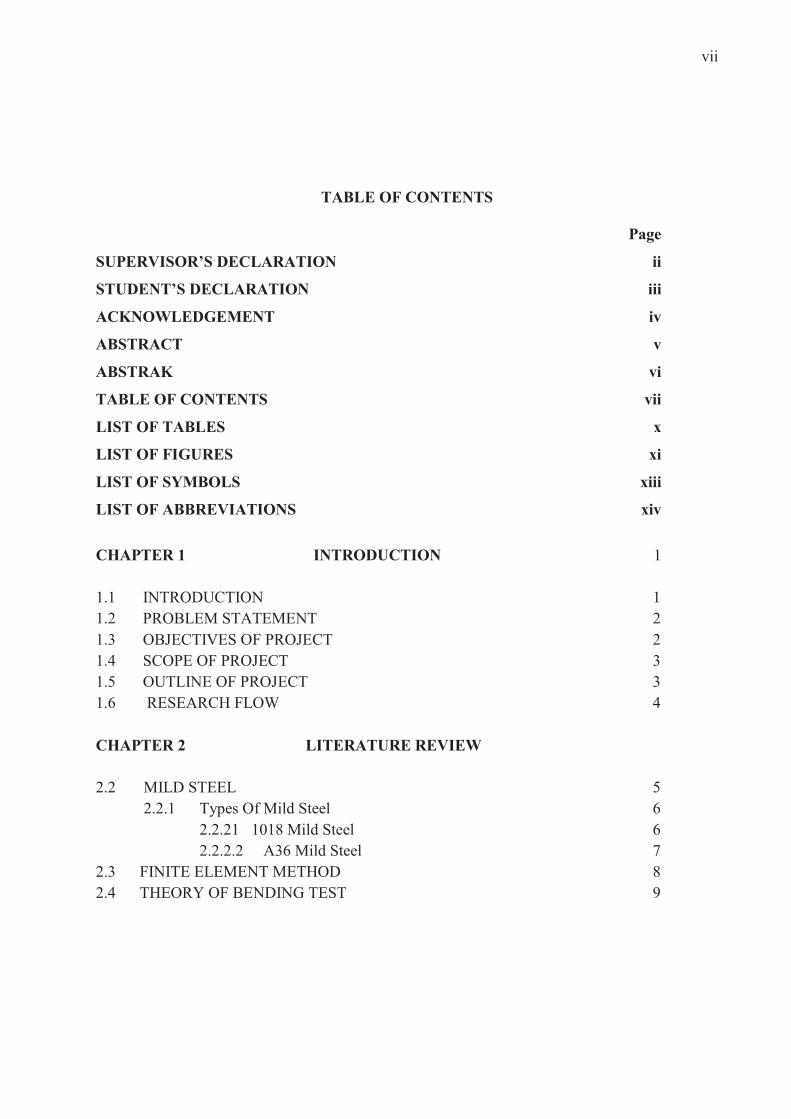
TABLE OF CONTENTS
Page
SUPERVISOR’S DECLARATION ii
STUDENT’S DECLARATION iii
ACKNOWLEDGEMENT iv
ABSTRACT v
ABSTRAK vi
TABLE OF CONTENTS vii
LIST OF TABLES x
LIST OF FIGURES xi
LIST OF SYMBOLS xiii
LIST OF ABBREVIATIONS xiv
CHAPTER 1 INTRODUCTION 1
1.1 INTRODUCTION 1
1.2 PROBLEM STATEMENT 2
1.3 OBJECTIVES OF PROJECT 2
1.4 SCOPE OF PROJECT 3
1.5 OUTLINE OF PROJECT 3
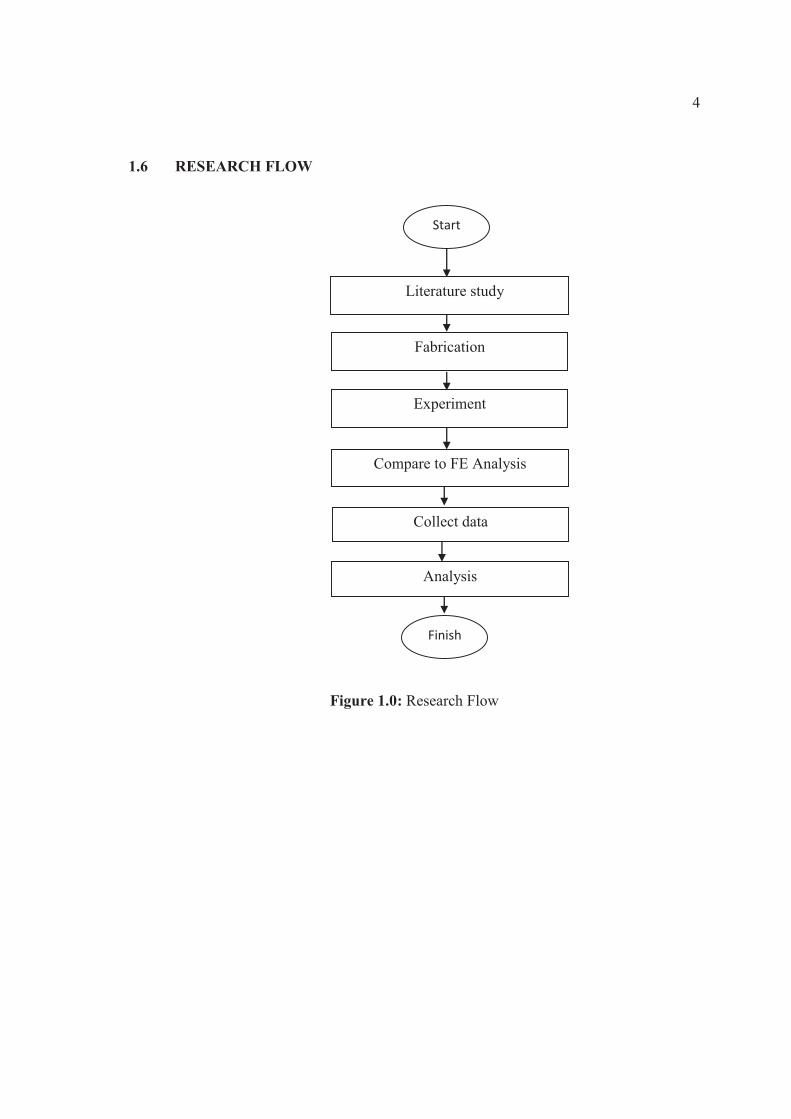
1.6 RESEARCH FLOW 4
CHAPTER 2 LITERATURE REVIEW
2.2 MILD STEEL 5
2.2.1 Types Of Mild Steel 6
2.2.21 1018 Mild Steel 6
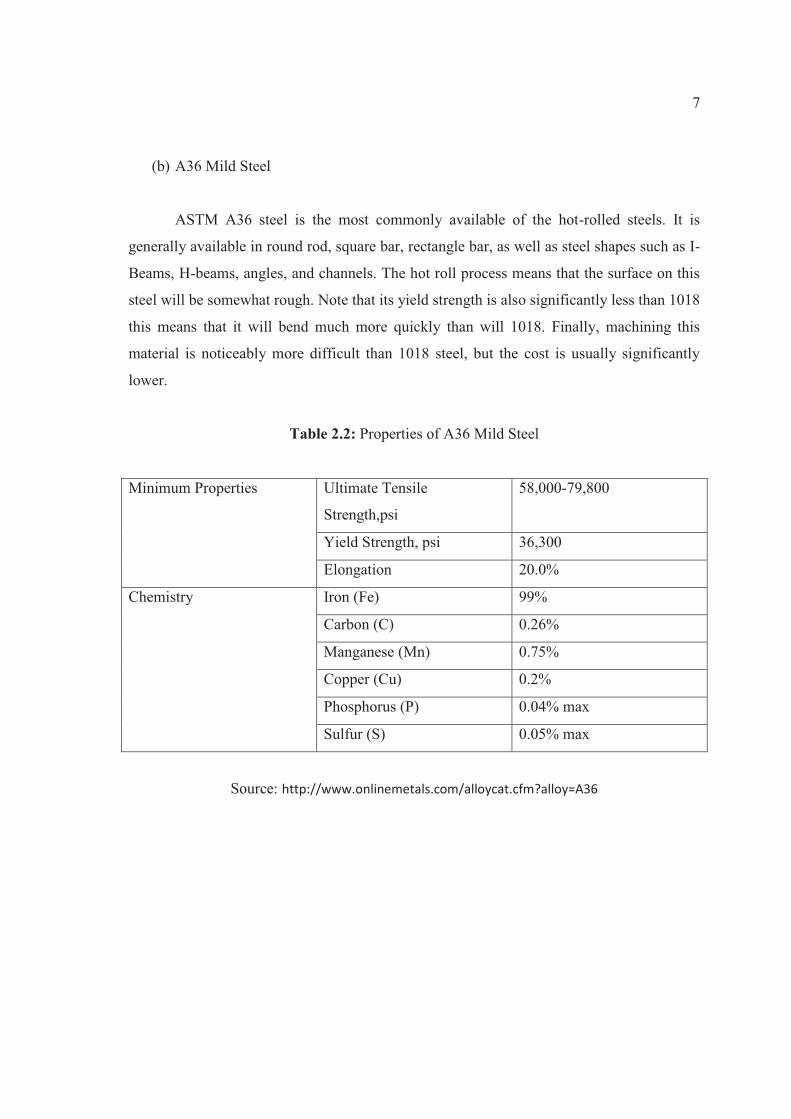
2.2.2.2 A36 Mild Steel 7
2.3 FINITE ELEMENT METHOD 8
2.4 THEORY OF BENDING TEST 9
viii
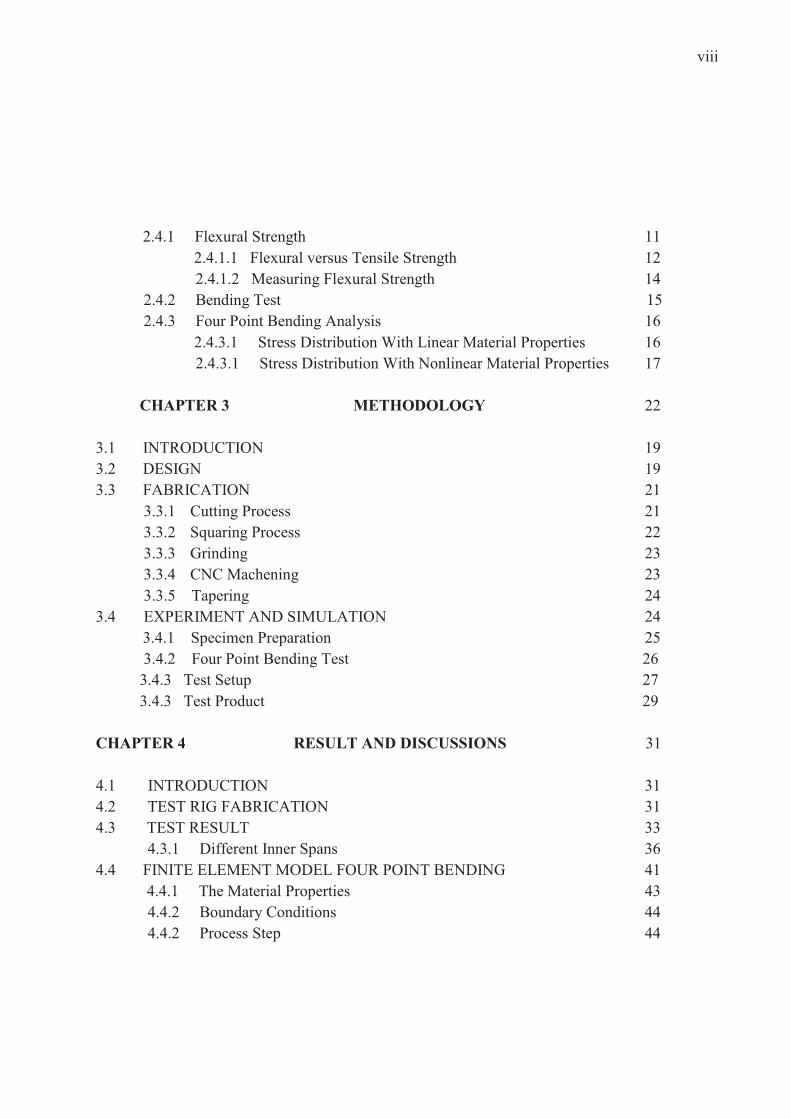
2.4.1 Flexural Strength 11
2.4.1.1 Flexural versus Tensile Strength 12
2.4.1.2 Measuring Flexural Strength 14
2.4.2 Bending Test 15
2.4.3 Four Point Bending Analysis 16
2.4.3.1 Stress Distribution With Linear Material Properties 16
2.4.3.1 Stress Distribution With Nonlinear Material Properties 17
CHAPTER 3 METHODOLOGY 22
3.1 INTRODUCTION 19
3.2 DESIGN 19
3.3 FABRICATION 21
3.3.1 Cutting Process 21
3.3.2 Squaring Process 22
3.3.3 Grinding 23
3.3.4 CNC Machening 23
3.3.5 Tapering 24
3.4 EXPERIMENT AND SIMULATION 24
3.4.1 Specimen Preparation 25
3.4.2 Four Point Bending Test 26
3.4.3 Test Setup 27
3.4.3 Test Product 29
CHAPTER 4 RESULT AND DISCUSSIONS 31
4.1 INTRODUCTION 31
4.2 TEST RIG FABRICATION 31
4.3 TEST RESULT 33
4.3.1 Different Inner Spans 36
4.4 FINITE ELEMENT MODEL FOUR POINT BENDING 41
4.4.1 The Material Properties 43
4.4.2 Boundary Conditions 44
4.4.2 Process Step 44
ix
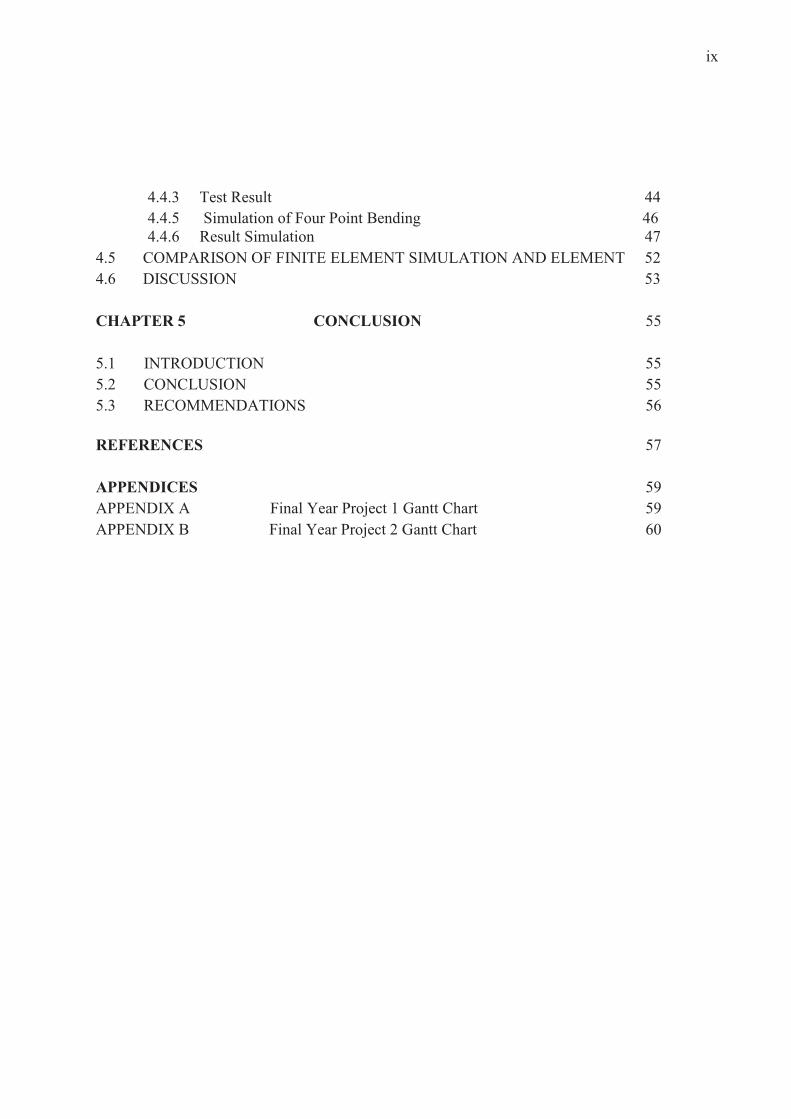
4.4.3 Test Result 44
4.4.5 Simulation of Four Point Bending 46
4.4.6 Result Simulation 47
4.5 COMPARISON OF FINITE ELEMENT SIMULATION AND ELEMENT 52
4.6 DISCUSSION 53
CHAPTER 5 CONCLUSION 55
5.1 INTRODUCTION 55
5.2 CONCLUSION 55
5.3 RECOMMENDATIONS 56
REFERENCES 57
APPENDICES 59
APPENDIX A Final Year Project 1 Gantt Chart 59
APPENDIX B Final Year Project 2 Gantt Chart 60
x
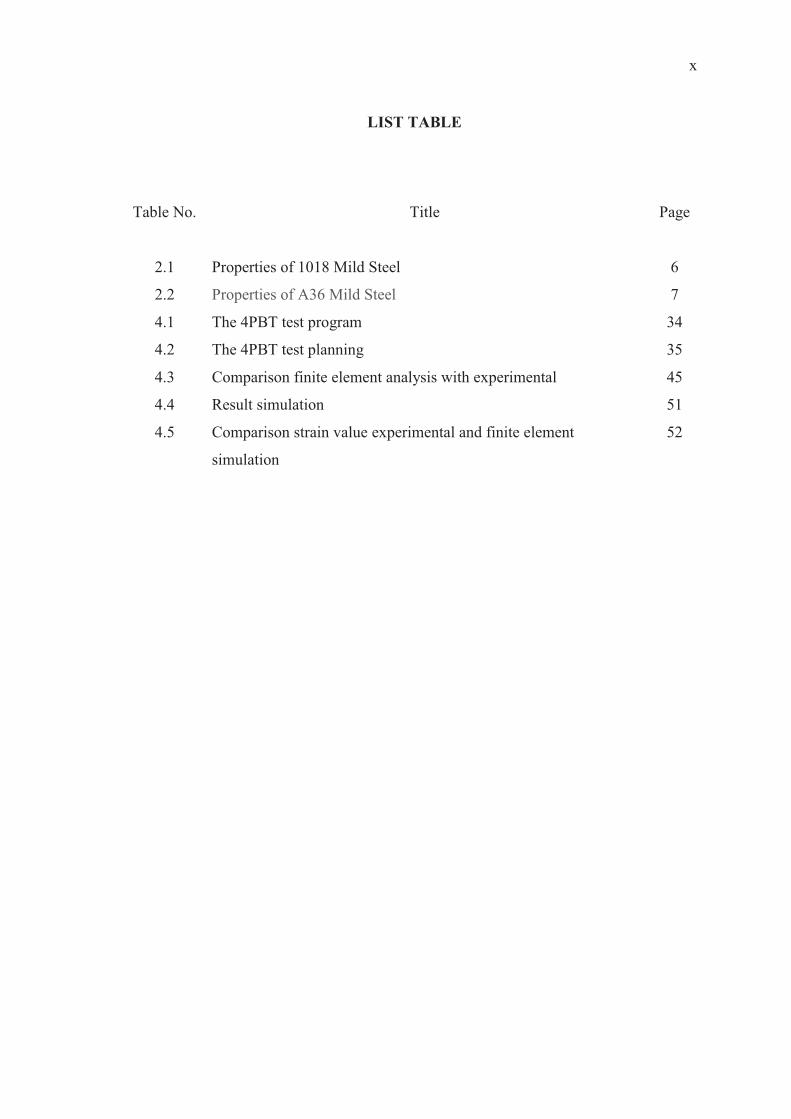
LIST TABLE
Table No.
Title Page
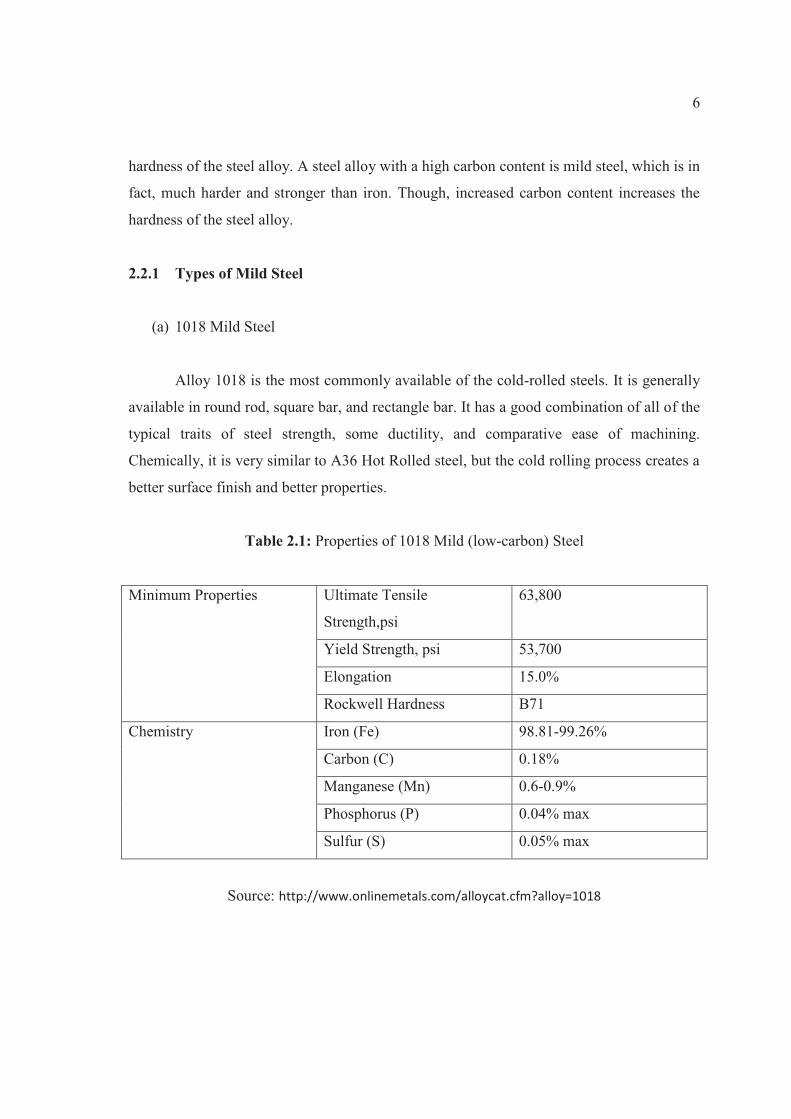
2.1 Properties of 1018 Mild Steel 6
2.2 Properties of A36 Mild Steel 7
4.1 The 4PBT test program 34
4.2 The 4PBT test planning 35
4.3 Comparison finite element analysis with experimental 45
4.4 Result simulation 51
4.5 Comparison strain value experimental and finite element
simulation
52
xi
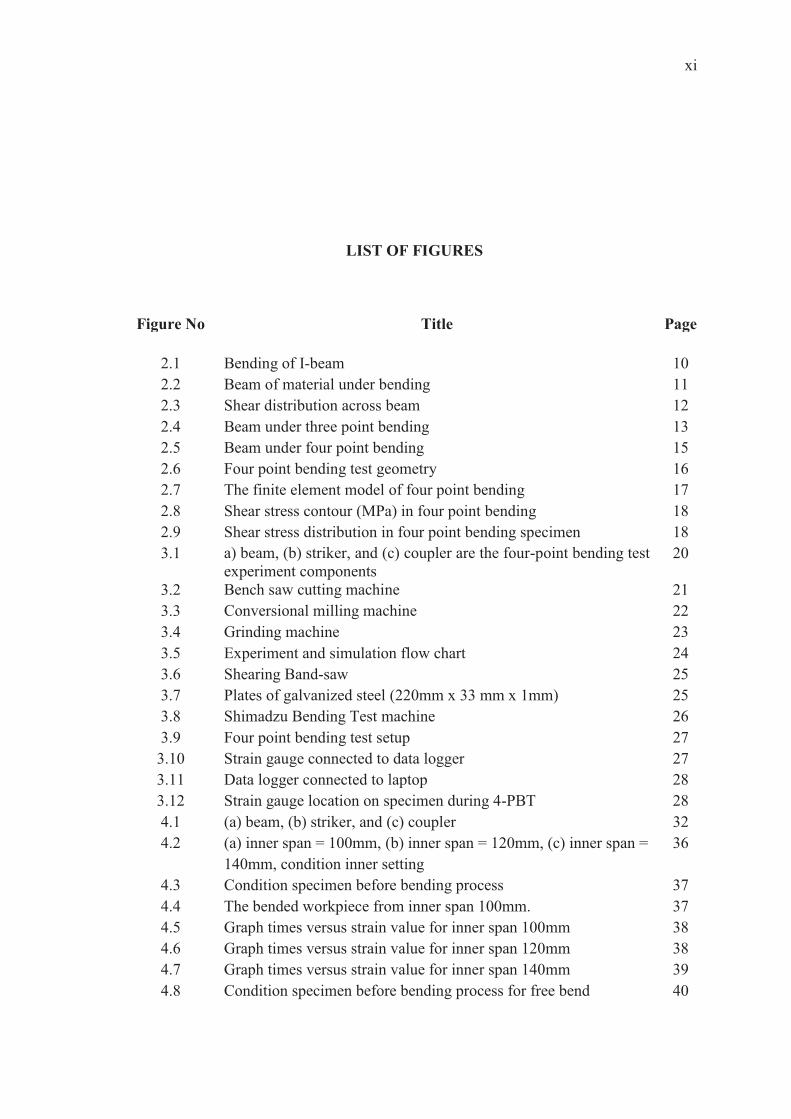
LIST OF FIGURES
Figure No Title Page
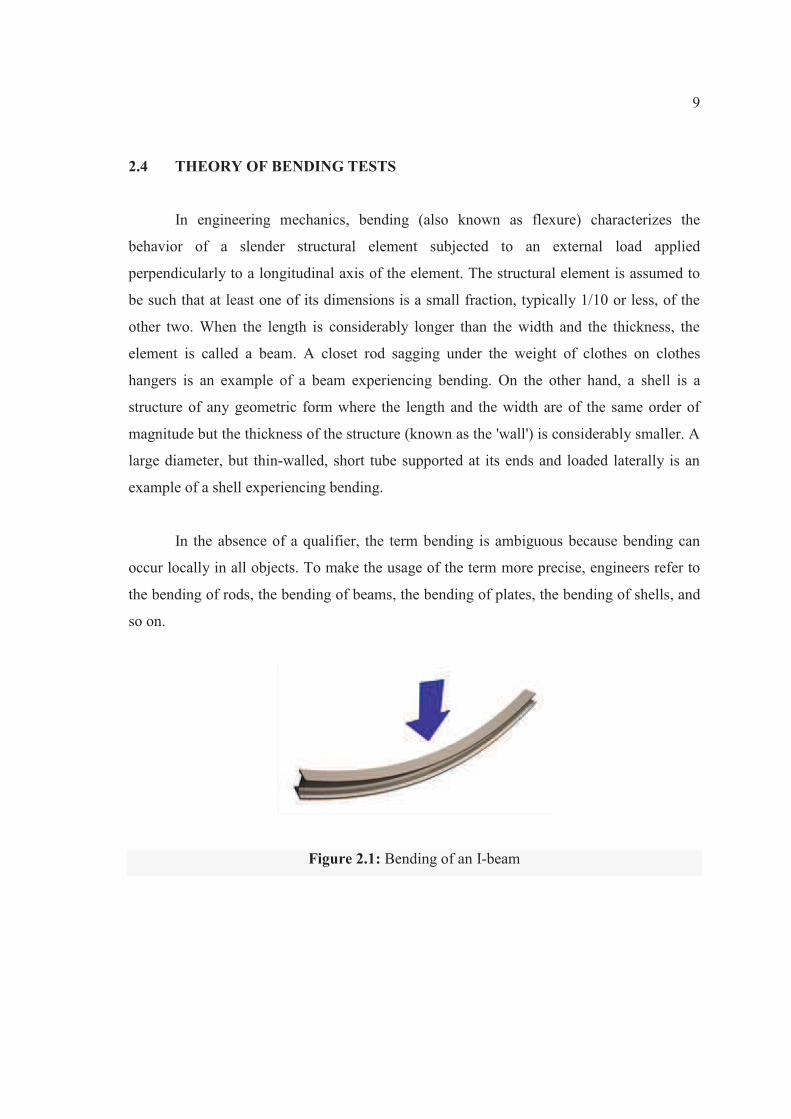
2.1 Bending of I-beam 10
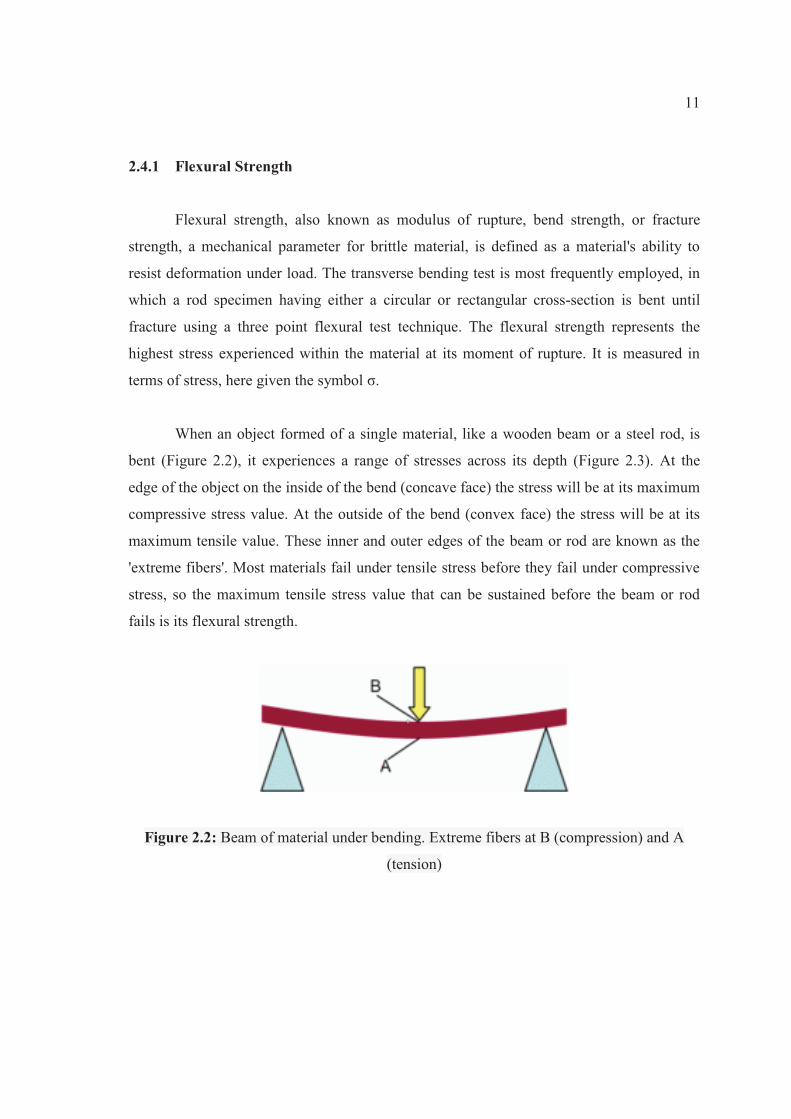
2.2 Beam of material under bending 11
2.3 Shear distribution across beam 12
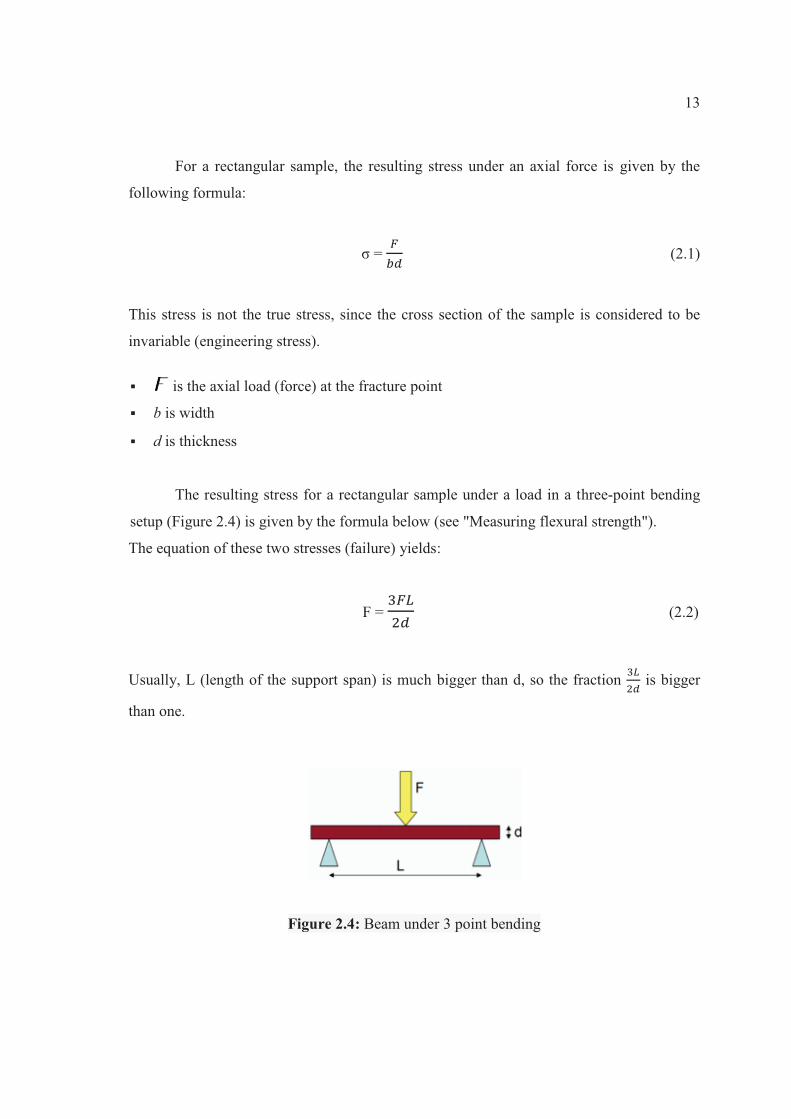
2.4 Beam under three point bending 13
2.5 Beam under four point bending 15
2.6 Four point bending test geometry 16
2.7 The finite element model of four point bending 17
2.8
2.9
Shear stress contour (MPa) in four point bending
Shear stress distribution in four point bending specimen
18
18
3.1 a) beam, (b) striker, and (c) coupler are the four-point bending test
experiment components
20
3.2 Bench saw cutting machine 21
3.3 Conversional milling machine 22
3.4 Grinding machine 23
3.5 Experiment and simulation flow chart 24
3.6 Shearing Band-saw 25
3.7 Plates of galvanized steel (220mm x 33 mm x 1mm) 25