DOE/NASAI0131-1 NASA CR-168139 Experimental and Theoretical Study of Csrnbustion Jet Ignition (NASA-CB-168139) EiPEhlLIEB'l AL AN C NU4-10050 ThBOBETlCAL STUDY bi CCdaUSlIib JET IGYIIICli Final Peport (California Univ.) 138 p HC A07/dP A01 CSCL 21E Unclas 63/07 42339 Daih-Yeon Chen, Ahmed F. Ghoniem, and Antoni M. Oppenheim University of California March 1983 Prepared for NATIONAL AERONAUTICS AND SPACE ADMINISTRATION Lewis Research Center Under Grant NAG 3-131 DEPARTMENT OF ENERGY Office of Basic Engineering Research Under Contract W-7405-ENG-48 and NATIONAL SCIENCE FOUNDATION Under Grant CPE-8115163
Transcript
DOE/NASAI0131-1 NASA CR-168139
Experimental and Theoretical Study of Csrnbustion Jet Ignition
(NASA-CB-168139) EiPEhlLIEB'l AL AN C NU4-10050 ThBOBETlCAL STUDY b i CCdaUSlIib JET I G Y I I I C l i F i n a l Peport (California U n i v . ) 138 p HC A07/dP A01 CSCL 21E Unclas
63/07 42339
Daih-Yeon Chen, Ahmed F. Ghoniem, and Antoni M. Oppenheim University of California
March 1983
Prepared for NATIONAL AERONAUTICS AND SPACE ADMINISTRATION Lewis Research Center Under Grant NAG 3-131
DEPARTMENT OF ENERGY Office of Basic Engineering Research Under Contract W-7405-ENG-48
and
NATIONAL SCIENCE FOUNDATION Under Grant CPE-8115163
'1
Experimental and Theoretical Study of Combustion Jet Ignition
C~aih-Yeon Chen, Ahmed F. Ghoniem, and Antoni K. Gqpenheim University of Califcrnia 9erkeley, California
March 1983
Prepared for Natio~al Aeronautics and Space Administration Lewis Research Center Cleveiand, Ohio 441 35 Under Gren? NAG 3-1 31
Department of Energy Office of Basic Engineering Research Under Contract iV-7405-ENG-48
and
National Scieitze Foundation Under Grant CPE-8115163
DOEINASAI0135 -1 NASA CR-168139
TABLE OF CONTENTS
iii
NOMENCLATURE .......................................................................................... v
a - Transformed length in the tralsformed plane for 0.5 H in the phys-
ical plane
f - Fractional volume of burned medium in a cell
h, - Side length of a cell
N - Width of jet exit
i -- rn - Index for any vortex blob
fir - Unit vector normal to the flame front
P - Non-dirnensional pressure
? - Position vector (=x+iy) non-dimensionalized by H
if - Non-dimensional position vector of flame front
r0 - Blob core radius -
R, - Reynolds number (= Pu U O H ) CL
s, - Strength sf combustion generated volumetric source
Su - Non-dimensional burning rate
t - Time non-dimensionalized by H/ U,
t , - Time instant for starting combustion
to - Time instant for starting ignition
t, - Time instant for peak pressure
At - Non-dimensional time increment
u - X-component velocity in the physical plane
a - Velocity vector non-dimensionalized by the jet inlet velocity U,
Urn - X-ccmponent velocity in the transformed plane
U, - Jet inlet velocity
v - Y-component velocity in the physical plane
- Volume of burned medium
- Volume of a cell
- Y-component velocity in the transformed plane
- Volume of unburned medium
- Complex potential of a blob
- Complex potential of a blob image
- Complex potential of a combustion generated volumetric source
- Complex potential of a combustion generated volumetric source
image
- Complex potential of any vortex blob
- Complex potential of a source
- X coordiriate in the physical plane
- Y coordinate in the physical plane
- Complex position coordinate (=x+iy) in the physical plane
- Complex position coordinate in the transformed plane
- Complex position coordinate of a blob in the transformed plane
- Complex position coordinate of a combustion generated source
in the transformed plane
- Wave length
- Viscosity
- Density of burned medium
- Density of unburned medium
- Standard deviation (= * - Vorticity (=VXQ)
- Vortex strength of a blob
- Non-dimensional del operator
- Non-dimensional Laplacian operator
, . . .
v i i
D - - Non-dimensional substantial derivative Dt .
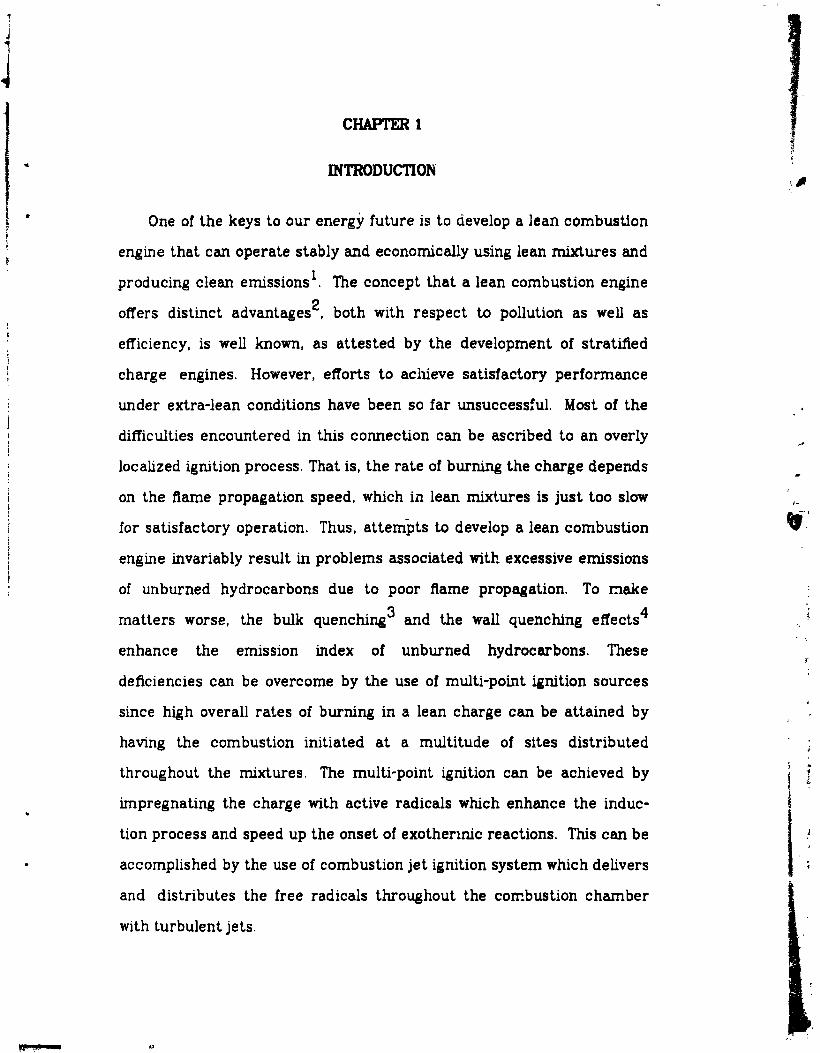
INTRODUCTION'
One of the keys to our energy future is to develop a lean combustion
engine that can operate stably and economically using lean mixtures and
producing clean emissions1. The concept that a lean combustion engine 2 offers distinct advantages , both with respect to pollution as well as
efficiency, is well known, as attested by the development of stratified
charge engines. However, efforts to achieve satisfactory performance
under extra-lean conditions have been so far unsuccessful. Most of the
difficulties encountered in this connection can be ascribed to an overly
localized ignition process. That is, the rate of burning the charge depends
on the flame propagation speed, which in lean mixtures is just too slow
for satisfactory operation. Thus, attempts to develop a lean combustion
engine invariably result in problems associated with excessive emissions
of unburned hydrocarbons due to poor flame propagation. To make 3 matters worse, the bulk quenching and the wall quenchrlng effects 4
enhance the emission index of unburned hydrocarbons. These
deficiencies can be overcome by the use of multi-point ignition sources
since high overall rates of burning in a lean charge can be attained by
having the combustion initiated a t a multitude of sites distributed
throughout the mixtures. The multi-point ignition can be achieved by
impregnating the charge with active radicals which enhance the induc-
tion process and speed up the onset of exothermic reactions. This can be
accomplished by the use of combustion jet ignition system which delivers
and distributes the free radicals throughout the corcbustion chamber
with turbulent jets.
The combustion jet ignition system is a promising means for
5 enhanced Ignition in I. C. engines with lean premixed charge . The sys-
tem generates jets of combustion products containing free radicals and
discharges them into the combustible medium as ignition sources. These 6 initial concentrations of free radicals serve as substitutes for high initial
temperalure in the ignition of combustible mixtures. The use of jets of
free radicals as igilition sources for combustible mixtures offers the fol-
lowing advantages 7
(a) a controllable depth of penetration, so that combustion can be
started a t any desired location within the charge,
(b) zonal pre-turbulization enhancing the combustion process, and
(c) a wide dispersion resulting in multi-point ignition.
Of particular interest to us is the fact that these three properties of - combustion jet ignition can improve the thermal efficiency of the
combustion processes in I. C. engines by promoting h g h overall rates of
burning. To illustrate thls improvement, consider the following example.
In an idealized Otto engine, as shown in Figure 1, the constant volume
combustion process 2-3 is where ignition and inflammation processes
take place. Prior to the ignition process are the intake process 6-1 and
the piston compression process 1-2. The intake valve can induce a
significant amount of which persists until ipriition. The pis-
ton motion during the compression stroke also can induce turbulence,
manifested primarily by the roll-up vortices 'O-ll. These induced tur-
bulences can strongly influence the ignition processes since they exist
prior to ignition. After the inflammation process are the piston expan-
sion process 3-4 and the exhaust processes 4-5 and 5 6 . The higher the
pressure of state 3, the hgher will be the thermal efficiency of the Otto
cycle. The higher pressure of state 3 can be achieved by using the
combustion jet ignition which promotes high overall rates of burnmg.
Figure 2 shows the comparison of the pressure-time traces obtained in
closed bomb experiments for conventional spark ignition, and combus-
t 2 jet ignition. The third curve in Figure 2 shows theoretically calcu-
lated pressure-time trace for constant volume combustion usihg CEC-76
computer The induction period (ti-to) is shorter for combus-
tion jet ignition than for conventional spark ignition. In addition, the
combustion duration (t 4.) is also shorter for combustion jet ignition P 1
than for conventional spark ignition. With shorter induction period and
combustion duration, combustion jet ignition has higher peak pressure
due to fast burning and less energy loss.
A combustion jet ignition system consists of the following Ave distinct
processes:
1. The generation of combustion products containing free radicals.
2. The delivery and distribution of the free radicals by turbulent
jets.
3. I'he induction period.
4. The ignition processes.
5. The inflammation processes.
The understanding of these five processes are crucial to the develop-
ments of the combustion jet ignition system, which is one of the proper
rneans of controlled combustion to govern the action of free radicals.
These flve processes cover the studies of the mechanism of the genera-
tion, the delivery and distribution of free radicals, and of the role they
play in controlling the combustion processes. Reported here are parts of
the studies:
1. Experimental study of the formation processes of the combus-
tion jets of free radicals. A specially designed igniter with
prechamber was used to build up and control the stagnation
pressure upstream of the orifice.
2 . Theoretics1 study of the formation processes of the turbulent
jets by using Chorin's Random Vortex Method (RVM).
3. Theoretical study of the inflammation processes in the turbulent
jets by using HVM implemented with the flame propagation algo-
rithm.
For the study of combustion jet ignition, surveys on bot:. ignition stu-
dies and turbulent jets were performed. In thls chapter, the literature
survey on ignition studies will be presented fist, followed by the litere-
ture survey on turbulent jets.
2.1 Ignition Studies
Ignition is the initiation of a self-sustained exothermic process of
combustion. It is different from inflammation13 which is the initiation
and propagation of a self-sustained flame. Ignition is an essential
ingredient of controlled combustion. In order to understand the mechan-
ism of the ignition processes, several ighition systems are being actively
investigated by researchers. Among those ignition mtLnods, the following
six were selected for literature survey here:
1 Shock Induced Ignition Method.
2. Conventional Spark Ignition Method.
3. Photochemical Ignition Method
4. Flame Jzt Ignition Method.
5. Plasma Jet Ignition Method.
6. Combustion Jet Ignition Method.
2.1.1 Shock induced Ignition Method
The reflected shock tube technique is widely used to obtain data for
chemical reaction rates in the high temperature range. This te-ahnique
providzs a test environment of uniform temperature and pressure behind
reflected shock waves for studying the ignition processes. Many interest-
ing and fundamental physical concepts of ignition processes have been
reported from shock induced ignition studies14-17. These physical con-
cepts of ignition processes are:
1. Ignition has two modes : (i) a constant pressure process
representing the case of mild ignitio- . and (ii) an adabatic pro-
cess representing the case of strong ignition.
2. The demarkation line between these two modes on the pressure-
temperature plane of initial conditions is called the strong igni-
01n s tion limit and is best correlated with the line = constant
for hydrocarbon-oxygen mixtures, where r is induction period, T
is temperature and P is pressure.
3. Higher energy release rates can generate blast waves withn a
smaller volume of gas in the course of ignition.
4. Higher temperature sensitivity of the induction time can cause a
smaller fraction of the gas to be auto-ignited.
5. The dynamic proper+ies of exothermic processes in combustion
are due to the evolution of mechanical energy that is manifested
by pressure waves which affect the flow field.
2.1.2 Conventional Spark Ignition Method
The conventional spark ignition system supplies energy between 10-
50 mJ per electric spark went of a duration of approximately 1 ms and
Ignites homogeneous and stoichometric or slightly rich air-fuel mixtures
without difficulty. The processes of spark ignition depend on many
parameters such as arc energy, peak voltage, duration of discharge,
geometry of the spark gap, and the location of the spark relative to the
particular geometry of the compressed charg=? Generally, lean mixtures
require additional precautions, such as increased electrode distances in
the spark plug, prolonged duration, higher energy, etc. In a current
detailed study of the new aspects on spark ignition , some interest-
ir.g findings of spark ignition were summarized as follows:
1. The detailed structure of the spark event wss divided into spark
head and $ow phast; and separated by a transition regicn.
2. About 10% of the total energy is used to produce the spark
plasma withn 10 ps during the spark head phase for every spark
event.
3. The power input in the spark head phase is very effective and of
high importance in the ignition processes.
4. The temperature of the spark head phase is about 60000 K. Tkis - high temperature causes the initiation of combustion associated
with the generaticn of a pressure wave in the thm spark channel
3 (13 3 mm ) which starts to expand with supersonic velocity.
5. The tempei-ature of the glow phase of the spark event seems to
occur in a temperature range somewhat hqher than 1000 K. The
energy losses to the electrodes during this relatively long time (a
1 ms) become more important. Therefore the glow phase of the
spark carmot be as efficient as the spark head phase with regard
to energy transferred to the gases.
6. The starting diameter of the spark channel for ignition is c; '.er-
mined by the breakdown mechanism. I t is possible to increase
t h s starting diameter (or starting volume) by temporal redistri-
bution of the energy of the Capacitor-Discharge ignition without
changiiig the total energy supplied to the spark.
2 1.3 Photochemical Ignition Method
In the studies of chemical kinetics, photochemical techniques were
developed to experimentally investigate the photolysis processes. By
applying t h s technique to the studies of ignition processes 21-23, some
observations were obtained as listed in the following:
1. Photochemical ignition does not impose a temperature rise but,
instead, increases the concentrations of important reaction
intermediates and sh f t s the thermodynamic state of the mix-
tures into the rapid reaction region via photodissociation.
2. The ignition and flame stabilization can be acheved by using
vacuum ultraviolet radiation (1 4 5 X I O - ~ < A < 1 . 8 0 ~ 1 0 ' ~ cm)
3. The critical concentration of oxygen atoms for ignitlng a 3 hydrocarbon-air mixture is of an order of 1014 atorns/cm .
Higher initial oxygen atom concentrations can reduce the induc-
tion period and enhance flame propagation.
4. At input energies of interest to internal combustion engine sys-
tems and for plasmas generated in certain observed fuels, down-
stream effects of vacuum ultraviolet radiation make no
significant contribution to large improvements in the flame ini-
tiation observed during ignition by hydrocarbon plasmas.
In addition to vacuum ultraviolet radiation, laser light which i~ in the
visible and infrared regions of the spectrum was also successfully used to
lgnite the hydrocarbon-air mixtures. The laser beam is focused at a
small point within the mixtures to acheve breakdown, thereby generat-
ing a plasma kernel, which is approximately 2 cm long and 0.5 cm in
diameter, that acts as a site for the source of ignition. The investiga-
tions. carried out using an ASTM-CFR engine24, demonstrated the
followng results:
1. The laser ignition system has a more rapid pressure rise than
the conventional spark ignition system for all air-to-fuel ratios
tested.
2. The conventional spark ignition system would not run with an
air-to-fuel ratio above 22.5:1, whle with the laser sysi3m the
maximum air-to-fuel ratio obtained was 27.8: 1.
3. Laser systems can reduce specific fuel consumption and have
less HC and CO emissions, but have more NOx emissions.
2.1.4 Flame Jet Ignition Method
The flame jet ignition system can generate a jet of flames that
penetrate deeply into the main charge to initiate thc d a m m a t i o n
processes. The system initiates the combustion in the precharnber first
and causes a pressure difference between the prechamber and main
chamber which are connected by a channel. Before the completion of the
combustion in the prechamber, the flames are inject^ d, due to the pres-
sure difference, into the main chamber through the inlet channel con-
nected to the prechamber. Depending on the pressure difference, the
diameter and the length of the inlet channel wal!, the jet of flames can be
either laminar or turbulent. A s the jet of flames exits the inlet channel a t
a relatively high velocity, bulk quenching can occur. Furthermore, the
jet of flames experiences shearing due to the effects of the channel walls.
As a consequence, the jet of flames can be a jet containing a large
number of small size turbulent flamelets or bulk quenched turbulent ker-
nels if a high enough degree of turbulence can be achieved.
The flame jet ignition system distributes the jet of flames, which can
be bulk quenched, throughout the combustion c l imber to initiate the
inflammation processes. The inflammation processes initiated by t h s
system have been extensively studied by researchers 6m25-32, but the
results of these studies are still controversial and need further investiga-
tion. Gussak et al. 26-28 define this inflammation process initiated by
flame jets as the "LAG" process, i.e. avalanche activation of combustion
process. Applying his so-called "LAG" process to prechamber engines,
Gussak claimed the following:
1. The "LAG" process has nothing to do with the frontal mechanism
of combustion. I t is associated with the mechanism of bulk
inflammation of a combustible mixture. I t has an inflamrntion
delay period.
2. Though the temperature of flame jets is lower than that in the
electric discharge of a spark ignition, nevertheless, flame jets
can reliably ignite the mixture in the main chamber.
3. Flame jets can ignite a wider range of lean mixtures in the main
chamber by a factcr of 1.5-2.0 than a conventional electric spark
can.
4. The main chemically active center in the combustion products of
a rich methane-air mixture is atomic hydrogen.
5. A steady flame jet can stabilize and promote combustion of the
main flow of a combustible medium in a combusrion channel with
no stabi!izer. Tk;is steady flow of flame jets impinges perpendicu-
lar t o the main flow at a small subcritical pressure difference
(abaut half the critical value) between the prechamber and the
main chamber.
6 For an optimal design of a prechamber system, the prechamber
has a relative volume of 2-3% of the main chamber volume and is
equipped with outlet channels whose relative cross section is 2 0.03-0.04 cm per cm3 prechamber volume. Under these
optimal conditions, a mixture of equivalence ratio 1.4-2.5 in the
prechamber can provide the highest specific power of the
prechambzr engine, minimum specific fuel consumption, max-
imum stability and the widest range of effective learung of rnix-
ture in the main chamber.
Besldes Gussak et d.. Wang ot d.32 in China have also studied flame
jet ynition with an application to a simulated rotary combustion engine.
They made the following statements:
1. By using lean mixtures, the flame jet igniter produces jets of
flame whlch either ignite the mixture stream in the main
chamber or extinguish at the mouth of the prechamber.
2. By us' 3 rich mixtures, the flame jet igniter produces jets of
flame which become flarnelets, traveling along the jet path line
for some distance from the outlet. They either extinguish or flash
to ignite the mixture stream in the main chamber suddenly.
3, Under t'i : same stream velocity in the main chamber, flame jet
igmii, ~n using lean mixture is due to high temperature effect, but
flame jet ignition using rich mixture is due to active radicals
effect.
Ba.jed on the2 theoretical chemical kinetic calculations of the igni-
tion mechelism, Creighton et al 6t29130 do not agree Gussak's theory for
the "1 E,S" process engine. They claimed:
1. The flame propagation is dominated by diffusion of radicals whch
eliminates any induction period.
2. The buildup of radical concentrations governs the induction
period. and the rate of fuel consumption is determined by the
steady state radical concentrations.
3. The ignition temperature can be decreased by addition of radi-
cals. Tlus effect becomes especially noticeable when the initial
CH3 concentration is at a level exceeding la of the initial con-
centration of fuel.
4 The calculation; show lower radical concentrations for the "LAG"
process than those Gussak claimed, but the results are of the
same order of magnitude.
5. The "LAG" process is a flame propagation process whch does not
depend on induction type chemi.-;try. The flame produces enough
radicals to achieve steady state radical concentrations ahead of
flame.
Finally. Furukawa et d3' in Japan investigated the controllability of
the time required for combustion in the main chamber using turbulent
flame jets. The results of their studies show that the flame jets f i s t enter
the main chamber and then start iriflamrnation. As the orlAce diameter
decreases, the penetration speed of the leading front of the flame jets
becomes hlgher. Moreover, the combustion duration in the main
chamber tends to decrease rapidly for the rich mixture of propane-air
and n-butane-air than others.
2.1.5 Plasma Jet Ignition Method
The plasma jet ignition method produces a high temperature plasma
in a confined, recessed cavity provided with an orifice. The high tempera-
ture plasma is generated so rapidly that the cavity is pressurized, caus-
ing a jet of plasma to be discharged through the orifice into the combus-
tible medium as an ignition source. The electric power supply for plasma
jet Ignition system discharges a t a relatively low voltage and high current
through the spark whlch is generated in a conventional manner by a h g h
voltage, low current ignition system.
Considerable research work 33-41 has been done on the studies of
plasma jets and their ignition characteristics. Some observations were
obtained as listed in the following:
1. Plasma jets enter the main chamber in the form of a turbulent - plume which is imbedded in a blast wave headed by a hemispher-
ical shock wave.
2. The blast wave effects are dissipated by the time combustion
starts. After a delay typically of an order of 1 msec, ignition
takes place in the turbulent zone of the plume.
3. The depth of penetration of the jets is a function of their initial
velocity.
4. The burning speed is initially quite high and decreases monotoni-
cally as the flame kernel expands.
5. With provisions made to fill the cavity with different feedstocks,
the most effective for ignition were hydrocarbons, among whch
those initially in liquid state were particularly effective.
6. Plasma jets can ignite gaseous mixtures below the normal
flammability limit.
7. A plasma jet ignition system requires relatively high electric
power, a .g. 1 J
8. The HC and XO emissions are increased and the CO emission is
slightly decreased.
2.1.6 Combustion Jet Ignition Method
The combustion jet ignition system can generate jets of combustion
products containing free radicals and discharge them into the combusti-
ble medium as ignition sources.
The combustion jet ignition method is very similar to the flame jet
lgnition method. The only difference between these two methods is that
the latter method generates a jet of flames and the former method pro-
duces a jet of con~bustion products. The compositions of flame jets are
incomplete combustion ~ r o d u c t s containing flames, but the compostions
of combustion jets are complete combustion products. In order to study
the flame jet ignition mechanism, one has to understand the effect of the
degree of incompleteness of combustion products on ignition processes.
In doing so, a study of combustion jet ignition. which uses a jet of com-
pletely combusted products, has to be performed first. Then the degree
of incompleteness for jets of combustion products is varied to study
flame jet ignition.
The combustion jet ignition method is also very similar to the EGR
lgnition method whch distributes a virtually i d r i t e number of ignition
sources throughout the fresh charge to initiate combustion in bulk a t a
proper rate of burning. The EGR ignition system is a system using a
sufficiently large amount of exhaust gases to ignite their mixture with the
fresh charge. Such a system has been developed, up to commerical
application, by Onishi st d . 42 with a remarkable proof of clean emissions
and higher thermal efficiency.
Up to now there is no literature showing the characteristics of the
combustion jet ignition method. But, with the knowledge obtained from
both flame jet ignition snd EGR ignition studies, a special combustion jet
igniter with a prechamber for generating combustion jets has been
developed a t University of California a t Berkeley. The igniter can also
generate jets of flames with varying degrees of incomplete combustion
for studying flame jet ignition.
2.2 Turbulent Jets
Turbuleilt jets are the major means-of controlled combustion for the
delivery and distribution of free radicals, which are essential intermedi-
ate constituents. They serve as multi-point ignition sources to improve
the thermal efficiency of the combustion processes in a lean combustible
mixture. In order to understand the fluid mechanic properties of tur-
bulent jets, a survey si itiikl~lent jets was performed.
Turbulent jets ]lave been extensively ~ t u d i e d ~ = - ~ ' both theoretically
and experimentally. The theoretical studies of p1ar.z or axi-symmetric
steady turbulent jets were performed traditionally using self-similar
A recent study4' used the "pressure-correction"
numerical method to approximate two-dimensional, time-dependent tur-
bulent jets. For the case of steady turbulent jets with combustion, e.g.
fuel jets45146, the plane or axi-symmetric fuel jets were approximated
using self-similr method implemented with the Schwab-Zeldovich
transformation technique. All the studies discussed above do not show
the detailed structure of turbulent jets such as the large-scale eddy
structure of turbule.lt jets.
Turbulent jets have also been investigated experimentally. A variety
of experimental data on plane and axi-symmetric turbulent jets without
combustion have demonstrated the self-similar feature of turbulent
jets4'. More recent experirrrental interests are focused on the formation
of the turbulent plume wit! and without c o m b ~ s t i o n ~ ~ . This experimen-
tally observed turbulent plume has been actively investigated by many
researchers as mentioned in sections 2.1.4 and 2.1.5, in an attempt to use
it as an ignition tool. A detsilzd experimental study of the axi-symmetric
turbulent jets with and without combustion has shown the existence of
the large-scale eddy structure of turbulence4?. The large-scale eddy
structure of turbulent jets, as shown in flgure 3, is organized in the form
of a staggered array of vortices of alternating circulation. Thls large-
scale eddy structure of turbulent jets, as with other large-scale eddy
structures in other turbulent shear flows, dominates the mixing and
entrainment processes.
The experimental setup, as shown in Figure 4 in the form of a block
diagram, consists of the following systems for a combustion jet ignition
study,
1. Combustion Jet Igniter
2. Main Chamber
3. Flow Mixing System
4. Optical System
5. Electric Spark System
6. Trigger h n e
3.1 Combustion Jet Igniter
The combustion jet igniter, as shown in Figure 5, was designed to gen-
erate jets of combustion products containing free radicals and discharge
them into the combustible medium as ignition sources. The igniter has a
cylindrical chamber, so-called prechamber, of 1.59 cm in diameter and
4.37 cm in length. The volume of the prechamber is 6.43 cm3 and can be
varied by adding insert sleeves. The prechamber is Atted with gas inlet,
purge outlet and jet orifice. The mixtures, coming from the flow mixing
device, flow into the prechamber through the gas inlet located at the top
of the prechamber. The mixtures can be purged from the precharnber
through the purge outlet located a t the side wall near the oriflce plate.
After continuous purging of the prechamber for about 3 minutes, the
fresh mixtures are ignited, with both gas inlet and purge outlet valves
closed. Ignition in the prechamber is achieved using an electric spark.
head and the electrode protruding from the side wall of the inserted
sleeve. The high electric voltage is applied through the h g h voltage lead
to the valve rod. The valve rod head sits on the teflon seat housed In the
orifice plate. The orifice plate housing the teflon seat can be inter-
changed to provide variable-sized oriflce diameters.
The motion of the valve rod is controlled by a fast acting 19-SD-40
solenoid. To close the valve, the valve rod is pushed down to seal the
orifice by spring force. To open the valve, the valve rod is quckly pulled
up by magnetic force induced by the solenoid. The motion of the valve
rod is measured by a Bently Nevada displacement transducer of which a
callbration curve is shown in Figure 6.
Before the electric spark occurs, the gas inlet and the purge outlet
valves are closed with a pressure tight seal, while the orlfice is sealed by
the valve rod head whch is pushed down by a spring. Once the mixtures
in the prechamber are ignited and combusted, the prechamber is pres-
surized by combustion products. The pressure of the precharnber is
measured by a Gstler Model # 601 pressure transducer and recorded on
a Tektronix Model # 549 storage oscilloscope. The completely combusted
products can be discharged into the main chamber through the orlAce in
the form of jets. This is done by activating the solenoid tcr open quickly
the valve after the peak pressure is reached.
By properly adjusting the timing for opening the valve before
combustion is completed, i , e . , before peak pressure is reached, the
combustion jet igniter can generate jets of flames whch are different
from jets oi combustion p rodu~ t s . In order to be able to study the
diflerence between combustion jet ignition and flame jet ignition, a "splk-
ing circuit", as shown in Figure 7, was designed. This allowed the valve to
be opened sooner enabling the incomplete combustion products to be
discharged into the main chamber if desired. This spiking circuit powers
the solenoid by initially raising the voltage across the solenoid coils to
150 volts to overcome the coil's impedence. Once the spiking circuit is
triggered, the current flows charge the capacitor and cut the hlgh -?oi-
tage, leaving 30 volts to keep the solenoid energized. This spiking circqlit
reduces the activation time, the time required for the solenoid to
opening the valve, to 1 ms and cut the total opening time to 6 ms.
3.2 Main Chamber
The main chamber is a cylindrical, stainless steel explosion vessel
fitted with optical glass windows 9 cm in diameter with a distance of 9 cm
3 between their inner faces. The volume cf the explosion vessel is 572 c m ,
and its viewing cross-sectional area is 64 cm2. The explosion vessel is
fitted with four instrument plugs, one of whch is a t the top of the vessel
and fitted with the combustion jet igniter as shown in Figure 8. Two addi-
tional plugs were used for purging and Alling the vessel. The last plug was
fitted with a Kistler Model # 601 pressure transducer, the pressure sunal
from whlch was recorded on a Tektronix Model # 549 storage oscilloscope.
The jets of combustion products, coming from the orifice of the
prechamber, enter the main chamber fitted with optical glass windows
suitable for Schlieren photography. The formation processes of combus-
tion jets in the main chamber, filled with air a t atmospheric pressure and
temperature, were recorded on high-speed motion picture films. More-
over, if the main chamber is fUl.ed with a combustible medium, then the
ignition and inflammation processes of the medium caused by combus-
tion jets can be investigated.
3.3 Flow Ahing System
In order to measure ihe compositions of mixtures used in the
prechamber, a continuous llow mixing device was used for the sake of
safety and easy operation. A schematic diagram ol' this system is shown
in Figure 9. This system is an modifled version of the continuous flow
miang apparatus designed by ~ a m e l ~ l , which used hypodermic needles
to measure flow rates. The advanced system uses jewel orifices to meas-
ure tlow rate; The flow is insured to be choked flow at the ;ewe1 orifice
exit by maintaining a stagnation pressure upstream of the oril.,e a t least
twice as large as the orifice downstream pressure. Under the critical flow
conditions, the mass flow rate through the jewel orifice is e linear func-
tion of the upstream stagnation pressure and independent of the orillce
downstream pressure. This line= de2endence of critical mass flow rate
on the orifice upstream stagnation pressuise was calibrated for each jewel
orifice using a "Precision" Wet Test Meter. The calibration c w e s for H2,
O2 and C3H8 gases are shown respectively in Figures 10. 11 and 12.
In an attempt to obtain better accuracy of mixture compositions, the
continuous flow mixing system with 3 orifices was calibrated again using
HP 5750B Gas Chromatograph. The calibration curves are shown in Fig-
ures 13, 14 15 and 16. In o5taining these curves, the upstream stagnation
pressures of any two orifices were maintained constant but that of the
third orifice was allcwed to vary. The lowest upstream stagnation pres-
sure of these three orlAces was verified as being a t least twice the down-
stream pressure of the orifices, thus insuring critical flow conditions for
all orifices.
3.4 Optical System
Schlieren photography was used in all combustion jet ignition experi-
ments to record the formation and the inflammation processes of
combustion jets. The main chamber, i.s. explosion vessel, was placed in
the collimated beam of hght created by a conventional Z configuration
Sci-Jleren optical system, as shown in Figure 17. The mirrors used were
152 mm in diameter and of 1.22 meter focal length. A t the focus of the
second n-rror was a circular aperture stop or a knife edge to discrim-
mate the deflected light. Additional lenses and filters, not shown in Fig-
ure 17, were used to insure proper imaging and exposure of the turbulent
plume in the explosion vessel. The Schheren movies were taken usir4 a
1000 watt Xenon continuous light source and a Hycam b h speed camera
filming at 5500 frames per second. The timing marks were made on the - film by the camera every 1 rns.
k5 Electric Spark System
The ignition circuit, as shown in Figure 18, used to energize the
52 combustion jet igniter, is similar to the one used by Morganstern et a1 .
The device uses a transformer to increase the voltage from 110 volts A. C.
to 700 volts A. C.. Then, a rectifier converts the signal to 500 volts D. C.
for the primary loop of a standard auto ignition coil. The magnetic field
generated by the D. C. voltage is then eliminated by cutting 08 the
applied vol~age with an S.C.R. transistor switch. Ths generates up io
40003 volts in the secondary loop of the ignition coil that can short-
circuit the isolated spark gap and produce a spark in the prechamber.
2 2
3.6 Trigger Line
As shown in Figure 4, a trlgger signal enters the Hycam camera to
activate the motion of the film. When the camera attains its pre-set
speed for film motion, it sends out 2 signals to trigger respectively the
oscilioscope and the ignition circuit. Then, the ignition circuit produces a
spark in the prechamber and the oscilloscope gets ready for receiving
the pressure transducer slgnals. In addtion, the burlt-in delay circuit in
the oscilloscope sends out a delayed signal to trigger the splking circuit
to activate the solenoid to open the valve. The mixtures, with known
compositions, are ignited by the electric spark and combusted to pres-
surize the prechamber. The valve remains closed until the peak pressure
is reached at which time it opens. Once the valve is open, the jets of
combustion products are generated and enter the main chamber
equipped with optical glass windows for taking Schlieren movies. The for-
mation and the inflammation processes are recorded on the Schlieren
movie film by the camera. In addition, the displacement-time trace for
valve motion and the pressure-time traces for the prechamber and the
main chamber are recorded on the oscilloscope.
MPERILCENTAL RESULTS
A series of tests were conducted to study the formation process of
combustion jets. The experimental data obtained in &s study consists of
high speed Schlieren movies of combustion jet formation in the main
chamber with synchronized pressure and valve motion records. Of par-
ticular interest to us are the data of initial jet penetration speed which
are listed in Table 1 These initial jet penetration speed were obtained
from the linear regression analysis for the jet penetration depth data in
the initial stage. The lineai- regression function for each test run is listed
in Table 2. All of the results are grouped into 3 cases and are presented
in the following sections. -
This case used a CgH8/kr mixhire of equivalence ratio p = 1.0 in the
prechamber to study the formation processes of combustion jets. The
3 prechamber volume was 4.0 cm and its orifice diameter was 3 mm.
Figure 19-a shows the pressure-time trace of combustion in the
prechamber with all valves clased. The peak pressure for this test run is
19 pslg. Thls pressure-time trace is used as a reference for comparison
in this case study.
Figure 19-b presents the presure-time trace of combustion in the
prechamber with valve opening starting at peak pressure. The spiking
circuit shown in Figure 7 was not used in this test run. The
displacement-time trace, which is an indication of valve motion, is aslo
shown in Figure 19-b. The valve starts to open 4 ms after the electric
spark occurs and takes 7 ms to fully open. After the valve opens, the
pressure decays a t a rate faster than that of the reference pressure in
Figure 19-a. The formation processes of the combustion jets for this test
run are shown in Figure 20. The jets enter the main chamber, whlch is
Bled with air a t atmosphzric pressure and temperature, through the 3
rnrn orifice in the form of a turbulent plume. The turbulent plume
develops as it travels downstream. There are no flame fronts or
inflammation processes observed in this turbulent plume. This is
because the turbulent plume consists only of completely combusted pro-
ducts. This is a typical case of combustion jets because the valve opens
at or after the peak pressure.
4.2 Case JI
In this case study, the spiking circuit was applied to reduce both the
delay time required to start opening the valve and the valve opening
duration. As shown in Figure 21-a, the prechamber was pressurized up to
24 psig with air, then the valve is suddenly opened using the solenoid
applied with or without spiking circuit. The delay time required to start
opening the valve is reduced from 4 ms to 2 ms and the valve opening
duration was also cut from 7 ms to 4 ms. The precharnber pressure
decays faster for the test run with spiking circuit than for that without
the spiking circuit. This indicates that the air was discharged into the
main chamber through the valve faster for the test run with spiking cir-
cuit. These reductions in the time periods for the discharge of the
combustion jets into the main chamher are very important in the
combustion jet ignition study.
This case again used a CgH8/Air mixture of (p = 1.0 to study the for-
mation process of the combustion jet. The valve opening time is varied in
this case to investigate its effect on the turbulent plume formation
processes and the jet penetration depth trace. As shown in Figure 21-b,
the reference pressure-time trace for this case has a peak pressure of 19
ysig. All the results, as shown if Figures 22-27 for this case study are
presented in the form of pressure and valve motion records with jet
penetration depth trace.
Tigiift? 22 shows the experimental results for a test run wit.h valve
cyening 3 ms after peak pressure is reached. This time delay for starting
valve opening after the peak pressure was found to be consistent witn the
time period on the 16 mm movie film from the beginning time marker to
the f i s t frame of the jets. The pressure-time trace of this test run repro-
duced the reference pressure-time trace until the valve started ope-.
When the valve starts opening, the pressure is 11 psig and starts decayino - with the production of the combustion jet. The time period for generat-
ing the combustion jet for thls test run was 4 ms. The jet penetration
depth data were obtained by measuring the length from the orlAce to the
turbulent plume tip which were recorded on the 16 mm Schlieren =ovie
film. The regression line of the jet penetration depth data shows a pene-
tration speed of 24.4 m/sec for the turbulent plume in the initial stage.
But, when the turbulent plume travels closer to the bottom wall which is
9 cm from the orifice, its penetration speed decreases monotonically.
Figures 23 and 24 show the experimental results for two test runs
with valve opening 2 ms and 1 rns respectively after peak pressure. The
pressures a t the moment tl- valve starts opening for these two test runs
are i5 psig and 17 psig respectively which are higher than last test run
shown in Figure 22. The time period of generating combustion jets for
these two test runs is 5 ms. The initial penetration speeds of the tur-
bulent plume for these two test runs are 29.5 m/sec and 30.6 m/sec
respectively, and decrease monotonically when they travel closer to the
wall.
Figure 25 shows the experimental results for a test run with the valve
operung exactly when peak pressure is reached. T h peak pressure of 19
psig is the maximum pressure one can use to produce combustion jets
for this case study. For this test run the time period for generating
combustion jets is 6 ms and the intial penetration speed of the turbulent
plume is 30.8 mlsec. The penetration speed again decreases when the
turbulent plume travels closer to the wall. The jet penetration depth
trace of this test run is compared with that of the test run shown in Fig-
ure 22. This comparison, as shown in Flgure 26, demonstrated that t h s
test run w t h hlgher initial stagnation pressure upstream of the orifice
has higher initial penetration speed of combustion jets.
Figure 27 shows the experimental results for a test run with valve
opening 2 ms before the reference peak pressure is reached. Thiz is a
test run with valve opening starting before combustion in the pechamber
is completed. Therefore, combustion in the prechamber continues whle
the valve is opening. Finally, a peak pressure of 19 psig can be reached.
The pressure a t the rnoment the valve starts opening is 14 psig. The time
period of generating combustion jets is 5 ms and the initial penetration
speed of combustion jets is 27.7 m/sec for this test run. As the turbulent
plume travels closer to the wall, its penetratio.1 speed decreases mono-
tonically a t a rate slower than all the previous test runs. I t is interesting
to note that the jet penetration depth trace for this test run is quite simi-
lar to that for last test run shown in Figure 25. This indicates that contin-
ued pressurization due to combustion in the prechamber after the valve
opens can maintain the initial jet penetration speed until the turbulent.
plum? travels very close to the wall. Moreover, it is also found that flame
fronts exist in the turbulent plume recorded on the 16 rnm Schlieren
movie film for this test run. Therefore, this test run silould be con-
sidered as a test run of flame jets.
The results of tlus case study can be surnmzrized as follows. The
penetration spzed of combustion jets is initially constant and decreases
monotonically as the combustion jets travel closer to the wall. The con-
stant penetration speed of combustion jets is proportional to the initial
stagnation presure of the orifice for the same stoichiometric mixture. A
flame jet can be generated with valve opening starting before the refer-
ence peak pressure is reached.
4.3 Case rlI
This cLse used a CH4/Air mixture to study the formation process of
the combustion. The equivalence ratio of the CH4/hr mixture is varied in
this case to investigate its effect on the turbulent plume formation pro-
cess. The spiking circuit was also applied in this case.
Figures 20-a and 28-b show the reference pressure-time traces for
the CH4/Air mixture of equivalence ratios q = 1.0 and (p = 1.2 respec
tively. The peak pressure for q = 1.0 is 18 psig and for q = 1.2 is 11 psig.
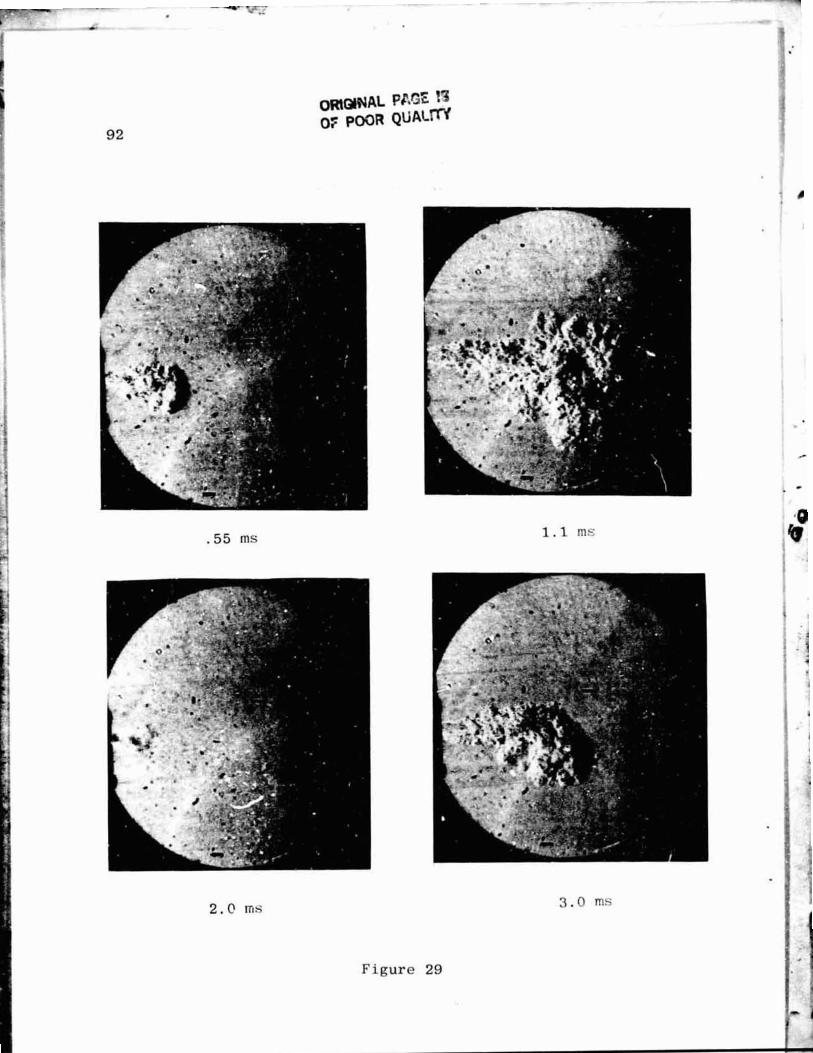
The experimental data inciuding the cinematographic Schlieren
records of combustion jets for q = 1.0 are shown in Figure 29 and 30. Ths
test run of q = 1.0 starts valve opening a t the peak pressue of 18 psig.
The tinlo period of generating combustion jets is 5 ms. The initial pene-
tration speed of combustion jets is 22.7 m/sec and decreases monotoni-
cally as they travel closer to the wall. The penetration depth trace of t h s
test run is compared with that of the test run shown in Figure 25. Ths
comparison, as shown in Figure 31, demonstrates that combustion using
a stoichiometric CgH8/Air mixture in the precharnber shows much hgher
initial penetration speed of combustion jets than that using a
stoichiometric CH4/Air mixture although the initial stagnation pressure
difference between these two test runs is 1 psi. Ths interesting com-
parison needs further investigation.
The experimental data including the cinematographic Schlieren
records of combustion jets for ~p = 1.2 are shown in Figures 32 and 33.
This test run of 9 = 1.2 starts the valve opening a t the peak pressure of
11 psig. The time period of generating combustion jets is 5 ms. The ini-
tial penetration speed of c~rnbustion jets is 31.6 rn/sec and decreases
monotonically but not until they are much closer to the wall than in pre-
vions cases. The penetration depth trace of t h s test run is compared
with that of the test run shown in Figure 30. This comparison, as shown
in Figure 34, demonstrates that combustion using a rich mixture i r the
prechamber tends to have higher initial penetration speed of combustion
jets than that using a stoichiometric mixture although the former has
lower initial stagnation pressure than the latter. This interestmg obser-
vation needs further study
The experimentaal data including the cinematoqraphc Schlieren
records of combustion jets for (P = 1.0 are shown in Figures 35 and 36.
This test run starts opening the valve 1 ms after the electric spark. The
comb~stion in the precharnber begins when the valve starts to open.
Hence, the combustion cannot pressurize the prechamber up to a higher
peak pressure. The peak pressure for this test run is 3 psig and the pres-
sure at the moment the valve starts opening is 1 psig. The time period of
generatmg combustion jets is 10 ms. The initial penetration speed is 19.5
m/sec whlch is lower than any previous test runs. This initial penetration
speed decreases monotonically when the turbuient plane travels closer to
the wall. Ths is a test run of flame jets. Its jet penetration depth trace is
compared with that of the test run shown in Figure 30. The comparison,
as shown in Figure 37, indicates that although the initial stagnation pres-
sure upstream of the orifice for flame jets is very low, flame jets have a
comparable jet penetration speed as combustion jets. This interesting
observation needs further study.
THEORETICAL MODEX AND NUMERICAL TECHNIQUE
In order to interpret and understand the physical phenomena
observed in the turbulent jet experiments and furthermore to explain the
formation processes of the large-scale eddy structure of turbulent jets,
the theoretical studies of the formation and inflammation processes of
turbulent jets were performed using Chorin's Random Vortex Method
implemented with the flame propagation algorithm. In this chapter, the
theoretical models for the problems of turbulent jets with and without
combustion are presented first, followed by descriptions of the numerical
techniques used to solve the problems.
5.1 Theoretical Model
The problem of turbulent jets in this study is simplified by assuming:
1. The fluid is incompressible and two-dimensional;
2. The pressure of the entire flow field is constant;
3. Gravitational field is neglected; and
4. The decoupled energy equation is neglected.
With consideration of exothermic effects of combustion incorporated
rnto the turbulent flow field, two more assumptions are further made as
follows:
5. The flarile with a specrfied constant normal burning relative velo-
city is an interface where chemical reactions occur infinitely fast
between reactaats and products having constant but different
densities; and
6. The exothermic effects of combustion on the turbulent now Aeld
are manifested by the dynamic effect of combustion generated
volumetric sources, fiashmg over the flow Aeld, and accompanied
with the transformation of reactants into products.
After stating the above idealizations, the non-dimensional forms of
mathematical models for the two cases without and with combustion are
described in sections 5.1.1 and 5.1.2 respectively.
5.1.1 Turbulent Jets without Combustion
The non-dimensional governing equations, Navier-Stokes equations,
for the 2-D, incompressible, free jet without combustion are:
Continuity equation 0.a = 0 (5.1)
Dit Momentum equation r= -VP + -b! a - R.
The initial and boundary conditions for the problem are physically
specified as follows:
Initial conditions fi = (0,O) for the entire flow Aeld
Boundary conditions tz = (0,O) at the solid boundaries (5.3)
a = (0,l) at the inlet
The problem with elliptical governing equations is well posed after all
the peripheral boundary conditions and the initial conditions are
specified.
If vorticity D = Vxi i is used, then the mathematical model is
transformed into the following governing equation:
with Zj = 0 for the initial condition
G = Iinite a t all the boundaries satisfying the boundary
conditions listed in Equation (5.3) (5.5)
The problem of turbulent jets without combustion remaining to be
solved is the governing equation (5.4) expressed in terms of w with the ini-
tial conditions and boundary conditions listed in equation (5.5). The vor-
tlcity distributions, determining the turbulent jet flow field, at any time
instant are unknowns in thls mathematical model and were approximated
by using Random Vortex Method. The procedures of obtaining vorticity
distributions at any time instant by using Random Vortex Method wil l be
discussed in section 5.2.
5.1.2 Turbulent Jets with Combustion
The mathematical model in sectibn 5.1.1 is further extended to
include the combustion processes. Uslng assumptions 4 and 5 mentioned
in section 5.1, the complicated combustion processes are idealized as the
transformation of reactaqts into products a t the flame fronts with the
combustion generated volumetric sources flashing over the whole 3ow
field. Therefore, the exothermic effects of combustion are expressed in
terms of the dynamic effects of combustion generated volumetric
sources located a t the flame fronts. 1'1 ordtr to obtain the volumetric
source distributions a t any time instant, one has to kn3w the locations of
flame fronts which are described by the following flame propagation equa-
tion:
Now the mathematical model for turbulent jets with combustion can
be set up by adding equation (5.6) into the mathematical model of sectior!
5.1.1. The unknowns for the mathematical model with combustion are
mstantaneous flame front locations, i . e . volumetric source distributions,
and instantaneous vorticity distributions which determne the turbulent
jet flow fleld with combustion. The volumetric source distributions and
vorticity distributions at any time instant in the flow fleld were approxi-
mated by .sing Random Vortex Method implemented with the flame pro-
pagation algorithm. The procedures of obtaining these dstributions at
any time! instant will be discussed in section 5.2
5.2 Numerical Techniques
This section explains the numerical techniques and procedures used
to approximate the solutions for the mathematical models listed in sec-
tion 5.1. The section begins with the explanation of the Random Walk Con-
cept and then performs the Schwarz-Cfiristoffel Transformation whch is
needed to consider the invisicid interaction of the vortices. Finally, the
section explains how the Random Vortex Method and the flame propaga-
tion algorithm were used to obtain the vorticity distributions and the
volunetric source distributions at any time instant.
5.2.1 Random Walk Concept
The vorticity transport equation (5.4) indicates t5at if one follows the
fluid element with a certain amount of vorticity, then he Ands that the
time rate of vorticity change is due to the vorticity diffusion. But in
terms of the slatistical point of view, Chorin proposed the Random Vortex
Concept 53-57 to enable us to explain the equation (5.4) as the following
idea. If one follows the fluid element with that specified amount of vorti-
city, then he finds that the motion of the fluid element with a specified
amount of vorticity is random. Here the fluid element of finite core and
C'RIGINAL PAGE 1.Q 3F POOR QUALllV
wlth a small amount of vorticity is called a vortex blob and its diffusion
processes are explained in terms of random motion based on a Gaussian
distribution. The mathematical background for the idea of random
motio11. the so-called random walk, is discussed as follows:
Consider initially imposing a fluid element with a speclAed amount of
vorticity in an infinite motionless domain, then the vorticity transport
equation is:
The solution for equation (5.7) with initial conditions w = 6 (r), a delta
function at the origin, and boundary conditions w = 0 a t inflniiy is
This solution is a zero mean Gaussiac Distribution with one standard
deviation a = pK. Ths d~stribution can be followed by the normal
random variable, named the random walk of ?he vortex blob with vorticity
w . The normal random variable, i . e . random walk, is further assunled to
be tlrne-independent to facilitate the study of transient formation
processes of turbulent jets. Therefore, the random walk, which assumes
the Gaussian Distribution of ze-o mean and one standard deviation
0 = pK, a t any trine instant t = mAt can be obtained by rn times the
summation of random walks which follow the Gaussian distribution crf
zero mean and one standard dewation o = p7
O M W A L PAGE IiJ 3F POOR QllALlTY
With the use of the random walk concept mentioned above, the dis-
placement of a vortex blob was obtained at any time instant by adding
the normal random displacement due to random walk to the expected
displacement due to the inviscid interactions between vortex blobs. The
procedures in obtaining the vorbcity distributions at any time as ta t are
discussed in section 5.2.3.
5.2.2 Schwarz€hristdel Transformation
In order to facilitate the consideration of the inviscid interactions
between vortex blobs or a vortex blob and a source, the Z-plane (physical
plane) was transformed into the (-plane by performing the following
Schwarz-Christoflel transformation:
dZ 1 4pT -= - d < fl <
where the 2-plane is non-dirnensionalized by H a n i the (-plane by a. The
Z-plane and <-plane were plotted in Figure 38 with points in the Z-plane
being corifomally mapped into those in the <-plane. As a result of t h s
transformation, the uniform flow coming out of the Inlet channel was
mapped into a source located a t the origin in the (-plane.
In the (-plane, the complex velocities for the folloo~lry two-
dimensional simple flows are modified5? to be
for the source s located at the
origin
d Wb -= 1 (-<b I for any vortex blob b generated ~ T M = ( I wb I r0 1 (<-cb 1
from walls
d Wc -= s c I <-<c I for any volumetric source c gen- d ( 2rI.w ( I <-CC i t~~ 1 (<-iC 1
erated from combustion
O R I ~ N A L PAGE E OF POOR QUALW
where ob is vortex strength and. sc is volumetric source strength. The
1 pu -.l)@!iL volumetric source strength 4, is determined5? to be -(- 2 Pb dt '
The complex velocities here are non-dimensionalized by the uniform velo-
city Uo a t the inlet of the channel.
To determine the velocity of any vortex blob m induced by other vor-
tex blobs, the source, combustion generated volumetric sources and
their images due to the existence of the walls, the complex velocities for
every simple flow are superimposed as follows:
where bg stands for the image of vortex blob b and cg stands for the
image of volumetric source c.
dW, The induced velocity -( = U, +-iVm) of any vortex blob m is the
d t velocity with which we follow to observe the random walk of t h s vortex
blob m. Ths material velocity contributes to a displacement, so-called
expected displacement in the statistical point of view, which is equal to
d W , - d <
times A t . The total displacement during the time period At is
approximated by adding a normal random displacement to this expected
displacement.
5.2.3 Random Vortex Method
Tne Random Vortex Method has been successfully used to study the
turbulent flows of different configuratims. The detailed descriptions oi
this method can be found in references 53 and 57. Presented here are
only the brief discussions of the use of thls method to study turbcllent
jets.
A s pointed out in section 5.2.1, .le equation (5.4) statistically
describes the motion of any wall generated vortex blob in the entire tur-
bulent jet flow field. The mction of any vortex blob can be decomposed
into two steps. First, the vortex blob undergoes an expected motion due
to the inviscid interaction as discussed in section 5.2.2. Then, it has a
random motion as described in section 5.2.1. While the expected displace-
ment is calculated by the forward finite difference method as mentioned
in section 5.2.2, the random displacement is determined by a randomly
generated number from the computer.
In order to update the vorticity distribution a t any time step, the
equation (5.4) is applied to every vortex blob in the turbulent jet flow field
to describe its motion. After the vorticity distribution is updated, satis-
faction of the no-slip boundary conditions with generation of vorticity a t
the walls is checked for the next time'step. The generated vorticity is
quantized and deposited a t the walls ' b s newly generated quantized
vorticity becomes vortex blob once it move into the flow fleld. The rorti-
city distribution with the newly generated quantized vorticity a t the walls
is updated again with the method mentioned above. These procedures of
both checking the no-slip boundary conditions with generation of quan-
tized vorticity and updating the vorticity distributions are repeated to
obtan the vorticity distributions a t any time step for turbulent jets.
This Random Vortex Method uses the Prandtl boundary layer assurnp-
tions to facilitate the calculations for the vortex blob interactions near
the solid boundaries. The flow fields near the solid boundaries are called
shear layer regions. The assumptions used in these shear iayer regions
a~ a u a2 a2 are ( 1) - << - and (2) T<< 7 Hence the properties of a vortex @ a2 a 9
blob in these regions are simplified and the term vortex sheet53 is
applied instead of vortex blob. The newly generated quantized vorticity is
called vortex sheet and is allowed to move in the shear layer regions. The
vortex sheet diffuses or randomly walks only in the direction perpendicu-
lar to the solid boundaries. In addtion, the vortex shect only influences
other vortex sheets whch are in the shadow region below it. These two
properties of vortex sheets reduce a significant amount of computabon
time. Once vortex sheets move beyond the shear layer regions, they
become vortex blobs. Conversely, vortex blobs will become vortex sheets
if they move into the shear layer regions. A shear layer region thickness
of 3 standard deviations was selected to give best accuracy in the calcula-
tions.
5.2.4 Flame Propagation Algorithm
The flame propagation algorithm was developed by ~ h o r i n ~ ~ and suc-
cessfully applied, with the use of the Random Vortex Method, to study the
turbulent flow in a combustion tunnel57. The algorithm was deslgned
mainly to trace the motion of the flame fronts. Similar to equation (5.4),
equation (5.6) describes the motion of the flame fronts in the turbulent
jet flow field. The motion of a flame front can be decomposed into two
steps. First, the flame front moves in the direction of its normal with a
relative velocity taken here as a constant, equal to the appropriate lam-
inar burning velocity of the mixture, S, . Secondly, the flame front
moves with a velocity due to the inviscid ir4eractions as discussed in sec-
tion 5.2.2.
The motion of the flame front in the first step is due to consumption
of the reactants and is called combustion. Combustion transforms reac-
tants into products and generates volumetric sources located a t the
flame fronts. The combustion generated volumetric sources from the
previous time step are applied to influence the turbulent jet flow field at
the current time step and then removed. Here, the exothermic effects of
combustion on the turbulent jet flow field are manifested by the dynamic
effects of combustion generated volunletric sources flashmg over the
entire flow Aeld. The method of obtaining the combustion generated
volumetric sources is incorporated in the procedures used in secbon
5.2.3 to update the vorticity distribution at any time step for turbulent
jets with combustion.
The flame Irul~L is an interface where chemical reactions occur
infinitely fast between reactants and products. In order to locate the
flame fronts, the flow field is divided into square cells with length h,. The
fraction of volume occupied by products in a given cell is defined as fol-
lows:
v, v, = - / = v , + v u v, where 0s / s 1
Thus, f = 0 or 1 means that there are, respectively, either reactants
or products in the cell, while O</ <1 applies to cells containing the flame
front mterface. Its particular geometry is deduced, depending on the J
numbers in neighboring cells. A detailed explanation of the interface
geometry can be found in references 57 and 58.
With the use of the Random Vortex Method implemented with the
flame propagation algorithm, four cases of computer simulations for tur-
bulent jets were conducted to study the f ormation and the inflammation
processes of turbulent jets. The typical input data used at the start of
calculations are listed in Table 3. The calculated results of these four
cases are discussed in the following sections. The turposes of studying
these four cases are explained respectively in the following:
1. Case I was designed to study the formation processes of the
developing turbuient jets and the behavior of the large-scale
eddy structure of turbulent jets at early time. This case simu-
lates the formation processes of a turbulent plume created by
the combustion jets, whch are turbulent jets of combustion pro-
ducts, before ignition.
2. Case I1 was designed to study the behavior of the large-scale
eddy structure of turbulent jets a t later time. Thls case simu-
lates the turbulent flow field of the developed combusticn jets
before ignition.
3. Case 111 was designed mainly to study the inflammation processes
in the turbulent jets.'This case illustrates the mechanism of the
inflammation processes in turbulent jets with a single point igni-
tion source located at the center of the jet exit.
4. Case N was designed to study and simulate the inflammation
processes initiated by a line source located at the jet exit.
6.1 Case I
This case was designed to study the formation processes of the tur-
bulent plume observed in the experiments as discussed in Chapter 4. The
calculated results are shown in Figures 40. Instantaneous vorticity distri-
butions are shown on the left and instantaneous velocity vector fields are
shown at six downstream locations of 0.5, 3.0, 5.5, 8.0, 10.5 and 13.0 from
the jet exit. Nondirnensionalized locations are based on the jet exit
width.
At the beginnmg of the computation (Time = 0.00), the entire tur-
bulent jet flow is potential flow, which satisfies the initial condition of zero
vorticity in the mathematical model. In the 2-plane, this potential flow is
formed by dischargmg the uniform flow through the inlet channel into the
semi-infinite plane as shown in the left of Figure 39. But in the
corresponding <-plane, the potential flow is formed by assuming a source
located in the semi-infinite plane as shown in the right of Figure 39.
Then as the calculations begin, the vortex sheets are generated by
satisf31ng the non-slip boundary conditions at the solid walls. These vor-
tex sheets are transported into the potential flow field as so-called vortex
blobs. Vortex blobs of the same sense form a vortex cloud whlch has
characteristics of self-rotating and expanding, causing the flow to recir-
culate. The vortex blobs produced from the horizontal walls are in the
s7me sense as those produced from the adjacent vertical walls. The
former vortex blobs were entrained into the main stream of the turbulent
jets and combined with the latter vortex blobs to form two self-rotating
and e-xpazrli~z vortex clouds. These two developing vortex clouds, which
are of opposite sense, move parallel to each other and form the f i s t vor-
tex pair.
As the calculations continue, the vortex clouds continue growing
separately by coalescing with the newly generated vortex blobs of the
same sense and hence augmenting the entrainment. These coalescing
processes are shown in Figures 40-a,b with t h s first vortex pair moving
downward and its vortex clouds becoming bigger and bigger. Finally, the
random nature of the RVM causes the first vortex pair to become anti-
symmetric. Whlle the first anti-symmetric vortex pair is growing down-
stream of turbulent jets, the two incoming streams of vortex blobs are
forced to move off the jet centerline and hence have time to form
another anti-symmetric vortex pair before becoming entrained into the
f i s t vortex pair. This anti-symmetric effect of the vortex pair on forming
another anti-symmetric vortex pair causes the vortex pairs to be stag-
gered and forms a large-scale eddy structure of turbulent jets.
I t is interesting to note that the first vortex pair triggers the forma-
tion of the large-scale eddy structure of turbulent jets. In t h s study of
turbulent jets, the large-scale eddy structure of turbulence, as shown in
Figures 40-c,d,e, is constructed by a series of vortex pairs, whlch are
organized in the form of a staggered array of vortex clouds generating
local recirculation flow patterns.
This large-scale eddy structure of turbulent jets dominates the for-
mation processes of a turbulent plume. All the fluids coming from the
exit of the inlet channel are caused to recirculate by the large-scale eddy
structure. The fluids from the left part of the orifice recirculate in a
c l o c h s e sense and the other part in a counterclockwise sense. More-
over, the fluids from the region near the id4 : channel walls recirculate
faster than those from the region far from the inlet channel walls. There-
fore, the fluids exiting from the inlet channel are kept together under
recirculation and form 8 turbulent plume. The penetration speed of t h s
turbulent plume is determined by the strength of the first vortex pair
heading the large-scale eddy structure of turbulent jets.
In this case calculations were performed only up to 21 time
steps.Thls case study has demonstrated not only the formation processes
of the Arst vortex pair and turbulent plume, but also the mechanism of
developing a large-scale eddy structure. The continuation of calculations
becomes very time-consurmng and costly because of the large number of
vortex blobs (about 4600) produced. In order to continue the calcula-
tions and to study the behavior of the larqe-scale eddy structure of tur-
bulent jets at later times, one has to reduce the generation rate of vortex
blobs. The effects of the non-slip horizontal walls on the turbulent jet
flow fields are already known from this case study to enhance the
development of the first vortex pair with a larger degree of randomness,
and hence to augment the large-scale eddy structure of turbulent jets.
The assumption of frictionless horizontal walls will be used in the studies
of the following cases.
6.2 Case II
In designing t h s case, the horizontal walls, which were non-slip in the
previous case, were assumed to be frictionless here. Hence, the genera-
tion of the vortex blobs from the horizontal walls was eliminated to facili-
tate the caculations. In an attempt to obtain a steady flow, the calcula-
tions for this case were conducted up Lo 66 time steps to simulate the
turbulent flow Aeld created by the developed combustion jets. Thk calcu-
lated results &re shown in Figures 41 on a scale of 6/10 to those of Fig-
ures 40. Instantaneous vorticity distributions are shown on the left.
Instantaneous velocity vector flelds are shown on the right at six
, .
downstream locations of 0.8, 4.8, 8.8, 12.8, 16.8, 20.8 from the jet exit.
Nondirnensionalized locations are based on the jet exit width.
Figures 41-a,b,c,d show the developing processes of the Arst vortex
pair as explained in case I. The Arst vortex pair in this case is formed by
two clouds, which are produced only from the vertical walls, of less ran-
domness and smaller size. Therefore, the potentiai core region of the tur-
bulent jets is longer in this case, and the large-scale eddy structure of
the turbulent jets is formed further downstream
As the calculations continue, the two big vortex clouds, which are
always associated with the existence of the non-slip solid boundaries,
form an anti-symmetric first vortex pair and start introducing the second
smaller vortex pair. Gradually, as shown in Figures 41-e,f,g, the second
vortex pair develops i.:to an anti-symmetric form due to the anti-
symmetric effect of the first vortex pair. The second vortex pair also
introduces the third vortex pair, while itself being entrained into the Arst
vortex pair. The secor,d vortex pair finally coalesces with the Arst vortex
pair to form a bigger, more anti-symmetric first vortex pair. The third
vortex pair hence becomes the second vortex pair and is influenced by
the first vortex pair to become more anti-symmetric. As calculations
continue further, the third, the fourth, and subsequent vortex pairs are
formed, as shown in Figures 41-h,i,j,k,l,m,n, using the same mechanism
as the second vortex pair. This series of vortex pairs is becoming bigger,
more anti-symmetric due to the miti-symmetric effect resulting from the
preceding vortex pair and by coalescing with the successive vortex pairs.
The vortex pair formed near the jet exit finally will be entrained into the
first vortex pair by coalescing itself with the preceding vortex pair. This
process enables the development of the large-scale eddy structure, which
is organized in the form of a staggered array of vortex clouds, of greater
amplitude further downstream. This large-scale eddy structure of tur-
bulent jets dominates not only the entrainment and mixing processes but
also the entire turbulent flow field.
6.3 Case 111
This case was designed to study the mechanism of the inflammation
processes in turublent jets. A single point ignition source was applied at
the center of the jet exit a t the beginning of the calculations. The results
of calculations are shown in Figures 42 with the instantaneous vorticity
distributions on the left and the instantaneous flame front locations on
the right. The scale of these figures is same as that of Figures 41.
As the calculations begin, the large-scale eddy structure develops in
a mechanism similar to that described in Case 11. In addition, the forma-
tion of the large-scale eidy structure in thls case is under the influence
of the exothermic effects of combustion. The large-scale eddy structure
for this case is augmented in such a way that the first vortex pair is
bigger in size, and the potential core region is shorter in length. Hence,
the infiamrnation processes can enhance the formation processes of the
large-scale eddy structure of turbulent jets.
As discussed in Cases I and 11, the large-scale eddy structure dom-
inates the entire turbulent jet flow field. In this case, the large-scale
eddy structure also demonstrates its control over the flame propagation
processes. That is, the flame fronts, with a prescribed norrial burning
speed (Su = 0.02), are carried by the turbulent flow field. Of particular
interests is that the flame fronts are carried by the recirculatiing flow
fields created by the large-scale eddy structure of turbulent jets.
Besides, the recirculation flow flelds also keep the burnt mixture
together to form a turbulent plume with combustion. The penetration
speed of this turbulent plume is determined, lnstead of by the normal
burning rate, primarily by the strength of the f i s t vortex pair heading
the large-scale eddy structure of turbulent jets enclosed withn the flame
fronts. Therefore, the inflammation processes and the flame shape for
this case of relatively small normal burning speed are determined by the
large-scale eddy structure, as well as where and when the Ignition source
occurs in the turbulent flow fleld.
This case performed calculations up to 21 time steps and illustrated
the effects of inflammation on turbulence, and vice versa. For the sake of
brevity, the case only used a single point ignition source located at the
center of the jet exit to study the mechanisms of the rnflammation
processes in turbulent jets and the formation processes of a turbulent
plume with combustion. The next case considc . 5 point ignition sources
to study the inflammation processes initiated by combustion jets. The 5
point ignition sources form a line ignitim source at the jet exit.
6.4 Case IV
This case was designed with an attempt in mind to simulate the
inflammation processes initiated by combustion jets. The case assumes
that the mixtures coming out of the exit are complete combustion pro-
ducts. Moreover, the case assumes that no induction period is needed for
the initiation and propagation of the self-sustained flames. In addition,
this case assumes to have a line ignition source at the exit of turbulent
jets. The calculations begin with the flames starting to propagate from
the jet exit. The results of calculations are shown in Figures 43 with the
instanianeous flame fronts superimposed on the instantaneous vorticity
distributions. The scale of these figures is the same as that of Figures 41.
As the calculations continue, the large-scale eddy structure develops
by the same mechanism as described in Case 111. The turbulent plume
with combustion elso develops in the same way as described in Case III.
The large-scaie eddy structure again can dominate the entire turbulent
jet flow field and the inflammation processes in it.
As the calculations continue fvrther, the large-scale eddy s t r~c tu re
develops itself into a staggered array of vortex clouds which create local
recirculation flows, causing the turbulent plume to have more wrinkled
flame fronts. The recirculation flows also keep the burnt gases together,
as they did in Case 111, but producing a flame shape which is different
from that in Case 111. This illustrates tht~t the flame shape and
inflammation processes have a strong dependence on the number and the
locations of the ignition sources deposited into turbulent jets. The pene-
tration speed of a turbulent plume with combustion is also determined,
instead of by the normal burning rate, primarily by the strength of the
Arst vortex pair headlng the large-scale eddy structure of turbulent jets
enclosed w i t h the flame fronts.
The case performed calculations up to 36 time steps and again illus-
trated the effects of the large-scale eddy structure on the flame shape
and inflammation processes of turbulent jets.
CONCLUSIONS
The conclusions for this combustion ,dt ignit~ 1 study are summar-
ized below:
I . A combustion jet ignition system was developed to generate tur-
bulent jets of combustion products contain in^ free radicals and
tc discharge them as ignition sources into ?he combustible
medium.
2. Experimentally, the penetration speed of combustion jets has
been found ia be consiant initially and decreases monotonically
as turbulent jets of combustion products travel closer to the
wall.
3. The initial penetration speed of coinbustion jets is proportional
to the initial stagnation pressure upstream of the oriAce for the
same stoichometric mixture.
4. Combustion using a CgHg/l\lr mixture in the prechamber shows
hgher initial ~enetretion speed of combustion jets than that
using a CHq /Air rnixturt? although the initial stagnation pressure
difference between thzse two test runs is 1 psi. ' h s is a primi-
tive study and needs further invest~ation.
5. For combustion using a CH4/Air mixture in the prechamber, the
initial penetration speed cf combustion jets is higher for rich
mixture than for stoichiometric mixture although the former has
lower initial stagnation pressure than the latter. Ths is a primi-
tive study and needs further investigation.
6. The Random Vortex Method is a very useful tool for studying the
large-scale eady structure of turbulent jets.
7 . The first vortex pair triggers th? formation of the large-scale
eddy structure of turbulent jets.
8. The large-scale eddy structure of turbulent jets is constructed
by a series of vortex pairs, which are organized in the form of a
staggered array of vortex clouds generating local recirculation
flow patterns.
9. Tt~e iarge-scale eddy structure dominates the formation
processes of turbulent jets or experimentally observed turbulent
plumes.
10. The flame fronts are carried by the recirculatmg flow fieids
created by the large-scale eddy structure. In addition, the recir-
culation flow fields keep the burnt mixture together, forming a
turbulent plume with combustion.
11. The large-scale eddy structure dominates the inflammation
processes in turbulent jets.
12. The flame shape and inflammation processes have a strong
dependence on the number and the locations of the ignition
sources deposited into turbulent jets.
REFERENCES
1. Oppenheim, A. K., and Weinberg, F'. J., "Combustion R & D: Key to Our ' & A e U m a u t i r x Energy Future," A s h x m h s pp. 22-31, November
1974.
2. Oppenheim, A. K., "Prospects for Internal Combustion Engines among Advanced Energy Conversion Systems," P r n r ~ ~ r l i a f L h e l 3 h Inf prLnrl.tv Eneeg)r- Fn.,nPPrrnrr wze, Vol. 2. pp. 1 192- 1200, SAE, Inc., Warrendale, Pa., 1978.
3. Smith, 0. I., Westbrook. C. K., and Sawyer. R. F., "Lean Limit Combiis- tion in an Expanding Chamber," J2Lh S g m p u m an
The Combustion Institute, 1979.
4. Ishikawa, N . . and Daily, J . W., "Model Engine Studies of Hydrocarbon Quenching," 17th S g m p x u m 41nfer- rn The Combustion Institute, 1979.
5. Dale, J. D., and Oppenheim. A. K., "Enhanced Ignition for I. C. Engines," SAE Paper 810146, 1981.
6. Guirguis, R. H., Oppenheim, A. K., Karasalo, I. . and Creighton. J . R., "Thermochernistry of methane Ignition," J3q- in Ashmuhx and- 76, AIAA, New York, 134-153, 1981.
7. Oppenheim, A. K., Teichman, K., Ham. K., and Stewart, H. E., "Jet Ignition of an Ultra-Lean Mixture," SAE Paper 780637, 1978.
8. Lancaster, D. K., Krieger, R. B., Sorenson, S. C., and Hull. W L , "Effects of Turbulence on Spark-Ignition Engine Combustion," SAE Paper 760160, 1976.
9. Huebner, K. H., and McDonald, A. T., "Experimental Determination of Airflow Patterns in Piston Engines with Induction Swirl," SAE Paper 720026. 1972.
10. Oppenheim, A. K., Cheng, R. K., Teichman, K., Smith, C I . , Sawyer. R F., Horn, K., and St?wart, H. E., "A Cinematographic Study of Combus- tion in an Enclosure Fitted with a Reciprocating Piston," Stratified Charge Engines, Institute of Mechanical Engineering Conference Pub- lications 1976-1 1, 1976.
11. Daneshyar, H., Fuller, D. E.. and Dekker, B. E. L., 'Vortex Motion Induced by the Piston of an Internal Combustion Engine," Int. J . Mech. Sci., Vol. 15, 1973.
12. Gordon, S., and McBride, B. J., "Computer Program for Calculation of Complex Chemical Equilibrium Compositions, Rocket Performance, Incident and Reflected Shocks, and Chapman-Jouguet Detonations," 3ASA SP-273, 1976.
13. Oppenheim, A. K., "Ignition Stu&es," LBL-5068, Lawrence Berkeley Laboratory, February 1982.
14. Oppenheim, A. K., Cohen, L. M., Short, J. M., Cheng, R. K., and Horn, K.. "Shock Tube Studes of Exothermic Processes in Combustion." ~ h o c k ~ ~ u b e Research Society, Japan, 1975.
15. Vermeer, D. J., Meyer, J. W., snd Oppenheim, A. K., "Auto-Ignition of Hydrocarbons aehind Reflected Shock Waves," h m h u b n and Ume 18, 327-336, 1972.
16. Meyer, J . W. , and Opperiheim, A. K., Explosive Gases," ULh The Combustion Instit Ute*
17. Oppenheim, A. K., Cohen, L. M., Short, J. M., Cheng, R. K. and Ham, K., "Dynamics of the Exothermic Process in Combustion," l5th .Svmnn- sium (Tnt ~m;lt.lnnAll nn The Combustion Institute, 1974.
18. Albert, H., Bloss, W. H., Herden, W., Maly, R., Saggau, B., and Wagner, E., "New Aspects on Spark Ignition," SAE Paper 770854, 1977.
19. Maly, R., and Vogel, M., "Initiation and Propagation of Flame Fronts in Lean CH4-Air Mixtures by the Three Modes of the Ignition Spark." Il;tb S g m p a m nn The Combustion Institute, 1979.
20. Maly, R. , "Ignition Model for Spark Discharges and the Early Phase of Flame Front Growth," presented at the ,LBth
The Combustion Institute, 1980. ITntP.rnR-
21. Cerkanowicz, A. E., and McAlevy III, R. F., "Photochemical Ignition and Combustion Enhancement in High Speed Flows of Fuel-Air Mixtures," AIAA Paper No. 73-216, 1973.
22. Cerkanowicz, A. E., "Radiation Augmented Combustion," Interim Report AFOSR-TR-79-1096, 1979.
23. Orrin, J. E., Vince, I. M., and Weinberg, F. J., "Ignition by Radiation from Plasmas," C n m l u h m and Ebme 37, 91-93, 1980.
24. 3ale, J . D., Smy, P. R., and Clements, R. M., "Laser Ignited Internal Combustion Engine-An Experimental Study," SAE Paper 780329, 1978.
25. Wyczalek, F. A., Harned, J. L., Maksyrniuk, S., and Blevins, J. R., "EFI Prechamber Torch Ignition of Lean-Mixtures," SAE Paper 750351, 1975.
26. Gussak, L. A., "High Chemical Activity of Incomplete Combustion Pro- ducts and a Method of Prechamber Torch Ignition for Avalanche Activation of Combustion in Internal Combustion Engines," SAE Paper 750890. 1975.
27. Gussak, L. A , 'The Role of Chemical Activity and Turbulence Intensity in Prechamber-Torch Organization of Combustion of a Stationary Flow of a Fuel-Air Mixture," SAE Report, 1979.
28. Gussak, L. A., Karpov, V. P., and Tikhonov. Yu. V., 'The Application of Lag-Process in Prechamber Engines," SAE Paper 790692, 1979.
29. Creightcn, J . R., "A Critique of the Theory for Gussak's 'LAG Process' Engine," SAE Paper 790249, 1879.
30. Creighton, J. R., and Oppenheim, A. K., "Control of the Rate of Methane Oxidation by Quasi-Equilibrium Radical Concentrations," LLL Report, 1979.
31. Furukawa, Junichl, and Gorni, Tsutomu, "On the Propagation of Tur- bulent Jet-Flarne in a Closed Vessel," SAE Paper 810777, 1981.
32. Wang, 1'. S., Zhang, Y. F., Zhao, H. F., Qi, 2. M., and Ren, A. F., "A Study of Ignition by Flame Torches," l0.t.h Spquum & k m a b d ) an
c The Combustion Institute, 1980.
33. Weinberg, F. J., Horn, K., Oppenheim, A. K., and Teichman, K., "igni- tion by Plasma Jet," hlature , Vol. 272, pp. 341-343, 1978.
34. Cetegen, B., Teichrnan, K. Y., Weinberg, F. J., and Oppenheim, A. K., "Performance of a Plasma Jet Igniter," SAE Paper 800042, 1980.
35. Teiclrman, K. Y., "Study of Jet Ignition for Lean Mixtures," Ph. D. Thesis, University of California, Berkeley, 1978.
36. Cetegen, B. M., "Study of Performance of a Plasma Jet Igniter," M. S. Thesis, University of California, Berkeley, 1979.
37. Wyczalek, %. A., Frank, D. L., and Neuman, J. G., "Plasma Jet Ignition of Lean Mixtures," SAE Paper 750349, 1975.
38. Asik, J. R., Piatkowski, P., Foucher, M. J. , and Rado, W. C., "Design of a Plasma Jet Ignition System for Automotive Application," SAE Paper 770355, 1977.
39. Orrin, J. E., Vince, I. M., and Weinberg, F. J., "A Study of Plasma Jet Ignition Mechanism," 1Rrh mlm w~xuaLumalJ nn h m b s d p hnu. The Combustion Institute, 1980.
40. Harrison, A. J., and Weinberg, F. J., "Flame Stabilization by Plasma Jets," Proc. Roy. Soc. Lond. A. 321, pp 95-103, 1971.
41. Hilliard, J. C., and Weinberg. F. J., "Effect of Nitrogen-Contaimng Plas- mas on Stabihty, NO Formation and Sooting of Flames," NAtIII'P ,Val. 259. 1976.
42. Onishi, S., Jo, S. H., Shoba, K., Jo, P. D., and Kato, S., "Active Thermo- Atmosphere Combustion (ATAC) - A New Combustion Process for Internal Combustion Engines," SAE Paper '790501.
43. Schlichting, H., Rnunrl;lry-layer Xhmq~ McGraw-Hill, Six Edition, 1966.
44. White, F. M., Y m m ~ E h d Flnw McGraw-Hill, 1974.
45. Kanury, A. F., I n k d u h n b. f L m b u h m Gardon and Breach, Second Edition, 1977.
46. Lewis, B., and von Elbe, G., I h m h s b ~ and Zxphmm d Academic Press, Second Edition, 1961.
47 Dirnotakis, P. E., Miake-Lye, R. C., and Papantoniou, D. A., "Structure and Dynamics of Round Turbulent Jets," GALCIT Report FM 82-01, 1982.
48. Hengrussamee, Dhawatchai, "Mixing of Hot Starting-Jets with Cold Surroundings," Ph. D. Thesis, Imperial College, London, 1975.
49. Abramovich, G. N . , T h e T h a x g n £ ~ ~ M . I . T . , 1963.
50. Scorer, R. S., F A Ellis Horwood Limited, 1978.
51. Kamel, M. M., Lundstrom, E., and Oppenheim, A. K., "Apparatus for Continuous Flow Mixing of Explosive Gases," Jounal of Physics E., Vol. 1, 1968.
52. Morganstern, B., Dale, J. D., Smy, P. R., and Clements, R. M., "Low Temperature Starting of a Diesel Engine Using Time Spark Discharge," Canadian Combustion Institute Meeting, 198 1.
53. Chorin, A. J., and Marsden, J. E., A AMbmiid lnkdu&m fn I2h.d Springer-Verlag, New York, 1979.
54. Chorin, A. J., "Vortex Sheet Approximation of Boundary Layers," J. Comp. Phys.. 27, June 1978.
55. Chorin, A. J., "Vortex Models and Boundary Layer Instability," SIAM J. Sci. Stat. Comput., 1 , March 1980.
56. Chorin, A. J., "Numerical Studies of Slightly Viscous Flow," J. Fluid Mech., Vol. 57 , pp. 785-796, 1973.
57. Ghoniem, A. F., Chorin, A. F.. and Oppenheirn, A. K., "Numerical Modelling of Turbulent Flow in a Combustion Tunnel." EhrL E a n s B h ha* A 394 , 303325, 1982.
58. Chorin, A. J., "Flame Advection and Propagation Algorithm," J. Comp. Phys., 1980. 6
Table 1
Jet Penetration Speed for Combustion Jets EYperiments
Case
I1
I1
I1
I1
I1
111
111
I11
Figure
22
23
24
25
27
30
33
36
Mixture
CgHg/Air
C3H8/hr
C3H8/hr
CgH8 /Air
C3H8 /Air
CH4/Air
CH4/Air
CH4/Air
rp - Equivalence ratio.
PQ - Jnitial stagnation pressure upstream of the orifice.
- Initial penetration speed.
ti - Valve opening time after (+) or before (-) peak pressure.
+ - Valve opening 1 ms after electric spark.
Case Figure
I1 22
I1 23
I1 24
I1 25
I1 27
I11 30
I11 33
I11 36
Table 2
h e a r Regression Functions
A(m/ sec)
24.38
29.47
30.62
30.80
27.67
22.69
31.56
19.50
r - Correlation coMicient
Y - The estimated jet penetration depth
A - Slope of the least squares line of the jet penetration depth data
B - Y-intercept of the least squares line of the jet penetration depth
data
T Time (second)
Table 3
Input Data for Turbulent Jets Calculations
Reynolds number
Width of jet exit
Time increment
Space increment
Length of each vertical wall
Length of each horizontal wall
Side width of a cell
Normal burning speed
Density ratio (Reactants/Products)
Strength of a vortex blob
Minimurn strength of a combustion
generated source
Standard deviation
Shear layer thickness
Fig. 1 Idealized Otto cycle
Fig. 2 comparison of pressure-time traces
Curve 1 - Obtained in closed bomb experiments using conven-
tional spark ignition
Curve 2 - Obtained in closed bomb experiments using combus-
tion jet ignition
Curve 3 - Obtained from theoretical calculation for constant
volume combustion using CEC-76 computer program
Fig. 3 Jet fluid field in the plane of symmetry of the jet. Reynolds
number = 2500, d = 0.3 in, O< x/d (35 (from Dimotakis et al)
Fig. 4 Block diagram of experimentalsetup
Fig. 5 Schematic diagram of combustion jet igniter
Fig. 6
Fig. 7
Fig. 8
Fig. 9
Fig. 10
Fig. 1 1
Fig. 12
Fig. 13
Fig. 14
fig.'^
Calibration curve for a displacement transducer
Schematic diagram of the spiking circuit
Main chamber fitted with combustion jet igniter
Schematic diagram of the continuous flow mixing device
Critical flow rate calibration curves for NZorifice
Critical flow rate calibration curves for 02-orifice
Critical flow rate calibration curves for C3H8-orifice
Calibration curve of C3H8/02 for continuous flow mixing device
Calibration curves of N2/OZ for continuous flow mixing device
Calibration curves of C3H8/Air for continuous flow mixing device
Fig. 16 Calibration curves of CH4/Air for continuous flow mixing device
Fig 17 Schematic diagram of Schlieren optical system
Fig. 18 Schematic diagram of ignition circuit for combustion jet lgniter
Fig.19-a Pressure-time trace for combustion of C3H8/hr mixture ((p =
1.0) in the prechamber with all valves closed (Reference
pressure-time trace for case I)
Fig. 19-b Pressure-time and displacement-time traces for combustion of
C3 H8/hr mixture ((p = 1.0) in the prechamber with valve open-
ing a t peak pressure (without spiking circuit)
Fig 20 Cinematographic Schlieren records of combustion jets in the
main chamber filled with air a t atmospheric pressure and tem-
perature (without splking circuit)
M~xture : C3H8/Air ( p = 1.0)
Or~fice diameter : 3 mrn
Fig 21-a The effect of the spiking circuit on the valve motion and the
pressue-time trace
Fig 21-5 Pressure-time trace for combustion of C3Hg/Air mixture ((p =
1.0) in the prechamber with all valves closed. (Reference
pressure-time trace for case 11)
F1g.22 Experimental data for a test run with valve opening 3 ms after
peak pressure
Mixture : C3H8/Air ((p = 1.0)
Fig.23 Experimental data for a test run with valve opening 2 ms after
peak pressure
Mixture : C3H8/Air (p = 1.0)
Flg.24 Experimental data for a test run with valve opening 1 ms after
peak pressure
Mixture : C3Hg/Air (p = 1.0)
Fig 25 Experimental data for a test run with valve opening a t peak
pressure
Mixture : C3H8/Air (p = 1.0)
Flg.26 Comparison of jet penetration depth traces between two test
runs with valve opering at peak pressure and 3 ms after peak
pressure
Fig.27 Experimental data for a test run with valve opening 2 ms before
peak pressure
Mixture : C3H8/hlr (p = 1.0)
Fig.28 Pressure-time traces for combustion of Cd4/Air mixture in the
prechamber with all valves closed (Reference pressure-time
traces for case 111) (a) rp = 1.0 (b) p = 1.2
Fig.29 Cinematographic Schlieren records of combustion jets in the
main chamber lilled with air a t atmospheric pressure and tem-
perature (with spiking circuit)
Mixture : CH4/Air (p = 1.0)
Orifice diameter : 3 rnrn
Valve opening : a t peak pressure
Fig 30 Experimental data for a test run with valve opening a t peak
pressure
Mixture : CH4/Air (9 = 1.0)
Fig.31 Comparison of jet penetration depth traces between two test
runs with CH4/Air mixtures and CgH8/Air mixtures
Flg.32 Cinematographic Schlieren records of combustion jets in the
main chamber flied with air a t atmospheric pressure and tem-
perature (with splking circuit)
Mixture : CH4/Air (p = 1.2)
Orifice diameter : 3 rnm
Valve opening : a t peak pressure
Fig.33 Experimental data for a test run with valve openinq a t peak
pressure
Mixture : CH4/Air ( q = 1.2)
Fig.34 Comparison of jet penetration depth traces between two test
runs with CH4/Air mixtures of equivalence ratios (p = 1.0 and rp = 1.2
Fig.35 Cinematographic Schlieren records of combustion jets in the
mein chamber filled with air a t atmospheric pressure and tem-
perature (with spiking circuit)
Mixture : C1l4 /Air (p = 1.0)
Orifice diameter : 3 rn
Valve opening : 1 ms after electric spark
Fig 36 Experimental data for a iest run with valve opening 1 ms after
electric spark
Mixture : CH4/kr (p = 1.0)
Fig 37 Comparison of jet penetration depth traces between two test
runs with valve opening a t peak pressure and 1 rns after e!ectric
spark
Fig.38 5chwarz-Christoffel transforfiation of 2-plane into (-plane
Left : Physical plane or Z-plane
Rlght : Transformed plane or {-plane
Fig 39 St~earnline patterns of initial flow of turbulent jets in Z-plane
(left) and {-plane (right)
Fig 40 Computer ?lots c ~ l turbulent jets without combustion for R, =
10000
Left : Instantaneous vo~ticity distribution
Rlght : Instantaneous velocity field
(a) Time = 1 (b) Tine = 6 (c) Time = 11 (d) Time = 16
(e) Time r 21
Fig.41 Computer plots of turbulent jets without combustion for R, =
100C0, assuming smooth horizontal walls
Left : Instantaneous vcrrticit y distribution
Right : Instantaneous velocity field
(a) Time = 1 (b) Time = 6 (c) Time = 11 (d) Time 16
(e) Time = 21 (f) Time = 26 (g) Time = 31 (h) Time = 36
(i) Time = 41 ( j ) Time = 46 ik) Time --: 51 (1) Time = 56
(m) Time = 61 (n) Time = 66
Fig.42 Computer plots of turbulent jets with c3mbustion for R, =
10000, S, = 0.02, smooth horizontal walls and a single point igni-
tion source located at the center af the jet exit
Left : Instantaneous vorticity cljistribution
Right : Instantaneous flame front locations
(a) Time = 1 (b) Time = 6 (c) Time = 1 1 (d) Tirne = 16
(e) Time = 21
Fig.43 Computer plots of turbulent jets with combilstion for R, =
10000, S,, = 0.02 smooth horizontal walls and a line ignition
source located at the jet exit
(a) Time = 1 (b) Time = 6 (c) Time = 11 (d) Tirne = 16
(e) Time = 21 (f) Time = 26 (g) Time = 31 (h) Time = 36
P r o c e s s 1-2 : I s e x t r o p i c c a n p r e s a i o i ~ s t r o k e
I i -ocess 2-3 : C o n s t z n t - v o l u ~ e combus t ion
P r o c e s s 3-4 : I s e n t a r o p i c e x p a n s i o n s t r o k e
P r o c e s s 4-5 : Cons tan t -vo lume and a d i a b a t i c e x h a u s t
blowdown
P r o c e s s 5-6 : C o n s t a n t - p r e s s u r e and a d i a b a t i c e x h a u s t
s t r o k e
P r o c e s s 6-1 : C o n s t a n t - p r e s s u r e and a d i a b a t i c i n t a k e
s t r o k e
F i g u r e 1
E q u i v a l e n c e R a t i o = 0.5
Time (100 rns/div)
F i g u r e 2
7 - S o l e n o i d u
8 - O r i f i c e ?iate 2 - s ? r i r ~ y 9 - Prcchamber 3 - S o l e n c l d S u p p o r t 1 0 - Valve Rod 4 - Gas I n l e t 11 - S h u t Off Valve 5 - Macor Guides 12 - Alignment Slot and Key 6 - Valves 13 - Purge O u t l e t 7 - Tapered Orifice 1 4 - High Voltage Lead
F i g u r e 5
ORMlNAL PAQE 10 OF POOR QUALITY
3 0 2 4 6 8 10 12 1 4
Volteze (volt)
OHK;3NAL PAGE 13 OF POOR QUALITY
ORlQiNAL PACE W POOR QUALm
R V - Regulating Valve MV - Manual Valve SV - Solenoid Valve
Figure 9
JO - Jewel O r i f i c e P - Pressure Gauge
0 I 0 20 30 40 50 60
Pressure (psig)
Figure 1 G
1 - 0.10 m m
- ' ' 5 m m for 02-orifice 3 - 0.19 m m
4 - 0.33 mm
D
L
,
1
3
L P2 . 0
0 1 C 20 30 4 50 60
Pressure (psig
F i g u r e 11
0 10 20 30 40 50 60
Pressure ( p s i g )
90.
8 0 .
70
60
F i g u r e 12
r
1 - 0.10 m m -
mrn f o r C3H8-orifice 3 - 0.18 m m 4 - 0.33 m m
-
. 4
50 .
40
30 .
3
2
0 0'
omamr WQE m ZrF POOR QUALm
Stagnation pressure upstream of 02-orifice is fixed ( = 5 7 psig) .
m // 2
1 - N2-orifice diameter : 0.15 mm
2 - N2-orifice diameter : 0.18 am
1 & 2 - 02-orifice diameter : 0.15 m m
J -
Figure 13
Stagnat ion pressure upstream o f 0 2 - o r i f i c e i s f i x e d (=57 p s i g )
9
L
9
C3Ha-orifice disrneter : 0.10 mm . 0 2 - o r i f i c e diameter : 0.15 mm
4 1 a
Figure 1 4
e E P E
0 a r .- . . 0 0 .. .. ..
Q) . . 0 a a 4 4 d 6( w a 4
h Q) Q, 0 U 0 I 4 4 h tc tc d 4 d a h L4 E 0 0 f t c I I 0 00 00 m M X X m E d c? m al a 0 '3 0 9 ) C
h I I * - Q 0
m .- - 04 ~4 a m 9) 3 +, I Q) Q) E h N cd 3 d m a a m E :
9) (d Q ) k o a M
.?-I 4 k r = m d o a h rl O Q O
. I a m h C m
.?-I bD * a l l Q
l t n r
c\r a Q)
&9 X d
r E 4 . I
9
A
CH
-o
rif
ice
d
iam
eter
: 0
.10
mm
4 A
ir-o
rif
ice
d
iam
eter
: 0
.33
mm
I S
tag
na
tio
n
pr
ess
ur
e
up
stre
au
. o
f A
ir-o
rif
ice
is
fix
ed
(=30 p
sig
)
1 .o
2.0
Eq
uiv
ale
nce
R
ati
o
Fig
ure
16
OR1GUNAL MGE IS OF POOR QUALfW
ORlaNAL PAGE I OF POOR QUALnY
110 VAC
A P
R
b TO
COMBUSTION JET IGNITER
ORWWt PAGE ?9 OF PWR QUAL171
Displacement
Pressure
Tima Scale : 2 ms/div. P r e s s u r e Scaie : 5 psi/div.