58
Experimental evaluation of anti- diabetics Dr Kirtan Bhatt Department of Pharmacology KIMS, Bangalore
| Date post: | 25-Jul-2015 |
| Category: |
Health & Medicine |
| Upload: | kirtan-bhatt |
| View: | 26 times |
| Download: | 1 times |

Experimental evaluation of anti-
diabeticsDr Kirtan Bhatt
Department of PharmacologyKIMS, Bangalore

Protocol • Introduction
• Need for animals models in diabetes mellitus
• Animals models of diabetes mellitus
For IDDM
For NIDDM
• Measurement of glucose lowering / anti-diabetic activity
In vivo methods
In vitro methods
• Conclusion

Introduction
“Diabetes mellitus can be defined as a heterogenous group of chronic disorders of carbohydrate, lipid and protein metabolism characterized by high blood glucose levels due to relative or absolute deficiency of
insulin”

Epidemiology of diabetes
• Prevalence in 10 countries with highest prevalence ranges from 11.6%
to 30.9%
• Worldwide prevalence has risen dramatically in last 2 decades – 30
million cases in 1985 to 285 million in 2010
• 438 million will have diabetes by 2030 (IDF)
• Asian phenotype – onset at a lower BMI and younger age

Need for animal models for DM
• Diabetes a chronic disease with many different complications
• Complications take years to develop
• Animal models save time

Animal models of diabetes
• For IDDMChemically induced diabetesHormone induced diabetesVirus induced diabetesSurgery induced diabetesInsulin antibody induced diabetesGenetic models
• For NIDDMNeonatal STZ induced NIDDMOther chemicalsGenetic models

Chemically induced diabetesChemicals that induce diabetes can be classified into 3 categories Specifically damage β cell Cause temporary inhibition of insulin production and/or secretion Diminish metabolic efficacy of insulin target tissues
1. Alloxan induced diabetes2. Streptozocin induced diabetes

Alloxan induced diabetes
• A cyclic urea analog, the first agent to be introduced in this category to induce permanent diabetes in animals• Shows a triphasic reponse• Species to species variation
Alloxan Diuleric acid
Alloxan + free
radicals
Damages the DNA of
β cellsCell death

Rabbits:weight 2-3.5 kg are takenear vein – 150 mg/kg alloxan monohydrate (5g/100 ml, pH 4.5) for 10 minutes resulting in 70% of animals becoming hyperglycemic and uricosuric.The rest either die or are temporarily hyperglycemic.Rats:Wistar or Sprague – Dawley strainWeight 150-200 gInj. Alloxan 100-175 mg/kg SCMale Beagle dogs:weight 15-20 kginj. Alloxan IV 60 mg/kg

Drawbacks of alloxan• High mortality in rats• Causes ketosis in animals due to free fatty acid generation• Diabetes induced is reversible• Guinea pigs are resistant to alloxan

Streptozocin induced diabetesStreptozocin [2-deoxy-2-methyl(3-methyl-3-nitrosourea)1-
Dglucopyranose] is a broad spectrum antibiotic produced from
Streptomyces achromogens.
Mechanism of β cell damage
By process of methylation
Free radical generation
Nitric oxide production

Diabetogenic doses vary with species
Rats – 50-60 mg/kg IP or IV
Mice – 175-200 mg/kg IP or IV
Dogs – 15 mg/kg for 3 days
Blood glucose levels show triphasic response as seen with alloxan• Hyperglycemia at 1 hour• Hypoglycaemia that lasts for 6 hours• Stable hyperglycemia by 24-48 hours after STZ administration

Advantages and disadvantages: :
• Greater sensitivity towards β cells
• Lower mortality rates
• Longer and irreversible diabetes induction
• But, guinea pigs and rabbits are resistant to its diabetogenic action.

Growth hormone induced diabetes
• Cotes and co-workers (1949) described the diabetogenic action of
anterior pituitary growth hormone in cats.
• Repeated administration of GH induces an intensively diabetic
condition with all the symptoms of diabetes including ketonemia and
ketonuria in intact adult dog.
• Rats of any age subjected to similar treatment do not become
diabetic but grow faster and show hypertrophy of pancreatic cells.

Glucocorticoids induced diabetes
• Ingle (1941) described hyperglycemia and glucosuria in forced fed rats
with cortisone.
• Hausberger and Ramsay in 1953 showed that experimental diabetes by
cortisone can be induced in guinea pigs and rabbits without forced
feeding. (Abelove and Paschkis,1954)
• In the rat, adrenal cortex, stimulated by corticotrophin, has the capacity
to secrete amounts of steroids which induce diabetes (Ingle et al 1946)

Virus induced diabetes
They may produce DM by:• Infecting and destroying β cells in pancreas.• A less infecting or cytologic variant producing a comparable damage by
eliciting immune auto-reactivity to β cells.• Viruses that produce systemic effects, not directly affecting β cells.
Viruses used for inducing DM:• Coxsackie B4• Encephalomyocarditis (EMC-D and M variants)• Mengo-2T• Reoviruses• Lymphocytic Choriomengitis Virus (LMCV) Armstrong variant

Surgery induced diabetes
• Induction of DM can be achieved through surgical removal of all or
part of pancreas.
• Depending on the amount intact pancreatic cells, DM may range in
duration from a few days to several months.

Disadvantages:
• Surgical removal of pancreas also causes loss of α and δ cells in addition to β
cells.
• There is also loss of pancreatic enzymes for digestion.
• The total resection is difficult to achieve and the severity of DM is strain
specific.

Insulin antibody induced diabetes
Bovine insulin, dissolved in acidified water (pH 3.0) is incorporated in water-oil emulsion based on complete Freund’s adjuvant or a mixture of paraffin oil and lanolin.
Guinea pigs (300-400 g) are given 1 mg insulin SC divided doses and at monthly intervals. They are bled by cardiac puncture 2 weeks after 2nd and subsequent dose.
IV injection 0.25-1.0 ml guinea pig anti-insulin serum to rats

Genetically diabetic animals
In recent years, various animals have been shown to exhibit diabetes
mellitus spontaneously
• The ob mutation in mice resulted in leptin deficiency
• The fat mutation in mouse results in biologically inactive carboxypeptidase E,
which processes the prohormone conversion of POMC into MSH-α, which
activates the hypothalamic MC4 receptor.
• Agouti yellow mouse exhibit ubiquitous expression of Agouti protein which
represents an antagonist of hypothalamic MC4 receptor.

Spontaneous rat models Spontaneous Mouse models
BB rat KK mouse
WBN/Kob rat KK-Ay mouse
Cohen diabetic rat NOD mouse
Goto Kakizaki rat Diabetic Db/Db mouse
Zucker fatty rat Welleseley mouse
Wdf/Ta-Fa rat Diabetes obesity syndrome in CBA/Ca mice

Transgenic animals
1. Skeletal muscle and insulin resistance/MIRKO mice model
2. Adipose tissue and insulin resistance/FIRKO mouse
3. Mouse with specific disruption of IR gene in β cells which show a selective loss of insulin
secretion in response to glucose and progressive impairment of glucose tolerance
4. The liver specific insulin receptor knock-out (LIRKO) mouse
5. CNS specific disruption of IR gene (NIRKO)
6. IRS-1 deficient mouse which show genetically determined insulin resistance
7. PPAR γ inactivation

STZ induced NIDDM
• Neonatal rats of Sprague-Dawley strain are taken
• Treated with STZ 80-100 mg/kg IP at birth or within 5 days of birth
which leads to severe β cell destruction, deficiency in pancreatic
insulin levels and rise in plasma glucose.
• In contrast to adults, the β cells in neonates partially regenerate.
• Following an initial spike in plasma glucose, these rats become
normoglycemic by 3 weeks.

Other chemical methods
• For NIDDM in rabbits - adrenaline (0.1 mg/kg SC).
• The hyperglycemia is seen at 1 hour and lasts for 4 hours. Oral
hypoglycemic agents can be screened by this method.
• Other chemicals are 8-hydroxy quinoline, biphenyl thio carbazine,
EDTA (partially depancreatized rats), thiazides, chlorthiazide,
hydrochlorthiazide, diazoxide and furosemide.

Genetic models for NIDDMMonogenic models of obesity and NIDDM
1. Yellow mouse (the Agouti mouse)2. Obese and diabetic mouse3. Tubby mouse4. Fat mouse5. Zucker diabetic fatty rat6. Koletsky and JCR: LA-Corpulent rats
Polygenic models of obesity and NIDDM7. New Zealand obese mouse8. Japanese KK mouse9. Nagoya – Shibata – Yasuda mouse10. PBB/Ld mouse11. Otsuka-Long-Evans-Tokushima Fatty rat12. Goto-Kakisaki rat13. Chinese Hamster14. Djungarian (Siberian) hamster15. South African Hamster

Animal models for NIDDM with unknown hereditary and
environmental component
1. Sand rat
2. Spiny mice
3. Tuco-Tuco
Polygenic animal models produced by hybrid crosses
4. BSB (C57BL/6J * Mus Spretus)
5. AKR/J * SWR/J model
6. GK crosses: GK * Fisher 344 strain, GK * non-diabetic Brown Norway

Transgenic and knock-out animalsGenes manipulated to cause insulin resistance:
Genes manipulated to cause defective insulin secretion:
Genes that increase body fat
Insulin receptor GLUT-2 Knock out of uncoupling proteins
Insulin receptor substrate 1 and 2 Glucokinase Knock out β3 adrenergic receptors
Glucose transporters Hepatic nuclear factors
Hexokinase II Islet amyloid polypeptide
TNF-αFatty acid binding protein 2
RAS associated with diabetes

Measurement of glucose lowering / anti-diabetic activity
• In vivo methodsHypoglycemic effectsEuglycemic clamp techniqueHypoglycemic seizures in miceEffects of insulin sensitizer drugEffects of thiazolidinediones on PPAR γAnti-diabetic effects of liver X receptor agonist
• In vitro methods Isolated pancreas of rat Isolated rat diaphragm

Blood glucose lowering effects in rabbitPrimary screening model for screening of blood glucose lowering compounds
Animals - 4-5 mixed breed rabbits of either sex with weight 3-4.5 kg
Conditions required: for insulin – food withheld overnight, for sulfonylureas and other blood glucose lowering agents – animals are on a normal diet prior to experiment. Animals should be in a special restraining box with free access to rabbit ears

Procedure
• Oral blood glucose lowering agents are applied by gavage in 1 ml/kg of 0.4%
starch suspension or IV in solution.
• Several doses are given to different groups. One control group receives vehicle
only.
• Blood is withdrawn immediately before and 1,2,3,4,5,24,48 and 72 hours after
treatment.
• For time-response curves values are also measured after 8,12,16 and 20 hours.
Blood glucose is determined in 10 μl blood samples with the hexokinase enzyme
method.

Evaluation
• Average blood sugar values are plotted versus time for each dosage.
• Percentage data related to the value before the experiment are calculated.
• Mean effects at a time interval are calculated using the trapezoidal rule.
• The values of the experimental group are compared statistically with t-test or
the Wilcoxon test for each time interval with those of control group.
• Dose dependencies and relative activities are determined by means of linear
regression analysis.

Blood glucose lowering effects in ratsProcedure
• Male Wistar rats of 180-240 gm are kept on a standard diet (Altromin
1324).
• Groups of 4-7 non-fasted animals are treated orally or IP with various
doses of test compounds suspended in 0.4% starch suspension. One
control group receives vehicle only.
• Blood is withdrawn from the tip of the tail immediately before and
1,2,3,5 and 24 hours after administration of test compound.

Evaluation
• Average blood sugar values are plotted versus time for each dosage.
• Percentage data related to the value before the experiment are
calculated.

Modifications:
• Studies in glucose loaded rats – in this method, glucose 1 gm/kg body
weight is given following the test compound either orally or SC
• Studies in streptozocin diabetic rats – in this method, diabetes is
induced with streptozocin which leads to fall in plasma insulin levels.
Compounds which release insulin from islets as the sole hypoglycemic
mechanism of action are not effective in these animals

Blood glucose lowering in mice• Eneroth and Ahlund (1968)
Animals – non-fasting mice of the same strain and sex, having body masses not more than ± 2 gm
Procedure:
• Assigned at random to 4 equal groups of not less than 10 animals.
• Two dilutions of a solution of the preparation to be examined and 2
dilutions of the reference solution are prepared

• In a preliminary experiment, concentrations of 0.02 IU and 0.10 IU are
tested.
• Each of the prepared solutions (0.1 ml/10 g body weight) is given SC
to one group of mice according to a randomized block design
• 2.5 hours later, each solution is given to a second group of mice
following a twin crossover design.
• At 30 minutes after each injection, a sample of 50 μl of blood is taken
from orbital venous sinus.

EvaluationThe potency is calculated by statistical methods for twin crossover studies.

Blood glucose lowering effects in dogs
Animals - male Beagle dogs 15-20 kg are kept on standard diet (Erka mixed feed 8500) and food withdrawn 18 hours prior to administration of test compound.
Procedure • Test compound is given orally or IV at various doses. Control animals
receive vehicle only. • Blood is collected at different time intervals upto 48 hours. • Blood glucose is estimated with hexokinase enzyme method
(Glucoquant test kit) and insulin with an immunological method (Riagnost kit).

Evaluation
• Average blood sugar values are plotted versus time for each dosage.
• Percentage data related to value before the experiment are
calculated.
• Mean effects over a time period are calculated using the trapezoidal
rule. Other statistical evaluation is similar to how it is done for rabbits.
• Plasma insulin levels are also plotted versus time and compared with
control values.

Modifications:
1. Studies in pancreatectomized dogs
Dogs are pancreatectomized 2-3 years prior to the study and kept on dry feed
and pancreatic enzymes.
A day before the study, a shorter acting insulin is given.
The test drug is given as oral suspension in tap water, whereas the control
animals receive only tap water.
Blood glucose is estimated before and upto 6 hours after treatment at hourly
intervals.
2. Studies in Alloxan diabetic dogs

In other species
• Male guinea pigs (250-380 gm) can also be used. Blood is withdrawn
from puncture of ear veins before and 1,3,5 hours after test
compound administration.
• Genetically obese and diabetic yellow KK mice have also been used by
some for evaluation of hypoglycemic activity of potential anti-diabetic
drugs.

Euglycemic clamp technique
“gold standard”
Purpose and rationale:
• This is a useful method of quantifying in vivo insulin sensitivity in
humans (DeFronzo et al 1979).
• Variable glucose infusion is given to maintain euglycemia during
insulin infusion.

Animals: male Wistar rats weighing 150-200 gm
Procedure:
catheters inserted into a jugular vein – for blood collection
femoral vein – insulin and glucose infusion
Physiological hyperinsulinemia - 6 mU/kg/min
Maximal hyperinsulinemia - 30 mU/kg/min
The blood glucose concentrations are estimated from samples collected
at 5 minutes intervals during 90 minute clamp test.

• The glucose infusion rate is adjusted so as to maintain blood glucose at
basal level during the test.
• The final glucose infusion rate is calculated from the amount of glucose
infused for the last 30 minutes (from minute 60-90 from the start of the
test) in which the blood glucose is maintained in a steady state.
• The steady state plasma insulin concentration is calculated from the
insulin concentration at 60 and 90 minutes after the start of the clamp.
• Free fatty acid concentrations are also measured at the start and end of
the clamp to measure the FFA suppression rate.

Evaluation
• When steady state plasma insulin is maintained at submaximal
concentration by this technique, the glucose infusion rate and glucose
metabolic clearance rate value are considered to reflect the state of
receptor binding levels in peripheral tissue as an index of insulin
sensitivity.
• Under maximal hyperinsulinemia, these values are thought to reflect
the state of enzymes and glucose transport system activated after
binding to receptors, indicating mainly insulin responsiveness.

Hypoglycemic seizures in mice
The biological assay of insulin using hypoglycemic seizures in mice has been suggested in 1923 by Fraser.In most Pharmacopoeias, the biological assays have been replaced by chemical methods now.
Animals – 96 mice of either sex weighing 20 ± 5 gm randomly distributed into 4 groups
Procedure:
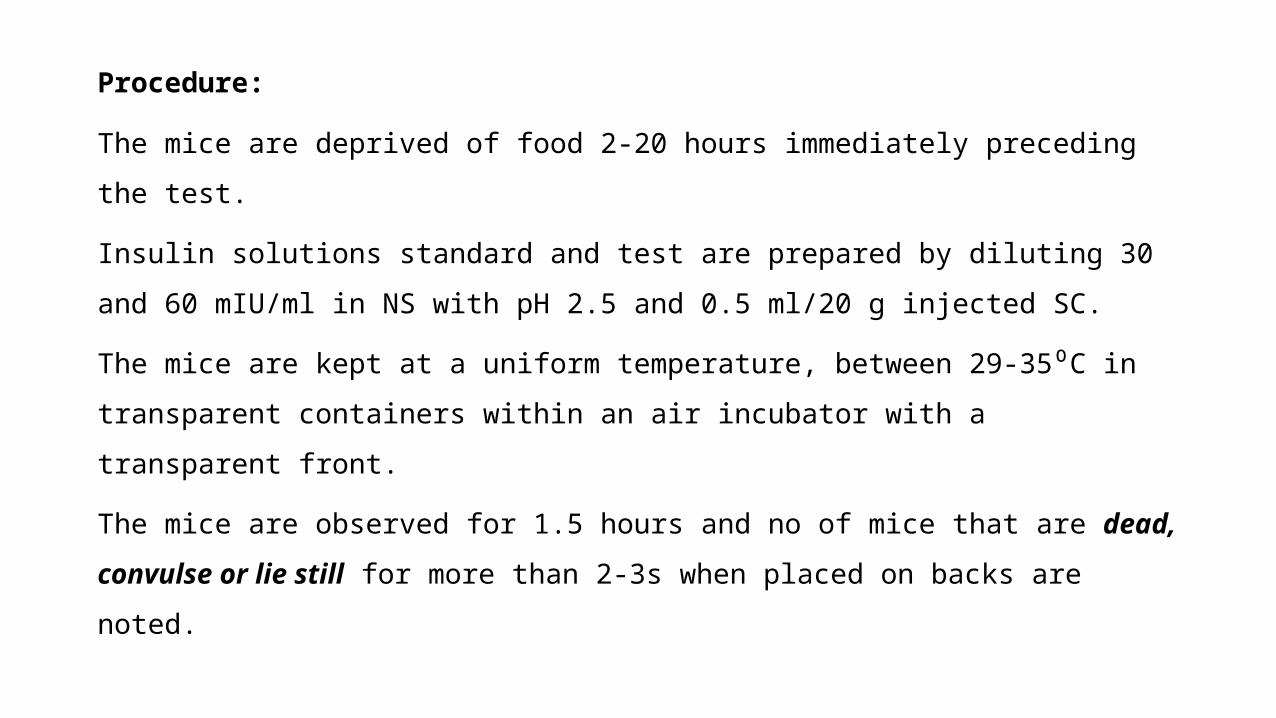
The mice are deprived of food 2-20 hours immediately preceding the test.
Insulin solutions standard and test are prepared by diluting 30 and 60
mIU/ml in NS with pH 2.5 and 0.5 ml/20 g injected SC.
The mice are kept at a uniform temperature, between 29-35⁰C in
transparent containers within an air incubator with a transparent front.
The mice are observed for 1.5 hours and no of mice that are dead,
convulse or lie still for more than 2-3s when placed on backs are noted.

Evaluation:The percentage of mice of each group showing the above mentioned symptoms is calculated and relative potency of test solution is calculated using a 2+2 point assay.
Modifications:Suggested by Young and Lewis in 1947, also done by Vogel in 1964The rotating drum method

Effects of insulin sensitizer drugs
• These compounds do not lower blood glucose in normal animals
In vivo studies• Various animals are used viz. ob/ob mice, db/db mice, Chinese hamsters,
Zucker fatty rat, yellow KK mice, obese Beagle dogs, streptozocin diabetic rats.
In vitro studies• Reversal of cAMP induced post insulin receptor resistance in Rat adipocytes,• Cultured hepatoma cells – increase glycogen synthase I activity,• Stimulation of fructose-2,6-BP in rat hepatocytes,• Prevention of glucose induced insulin resistance of insulin receptor in rat 1
fibroblasts,

Effects of thiazolidinediones on PPAR γ
• Thiazolidinediones are potent activators of PPAR γ.
• Thiazolidinediones were shown to reduce the circulating resistin levels
and increase adiponectin in mice.
• Berger et al in 1996 found a correlation of anti-diabetic actions of
thiazolidinediones in db/db mice with the conformational change in
PPAR γ.

Various methods in demonstrating anti-diabetic property of thiazolidinediones are,
1. Binding assay
2. Transactivation assay
3. Lipogenesis assay
4. Protein digestion assay

Anti-diabetic effects of liver X receptor agonists
• Nuclear receptors LXRα and LXRβ are sensors of cholesterol
metabolism and lipid biosynthesis.
• LXRα is a target gene of PPAR γ.
• Insulin also induces LXRα in hepatocytes and increases the expression
of lipogenic enzymes and suppresses key gluconeogenesis enzymes.
• Treatment of diabetic rodents with LXRα agonist was shown to reduce
plasma glucose.

Procedure:
• Obese insulin-resistant female Zucker (fa/fa) rats, 10 weeks of age, are
orally gavaged for 9 days with either vehicle or the LXRα agonist.
• Eight hours after the last dose, animals are fasted overnight and on the
following morning subjected to an oral GTT.
• Blood was obtained via the tail vein at time 0 and times 15, 30, 60, and
120 min after an oral glucose challenge.
• Plasma glucose and insulin levels are analyzed on all samples, and the
results are expressed as the product of glucose AUC and insulin AUC.

Isolated rat pancreas
PurposeUsed for studying the effect of drug on Insulin, glucagon, somatostatin secretion.
Procedure• Adult Wistar rat (150-200 gm) are fed ad libitum .
• Pancreas are removed under Pentobarbital (50 mg/kg IP)• Through a portal vein canula Krebs-ringer bicarbonate buffer with 2% bovine
albumin & 5.5 mmol/l glucose is perfuse at rate of 1.75 ml/min. at pressure 100mmHg.• Perfusate is collected every min. for 30 min. after first 5 min. test drug added
till 15 min. next 16-30 min glucose is perfused.

Evaluation
Insulin, Glycogen, Somatostatin are estimated using Radioimmunoassay.
The effect of test drug on hormone secretion of pancreas in response to elevated glucose level is compared with the control.

Isolated rat diaphragm
Purpose:Determination of Insulin based on the stimulation of glucose uptake by the isolated diaphragm from rat .
Procedure:Animal - Male Sprague Dawley (70-100 gm) Animal sacrificed during anesthesia and diaphragm are carefully removed, spread out and divided into two equal piecesHemi diaphragm are incubated in Krebs buffer solution with carbogen with 5µM glucose, insulin or compound to be tested.

After 30 min hemidiaphragm are blotted on tissue, grounded on porcelin
mortar pestle chilled with liquid nitrogen
After 4 hour at -200C Sample centrifuged for 10 min.
Evaluation
The concentration dependent of glucose uptake and conversion into
glycogen and concentration of insulin or insulin mimetic compound are
determined.

Conclusion
• For an animal model to have relevance to study of type 2 DM in
humans, either the characteristics of the animal models should
mimick the pathophysiology and natural history of diabetes or it
should develop complications of diabetes similar to that in humans.
• No single animal model encompasses all these characteristics and
there are various models in use that mimick various conditions as
seen in humans.


