Technical Sciences, 2016, 19(2) 151–164 EXPERIMENTAL INVESTIGATIONS OF CAVITATING FLOWS IN A VENTURI TUBE Agnieszka Niedźwiedzka, Wojciech Sobieski Department of Mechanics and Basics of Machine Construction, Faculty of Technical Sciences, University of Warmia and Mazury in Olsztyn Received 5 March 2015, accepted 18 April 2016, available online 6 May 2016. K e y w o r d s: cavitation, test rig, Venturi tube. Abstract This article presents results of the experimental measurements of the cavitation phenomena in a Venturi tube with water as the working medium. Three variants of such tube were tested. Angles of converging and diverging sections are equal to 45 o and 45 o , 30 o and 60 o , 45 o and 60 o , respectively. In every case the throat diameter is equal to 3 mm and the throat length to 6 mm. The average flow velocity ranges from 0.1 to 0.5 m/s. During measurements, the average flow velocity, upstream and downstream pressure and water temperature were recorded. Additionally, by the use of a high-speed camera and a simple digital camera, information about the size and the shape of the bubble clouds for different flow conditions was collected. The aim of the article is data acquisition for the further numerical analyses. The experimental runs executed for this paper are to help provide more information about this type of flow, since numerical modeling of the cavitation phenomena in Venturi tubes is still very difficult and in many cases even quantitative agreement is impossible to obtain. Introduction Cavitation phenomena could be defined as the evaporation process of a liquid in areas where the local pressure drops below the saturation pressure. This pressure depends in turn on the temperature of the liquid. If the pressure increases (in space or in time), the vapour bubbles disappear. Cavitation is generally undesirable due to its negative consequences: erosion, noise, vibra- tions and energy losses (BAGIEŃSKI 1998). Correspondence: Agnieszka Niedźwiedzka, Katedra Mechaniki i Podstaw Konstrukcji Maszyn, Uniwersytet Warmińsko-Mazurski, ul. Oczapowskiego 11, 10-736 Olsztyn, e-mail: agnieszka.niedz- [email protected]
Transcript
Technical Sciences, 2016, 19(2) 151–164
EXPERIMENTAL INVESTIGATIONS OF CAVITATINGFLOWS IN A VENTURI TUBE
Agnieszka Niedźwiedzka, Wojciech SobieskiDepartment of Mechanics and Basics of Machine Construction, Faculty of Technical Sciences,
University of Warmia and Mazury in Olsztyn
Received 5 March 2015, accepted 18 April 2016, available online 6 May 2016.
K e y w o r d s: cavitation, test rig, Venturi tube.
A b s t r a c t
This article presents results of the experimental measurements of the cavitation phenomena ina Venturi tube with water as the working medium. Three variants of such tube were tested. Angles ofconverging and diverging sections are equal to 45o and 45o, 30o and 60o, 45o and 60o, respectively. Inevery case the throat diameter is equal to 3 mm and the throat length to 6 mm. The average flowvelocity ranges from 0.1 to 0.5 m/s. During measurements, the average flow velocity, upstream anddownstream pressure and water temperature were recorded. Additionally, by the use of a high-speedcamera and a simple digital camera, information about the size and the shape of the bubble clouds fordifferent flow conditions was collected. The aim of the article is data acquisition for the furthernumerical analyses. The experimental runs executed for this paper are to help provide moreinformation about this type of flow, since numerical modeling of the cavitation phenomena in Venturitubes is still very difficult and in many cases even quantitative agreement is impossible to obtain.
Introduction
Cavitation phenomena could be defined as the evaporation process ofa liquid in areas where the local pressure drops below the saturation pressure.This pressure depends in turn on the temperature of the liquid. If the pressureincreases (in space or in time), the vapour bubbles disappear. Cavitation isgenerally undesirable due to its negative consequences: erosion, noise, vibra-tions and energy losses (BAGIEŃSKI 1998).
Correspondence: Agnieszka Niedźwiedzka, Katedra Mechaniki i Podstaw Konstrukcji Maszyn,Uniwersytet Warmińsko-Mazurski, ul. Oczapowskiego 11, 10-736 Olsztyn, e-mail: [email protected]
In real-life applications, cavitation occurs even if the local value of thepressure is higher than the saturation pressure. Such state is due to the factthat in real fluids small bubbles of the non-dissolved gases exist. The presenceof such bubbles (called nuclei) is observed for each kind of liquid it may causea change in the tensile stress of the liquid, in terms of decreasing it. (BAGIEŃSKI
1998). The tensile stress for „clear” water (for temperatures in the 5–15oCrange) reaches values of approximately 27 MPa and depends on the tempera-ture of liquid. The increase of temperature translates into a drop of the value oftensile stress. The tensile stress is reduced to zero at approximately 374oC(KNAPP et al. 1970). Change in tensile strength may also change other materialproperties, which depend upon it: density, viscosity, surface tension and aircontent (NOSKIEVIC 1969).
However, it is possible for cavitation to still occur, even in the absence ofnuclei. The theory of liquid disturbance describes the phenomenon of homo-geneous nucleation. This theory relates to the possibility of creating bubbleswith critical dimensions in water without any nuclei. Liquids, considered at themolecule level, are in the dynamic state, which means that these molecules arein continuous motion. Through the motion of the molecules, empty spaces maybe formed between them. Under favourable conditions, i.e. increase of tem-perature or/and drop of pressure, these spaces could turn into bubbles withcritical dimensions (APFEL 1972).
The discovery of a new physical phenomenon in 1894, responsible fordestruction of a ship propeller (REYNOLDS 1894), opened a new period in theworld of technical science. The scale of negative after-effects of the appearanceof unexpected vapour bubbles in water persuaded scientists to familiarize withthe unknown phenomenon. The observations conducted in natural environ-ment could not help to find the answer to many questions. The only way toshed light on the enigmatic phenomenon was an experiment. Experimentalstudies of cavitating flows are carried out until 1935 (HUNSAKER 1935). Thestory of Venturis as the object of the interests of scientists started in 1952(RANDALL 1952). Since 1962, the experimental investigations of the flow insideVenturis have taken into account also the influence of cavitation (NUMACHI etal. 1962, NUMACHI, KOBAYASCHI 1964). The complex character of the cavitationphenomenon resulted in experimental studies of cavitating flow inside Ven-turis to be continued to this day (ABDULAZIZ 2014, DECAIX, GONCALVES 2013).
The main function of Venturis is a passive control of the mass flow rate.These devices are a common application in industry. The Venturis as anapplication can be found first in parts of hydraulic systems, where a constantmass flow rate is expected. Their big advantage is the assurance of anunchanging flow rate independent from the variable pressure in a chamber.Through these features, Venturis, as a precise tool, could be used as a flow
Agnieszka Niedźwiedzka, Wojciech Sobieski152
Technical Sciences 19(2) 2016
meter (GHASEMMI, FASIH 2011). Their construction consists of three parts:a converging section (nozzle), throat, and a diverging section (diffuser). To themost essential features of Venturis, which have an influence on the mass flowrate and the flow character, belong the throat diameter, the throat length andthe diffuser angle (ASHRAFIZADEH, GHASEMMI 2015). The broad applications ofVenturi tubes support the simple form of the device. Additionally, theirconstruction does not have any moving parts. Consequently, the production ofVenturis does not require a lot of finance and these devices are characterizedby high reliability. Therefore, use of these devices is on the one hand practicaland on the other hand economical (GHASEMMI, FASIH 2011).
Venturi tubes, despite that they are a basic geometry, they are devices withvaried shapes. In the classical form of Venturi tube presented in ISO 5167-1:2005, the angle of diverging section ranges from 7 to 15o and the angle ofconverging section is 21o. Scientists analysed also other shapes of Venturitubes. NUMACHI et al. (1962) investigated in 1962 Herschel Venturi-tube. Thistube is characterised by a sharper converging angle and is also the currentresearch object. Brinkhorst et al. presented in 2015 the results of numericalsimulations of cavitating flow in Herschel Venturi tube. They analyzed theinfluence of geometry parameters on the stability of the mass flow rate.Additionally, the authors made the same investigations for toroidal Venturinozzle (ISO 9300:2005) which is distinguished by a radius in the convergingsection and a direct transition to the diverging section.An important type ofa Venturi tube is an asymmetric Venturi (BARRE et al. 2009, RODIO, CONGEDO
2014, CHARIERRE et al. 2015). BARRE et al. (2009) presented double opticalprobe measurements and numerical studies based on the code FineTM/Turboand a barotropic approach. Rodio and Congedo prepared a stochastic analysisof cavitating flow. CHARIERRE et al. studied an aperiodic cavitation pocket in anasymmetric Venturi using chosen homogeneous models.
The main aim of the investigations of the cavitation phenomenon is to buildnew simulation models for different kinds of Venturi tubes using the homo-geneous approach.The motivation to begin such investigations relate to thecavitation phenomena in Venturi tubes was the fact that the current availableand most popular cavitation models are still too poor for such flows. Resultsfrom numerical modeling are too different from observations even on thequalitative level. According to the literature, the prediction of the cavitationphenomenon in the Venturi tubes in one of the most difficult cases and furtherinvestigations in this field are needed (PALAU-SALVADOR et al. 2007). For thisreason, the Venturi tubes are often the subject of research of cavitating flows(BAYLA et al. 2009, TAMHANKAR et al. 2014, BRINKHORST et al. 2015). Despitewidespread interest of scientists in this field, having a large number ofdifferent shapes for Venturi tubes impedes finding the expected experimental
Experimental Investigations of Cavitating... 153
Technical Sciences 19(2) 2016
results for the chosen shape. For the mentioned study, recording the bestaccuracy of the Venturi tubes performance in experimental measurements isnecessary. For this purpose, a new test rig was designed and built, which ispresented in this article.
The article has the following structure: the first part is devoted to acquaintthe reader with the design assumption. Knowledge of the validation process ofthe numerical models enables the reader to understand the detailed construc-tion of the test rig. The description of the test rig, which is the second part ofthe article, starts with the history of investigation of cavitating flows at theFaculty of Technical Sciences and presents a comparison between the old andthe new version of the test rig. After the introduction, a diagram of the deviceand the detailed presentation of the most important components follows. Thenext step of the article is the overview of the technical data and the descriptionof the typical measurement process. The third part of the article is presenta-tion of the capabilities of the experimental investigation of cavitating flowsusing the new test rig. The article ends with conclusions on the resultsobtained.
Assumptions
There are three basic approaches to integrate numerical fluid analyses withexperiments (SOBIESKI 2013). The first approach (Fig. 1a) supposes onlyone-way interaction of experimental data with numerical analyses (CFD– Computational Fluid Dynamic). However, during creation of the simulationmodel it may happen that the experimental data proves to be insufficient or itsquality will be too low. There is no possibility to repeat the investigation, so theresults of the numerical simulations could be incorrect. The second approach(Fig. 1b) submits a correction to the previous version. The experiment can berepeated, if it is necessary, which translates in an improvement of thecompatibility of the results between the real case and the virtual model. Thedisadvantage of this approach are time and cost needed for the repetition of theexperiment. Besides, in some cases the experiment cannot be performed again.The best way to integrate the experimental and numerical investigations is theapplication of the following methodology (Fig. 1c): first, the preliminarynumerical model is created. Then the experiment is planned and performedtaking into account the knowledge about requirements of the numerical model.Finally, the preliminary numerical model is corrected and calibrated. In thecurrent investigation, this methodology is applied, therefore at the beginningof investigations, the preliminary numerical model was created.
The data for numerical fluid simulations can be divided into three groups:geometry data, data defining the kind of fluid and information about theboundary conditions. The geometry data is necessary for mesh preparation.The rule for this case is as follows: the simpler geometry of the grid, the easierthe meshing process will be and a shorter calculation time will be required. Thedata describing the physical medium includes information about the densityand viscosity of the fluid. Since the analysed case concerns water, only itstemperature has to be known. The temperature is an important parameter forcavitation phenomenon because it can change details the saturation pressure.For this reason, the experimental measurements should be performed witha constant temperature. There are three methods to establish the desiredtemperature. The first method assumes use of cold water and fast measure-ments. In the second approach the measurement may be performed aftera time in which the system achieves the state of the thermodynamic equilib-rium (the temperature will be constant). The third method assumes theautomatic control of the temperature. This solution is the most convenient.The last set of information concerns boundary conditions. These terms shouldbe understood as flow parameters. These parameters can be included in thesimulation model in two ways. The first way assumes introducing informationabout the inlet velocity and outlet pressure. In the second method, informationabout the total inlet pressure and the dynamic inlet pressure should be used.In this case is important to enter the additional data about the referencevalues. The presented test rig meets the design assumptions.
Laboratory setup and methods
Test rig
The idea of experimental and numerical investigations of cavitation inhydraulic systems started at the Department of Mechanic and Basics of
Experimental Investigations of Cavitating... 155
Technical Sciences 19(2) 2016
Machine Construction at the Faculty of Technical Sciences of the University ofWarmia and Mazury in Olsztyn between 2002 and 2004. The first test rig wascreated for the purpose of investigating cavitating flows. Using this test rig,photos were taken of the cavitation cloud behind the cavitation inducer andvibroacoustic analyses on the basis of the noise measurements in the flow wereconducted (SOBIESKI 2004, 2005).
In 2010, this prototype was replaced with a new test rig (Fig. 2), which isdirectly intended for performing experiments of turbulent and cavitatingflows, as well as many other flow phenomena. The device was made within theframework of the project TECH 2010. In comparison with the prototype, thenew test rig was improved and has a few advantages. Some of these advantagesare: having an inter alia with smaller dimensions, having the ability of motionusing the wheels, automatic acquiring and saving of the signal from all sensors,direct displaying of the data, simple control of the flow velocity and the liquidtemperature, as well as the independence from the connection to the watermains.
Fig. 2. The test rig from 2010
The scheme of the test rig is presented in the Figure 3. The whole deviceweighs approximately 115 kg. Its weight with water increases to approximately195 kg. The test rig is 190 cm in height, 50 cm in width and 180 cm in length.The independence from the connection to the water mains is ensured by thehydraulic system with closed water circulation. The used self-priming pump upto 10 bar is suitable for liquids with the temperature not exceeding 110oC,density not exceeding 1300 kg/m3 and viscosity not exceeding 150 mm2/s. Themaximum permissible size of impurities in form of indelible solid particles is
Agnieszka Niedźwiedzka, Wojciech Sobieski156
Technical Sciences 19(2) 2016
0.5 mm. The pump can obtain a maximum efficiency at level of 7 m3/h, whichtranslates into a linear velocity of water in the cavitation chamber of 1 m/s.A motor having a power of 5.5 kW is used as a drive to the self-priming pump.
Fig. 3. The diagram of the test rig from 2010: 1 – water tank, 2 – motor, 3 – water pump, 4 – cavitationchamber, 5 – water indicator, 6 – heater, 7 – water level sensor, 8 – velocity inlet sensor, 9 – pressureinlet sensor, 10 – temperature inlet sensor, 11 – proximity sensor of the chamber, 12 – additionalproximity sensor, 13 – pressure outlet sensor, 14 – temperature outlet sensor, 15 – control panel
The test rig is equipped with seven sensors that can work with temperaturebelow 100oC and humidity below 50%. The measurements can be started, whenthe external temperature is between 0 and 40oC. The sensor of water level inthe water tank is located in the right wall. The sensor is placed about 26 cmabove the tank bottom, which corresponds to 46 l of liquid. It is the minimumsafe level at which the water pump can be started. The direct control of fillinglevel is enabled through the water indicator. The last sensors, placed below thetabletop, give information about the linear fluid velocity. To reduce thefluctuations of the signal, a filter with time constant of nine seconds wasapplied. Consequently, the data in display are delayed with regard to thecorrect flow.
The most interesting part of the test rig, i.e. the cavitation chamber, isplaced above the tabletop. The plexiglas pipe has the internal diameter of 50mm. The distance between both flanges is 1,000 mm. The cavitation chamberis only one of the variants of the system, which can be investigated using thepresented test rig. The elbows of the inlet and outlet pipes are equipped withsensor sets, which include temperature and pressure sensors. The precision of
Experimental Investigations of Cavitating... 157
Technical Sciences 19(2) 2016
each temperature sensor is 0.5oC. The pressure measuring range is between0 and 10 bars. Additionally, on the right side of the left flange of the cavitationchamber, is placed a proximity sensor which has the aim to counteractswitching on the hydraulic system in case there is a lack of the cavitationchamber.
The operating panel ensures the control of measurements. It has three flipswitches to turn on power, motor and heater. Determination of temperatureand percentage use of the motor is made by two independent potentiometers.The values of the given and the current temperature of water in the elbows ofthe inlet and outlet pipe and the percentage use of the motor are displayed onthe LCD monitor. To other information, which can be found on the LCDmonitor, belong the water pressure in the elbows of the inlet and outlet pipeand the linear velocity of the flow.
Venturis
In the analysed case, the cavitation inducers are three Venturi tubes(Fig. 4), which have their dimensions presented in the Figure 4. The angles ofconverging section were selected for the first Venturi as 45o (Fig. 4a), for thesecond 60o (Fig. 4b) and for the third 30o (Fig. 4c). The angles of divergingsections were selected as 45o, 30o and 60o, respectively. The throat has diameterof 3 mm and 6 mm length. The outside diameter of the Venturi tube is 50 mm.The Venturi is placed within 300 mm of the left edge of the cavitation chamber.
Fig. 4. Dimensions of the Venturi tube
Experimental method
To investigate the behaviour of the flow in the Venturi channel and thecavitation chamber an experiment has been conducted. In the experiment, thevelocity flow and the temperatures and pressure at the inlet and outlet of thecavitation chamber have been measured. During the test, the value of thedownstream pressure was constant; the value of the upstream pressure was
Agnieszka Niedźwiedzka, Wojciech Sobieski158
Technical Sciences 19(2) 2016
variable. The data obtained in the experiment is presented in form of tables.The shapes of the cavitation cloud have been registered using a high-speedcamera (Olympus i-SPEED TR, 1000 frames per second) and a simple digitalcamera (Nicon Coolpix P610).
Results and discussion
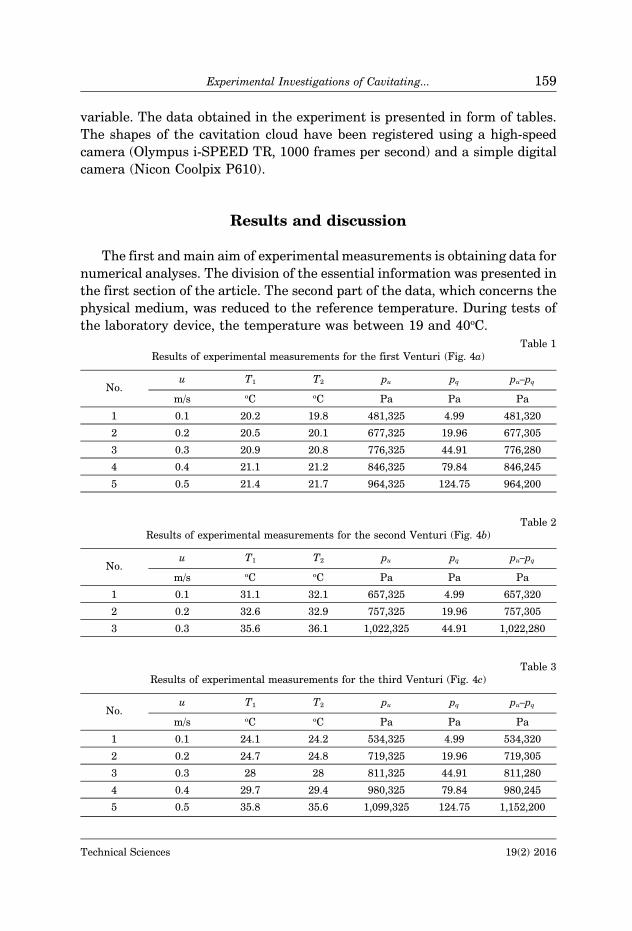
The first and main aim of experimental measurements is obtaining data fornumerical analyses. The division of the essential information was presented inthe first section of the article. The second part of the data, which concerns thephysical medium, was reduced to the reference temperature. During tests ofthe laboratory device, the temperature was between 19 and 40oC.
Table 1Results of experimental measurements for the first Venturi (Fig. 4a)
No.u T1 T2 pu pq pu–pq
m/s oC oC Pa Pa Pa
1 0.1 20.2 19.8 481,325 4.99 481,320
2 0.2 20.5 20.1 677,325 19.96 677,305
3 0.3 20.9 20.8 776,325 44.91 776,280
4 0.4 21.1 21.2 846,325 79.84 846,245
5 0.5 21.4 21.7 964,325 124.75 964,200
Table 2Results of experimental measurements for the second Venturi (Fig. 4b)
No.u T1 T2 pu pq pu–pq
m/s oC oC Pa Pa Pa
1 0.1 31.1 32.1 657,325 4.99 657,320
2 0.2 32.6 32.9 757,325 19.96 757,305
3 0.3 35.6 36.1 1,022,325 44.91 1,022,280
Table 3Results of experimental measurements for the third Venturi (Fig. 4c)
No.u T1 T2 pu pq pu–pq
m/s oC oC Pa Pa Pa
1 0.1 24.1 24.2 534,325 4.99 534,320
2 0.2 24.7 24.8 719,325 19.96 719,305
3 0.3 28 28 811,325 44.91 811,280
4 0.4 29.7 29.4 980,325 79.84 980,245
5 0.5 35.8 35.6 1,099,325 124.75 1,152,200
Experimental Investigations of Cavitating... 159
Technical Sciences 19(2) 2016
The last part of data includes boundary conditions, in other words, flowparameters. In case of cavitation simulation both ways of defining of flowparameters, velocity inlet – pressure outlet and pressure inlet – pressureoutlet, are possible. All desired information are either displayed on the LCDmonitor (average fluid velocity – u, inlet total pressure – pu and outlet totalpressure – pd) or calculated based on this information (dynamic pressure –pq, difference between the inlet total pressure and the inlet dynamicpressure pu – pq). In the tables 1–3 data from the experimental measurementsis presented. Pressure in the outlet of cavitation chamber (pd) has a constantvalue of 101.325 Pa.
From the data presented in the Tables 1–3 it is evident that the maximumaverage velocity at the inlet of the cavitation chamber is 0.5 m/s. In the case ofthe second type of Venturi, the maximum average value of the velocity achievesonly 0.3 m/s. The temperature of the medium starts from 19oC and finishesbefore reaching 40oC. The total pressure at the inlet of cavitation chambervaries from about 4 bar (for the average velocity at the inlet equal to 0.1 m/s) to10 bar (for 0.5 m/s). The differences between upstream total pressure andupstream average velocity for the analysed variants of Venturis are notable.For the upstream average velocity equal to 0.1 m/s the value of the upstreamtotal pressure starts from 3.8 bar for the first type of Venturi, for the third typeachieves value 4.33 bar and for the second 5.56 bar. The differences are visiblein the whole of the experimental measurements. For the upstream averagevelocity of 0.3 m/s, the value of the upstream total pressure starts from 6.75bar for the first type of Venturi, for the third type achieves value 7.1 bar andfor the second 9.21 bar. Additionally, the maximum upstream average velocityfor the second type of Venturi is only 0.3 m/s, which is a direct indicator thatchanges in the angles of Venturi influences the upstream velocity and up-stream pressure. ASHRAFIZADEH and GHASEMMI (2015) indicate that changingof the diverging section angle does not affect the values of upstream pressureand velocity. However, the changes of the converging section angle are notwithout impact on these values.
The second aim of experimental measurements is obtaining data that isuseful by post-processing. The test rig has not any instrumentation that wouldallow collecting data for validation process. The simplest and the most commonmethod is evaluation of the intensity and size of the cavitation cloud based onphotos. Photos can be made using a high-speed camera (Fig. 5–7) or evena simple camera (Fig. 8). Photos can be compared with distribution of vapourvolume fraction in the chamber from numerical simulations. In the Figures5a–5e are presented cavitation clouds for the first type of Venturi for fiveupstream velocities: 0.1, 0.2, 0.3, 0.4 and 0.5 m/s. For the velocity equal to0.1 m/s, the cavitation cloud is only faintly visible. Increasing velocity leads
Agnieszka Niedźwiedzka, Wojciech Sobieski160
Technical Sciences 19(2) 2016
Fig. 5. Cavitation cloud at different velocities for the first type of Venturi: a – 0.1 m/s, b – 0.2 m/s,c – 0.3 m/s, d – 0.4 m/s, e – 0.5 m/s
Fig. 6. Cavitation cloud at different velocities for the third type of Venturi: a – 0.1 m/s, b – 0.2 m/s,c – 0.3 m/s, d – 0.4 m/s, e – 0.5 m/s
Experimental Investigations of Cavitating... 161
Technical Sciences 19(2) 2016
Fig. 7. Cavitation cloud at different velocities for the second type of Venturi: a – 0.1 m/s, b – 0.2 m/s,c – 0.3 m/s
Fig. 8. Photo of cavitation cloud made using a simple camera
to clearer contours between the vapour bubbles and water. Starting from the0.3 m/s velocity, it is visible that the stream of vapour bubbles after leaving ofthe diverging section heads for the downstream part of the cavitation chamberand then bounces upstream, forming a hook shape. Between the cavitationclouds for the first and the third type of Venturi (Fig. 6a–6e) there are manysimilarities. Among these a blurred shape of the cavitation cloud for the lowupstream velocity (Fig. 6a) and the increasing of its intensity for highervelocities (Fig. 6b–6e). The difference between the analysed cavitation clouds istheir shape. For the third type of Venturi, the cavitation cloud has no hookform anymore, but a slightly wavy line. The shape for a second type of Venturiis different from the above described (Fig. 7a–7c). A hook form or a slightlywavy line is no more visible. The cavitation cloud spreads to the whole volumeof the cavitation chamber for each of the analysed upstream velocities.Increasing of the upstream velocity leads to increasing of the intensity of thecavitation cloud and its length.
Conclusions
Based on the experimental measurements the following concluding re-marks can be made:
Agnieszka Niedźwiedzka, Wojciech Sobieski162
Technical Sciences 19(2) 2016
– Using the test rig, in objects like a Venturi tube, cavitating flow can beobserved.
– The control range of the test rig is sufficient to obtain an intensive andbroad cavitating cloud.
– Using the measuring system of the test rig, essential data about pressureand velocity at the inlet and outlet of the cavitation chamber and the watertemperature can be obtained.
– Based on the experimental data and the dimensions of the cavitationchamber numerical models for the considered flow cases can be prepared. Itmeans that the main aim of the experimental measurements is achieved.
– Use of the high-speed camera gives a qualitative observation of theintensity and extent of the cavitation cloud. The gathered results should besufficient material to make comparisons between the experiment and numeri-cal simulations. More over, as shown in the literature study, the mostimportant in the case of Venturis is quality of the experimental and numericaldata.
– Using a simple camera did not give enough good results in terms ofquality. This method, which is simpler and more accessible, is only of auxiliaryimportance.
– The type of Venturi and flow parameters has influence on the intensityand extent of the cavitation cloud. In the considered investigation range threeforms of cavitation cloud were observed: a hook form, a slightly wavy line anddispersed.
– Reconstruction of the right flow structure in numerical models will beprobably the most difficult stage of the numerical simulations.
– A better quality of the experimental data can be achieved using ParticleImage Velocimetry (PIV), but currently we do not have access to suchmeasurement systems. To resolve this problem we will try to use an alternativemethod, which was developed in cooperation with the Department of Electricaland Power Engineering, Electronics and Automation, and will be presented ina future publication.
Acknowledgements
The authors want to thank Dr. Eng. Andrzej Anders for photos made usinga high-speed camera.
Experimental Investigations of Cavitating... 163
Technical Sciences 19(2) 2016
References
ABDULAZIZ A. M. 2014. Performance and image analysis of a cavitating process in a small type Venturi.Experimental Thermal and Fluid Science, 53: 40–48.
APFEL R.E. 1972. The tensile strength of liquids. Scientific American, 227(6): 58–71.ASHRAFIZADEH S.M., GHASEMMI H. 2015. Experimental and numerical investigation on the performance
of small-sized cavitating Venturis. Flow Measurement and Instrumentation, 42: 6–15.BAGIEŃSKI J. 1998. Kawitacja w urządzeniach wodociągowych i ciepłowniczych. Wydawnictwo Polite-
chniki Poznańskiej, Poznań.BARRE S., BOITEL G., ROLLAND J., GONCALVES E., FORTES PATELLA R. 2009. Experiments and modeling of
cavitating flows in venturi: attached sheet cavitation. Europan Journal of Mechanics B/Fluids,28(3): 444–464.
BAYLA A., AYDIN M.C., UNSAL M., OZKAN F. 2009. Numerical modeling of venturi flows for determiningair injection rates using fluent v6.2. Mathematical and Computational Applications, 14(2): 97–108.
BRINKHORST S., VON LAVANTE E., WENDT G. 2015. Numerical investigation of effects of geometry oncavitation in Herschel Venturi-tubes applied to liquid flow metering. ISFFM, Conference Paper,Arlington.
CHARIERRE B., DECAIX J., GONCALVES E. 2015. A comparative study of cavitation models in a Venturiflow. Europan Journal of Mechanics B/Fluids, 49: 287–297.
DECAIX J., GONCALVES E. 2013. Investigations of a three-dimensional effects on a cavitating Venturiflow. International Heat and Fluid Flow, 53: 40–48.
GHASSEMI H., FASIH H.F. 2011. Application of small size cavitating Venturi as flow controller and flowmeter. Flow Measurement and Instrumentation, 22: 406–412.
HUNSAKER J.C. 1935. Progress report on cavitation research at MIT. ASME Transactions, 57(7):423–424.
KNAPP R.T., DAILY J.W., HAMMIT F.G. 1970. Cavitation. McGraw-Hill, New York.NOSKIEVIC J. 1969. Kavitace. Akademia, Praha.NUMACHI F., KOBAYASCHI R. 1964. Einflus der Kavitation auf die Durchfluszahl der Venturiduse.
Forsch. Ing.-Wes., 30(3): 86–93.NUMACHI F., KOBAYASCHI R., KAMIYAMA S. 1962. Effect of cavitation on the accuracy of Herschel-type
Venturi tubes. Trans. ASME, Series D. J. Basic Engng., 84(3): 351–362.PALAU-SALVADOR G., GONZALEZ-ALTOZANO P., ARVIZA VALVERDE J. 2007. Numerical modeling of cavitat-
ing flows for simple geometries using FLUENT V6.1. Spanish Journal of Agricultural Research,5(4): 460–469.
RANDALL L.N. 1952. Rocket applications of the cavitating Venturi. J Am Rock Soc. 22: 28–38.REYNOLDS O. 1894. Experiments showing the boiling of water in an open tube at ordinary temperatures.
Scientific Papers on Mechanical and Physical Subject. II. Cambridge University Press, Cam-bridge, 1900–1903: 578–587.
RODIO M.G., CONGEDO P.M. 2014. Robust analysis of cavitating flow in Venturi tube. Europan Journalof Mechanics B/Fluids, 44: 88–99.
SOBIESKI W. 2013. Relationships between CFD and experimental fluid mechanic. Technical Sciences,16(3): 169–177.
SOBIESKI W. 2004. Stanowisko laboratoryjne do badania zjawiska kawitacji metodą wibroakustyczną.Diagnostyka, 32: 37–42.
SOBIESKI W. 2005. Stanowisko laboratoryjne do badania zjawiska kawitacji. V Warsztaty„Modelowanie przepływów wielofazowych w układach termochemicznych. Zaawansowane tech-niki pomiarowe”, Stawiska.
TAMHANKAR N., PANDHARE A., JOGLEKAR J., BANSODE V. 2014. Experimental and CFD analysis of flowthrough venturimeter to determine the coefficient of discharge. International Journal of LatestTrends in Engineering and Technology, 3(4): 194–200.


![Multi-fidelity optimization of super-cavitating hydrofoils · flows around any 2D hydrofoils shape [24] and successively extended to consider three dimensional geometries. The parametric](https://static.documents.pub/doc/80x56/5b3141537f8b9a81728b9207/multi-fidelity-optimization-of-super-cavitating-hydrofoils-flows-around-any.jpg)


