Experimental Production, Evaluation and Analysis Technologies for Li-ion Secondary Batteries Takayuki TSUBOTA *1 , Takashi ACHIHA *1 , Yoshiki HAYASHI *1 , Dr. Rinun SYU *1 , Takashi IKEDA *1 , Masato NISHIUCHI *2 *1 Electronics Technology Div., Technology Unit, Kobelco Research Institute, Inc *2 Material Solutions Div., Technology Unit, Kobelco Research Institute, Inc For Li-ion batteries used in vehicles and large- scale load-leveling systems, it is necessary to clarify negative electrode or positive electrode degrades to improve durability and predict battery life. In addition, it is important to clarify the relationship between the configuration factor for internal resistance and the fabrication elements of Li-ion batteries. We therefore investigated the internal resistance determined using electrochemical impedance spectroscopy (EIS), structural changes, chemical bonding states, and the relationship between the deterioration mechanism and the internal resistance in Li-ion batteries. This study demonstrated that a separation analysis of resistance involving the disassembly and re-assembly of a battery is effective for identifying the specific source of degradation. Thus, it is possible to clarify the main factors contributing to the characteristic fading of a battery via internal resistance and degradation analysis. Introduction Compared with conventional secondary batteries, such as Ni-MH batteries, lithium-ion secondary batteries are smaller and lighter, and have higher energy densities thanks to their high cell-voltages. Hence, they have been used for mobile devices such as smartphones and, in recent years, are being applied to hybrid cars, electric vehicles and stationary batteries. There are issues, however; their capacities and output must be increased, life be extended, safety be improved and cost be decreased. Hence development is being conducted on their electrode materials, electrolytes and separators. In particular, lithium-ion batteries for vehicles and stationary applications are expected to be used for a long period of time. When improving durability and/or predicting life, it is important to clarify which electrode, the positive or negative, dominates the deterioration. This clarification is key in developing batteries with longer life and improved input/output characteristics. In response to such needs to clarify deterioration mechanisms, KOBELCO RESEARCH INSTITUTE, Inc. (KRI) has established comprehensive analysis technologies for secondary batteries, including technologies for prototype production, separation analysis of internal-resistance, physical analysis and simulation. As for the deterioration in the charge- discharge cycle in particular, KRI has studied the deterioration mechanism of positive-electrode active materials of batteries used for vehicles and other applications requiring high output. 1)-5) In these studies, a combined analysis was conducted including physical analysis and separation analysis of the resistance of negative-electrode active materials, such as Li(Ni x Mn y Co 1-x-y )O 2 -type active materials having lamellar rock-salt structure, LiMn 2 O 4 having spinel structure, LiFePO 4 having olivine structure, graphite and Si. As a continuation of the previous studies, 6)-8) this paper describes the deterioration of a lithium-ion battery in a cycle test over a long period of time and introduces examples of combined analysis involving the physical analysis and separation analysis of internal resistance. 1. Trial production of batteries for evaluation and evaluation of battery characteristics When analyzing deterioration, it is important to correlate the degradation of battery characteristics with the deterioration of materials (e.g. , crystal structural change in active material , formation of films, and decomposition of electrolyte and generation of gas.) It is also indispensable to develop new evaluation/analysis methods for the purpose. KRI is capable of experimentally producing evaluation batteries, including prototypes, which comprise various positive-electrode active materials, negative-electrode active materials, separators and electrolytes. Fig. 1 shows a cylindrical cell (type 18650), laminate cell and prismatic cell that have been produced by KRI and have been used for Fig. 1 Prototype cells for testing (cylindrical cell, laminate call and prismatic cell from the left) KOBELCO TECHNOLOGY REVIEW NO. 34 MAR. 2016 65
Transcript
Experimental Production, Evaluation and Analysis Technologies for Li-ion Secondary BatteriesTakayuki TSUBOTA*1, Takashi ACHIHA*1, Yoshiki HAYASHI*1, Dr. Rinun SYU*1, Takashi IKEDA*1, Masato NISHIUCHI*2
*1 Electronics Technology Div., Technology Unit, Kobelco Research Institute, Inc*2 Material Solutions Div., Technology Unit, Kobelco Research Institute, Inc
For Li-ion batteries used in vehicles and large-scale load-leveling systems, it is necessary to clarify negative electrode or positive electrode degrades to improve durability and predict battery life. In addition, it is important to clarify the relationship between the configuration factor for internal resistance and the fabrication elements of Li-ion batteries. We therefore investigated the internal resistance determined using electrochemical impedance spectroscopy (EIS), structural changes, chemical bonding states, and the relationship between the deterioration mechanism and the internal resistance in Li-ion batteries. This study demonstrated that a separation analysis of resistance involving the disassembly and re-assembly of a battery is effective for identifying the specific source of degradation. Thus, it is possible to clarify the main factors contributing to the characteristic fading of a battery via internal resistance and degradation analysis.
Introduction
Compared with conventional secondary batteries, such as Ni-MH batteries, lithium-ion secondary batteries are smaller and lighter, and have higher energy densities thanks to their high cell-voltages. Hence, they have been used for mobile devices such as smartphones and, in recent years, are being applied to hybrid cars, electric vehicles and stationary batteries. There are issues, however; their capacities and output must be increased, life be extended, safety be improved and cost be decreased. Hence development is being conducted on their electrode materials, electrolytes and separators. In particular, lithium-ion batteries for vehicles and stationary applications are expected to be used for a long period of time. When improving durability and/or predicting life, it is important to clarify which electrode, the positive or negative, dominates the deterioration. This clarification is key in developing batteries with longer life and improved input/output characteristics. In response to such needs to clarify deterioration mechanisms, KOBELCO RESEARCH INSTITUTE, Inc. (KRI) has established comprehensive analysis technologies for secondary batteries, including technologies for prototype production, separation analysis of internal-resistance, physical analysis and simulation. As for the deterioration in the charge-
discharge cycle in particular, KRI has studied the deterioration mechanism of positive-electrode active materials of batteries used for vehicles and other applications requiring high output.1)-5) In these studies, a combined analysis was conducted including physical analysis and separation analysis of the resistance of negative-electrode active materials, such as Li(NixMnyCo1-x-y)O2-type active materials having lamellar rock-salt structure, LiMn2O4 having spinel structure, LiFePO4 having olivine structure, graphite and Si. As a continuation of the previous studies,6)-8) this paper describes the deterioration of a lithium-ion battery in a cycle test over a long period of time and introduces examples of combined analysis involving the physical analysis and separation analysis of internal resistance.
1. Trial production of batteries for evaluation and evaluation of battery characteristics
When analyzing deterioration, it is important to correlate the degradation of battery characteristics with the deterioration of materials (e.g., crystal structural change in active material, formation of films, and decomposition of electrolyte and generation of gas.) It is also indispensable to develop new evaluation/analysis methods for the purpose. KRI is capable of experimentally producing evaluation batteries, including prototypes, which comprise various positive-electrode active materials, negative-electrode active materials, separators and electrolytes. Fig. 1 shows a cylindrical cell (type 18650), laminate cell and prismatic cell that have been produced by KRI and have been used for
acquiring data on cycle deterioration and high-temperature degradation. The company has also developed new evaluation/analysis techniques.9)-12)
The following describes examples in which charge-discharge cycle deterioration was analyzed on a prototype laminate cell simulating a high input/output battery for hybrid applications.
1.1 Trial production of battery for evaluation
A positive electrode was prepared using an active material of Li (Ni1/3Mn1/3Co1/3)O2 having an average grain size of 10 μm. Also included were a conductive paste of acetylene black, binder of polyvinylidene fluoride (PVDF) and solvent of N-methylpyrrolidone (NMP). The ingredients were put in a high-speed mixer (a thin-film spin system), in which they were mixed and kneaded for viscosity adjustment. The mixture was then applied on both sides of an aluminum foil collector by a continuous coater. The coated collector was dried and roll-pressed for density adjustment, which resulted in a positive electrode with a composite layer with a final thickness of 42 μm and a density of 2.8 g/cm3. A negative electrode was prepared using an active material consisting of graphite, which was slurried in a mixer in the same manner as the positive electrode. The slurry was then applied on both sides of a copper foil collector to form a composite layer with a final thickness of 55 μm and a density of 1.3 g/cm3. The positive and negative electrodes thus prepared were placed in an atmosphere of Ar gas having a dew point of -70℃ or lower, in which the electrodes were disposed face to face with a separator (polyethylene plastic film) sandwiched in between them. This electrode laminate was contained in a cladding and was immersed in an electrolyte (1 mol/L LiPF6/ ethylene carbonate (EC): diethyl carbonate (DEC) = 1 : 1 vol.%) to produce a laminate cell with a designed capacity of 550 mAh. The cell was then subjected to initial charge-discharge at 0.2ItA (0.26mA/cm2) x 3 cycles.
1.2 Evaluation of capacity degradation during charge-discharge cycle test
The laminate battery thus produced was subjected to a charge-discharge cycle test at the ambient temperature under conditions including a voltage of 2.7V to 4.2V, 2ItA (2.6mA/cm2), and 6,100 cycles. The chemical reactions are as follows: Positive-electrode reaction: Li(Ni1/3Co1/3Mn1/3)2⇔Li1-x(Ni1/3Co1/3Mn1/3)O2+Lix
++xe- Negative-electrode reaction: C+Lix
++xe-+⇔ LixC
Total reaction: Li(Ni1/3Co1/3Mn1/3)2+C ⇔Li1-x(Ni1/3Co1/3Mn1/3)O2+LixC.Fig. 2 shows the charge-discharge curves at 2ItA. As the charge-discharge cycle proceeds, the charge curve shifts toward the high voltage side, while the discharge curve shifts toward the low voltage side. The increase in the over-voltage indicates the increased resistance. Also, degradation is observed in the charge-discharge capacity; the discharge capacity (for 2ItA) at 6,100 cycles decreases to 46% of the initial value. To study the charge-discharge capacity, constant-current/constant-voltage charging (1 hour holding time for constant voltage) was conducted at 0.2ItA from 2.7V to 4.2V; while constant-current discharging was conducted at 0.2ItA. The resulting charge-discharge curves are shown in Fig. 3. The charge-discharge at a low rate is less affected by the over-voltage, enabling the evaluation of chargeable/dischargeable battery capacity. As the charge-discharge cycle proceeds, charge-discharge capacity is degraded; the discharge capacity at 6,100 cycles is decreased to 74% of the initial value. Thus, the charge-discharge cycle increases the internal resistance and degrades the capacity.
Specifying the factors increasing internal resistance provides important R&D knowledge for improving charge-discharge cycle durability and input/output characteristics. The factors constituting internal resistance, however, are complex and include reactions involving lithium ions and electrons; namely, for example, charge-transfer resistance at the active-material/electrolyte interface: diffusion resistance acting on lithium ions in active material; electron resistance at, e.g., the active material/active material interface, active material/conductive-paste interface and active material/collector interface; and ion-transfer resistance in the electrolyte. For the analysis of internal resistance, an alternating current impedance method, which can separate reactions with different time constants, is useful.13) However, time constants that are close to each other allow only the analysis of the alternating-current impedance waveform measured on a battery (full cell) as-is, disabling the separation of the resistance factors. KRI has developed a separation analysis technology for resistance that separates the contributions of the positive electrode, negative electrode, separator and electrolyte to the internal resistance.14) Fig. 4 schematically illustrates the separation analysis of resistance for positive and negative electrodes. For each electrode, the positive and negative, a half cell including a counter electrode of lithium was prepared. Measuring the internal resistance of each half cell enables the separation of the contributions of the positive electrode and negative electrode to the increase in resistance. A battery for analysis (full cell) was prepared using the positive electrode and negative electrode of a degraded battery and the analysis battery was fully charged before its internal resistance was measured. The results are shown in Figs. 5 and 6.
The internal resistance was measured by the AC impedance method. This method involves applying a frequency-modulated weak voltage (or, current) to the battery, and measuring the amplitude and phase difference of the response current (or, voltage), thereby separating elementary reaction processes with different time constants. An AC voltage of 1 MHz to 1 mHz with a superposed amplitude of 10mV was applied to the open circuit voltage (OCV), and the response current was measured to determine the internal resistance. The results show an arc corresponding to the reaction responding in the high-frequency region around 10 kHz, an arc associated with the reaction responding in the low-frequency region from 10 Hz to 0.1 Hz, and a linear portion rising diagonally up and to the right, the linear portion indicating the diffusion resistance (Warburg impedance) of lithium ion. The results show that the arc in the low frequency region increases significantly as the cycle proceeds. Fig. 7 shows the internal resistance in a fully-charged state of the degraded positive-electrode half cell, and Fig. 8 shows that of the degraded negative-electrode half cell. The positive electrode has been confirmed to have charge-transfer resistance in the
low-frequency region and to show an increase in resistance similar to that of the full cell. Meanwhile, the negative electrode has been confirmed to exhibit an increase in charge-transfer resistance mainly in the high-frequency region. In the charge-discharge cycle test conducted this time, the full cell exhibited a significant increase of reaction in the low-frequency region. The separation analysis of resistance has revealed that this reaction in the low-frequency region is attributable to the charge-transfer resistance of the positive electrode and the major factor increasing the internal resistance exists in the positive electrode.
2.2 Evaluation of single-electrode capacity
The prepared cells were used for the measurement of single-electrode capacity. The results are shown in Fig. 9. The full cell, prepared for the analysis, showed capacity degradation during the charge-discharge cycle test. The positive-electrode half cell and negative-electrode half cell, on the other hand, exhibited no significant capacity degradation like that seen in the full cell. Having a counter electrode of metallic lithium, each half
cell contains a sufficient amount of the lithium ion necessary for charge and discharge. It is thus considered that, during the above charge-discharge cycle test, the active materials of the positive and negative electrodes retained the capability of inserting and removing lithium ion; however, the amount of lithium ion to be charged and discharged decreased, causing the capacity degradation. It should be noted that the capacity increase of the negative electrode implies a side reaction in which the electrolyte is decomposed to activate a film-forming reaction.
2.3 Evaluation of diffusion resistance against lithium ion in positive-electrode active material
The above positive-electrode half cell was used to evaluate the diffusion resistance against lithium ion by a galvanostatic intermittent titration technique, (GITT).15), 16) Fig.10 shows an example of the GITT pulse waveform. The IR region in the figure includes the ion conduction resistance in the electrolyte, electron resistance, and charge-transfer resistance at the electrolyte/active-material interface. Meanwhile, the ΔEτ region includes the diffusion of lithium ion. However, a combined analysis involving alternating-
Fig.10 Scheme for single stepofGITTprofileofNMCcathodematerial
KOBELCO TECHNOLOGY REVIEW NO. 34 MAR. 2016 68
current impedance, capable of evaluating reaction time constants, is required to correctly separate the diffusion resistance of lithium ion from the charge-transfer resistance at the electrolyte/active material interface, which has a slow reaction time constant. The GITT waveform for a 50% charged state was analyzed, and the diffusion coefficient of lithium ion was calculated from Equation (1). Here, L is the thickness of the electrode composite layer, and ΔEs is the potential difference before and after the GITT measurement.
……………… (1)
The diffusion coefficient of lithium ion in the positive-electrode active material in a discharged state is shown in Fig.11. It has been revealed that, as the charge-discharge cycle proceeds, the diffusion coefficient degrades.
2.4 Deterioration analysis of positive electrode
During charging, lithium ions are removed from the positive-electrode active material and are inserted into the negative-electrode active material. A reverse reaction occurs during discharging. Thus, during the charge-discharge cycle test, structural changes are repeated due to the insertion and removal of lithium ions to and from the active materials of positive and negative electrodes. In an attempt to elucidate the degradation mechanism of the positive electrode, the change in the crystal structure of the positive electrode was studied using a Cs-STEM. Lithium easily reacts with moisture and changes its state. Hence, the degraded trial batteries were disassembled in the atmosphere of Ar having a dew point of -70℃ or lower to dismount the positive electrode, which was then mounted in a focused ion-beam (FIB) apparatus while maintaining the inert-gas atmosphere. Subsequently, using cross-sectional micro-sampling, samples for transmission electron microscopy (TEM)
were extracted and thinned by the FIB. Fig.12 is a cross-sectional TEM micrograph of a positive-electrode active material after 660 cycles. Li (Ni1/3Mn1/3Co1/3) O2 (NMC) has a lamellar rock-salt structure in a hexagonal crystal system. The nano beam electron diffraction, with a simulation pattern for reference, identified a structural change in the surface layer, to a cubic rock-salt structure with lithium removed. Fig.13 includes a cross-sectional Cs-STEM-HADDF image of the surface layer of the positive-electrode active material observed at an atomic resolution. Lithium ions are generally inserted into, or removed from, the space between layers having arrays of transition metal elements. The observation
confirmed a cation mixing, in which transition metals, Ni, Co and Mn, have moved to the sites where lithium ions should exist. An STEM-EDX line analysis has confirmed oxygen defects in the cubic rock-salt structure and the Ni, Co concentrated region caused by Mn elution on the top surface layer. As described, the surface layer of the positive-electrode active material after 6,100 cycles has undergone a structural change, becoming a cubic rock-salt structure. The thickness of the layer with the changed structure was 30 nm, showing no significant increase; however, the STEMEELS mapping of the chemical binding state, shown in Fig.14, has confirmed oxides of Mn/Co and a fluoride-based inorganic interface layer newly formed on the layer having a cubic rock-salt structure, which was created on the active material surface.
2.5 Deterioration analysis of negative electrode
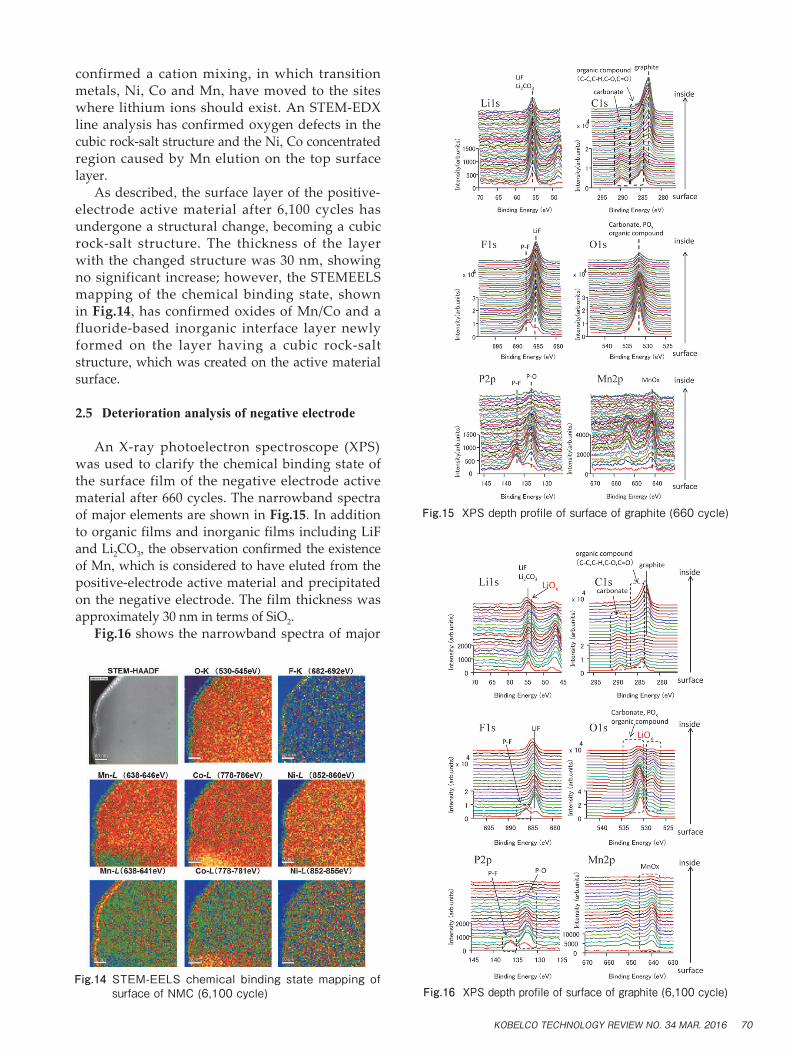
An X-ray photoelectron spectroscope (XPS) was used to clarify the chemical binding state of the surface film of the negative electrode active material after 660 cycles. The narrowband spectra of major elements are shown in Fig.15. In addition to organic films and inorganic films including LiF and Li2CO3, the observation confirmed the existence of Mn, which is considered to have eluted from the positive-electrode active material and precipitated on the negative electrode. The film thickness was approximately 30 nm in terms of SiO2. Fig.16 shows the narrowband spectra of major
elements in the negative electrode active material after 6,100 cycles. In addition to the organic films and inorganic films including LiF and Li2CO3, as observed after 660 cycles, lithium oxides were newly observed. The film thickness was approximately 140 nm in terms of SiO2, a four-fold or greater increase from the 660 cycles. In addition to LiF and Li2CO3, the formation of LiOx during extended cycles is considered to deactivate lithium ions, which otherwise are chargable-dischargable, causing the degradation of charge-discharge capacity.
3. Deterioration mechanism clarified by combined analysis of separation analysis on internal-resistance and physical analysis
The positive-electrode active material with increased internal resistance was found to have a surface layer whose structure had been changed to a cubic rock-salt structure due to the charge-discharge cycles. This change of crystal structure is considered to decrease the number of reaction sites and to increase the charge-transfer resistance at the electrolyte/active material interface. Further, the Mn/Co oxide layer and fluoride layer formed during extended cycles is also considered to decrease the number of reaction sites and to increase the charge-transfer resistance at the electrolyte/active material interface. Moreover, the cation mix, in which transition metals move to lithium-ion sites, is considered to inhibit the diffusion of lithium ion in the solid phase and increase the diffusion resistance. It has also been found from the charge-discharge cycle test that both the positive and negative electrodes retain the capability of inserting and removing lithium ions; however, the number of lithium ions that can be inserted and removed has decreased. A Li containing film is formed on the graphite surface, which turns into thick LiOx films during extended cycles, which is considered to capture otherwise chargable-dischargable lithium ions and, as a result, degrade the charge-discharge capacity.
Conclusions
Lithium-ion batteries are being increasingly used for vehicles and stationary applications. Various measures will be taken to increase their capacities
and output, extend their lifespan, and improve safety. Hence the combined analysis technology, applicable to real batteries, of separation analysis on internal-resistance and physical analysis will become increasingly important in elucidating the deterioration mechanism. There are research and development projects actively pursuing next-generation batteries, including lithium-ion batteries based on a positive electrode with high potential and high capacity,17) all solid-state batteries employing solid electrolyte,18), 19) sodium-ion batteries and fuel cells. KRI is making progress in trial battery production, physical analysis, chemical analysis, safety testing and CAE combined analysis. KRI will strive to integrate these evaluation and analysis technologies and thus contribute to the development of next-generation secondary batteries and fuel cells.
References
1) T. Tsubota et al. Proceedings of The 52th Battery Symposium (4H13). 2011, Tokyo.
2) T. Achiha et al. 51th Electronic Materials Conference, Fall Meeting (A4). 2011, Tokyo.
3) T. Tsubota et al. Proceedings of The 53th Battery Symposium (1A20). 2012, Fukuoka.
4 ) T. Tsubota et al. Proceedings of The 54th Battery Symposium (2B17). 2013, Osaka.
5 ) T. Tsubota et al. Proceedings of The 55th Battery Symposium (3F15). 2014, Kyoto.
6 ) T. Tsubota. KOBERUNIKUSU. 2010, Vol.19, No.37, pp.4-6.7 ) T. Tsubota et al. 47th Electronic Materials Conference, Fall
Meeting (A9). 2010, Tokyo.8 ) T. Tsubota et al. KOBERUNIKUSU. 2014, Vol.23, No.41,
pp.1-3.9 ) Y. Hayashi et al. Proceedings of The 55th Battery Symposium
(3F19). 2014, Kyoto.10) T. Segi et al. Proceedings of The 55th Battery Symposium
(3F16). 2014, Kyoto.11) T. Yamagami et al. KOBERUNIKUSU. 2014, Vol.23, No.41,
pp.4-6.12) Y. Takagishi et al. Proceedings of The 55th Battery Symposium
(3F18). 2014, Kyoto.13) D. P. Abraham et al. J. Electrochem. Soc. 2006, 153 (8) A1610.14) M. Nishiuchi et al. Proceedings of The 53th Battery Symposium
(1A19). 2012, Fukuoka.15) Weidong Zheng et al. Bull. Mater. Sci. 2013, 36 (3).16) M. Nishiuchi et al. Proceedings of The 55th Battery Symposium
(3F14). 2014, Kyoto.17) T. Achiha. Proceedings of The 55th Battery Symposium (3F17).
2014, Kyoto.18) S. Okada et al. J. Power Sources. 2005, 146 (1-2) 565.19) T. Achiha et al. 51th Electronic Materials Conference, Fall