Pergamon Chemical Eogineming Science, Vol. 49, No. 20, pp. 3421-3438, 1994 Copyri.&t 8 1994 ELscvicr S&aa Ltd Printed inGreat Britain. AUrights,emwcd aoE-2509p4 s7.cKJ+Mlo ooo9-2509(94)00146-4 EXPERIMENTAL STUDY OF THE ABSORPTION OF ACID GASES IN POROUS PARTICLES IMPREGNATED WITH AQUEOUS ALKANOLAMINE SOLUTIONS J. A. HOGENDOORN, W. P. M. VAN SWAAIJ and G. F. VERSTEEG Department of Chemical Engineering, Twente University of Technology, P.O. Box 217,7.500 AE Enschede, Netherlands (Received 16 January 1994; accepted for publication 19 April 1994) Abstract-In the present study the absorption behaviour and the equilibria of CO2 and HaS in porous a- and y-alumina particles impregnated with inert solutions and alkanolamine solutions were investigated. From the equilibrium data it could be concluded that for CO, and H2S also adsorption on the internal surface of liquid filled ~-alumina particles occurs. The experimental absorption rate data were compared with theoretical data obtained with an absorption model, which describes the mass transport accompanied by chemical reaction in porous particles impregnated with reactive solutions. The COP and HrS al- kanolamine data necessary for this model were taken from literature, while the tortuosity and porosity were experimentally determined. The model could describe the experimentally observed absorption rates satisfactorily. Discrepancies mainly occurred for the process conditions where equilibrium was approached. These deviations probably must be attributed to the calculation of the equilibrium compositions (no correction for non-idealities) and the accuracy of the available thermodynamic data. 1. INTRODUCTION Various gas-liquid processes are successfully applied in industry to separate components from gas mix- tures. The absorption of the gaseous compounds in the liquid can be purely physical, but often chemically reactive species are added to the liquid. Chemically reactive components in the liquid increase the gas absorption capacity while simultaneously an en- hancement of the gas absorption rate may occur. Both phenomena contribute to a better performance of the separation process. A well-known class of chemically reactive liquids applied in these processes are aqueous alkanolamine solutions which are used for the re- moval of CO2 and/or HIS from industrial gases. Besides the solvent, the gas-liquid contactor also influences the efficiency of a separation process. Usu- ally, a tray column or a packed column is used to realize the gas-liquid contact, however, on laboratory scale special reactors were developed to optimize spe- cific absorption processes. Examples of such reactors are the cyclone spray scrubber and the centrifugal reactor (Versteeg and van Swaaij, 1987); Schrauwen and Thoenes, 1988; Bosch et al., 1989b). These special reactors often have specific drawbacks in comparison to traditional absorbers (Bosch et al., 1989b), but in some situations they might be advantageous. Espe- cially, for the selective removal of H,S from natural gas which also contains COZ, the aforementioned reactors offer promising possibilities. A new method for the continuous separation of gases with reactive liquids was proposed by Hogendoom et al. (1993). Their idea was to impreg- nate the reactive absorption liquid in small porous particles which can be fluidized. The porous particles are used as liquid carriers, in which diffusion and simultaneous reaction of the gaseous components take place. Hogendoorn et al. (1993) showed that, from a theoretical point of view, impregnated small particles can effectively be used to remove gases selectively. By circulating the impregnated particles from an absorber to a desorber unit a new type of continuous separation process can be obtained. The particles can be kept in motion by various kinds of gas-solid contactors, like e.g. a bubbling fluidized bed, a riser or a trickle flow reactor. Before studying the absorption behaviour in these types of reactors experiments in a model reactor where the particles are fixed are preferred. The prob- lems involved with the handling of the flowing solid phase can be avoided and the absorption character- istics in the particles can be studied in more detail. Physical absorption in liquid impregnated particles accompanied by adsorption on the internal surface of the particles has both theoretically and experi- mentally been studied by several authors (Edeskuty and Amundson, 1952; Ma and Evans, 1968; Komiyama and Smith, 1974a,b, Leyva-Ramos and Geankoplis, 1985; Lee et al., 1993). In the experi- mental studies the particles were suspended in a liquid which was stirred to reduce possible external mass transfer resistances. A pulse of a fluid tracer was added to the suspension and the tracer concentration was continuously monitored. For systems with linear adsorption isotherms effective diffusion coefficients could be derived by fitting the experimental results to analytical solutions (Crank, 1976; Komiyama and Smith, 1974a,b; Prasher and Ma, 1977). Komiyama 342 1
Transcript
Pergamon Chemical Eogineming Science, Vol. 49, No. 20, pp. 3421-3438, 1994 Copyri.&t 8 1994 ELscvicr S&aa Ltd
EXPERIMENTAL STUDY OF THE ABSORPTION OF ACID GASES IN POROUS PARTICLES IMPREGNATED WITH
AQUEOUS ALKANOLAMINE SOLUTIONS
J. A. HOGENDOORN, W. P. M. VAN SWAAIJ and G. F. VERSTEEG Department of Chemical Engineering, Twente University of Technology, P.O. Box 217,7.500 AE Enschede,
Netherlands
(Received 16 January 1994; accepted for publication 19 April 1994)
Abstract-In the present study the absorption behaviour and the equilibria of CO2 and HaS in porous a- and y-alumina particles impregnated with inert solutions and alkanolamine solutions were investigated. From the equilibrium data it could be concluded that for CO, and H2S also adsorption on the internal surface of liquid filled ~-alumina particles occurs. The experimental absorption rate data were compared with theoretical data obtained with an absorption model, which describes the mass transport accompanied by chemical reaction in porous particles impregnated with reactive solutions. The COP and HrS al- kanolamine data necessary for this model were taken from literature, while the tortuosity and porosity were experimentally determined. The model could describe the experimentally observed absorption rates satisfactorily. Discrepancies mainly occurred for the process conditions where equilibrium was approached. These deviations probably must be attributed to the calculation of the equilibrium compositions (no correction for non-idealities) and the accuracy of the available thermodynamic data.
1. INTRODUCTION
Various gas-liquid processes are successfully applied in industry to separate components from gas mix-
tures. The absorption of the gaseous compounds in the liquid can be purely physical, but often chemically
reactive species are added to the liquid. Chemically reactive components in the liquid increase the gas absorption capacity while simultaneously an en-
hancement of the gas absorption rate may occur. Both phenomena contribute to a better performance of the separation process. A well-known class of chemically
reactive liquids applied in these processes are aqueous
alkanolamine solutions which are used for the re- moval of CO2 and/or HIS from industrial gases.
Besides the solvent, the gas-liquid contactor also
influences the efficiency of a separation process. Usu- ally, a tray column or a packed column is used to realize the gas-liquid contact, however, on laboratory
scale special reactors were developed to optimize spe- cific absorption processes. Examples of such reactors are the cyclone spray scrubber and the centrifugal
reactor (Versteeg and van Swaaij, 1987); Schrauwen and Thoenes, 1988; Bosch et al., 1989b). These special
reactors often have specific drawbacks in comparison
to traditional absorbers (Bosch et al., 1989b), but in some situations they might be advantageous. Espe- cially, for the selective removal of H,S from natural gas which also contains COZ, the aforementioned reactors offer promising possibilities.
A new method for the continuous separation of gases with reactive liquids was proposed by Hogendoom et al. (1993). Their idea was to impreg- nate the reactive absorption liquid in small porous
particles which can be fluidized. The porous particles are used as liquid carriers, in which diffusion and
simultaneous reaction of the gaseous components take place. Hogendoorn et al. (1993) showed that,
from a theoretical point of view, impregnated small particles can effectively be used to remove gases
selectively. By circulating the impregnated particles from an absorber to a desorber unit a new type of
continuous separation process can be obtained. The particles can be kept in motion by various kinds of gas-solid contactors, like e.g. a bubbling fluidized bed, a riser or a trickle flow reactor.
Before studying the absorption behaviour in these
types of reactors experiments in a model reactor
where the particles are fixed are preferred. The prob- lems involved with the handling of the flowing solid phase can be avoided and the absorption character-
istics in the particles can be studied in more detail. Physical absorption in liquid impregnated particles
accompanied by adsorption on the internal surface of the particles has both theoretically and experi- mentally been studied by several authors (Edeskuty and Amundson, 1952; Ma and Evans, 1968; Komiyama and Smith, 1974a,b, Leyva-Ramos and
Geankoplis, 1985; Lee et al., 1993). In the experi- mental studies the particles were suspended in a liquid
which was stirred to reduce possible external mass transfer resistances. A pulse of a fluid tracer was added to the suspension and the tracer concentration was continuously monitored. For systems with linear adsorption isotherms effective diffusion coefficients could be derived by fitting the experimental results to analytical solutions (Crank, 1976; Komiyama and Smith, 1974a,b; Prasher and Ma, 1977). Komiyama
342 1
3422 J. A. HOGENDOORN et al.
and Smith (1974a, b) concluded that surface adsorp- tion and diffusion significantly increased the absorp- tion rate if the tracer in the liquid adsorbs on the internal surface of the particles. Prasher and Ma (1977) supposed that a dynamic equilibrium existed between the adsorbed molecules and the liquid in the pore. However, according to Prasher and Ma (1977), surface diffusion was not likely to occur in liquid filled porous particles because the adsorbed molecule usu- ally is surrounded by a large number of solvent mo- lecules. Therefore, the so-called “hopping mechanism” necessary for the surface transport cannot occur. By assuming immobilized adsorbed molecules, a dy- namic equilibrium and a linear adsorption isotherm, they found that the diffusivity of (relatively large) tracer molecules in the liquid in the pores was steri- tally hindered and decreased with the ratio of the average pore radius to the solute molecular radius. Unfortunately, theoretical approximations were used to estimate important parameters like the molecular diffusivity of the tracer in the liquid and the tortuosity of the porous material.
The present contribution verifies whether the model proposed by Hogendoorn et al. (1993) can be used to describe the experimentally observed absorp- tion rates of CO* and H2S in porous particles impreg- nated with reactive alkanolamine solutions. Contrary to the absorption rate experiments presented in litera- ture the absorbed component in the present study was not a liquid but a gas. Absorption rate experiments were carried out with large (Y- and y-alumina particles. The a-alumina material was chosen because in many situations it can be considered as chemically inert, while y-alumina was chosen because of the frequent application in fluidization processes. The al- kanolamines used were, with increasing reaction rate towards C02, respectively, MethylDiEthanolAmine (MDEA), DiEthylMonoEthanolAmine (DEMEA) and MonoEthanolAmine (MEA). The reaction rate of H2S with all three alkanolamines can be considered instantaneous with respect to mass transport.
Physical absorption experiments of CO* and N,O in particles impregnated with non-reactive liquids were carried out to obtain the tortuosity of the porous particles. N20 is often used to estimate the diffusivity and solubility of CO2 in reactive liquids by means of the well accepted “N&J-CO,” analogy (Laddha et al., 1981).
Also equilibrium experiments were carried out and compared with the data from literature for the homo- geneous liquid system. In this way the interaction of the gases with the liquid support could bc investig- ated.
2. THEORY
2.1. Model description _ If a gaseous reactant A absorbs in a liquid filled
porous sphere, where it reacts with component B ac- cording to the reaction
with the kinetics
R, = knCA1”CW” - ~p,qC’T’CW (2) the mass balance for each component can be de- scribed by (Hogendoorn et al., 1993):
Xi1 EPDi 8 E,-- = -T-
at q r ar
i = A, B, C or D. (3)
If the gas A adsorbs on the internal surface of the particle and forms APds, this component must be in- corporated in the model. If it is assumed that the adsorption rate is instantaneously fast and that A is reversibly adsorbed, the adsorption isotherm de- scribes the relation between A and Asds at any point and time inside the particle. Usually, the adsorption isotherm can be represented by a Langmuir adsorp- tion isotherm, which is given by
The dimension of [Alad, is generally mol ma;&_, but in the present mode1 it seemed more convenient to
define CAlad. as the number of moles adsorbed per unit pore volume. Herewith the dimensions of all components are identical which results in a straight- forward interpretation of the equilibrium experi- ments. Component Aads is incorporated in the mass balance for A which is now described by eq. (5):
+!$+2!!&$!+& (5)
The boundary and initial conditions for the liquid filled particle are given by relations (4) and (6)-(9).
[i]rZO = constant, 0 < r < rl,
i = A, B, C or D (6)
CAL, = MAIs (7)
WI - ar ,,
= 0, non-volatile components B, C and D
(8)
aCi3 dr
= 0, i = A, B, C or D. (9) r=O
If the reaction rate is infinitely fast in comparison with the diffusion in the particle, the balance for compon- ent A is, for all stoichiometric coefficients equal to 1, given by
Absorption of acid gases in porous particles 3423
and for component D and B by
__ __ =z5&2~)+$!L(rl~). arB] + acC] at at
02)
Because equilibrium is established at any time and place within the liquid in the particle the concentra- tion of component C is calculated according to rela- tion (13):
K = Ccl PI mEi* (13)
The boundary conditions for components B and D become
D am + D xc1 b- ar rl
c- =o ar rl
(14)
and
D am d- ar ,,
_ D xc1 -I c at- rl = O. (15)
During the experiments the particles are present in a closed reactor which is initially evacuated. Next the vapour pressure of the liquid in the particles is al- lowed to establish. At t = 0 s pure gas is added instan- taneously to a partial pressure PO. If it is assumed that the ideal gas law is applicable, the pressure decrease is calculated with the following mass balance:
v, aP RT dt
J.a, V,,,
in which the specific contact area for spheres is ex- pressed by
(17)
and the flux .I,, is for a finite rate reaction given by
J = D &pa[*l aCAl.** 0 a 4 ar ,, + .@%.ads - I ar r1
(181
while for an infinitely fast reaction the flux J, is given by relation (19):
(191
The initial condition of eq. (16) is given by
P,,o = PO. Wa)
Equation (16) can be solved simultaneously with the micro balances for the components in the particle to obtain the theoretical time-pressure curve (see Hogendoorn et al., 1993).
2.2. Partide geometry In the model description of Section 2.1 it is assumed
that the particles are spherical. However, the particles used in the experimental study of the gas absorption rate were cylindrical with a length to diameter ratio of about 1.
Ma and Evans (1968) presented theoretically cal- culated dimensionless time-accumulation curves for physical absorption in particles of various shapes. From their work it can be concluded that particles with the same volume to surface ratio show, especially at low dimensionless accumulations, practically the same absorption rate. The curves for cylinders, with a length to diameter ratio of 1, and spheres nearly coincide over the entire absorption Period. The same phenomenon is known for catalytic first-order irre- versible reactions. The analytical degree of utilization for particles with the same volume to surface ratio is, especially at high Thiele moduli, nearly identical (Aris, 1957).
Therefore, in the present study the cylindrical par- ticles were approximated by a sphere ‘&ith the same volume to surface ratio. For cylinders with a length to diameter ratio of 1 this means that the cylinder can be approximated by a sphere with an identical radius. Possible discrepancies between the theoretical time- pressure curves for the cylindrical and spherical geometry are expected to be small and will probably occur only at intermediate to high dimensionless ac- cumulations.
2.3. Reaction scheme If CO2 absorbs in an aqueous tertiary al-
kanolamine solution multiple reactions occur. The reactions of importance for CO, with aqueous MDEA are:
CO2 + Hz0 + MDEA .=. MDEAH+ + HCO;,
(20)
K [MDEAH+] [HCO;]
co2 = CMDE.41 KOzl
CO, + OH- - HCO;, Ki = CHCO;l [OH-I Wbl
(21) HCO; + OH- 9 CO;- + HzO,
K, = [CO:-1 CH@l (22)
[HCO;] [OH -1
MDEAH+ + Hz0 - MDEA + H30+,
[MDEA] [H,O+] (23)
Ka = [MDEAH+] [Hz01
2Hz0 9 HsO+ + OH-,
K w
= W&+1 [OH-I CHzO12.
The reactions of CO2 occurring in an aqueous tertiary alkanolamine DEMEA solution are similar to that of MDEA. The first two reactions are reactions of
3424 .I. A. HOGENDOORN et al.
finite rate, while the following three only involve a proton transfer and are considered instantaneous with respect to mass transfer. In a model based on the Higbie penetration theory, Glasscock and Rochelle (1989) and Littel et al. (1991a) showed that the influ- ence of reactions (21H24) was for tertiary amines negligible for the conditions the authors applied.
Primary or secondary amines react directly with CO, and for e.g. an aqueous MEA solution the main reaction is now given by
CO2 + 2MEA o MEACOO- + MEAH+, (25)
K [MEACOO-] [MEAH+]
co2 = [MEAl [CO,] .
The contribution of reaction (21) to the reaction rate can be neglected for primary and secondary amines compared to reaction (25). The overall equilibrium value Kco2 is calculated according to
K KlfL’ --
‘O= - K,K,
in which K,, K, and K, are defined in accordance with the equations given in the reaction scheme for the tertiary amines, and K, is the equilibrium constant for the reaction
MEACOO- + H,O 9 MEA + HCO;, (21) \--I
[MEA] [HCO,]
Kc = [MEACOO-] [H,O] .
The values for the equilibrium constants were ob- tained from literature and are summarized in Table 1. For all three alkanolamines the forward reaction is first order with respect to both CO2 and the al- kanolamines. The rate expression for the reverse reac- tion and the corresponding reaction rate constant were derived from the equilibrium expression and the assumption that at equilibrium RA = 0 (Bosch, 1989a).
If HIS absorbs in an aqueous alkanolamine solu- tion (primary, secondary or tertiary) the most im- portant reaction is
H,S f Amine o HS- + AmineH+, (28)
K [AmineH+] [HS-]
“$5 = [Amine] [H+] .
For all alkanolamines this reaction can be considered
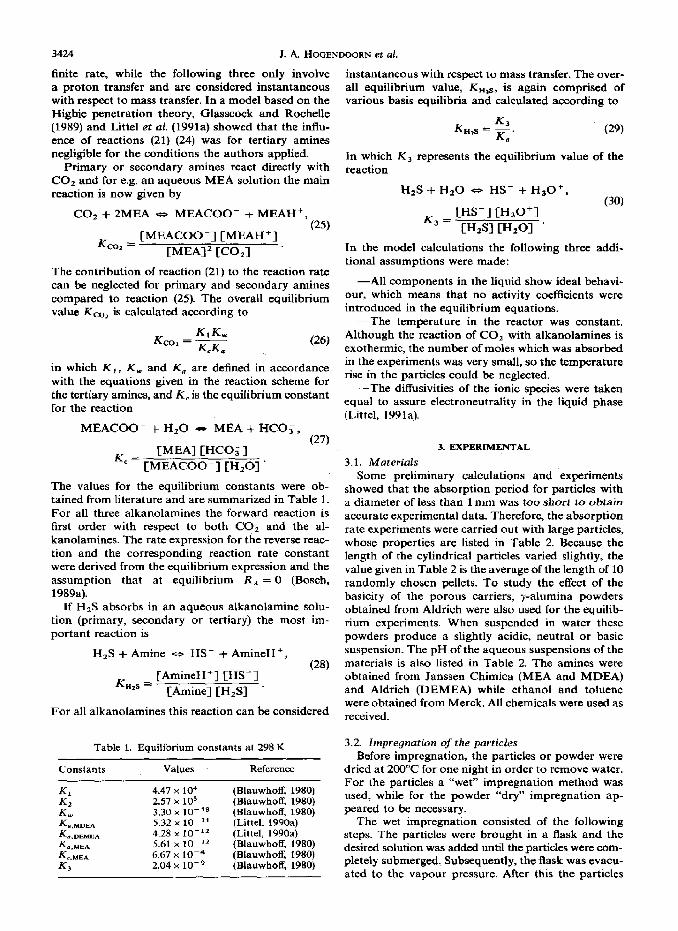
Table 1. Equilibrium constants at 298 K
Constants Values Reference
4.47 x 10⁴ 2.57 x lo5 3.30 x lo- a* 5.32 x 10-l 4.28 x lo-‘2 5.61 x IO- I2 6.67 x IO--’ 2.04 x 1O-Q
instantaneous with respect to mass transfer. The over- all equilibrium value, Knas, is again comprised of various basis equilibria and calculated according to
K K3
H,S = -* KO
(2%
In which K, represents the equilibrium value of the reaction
H2S + HZ0 - HS- + HsO+, (301
K3 = W-1 cH,O+I . ,
D-MI D-WI .
In the model calculations the following three addi- tional assumptions were made:
-All components in the liquid show ideal behavi- our, which means that no activity coefficients were introduced in the equilibrium equations.
-The temperature in the reactor was constant. Although the reaction of CO2 with alkanolamines is exothermic, the number of moles which was absorbed in the experiments was very small, so the temperature rise in the particles could be neglected.
-The diffusivities of the ionic species were taken equal to assure electroneutrality in the liquid phase (Littel, 1991a).
3. EXPERIMENTAL
3.1. Materials Some preliminary calculations and experiments
showed that the absorption period for particles with a diameter of less than 1 mm was too short to obtain accurate experimental data. Therefore, the absorption rate experiments were carried out with large particles, whose properties are listed in Table 2. Because the length of the cylindrical particles varied slightly, the value given in Table 2 is the average of the length of 10 randomly chosen pellets. To study the effect of the basicity of the porous carriers, y-alumina powders obtained from Aldrich were also used for the equilib- rium experiments. When suspended in water these powders produce a slightly acidic, neutral or basic suspension. The pH of the aqueous suspensions of the materials is also listed in Table 2. The amines were obtained from Janssen Chimica (MEA and MDEA) and Aldrich (DEMEA) while ethanol and toluene were obtained from Merck. All chemicals were used as received.
3.2. Impregnation of the particles Before impregnation, the particles or powder were
dried at 200°C for one night in order to remove water. For the particles a “wet” impregnation method was used, while for the powder “dry” impregnation ap- peared to be necessary.
The wet impregnation consisted of the following steps. The particles were brought in a flask and the desired solution was added until the particles were com- pletely submerged. Subsequently, the flask was evacu- ated to the vapour pressure. After this the particles
Absorption of acid gases in porous particles
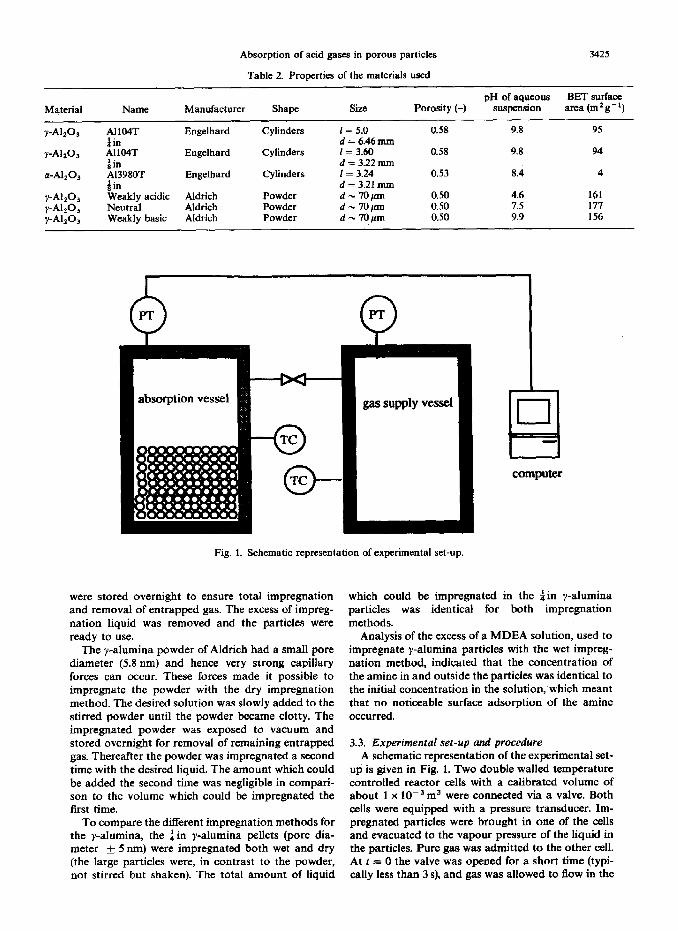
Table 2. Properties of the materials used
3425
Material
y-A12o3
y-41203
cr-A120,
y-Al&s y-AU% y-Al203
pH of aqueous BET surface Name Manufacturer Shape Size Porosity (-) suspension area (m2g-r)
Al104T Engelhard Cylinders I = 5.0 0.58 9.8 95 $in d = 6.46 mm A1104T Engelhard Cylinders I=360 0.58 9.8 94 tin d = 3.22 mm A13980T Engelhard Cylinders I= 3.24 0.53 8.4 4 iin d = 3.21 mm Weakly acidic Aldrich Powder d-70pm 0.50 4.6 161 Neutral Aldrich Powder d-70pm 0.50 7.5 177 Weakly basic Aldrich Powder d-70pm 0.50 9.9 156
Fig. 1. Schematic representation of experimental set-up.
were stored overnight to ensure total impregnation and removal of entrapped gas. The excess of impreg- nation liquid was removed and the particles were ready to use.
The y-alumina powder of Aldrich had a small pore diameter (5.8 nm) and hence very strong capillary forces can occur. These forces made it possible to impregnate the powder with the dry impregnation method. The desired solution was slowly added to the stirred powder until the powder became clotty. The impregnated powder was exposed to vacuum and stored overnight for removal of remaining entrapped gas. Thereafter the powder was impregnated a second time with the desired liquid. The amount which could be added the second time was negligible in compari- son to the volume which could be impregnated the first time.
To compare the different impregnation methods for the y-alumina, the ain y-alumina pellets (pore dia- meter + 5 nm) were impregnated both wet and dry (the large particles were, in contrast to the powder, not stirred but shaken). The total amount of liquid
which could be impregnated in the iin y-alumina particles was identical for both impregnation methods.
Analysis of the excess of a MDEA solution, used to impregnate y-alumina particles with the wet impreg- nation method, indicated that the concentration of the amine in and outside the particles was identical to the initial concentration in the solution, which meant that no noticeable surface adsorption of the amine occurred.
3.3. Experimental set-up and procedure A schematic representation of the experimental set-
up is given in Fig. 1. Two double walled temperature controlled reactor cells with a calibrated volume of about 1 x 10-j m3 were connected via a valve. Both cells were equipped with a pressure transducer. Im- pregnated particles were brought in one of the cells and evacuated to the vapour pressure of the liquid in the particles. Pure gas was admitted to the other cell. At l= 0 the valve was opened for a short time (typi- cally less than 3 s), and gas was allowed to flow in the
3426 J. A. HOGENDOORN et al.
absorption vessel. The theoretical initial pressure in the absorption vessel could be calculated with the pressure drop in the gas supply vessel. In all the experiments with HIS and also with the fast reacting CO,-MEA system a slightly different procedure was followed. At t = 0 the valve was opened and kept open during the entire absorption period. To avoid a vapour stream from the absorption vessel to the gas supply vessel, a small amount of water ( * 2ml) was added to the gas supply vessel in order to saturate the gas.
The pressure decrease in the absorption vessel was recorded with a pressure transducer, which had been connected to a computer. This method made it pos- sible to measure the pressure with very short time intervals. To determine the equilibrium compositions, gas was, after reaching equilibrium in the absorption vessel, fed to the reactor several times up to a partial pressure of about 1 bar. All experiments were carried out with fresh unloaded porous materials at a temper- ature of 298 +_ 1 K.
4. RESULTS AND DISCUSSION: EQUILIBRIUM
EXPERIMENTS
4.1. Particles impregnated with non-reacting liquids 4.1.1. Physical solubilities of CO2 and N,O in a-
alumina pellets. In the experiments with cc-alumina the solubilities found for N20 in the non-reacting solvents water, ethanol and toluene were within + 10% equal to the dimensionless solubilities given
in literature for the homogeneous liquid systems. The dimensionless solubility of CO* in with ethanol and toluene impregnated a-alumina particles agreed also satisfactorily with the literature data (see Table 3). However, the solubility of CO2 in a-alumina impreg- nated with water, turned out to be substantially higher than expected. This contribution could be due to the slightly basic properties of the cc-alumina. Therefore, the a-alumina was impregnated with a 0.01 M HCl solution and the measured solubility of CO1 was nearly identical to the one found for homo- geneous liquid systems.
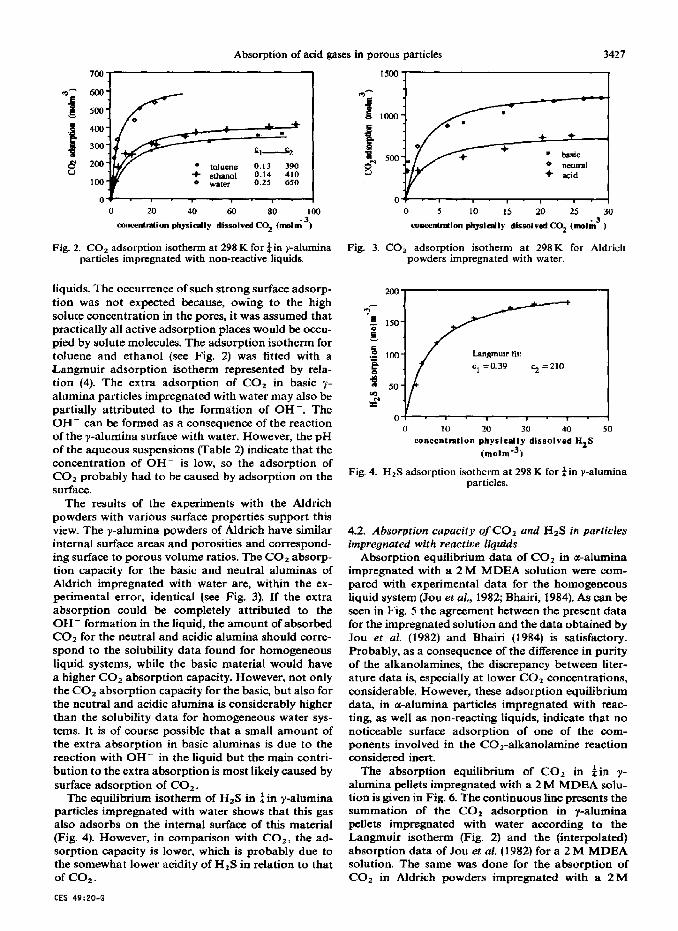
4.1.2. Absorption capacity of NZO, CO2 and HsS in y-ahmina impregnated with non-reacting solvents, Again the experimentally determined solubility of NsO in y-alumina particles impregnated with various solvents agree reasonably with the data found in liter- ature (see Table 3). However, the absorption of CO, in porous y-aluminas impregnated with non-reacting liquids was substantially higher than expected on the basis of the physical solubility. In Fig. 2 the extra “absorption” in the y-alumina particles of Engelhard is plotted as a function of the concentration physically dissolved CO, in the liquid. This extra absorption in ethanol and toluene had to be caused by surface adsorption of CO2 on y-alumina. This is a well known phenomenon in gas-solid systems (e.g. Rosynek, 1975), but from the present experiments it can be concluded that surface adsorption of CO2 is also of importance in y-alumina particles impregnated with
Absorption of acid
0 20 40 60 80 100
concenttiian physieplly dissolved CO2 (molti 3,
Fig. 2. CO, adsorption isotherm at 298 K for $ in y-alumina particles impregnated with non-reactive liquids.
liquids. The occurrence of such strong surface adsorp tion was not expected because, owing to the high solute concentration in the pores, it was assumed that practically all active adsorption places would be oecu- pied by solute molecules. The adsorption isotherm for toluene and ethanol (see Fig. 2) was fitted with a Langmuir adsorption isotherm represented by rela- tion (4). The extra adsorption of COz in basic y- alumina particles impregnated with water may also be partially attributed to the formation of OH-. The OH- can be formed as a consequence of the reaction of the y-alumina surface with water. However, the pH of the aqueous suspensions (Table 2) indicate that the concentration of OH- is low, so the adsorption of COz probably had to be caused by adsorption on the surface.
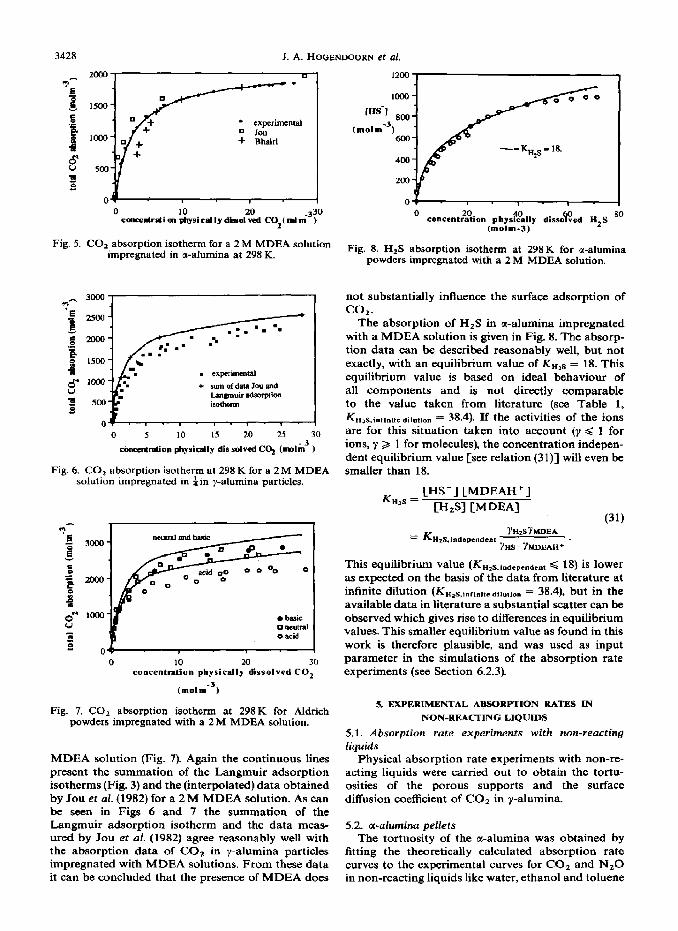
The results of the experiments with the Aldrich powders with various surface properties support this view. The y-alumina powders of Aldrich have similar internal surface areas and porosities and correspond- ing surface to porous volume ratios. The COz absorp- tion capacity for the basic and neutral aluminas of Aldrich impregnated with water are, within the ex- perimental error, identical (see Fig. 3). If the extra absorption could be completely attributed to the OH- formation in the liquid, the amount of absorbed COz for the neutral and acidic alumina should corre- spond to the solubility data found for homogeneous liquid systems, while the basic material would have a higher CO* absorption capacity. However, not only the CO, absorption capacity for the basic, but also for the neutral and acidic alumina is considerably higher than the solubility data for homogeneous water sys- tems. It is of course possible that a small amount of the extra absorption in basic aluminas is due to the reaction with OH- in the liquid but the main contri- bution to the extra absorption is most likely caused by surface adsorption of COa.
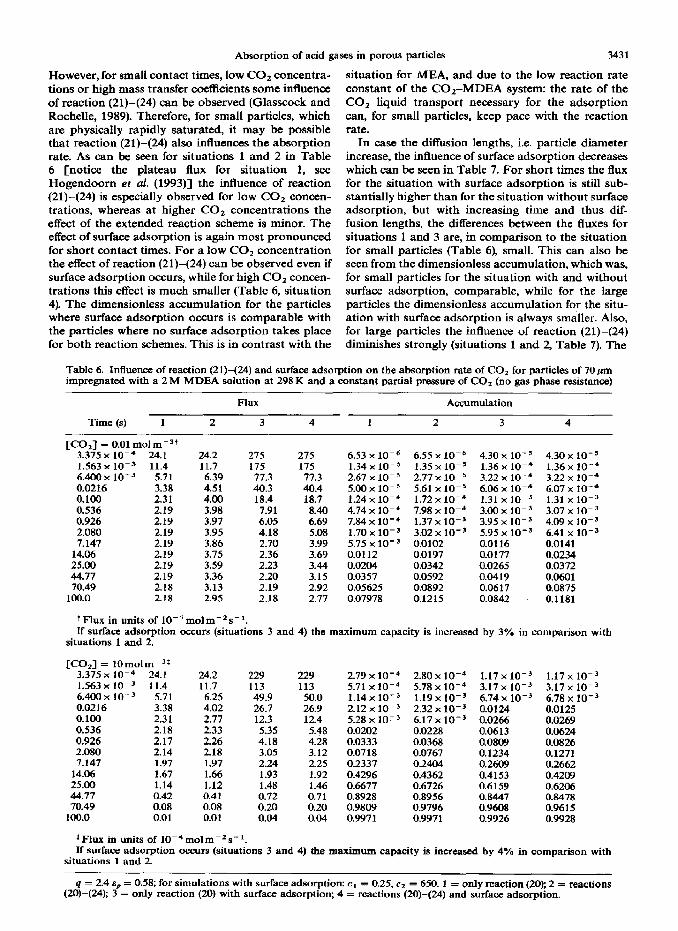
The equilibrium isotherm of H2S in fin y-alumina particles impregnated with water shows that this gas also adsorbs on the internal surface of this material (Fig. 4). However, in comparison with CO,, the ad- sorption capacity is lower, which is probably due to the somewhat lower acidity of HzS in relation to that of co1 .
CES 49:20-G
gases in porous particles 3427
1500 I I
n basic
o+ . I I 1 . I I I 0 5 10 15 20 25 30
concentration physicMy dissolved CO* (tttolnia3 )
Fig. 3. CO, adsorption isotherm at 298K for Aldrich powders impregnated with water.
Fig. 4. HIS adsorption isotherm at 298 K for ain y-alumina particles.
4.2. Absorption capacity of CO2 and HaS in particles impregnated with reactive liquids
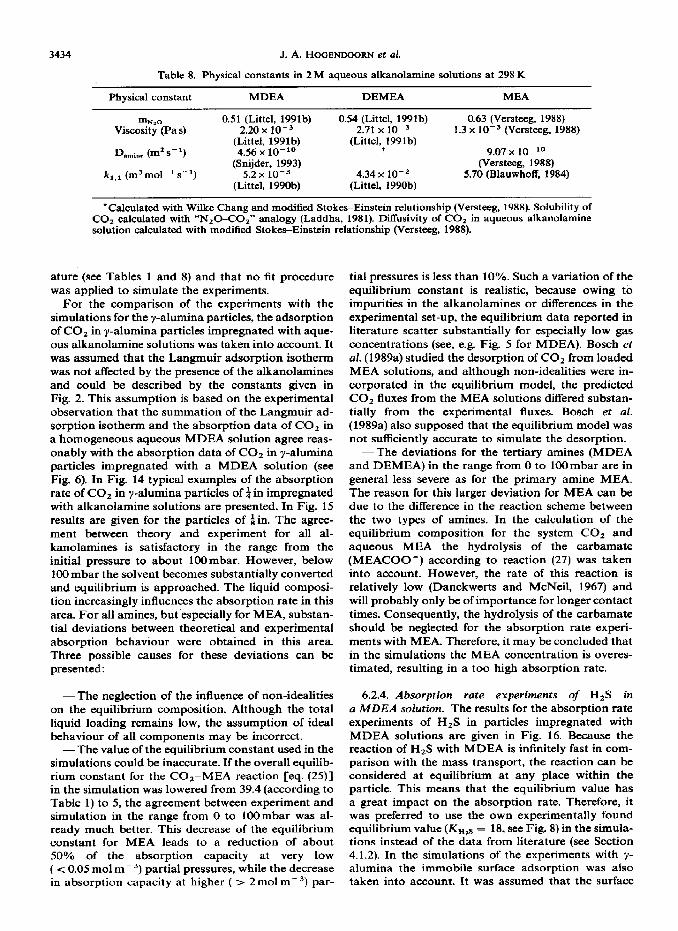
Absorption equilibrium data of CO2 in cx-alumina impregnated with a 2 M MDEA solution were com- pared with experimental data for the homogeneous liquid system (Jou et al., 1982; Bhairi, 1984). As can be seen in Fig. 5 the agreement between the present data for the impregnated solution and the data obtained by Jou et al. (1982) and Bhairi (1984) is satisfactory. Probably, as a consequence of the difference in purity of the alkanolamines, the discrepancy between liter- ature data is, especially at lower CO1 concentrations, considerable, However, these adsorption equilibrium data, in cl-alumina particles impregnated with reac- ting, as well as non-reacting liquids, indicate that no noticeable surface adsorption of one of the com- ponents involved in the CO,-alkanolamine reaction considered inert.
The absorption equilibrium of CO1 in iin y- alumina pellets impregnated with a 2 M MDEA solu- tion is given in Fig. 6. The continuous line presents the summation of the CO2 adsorption in y-alumina pellets impregnated with water according to the Langmuir isotherm (Fig. 2) and the (interpolated) absorption data of Jou et al. (1982) for a 2 M MDEA solution. The same was done for the absorption of CO2 in Aldrich powders impregnated with a 2M
3428
- 2mI
J. A. HOGENDOORN et al.
D 1
+ Bhairi
1ooo
WI 8oo (molnl“)
6co
400
200
0 20 -330 concenkilti m ‘~ysicsl ly dl.wd ved C02C ml m )
Fig. 5. CO2 absorption isotherm for a 2 M MDEA solution impregnated in a-alumina at 298 K.
0 5 10 15 20 25 30
concenttAon physically dis solved Cq (n&n3 )
Fig. 6. CO, absorption isotherm at 298 K for a 2 M MDEA solution impregnated in fin y-alumina particles.
v-
0 10 20 30 coocentrntion physically dissolved CO2
-3 (molm )
Fig. 7. CO1 absorption isotherm at 298K for Aldrich powders impregnated with a 2 M MDEA solution.
MDEA solution (Fig. 7). Again the continuous lines present the summation of the Langmuir adsorption isotherms (Fig. 3) and the (interpolated) data obtained by Jou et al. (1982) for a 2 M MDEA solution. As can be seen in Figs 6 and 7 the summation of the Langmuir adsorption isotherm and the data meas- ured by Jou et al. (1982) agree reasonably well with the absorption data of COz in y-alumina particles impregnated with MDEA solutions. From these data it can be concluded that the presence of MDEA does
04 . 1 .
0 concentr%ion phys%ly disso ved H2S v 8o
(molm-3)
Fig. 8. H,S absorption isotherm at 298K for a-alumina powders impregnated with a 2 M MDEA solution.
not substantially influence the surface adsorption of coz.
The absorption of H2S in a-alumina impregnated with a MDEA solution is given in Fig. 8. The absorp- tion data can be described reasonably well, but not exactly, with an equilibrium value of KHIS = 18. This equilibrium value is based on ideal behaviour of all components and is not directly comparable to the value taken from literature (see Table 1, K HIs,inTinite dilution = 38.4). If the activities of the ions are for this situation taken into account (y 4 1 for ions, y 3 1 for molecules), the concentration indepen- dent equilibrium value [see relation (31)] will even be smaller than 18.
K [HS -1 [MDEAH +]
“” = [HtS] [MDEA]
= KHAindcpendcnt YHzSYYDEA YHS- YNDEAH+ .
(31)
This equilibrium value (K HzS.iodependcnt d 18) iS lower
as expected on the basis of the data from literature at infinite dilution (KH2s,inTini,c dilu,ion = 38.4), but in the available data in literature a substantial scatter can be observed which gives rise to differences in equilibrium values. This smaller equilibrium value as found in this work is therefore plausible, and was used as input parameter in the simulations of the absorption rate experiments (see Section 6.2.3).
5. EXPERIMENTAL ABSORPTION RATES IN
NON-REACTING LIQUiDS
5.1. Absorption rate experiments with non-reacting liquids
Physical absorption rate experiments with non-re- acting liquids were carried out to obtain the tortu- osities of the porous supports and the surface diffusion coefficient of CO1 in y-alumina.
5.2. cc-alumina pellets
The tortuosity of the a-alumina was obtained by fitting the theoretically calculated absorption rate curves to the experimental curves for CO, and NtO in non-reacting liquids like water, ethanol and toluene
Absorption of acid gases in porous particles 3429
(see Tables 3 and 4 for data). The tortuosity of the material was determined at 4 = 2.0 f 0.3. With this value all physical absorption rate experiments could be simulated satisfactorily.
5.3. y-alumina pellets Physical absorption rate experiments of NzO in
toluene, ethanol and a 2 M MDEA solution were used to estimate the tortuosity of y-alumina (see Table 4 for diffusivity data). Fitting the theoretical curves to the experimental curves resulted for the $ and gin y- alumina pellets in a tortuosity of q = 2.4 + 0.3.
Subsequently, the surface diffusion coefficient of CO2 could be determined by fitting the theoretically calculated curves to experimentally obtained time- pressure data for the absorption of CO, in y-alumina
Table 4, Diffusivity of gases iti liquids at 298 K
Gas Solvent Dx(iO_9nPs-‘) Source
co2 Ethanol 4.07 Snijder (1994)
CO2 Toluene 4.89 Snijder (1994)
CO2 Water 1.91 Versteeg (1988) N20 Ethanol 4.25 Snijder (1994) N20 Toluene 5.08 Snijder ( 1994) NzO Water 1.78 Versteeg (1988) N20 2h4 MDEA 1.00 Versteeg (1988)
water l/4 inch water l/8 inch
,i . , . , . , . , . , .
0 loo 200 300 400 500 600 tlmc (I)
elhanol l/4 inch
V6 = 322 ml
Vg=1017ml
impregnated with non-reacting liquids. In the simula- tion the surface absorption of COz according to the Langmuir isotherm [see eq. (4) where cl and c2 as given in Fig. 21 was taken into account. The best results for all non-reacting liquids were obtained with a surface diffusion coefficient of D,,,BdS = 0, indicating that the adsorbed molecules were immobile. A few examples for the various fluids and particle sizes are given in Fig. 9. The continuous line represents the numerically calculated partial pressures, while the points are the experimentally determined partial pres- sures. In all experiments the experimental CO2 ab- sorption rate was slightly lower than theoretically predicted. This could either be due to an inaccuracy in the fitted Langmuir isotherm or to the fact that the rate of the adsorption step was not instantaneous. The conclusion of immobile adsorbed CO2 molecules is based on the assumption of an instantaneous adsorp- tion rate and supports the opinion of Prasher and Ma (1977), who concluded that surface diffusion is an unlikely transport mechanism in liquid filled pores. However, a finite adsorption rate of CO, and a sur- face diffusion coefficient larger than zero could prob- ably also result in the same agreement between theory and experiment. Nevertheless, the present model is able to describe the absorption behaviour of CO, in liquid impregnated y-alumina particles sufficiently ac- curate.
500
:b VIZ322 ml
Vg = 1017 ml
l e
l . 300
200 . -
toiuene l/8 inch
VI = 315 ml
Vg=945ml
0
0
7
50
-I
0 100 200 300 400 500 600
time (4
Fig. 9. CO1 absorption rate at 298 K in y-alumina particles impregnated with non-reacting liquids.
3430 J. A. HOGISNDOORN et al.
6. A3SORPTION RATE EXPERIMENTS IN REACTIVE
SOLUTIONS
6.1. Introduction First the absorption of CO2 in various al-
kanolamine solutions will be treated (Section 6.2) whereafter the absorption of H,S in the tertiary al- kanolamine MDEA (Section 6.3) will be dealt with. In Section 6.4 some qualitative remarks will be made about the possibility and influence of surface adsorp- tion of the reaction products on the absorption rate.
6.2. Absorption rate of CO2 in particles impregnated with alkanolamine solutions
6.2.1. Introduction. Before discussing the experi- mental results of the absorption rates of CO2 in par- ticles impregnated with various alkanolamine solu- tions (Section 6.2.3), some theoretical absorption rates and concentration profiles in the particles will be given in Section 6.2.2.
6.2.2. Influence of surface adsorption and parallel reactions. In Section 6.2.2.1 the influence of immobile surface adsorption of CO* on the absorption rate of CO, in particles filled with the primary alkanolamine MEA is discussed, while in Section 6.2.2.2 the influ- ence of reaction (21)-(24) on the absorption rate for CO, in particles impregnated with tertiary al- kanolamines will be dealt with. Also, in Section 6.2.2.2 the influence of the surface adsorption of CO9 in particles impregnated with tertiary alkanolamines is discussed. Finally, in Section 6.2.2.3 it will be demon- strated that the influence of surface adsorption and parallel reaction on the present absorption rate ex- periments is small.
6.2.2.1. Primary alkanoiamines Absorption rate experiments of CO2 in y-alumina
particles indicated that the adsorbed CO2 molecules were immobile. The effect of COz adsorption on the absorption rate in particles impregnated with a MEA solution at a constant pressure is given in Table 5. The
required input parameters were taken from literature and summarized in Tables 1 and 8. In Table 5 the dimensionless accumulation is the amount of gas which is absorbed at a particular time divided by the maximum amount which is absorbed at equilibrium. From this table it can be. concluded that surface adsorption has for the CO,-MEA system a decreas- ing influence with increase in time and diameter of the particles. For short times and small particles the flux is substantially higher as a consequence of the instan- taneous nature of the adsorption reaction and the small diffusion distances which have to be travelled
through the liquid. Although the fluxes for the situ- ations with surface adsorption are always higher than
without surface adsorption, the dimensionless accu-
mulation at comparable times is, except for very small dimensionless accumulations, always lower. This is due to the fact that the CO2 molecules which adsorb on the surface have to be transported through the liquid phase. This increases the CO2 gradient and thereby the flux, but the saturation time is increased. It should be noted however, that the total absorption capacity is about 45% higher for the situation with surface adsorption.
6.2.2.2. Tertiary alkanolamine solutions As mentioned earlier (Section 2.3) the influence of
the reaction (21)-(24) on the CO2 absorption rate for tertiary alkanolamines sometimes may be negligible.
Table 5. Influence of surface adsorption on the absorption rate of COZ for particles of 70~1m and 6 mm impregnated with a 2 M MEA solution at 298 K and a constant partial pressure of CO, of 10molm-3 (no gas phase resistance)
3.38 x 10m5 1.56x 1O-5 6.40 x 1O-4 2.16 x 1O-3 0.0100 0.0536 0.0926 0.2080 0.7147 1.406 2.500 4.477 7.049
10
15.6 12.7 12.5 12.4 11.9 10.8 10.1
8.54 3.98 0.63 0.02
48.0 42.4 28.6 16.9 12.5 10.9 10.2
8.68 4.35 1.67 0.66 0.24 0.08 0.02
1.46 x 1O-4 4.00 x 10⁻⁴ 1.32 x 1O-3 4.14 x 10-a 0.0183 0.0913 0.1516 0.3105 0.7705 0.9702 0.9993
2.22 x lo- 4 12.3 15.1 8.94x10-’ 1.02 x 10-o 8.02 x lo- 4 11.8 12.1 3.52 x 1O-4 2.96 x 10-O 2.50 x IO- 3 10.9 11.0 1.30 x lo-’ 9.61 x 1O-4 5.76 x lo- 3 9.44 9.53 3.95 x 10-S 2.8 x lo-” 0.0168 6.47 6.54 0.0143 0.0100 0.0682 2.88 2.98 0.0452 0.03 17 0.1104 2.12 2.20 0.0617 0.0435 0.2216 1.36 1.41 0.0948 0.0672 0.5501 0.69 0.72 0.175 0.125 0.7440 0.46 0.49 0.242 0.173 0.8612 0.33 0.35 0.312 0.227 0.942 1 0.23 0.24 0.409 0.295 0.9802 0.16 0.18 0.496 0.358 0.9945 0.13 0.14 0.567 0.412
q = 2.4 ep = 0.58; for simulations with surface adsorption: c, = 0.25, cz - 650. 1 = without surface adsorption; 2 = sur- face adsorption included. The time for the 6 mm particles has to be multiplied by 100.
Maximum absorption capacity for the particles with surface adsorption (situation 2) is 45% larger than particles where no surface adsorption occurs (situation 1).
Absorption of acid gases in porous particles 3431
However, for small contact times, low CO2 concentra- tions or high mass transfer coefficients some influence of reaction (21)-(24) can be observed (Glasscock and Rochelle, 1989). Therefore, for small particles, which are physically rapidly saturated, it may be possible that reaction (21)-(24) also influences the absorption rate. As can be seen for situations 1 and 2 in Table 6 [notice the plateau flux for situation 1, see Hogendoorn et al. (1993)] the influence of reaction (21)-(24) is especially observed for low CO, concen- trations, whereas at higher COz concentrations the effect of the extended reaction scheme is minor. The
effect of surface adsorption is again most pronounced for short contact times. For a low CO* concentration the effect of reaction (21)-(24) can be observed even if surface adsorption occurs, while for high COz concen- trations this effect is much smaller (Table 6, situation 4). The dimensionless accumulation for the particles where surface adsorption occurs is comparable with the particles where no surface adsorption takes place for both reaction schemes. This is in contrast with the
situation for IDEA, and due to the low reaction rate constant of the CO,-MDEA system: the rate of the COz liquid transport necessary for the adsorption can, for small particles, keep pace with the reaction rate.
In case the diffusion lengths, i.e. particle diameter increase, the influence of surface adsorption decreases which can be seen in Table 7. For short times the flux for the situation with surface adsorption is still sub- stantially higher than for the situation without surface adsorption, but with increasing time and thus dif- fusion lengths, the differences between the fluxes for situations 1 and 3 are, in comparison to the situation for small particles (Table 6), small. This can also be seen from the dimensionless accumulation, which was, for small particles for the situation with and without surface adsorption, comparable, while for the large particles the dimensionless accumulation for the situ- ation with surface adsorption is always smaller. Also, for large particles the influence of reaction (21)-(24) diminishes strongly (situations 1 and 2, Table 7). The
Table 6. Influence of reaction (2 l)-(24) and surface adsorption on the absorption rate of CO2 for particles of 70 pm impregnated with a 2 M MDEA solution at 298 K and a constant partial pressure of CO* (no gas phase resistance)
Flux Accumulation
Time (s) 1 2 3 4 1 2 3 4
[CO,] = 0.01 mol rnmSi 3.375 x 1O-4 24.1 24.2 275 275 6.53 x 1O-6 6.55 x 1O-6 4.30 x lo-’ 4.30 x lo-’ 1.563 x 1O-3 11.4 11.7 175 175 1.34 X 10⁻⁵ 1.35 X 10-p 1.36 x 1O-4 1.36 x 10-O 6.400 X 10-S 5.7 1 6.39 77.3 77.3 2.67 x lo-’ 2.77 x 1O-5 3.22 x lo-’ 3.22 x 1O-4 0.0216 3.38 4.51 40.3 40.4 5.00~ lO-5 5.61 x 1O-5 6.06 x lo-” 6.07 x i+ 0.100 2.3 1 4.00 18.4 18.7 1.24 x lo-“ 1.72x 1O-4 1.31 x IO-” 1.31 x10⁻³ 0.536 2.19 3.98 7.91 8.40 4.74 x 1O-4 7.98 x lO-4 3.00 x lO-3 3.07 x 10m3 0.926 2.19 3.97 6.05 6.69 7.84 x lo+ 1.37 x IO-” 3.95 x IO-” 4.09 x 1O-3 2.080 2.19 3.95 4.18 5.08 1.70 x10⁻³ 3.02x lO-3 5.95 x lO-3 6.41 x lo-” 7.147 2.19 3.86 2.70 3.99 5.75 X 10-s 0.0102 0.0116 0.0141
$Flux in units of 10-4molm-Zs-1. If surface adsorption occurs (situations 3 and 4) the maximum capacity is increased by 4% in comparison with
situations 1 and 2.
y = 2.4 sP = 0.58; for simulations with surface adsorption: c1 = 0.25, eZ = 650. 1 = only reaction (20); 2 = reactions (20)-(24); 3 = only reaction (20) with surface adsorption; 4 = reactions (20)-(24) and surface adsorption.
3432 .I. A. HOGENDOORN et al.
Table 7. Influence of reaction (21)-(24) and surface adsorption on the absorption rate of CO, for particles of 6mm impregnated with a 2 M MDEA solution at 298 K and a constant partial pressure of CO2 of 10 mol me3 (no gas phase
resistance)
Flux (x 10-4molm-2s-1) Accumulation
Time (s) 1 2 3 4 1 2 3 4
[CO,] = 0.01 molmm3’ 3.375 x lo- 3 7.98 8.43 72.0 72.1 1.06 x 10-e 1.09 x 1O-6 6.20~ 1O-6 6.22 x 1O-6 0.0 1563 4.26 4.89 32.0 32.1 2.27 x lo-” 2.45 x 1O-6 1.29 x 10-s 1.30 X lo- 5 0.0640 2.91 3.48 16.0 16.1 5.21 x IO-~ 5.94x 1O-6 2.56 x 10m5 2.59 x 10m5 0.216 2.64 2.99 8.88 9.06 1.28 x lo-’ 1.47x 1O-5 4.72 x lO-5 4.78 x lo- ’ 1.00 2.62 2.75 4.58 4.71 5.02 x 1O-5 5.51 x 10-s 1.05 x 1O-4 1.07 x lo-& 5.36 2.58 2.62 2.91 2.97 2.56 x 1O-4 2.67 x 1O-4 2.87 x lo-’ 2.95 x 1O-4 9.26 2.55 2.58 2.12 2.76 4.38 x 1O-4 4.52 x lo-’ 4.23 x 1O-4 4.34 x lo-”
20.80 2.50 2.51 2.57 2.59 9.66 x lo-“ 9.87x 1O-4 8.01 x lo-* 8.18 x lo-* 71.47 2.31 2.31 2.38 2.38 3.17 x 1O-3 3.20x 10-j 2.36~ 1O-3 2.38 x lo-’
140.6 2.11 2.10 2.20 2.20 5.93 x lo-” 5.97~ 10-j 4.33 x lo-’ 4.36 x lo-’ 250.0 1.87 1.86 1.99 1.99 9.87 x lo--’ 9.91 x 1O-3 7.18 x lo-’ 7.21 x lo-’ 447.7 1.56 1.55 1.72 1.72 0.0159 0.0160 0.0117 0.0118 704.9 1.29 1.28 1.48 1.47 0.0226 0.0226 0.0168 0.0171
‘If surface adsorption occurs (situations 3 and 4) the maximum capacity is increased with 44% in comparison with situations 1 and 2.
q = 2.4 E, = 0.58; for simulations with surface adsorption: e, = 0.25, c2 = 650. 1 = only reaction (20); 2 = reactions (20)-(24); 3 = only reaction (20) with surface adsorption; 4 = reactions (20)<24) with surface adsorption.
1.0
0.8
0.6
0.4
0.2
0.0
dimen%mkss radial position
Fig. 10. Concentration profiles of C02, OH- and MDEA inside the particle at a dimensionless accumulation of 0.0197 (-). For both situations the absorption in 2 M MDEA solu- tion is considered with sP = 0.58, 1 = 2.4. Situation (1) CC% gas ] = 0.01 molm-J, rl = 35pm, f = 14.06s. Situation (2) [CO,.,] = 10mol me3, rl = 3mm, t = 582s. Scaling: OH- = 1 zz 2.3 mol mm3; MDEA = 1% 2000m01m-3; situation (1)X0, = 1 2 7.2 x 10⁻³molm~3; situation (2)
CO, = 1 x 7.2molmW3.
Cot, OH and MDEA concentration profiles for the small and large particles at about the same dimen- sionless accumulation are given in Fig. 10. As ex-
pected, the concentration OH- decreases rapidly near the interface for large particles, thereby reducing the influence of reaction (21) on the absorption rate. In contrast, the concentration OH- in small particles remains practically constant over the entire radius of the particles, thereby influencing the absorption beha- viour significantly.
These simulations show that for small particles with short residence times, e.g. risers or trickle flow reactors, special attention must be paid to reaction (21)--(24) and the surface adsorption.
6.2.2.3. Influence of parallel reactions and surface adsorption on the time-pressure curves
The present absorption rate experiments were car- ried out with large alumina particles, initially high CO2 concentrations and large contact times in the reactor. Under these circumstances the influence of both reaction (21)-(24) for tertiary alkanolamines and surface adsorption in y-alumina particles is relatively small as was demonstrated in Sections 6.2.2.1 and 6.2.2.2. To verify whether either reaction (21)-(24) or the surface adsorption reaction had any noticeable effect on the time-pressure curves some comparative simulations were carried out for typical experimental conditions.
The absorption of CO2 in porous a-alumina par- ticles impregnated with a 2 M aqueous MDEA solu- tion at 298 is given in Fig. 11. Both the simplified [only reaction (20)] and the extended reaction scheme [reaction (20)-(24)J were used in these calculations.
From the results presented in Fig. 11 it can he seen that neglecting reaction (21)-(24) have very little in- fluence on the time-pressure curve. Therefore, it was concluded that the actual experiments with tertiary alkanolamines could be interpreted on the basis of reaction (20). The equilibrium value of this reaction, K coz, was comprised of the equilibrium values of
reactions (Zl), (23) and (24) and defined as
The influence of surface adsorption of CO2 on the time-pressure curve for typical experimental condi- tions with y-alumina particles is for both 2 M MEA as well as 2 M MDEA given in Fig. 12. In this figure it can be observed that the influence of surface adsorp-
Absorption of acid gases in porous particles
6001 6co
0 reaction20
- reactions2(F24
3433
MDEA
I VI=228 ml
Vg= 1111 ml
400
200
0 0 50 loo 150 200 250
time [sl
Fig. 11. Comparison for the absorption of CO, in a 2 M MDEA solution at 298 K for the extended and simplified
reaction scheme.
I MEA with surface adsorption
V, = 350 ml vg = 2250 ml
0 MDEA withsufaaadswplion
0 50 100 150 200 250 300
time (s)
Fig. 12. Influence of surface adsorption on the CO2 absorp- tion rate at 298 K for iin y-alumina particles impregnated
with 2 M aqueous alkanolamine solutions.
tion on the time-pressure curve is, even for the slowly reacting MDEA solution, very small. As already dem- onstrated this is due to the large particles, long con- tact but also to the fact that the gas concentration decreases. If the gas concentration decreases, the in- stantaneously adsorbed gas molecules just inside the particle will desorb and penetrate further inside the particle. This means that the effect of the instan- taneous surface adsorption at decreasing gas concen- tration is smaller as compared to the situation with a constant gas concentration.
In the simulations of the absorption rate experi- ments, surface adsorption was for the y-alumina par- ticle always taken into account. For tertiary al- kanolamines and all particles the experiments were simulated neglecting reaction (21)-(24). One should remember that the marginal effect of both reaction (21)-(24) and the surface adsorption on the time- pressure curves is only due to the experimental condi- tions (large particles, high CO, concentrations, long contact times, decreasing pressure), and that for other experimental conditions these two may well influence the absorption rate.
6.2.3. Experimental absorption rate experiments of CO2 in alkanolamine solutions. Typical results for the
0 100 200 300 400 500 600
time (6)
DEMEA
600
500 VL = 1050 ml
400
300
200
100
0 0 100 200 300 400
time (5)
MEA
JW
Vs = 322 ml
Vg = 2278 ml
0 50 100 150 200 time (s)
Fig. 13. CO2 absorption rate at 298 K in a-alumina particles impregnated with aqueous 2 M aqueous alkanolamine solu-
tions.
absorption rate experiments of CO2 in a-alumina pellets impregnated with alkanolamine solutions are given in Fig. 13. The continuous line represents the numerically calculated partial pressures, while the points are the experimentally determined partial pres- sures. It should be emphasized that the parameters required for the calculations were taken from liter-
3434 J. A. HOGENDOORN et al.
Table 8. Physical constants in 2M aqueous alkanolamine solutions at 298 K
Physical constant MDEA DEMEA MEA
mNzO 0.51 (Littel, 1991b) 0.54 (Littel, 1991b) 0.63 (Versteeg, 1988) Viscosity (Pas) 2.20 x 10-j 2.71 x 1O-3 1.3 x lo-” (Versteeg, 1988)
(Littel, 1991b) D *=lne (m2 s-l) 4.56 x lo-”
(Littel,,l99lb) 9.07 x lo-‘0
(Snijder, 1993) (Versteeg, 1988) !c~,~ (m3mol~‘s-‘) 5.2 x 10-j 4.34 x 10-Z 5.70 (Blauwhoff, 1984)
(Littel, 1990b) (Littel, 1990b)
‘Calculated with Wilke Chang and modified Stokes-Einstein relationship (Versteeg, 1988). Solubility of CO+ calculated with “NZOCO,” analogy (Laddha, 1981). Diffusivity of CO, in aqueous alkanolamine solution calculated with modified Stokes-Einstein relationship (Versteeg, 1988).
ature (see Tables 1 and 8) and that no fit procedure was applied to simulate the experiments.
For the comparison of the experiments with the simulations for the y-alumina particles, the adsorption of CO, in y-alumina particles impregnated with aque- ous alkanolamine solutions was taken into account. It was assumed that the Langmuir adsorption isotherm was not affected by the presence of the alkanolamines
and could be described by the constants given in
Fig. 2. This assumption is based on the experimental
observation that the summation of the Langmuir ad-
sorption isotherm and the absorption data of CO1 in a homogeneous aqueous MDEA solution agree reas- onably with the absorption data of CO2 in y-alumina particles impregnated with a MDEA solution (see Fig. 6). In Fig. 14 typical examples of the absorption rate of CO2 in y-alumina particles of z$ in impregnated with alkanolamine solutions are presented. In Fig. 15 results are given for the particles of kin. The agree- ment between theory and experiment for all al- kanolamines is satisfactory in the range from the initial pressure to about lOOmbar. However, below lOOmbar the solvent becomes substantially converted and equilibrium is approached. The liquid composi- tion increasingly influences the absorption rate in this area. For all amines, but especially for MEA, substan- tial deviations between theoretical and experimental absorption behaviour were obtained in this area. Three possible causes for these deviations can be presented:
-The neglection of the influence of non-idealities on the equilibrium composition. Although the total liquid loading remains low, the assumption of ideal behaviour of all components may be incorrect.
-The value of the equilibrium constant used in the simulations could be inaccurate. If the overall equilib- rium constant for the CO,-MEA reaction [eq. (25)] in the simulation was lowered from 39.4 (according to Table 1) to 5, the agreement between experiment and simulation in the range from 0 to lOOmbar was al- ready much better. This decrease of the equilibrium
constant for MEA leads to a reduction of about 50% of the absorption capacity at very low
( < 0.05 mol m 3) partial pressures, while the decrease in absorption capacity at higher ( > 2molme3) par-
tial pressures is less than 10%. Such a variation of the equilibrium constant is realistic, because owing to impurities in the alkanolamines or differences in the experimental set-up, the equilibrium data reported in literature scatter substantially for especially low gas concentrations (see, e.g. Fig. 5 for MDEA). Bosch et al. (1989a) studied the desorption of CO2 from loaded MEA solutions, and although non-idealities were in- corporated in the equilibrium model, the predicted CO, fluxes from the MEA solutions differed substan- tially from the experimental fluxes. Bosch et al. (1989a) also supposed that the equilibrium model was not sufficiently accurate to simulate the desorption.
-The deviations for the tertiary amines (MDEA and DEMEA) in the range from 0 to lOOmbar are in general less severe as for the primary amine MEA. The reason for this larger deviation for MEA can be due to the difference in the reaction scheme between the two types of amines. In the calculation of the equilibrium composition for the system CO2 and aqueous MEA the hydrolysis of the carbamate (MEACOO-) according to reaction (27) was taken into account. However, the rate of this reaction is relatively low (Danckwerts and McNeil, 1967) and will probably only be of importance for longer contact times. Consequently, the hydrolysis of the carbamate should be neglected for the absorption rate experi- ments with MEA. Therefore, it may be concluded that in the simulations the MEA concentration is overes- timated, resulting in a too high absorption rate.
6.2.4. Absorption rate experiments of H2S in a MDEA solution. The results for the absorption rate experiments of H,S in particles impregnated with MDEA solutions are given in Fig. 16. Because the reaction of H$ with MDEA is infinitely fast in com- parison with the mass transport, the reaction can be considered at equilibrium at any place within the particle. This means that the equilibrium value has a great impact on the absorption rate. Therefore, it was preferred to use the own experimentally found equilibrium value (Kwzs = 18, see Fig. 8) in the simula- tions instead of the data from literature (see Section 4.1.2). In the simulations of the experiments with y- alumina the immobile surface adsorption was also taken into account. It was assumed that the surface
Absorption of acid gases in porous particles 3435
MDEA
I
MDEA
6001
V, = 314 ml
VS==6ml
V,=304ml 5al
F 2”
V8 = 956 ml
5300
E2w
_ . 0 10 200 300 409 500 600 time (s)
DEMEA
600, 1 V,=364ml
Vs=896ml
0 50 100 WI 200 250
time (8)
MEA
Vs = 322 ml
VS = 2278 ml
MEA
500 VS = 322 ml
Vs = 2278 ml
0 100 200 300 400
time (6) 0 50 100 150
time (s)
Fig. 14. CO, absorption rate at 298K in tin y-alumina particles impregnated with aqueous 2 M alkanolamine
solutions.
Fig. 15. CO* absorption rate at 298 K in 4 in y-alumina par- ticles impregnated with aqueous 2M alkanolamine
solutions.
adsorption isotherm of H2S in y-alumina particles due to the relatively low equilibrium constant for the impregnated with MDEA solutions could be de- H,S-MDEA system. The tortuosity used in the simu- scribed by the isotherm found for water impregnated lations was adopted from the physical absorption rate y-alumina particles (see Fig. 4). Contrary to the ab- experiments as described in Sections 5.2 and 5.3. This sorption rate experiments for the CO2 in y-alumina means that these experiments were also simulated pellets, the simulations indicate that surface adsorp- without the introduction of any additional fit para- tion has a slight infiuence on the time-pressure curves. meters. The data required for the simulation are given The cause for this influence of surface adsorption is in Table 9. The experimental absorption rates of HIS
c % c 6 f
time (s)
DEMEA
600
500 VP = 914 ml
400
300
200
loo
0
time ($I
3436 J. A. HOGEND~~RN et al.
alfa alumina
Vs = 283 ml
Vg = 2480 ml
2&l 4&J 600
lime (s)
gamma alumina 114 inch
Vs= 321 ml
Vg = 2442 ml
loo-
0 * I I 1 0 200 400 fxo
time (s)
gamma alumina 118 inch
Vs = 318 ml
Vg = 2445 ml
” I
0 2w 400 400
time (s)
Fig. 16. H,S absorption rate at 298 K in 2 M MDEA solu- tions in various alumina carriers.
in various particles show the same type of deviation. For short times the theory predicts absorption rates which are too low, while for longer times the absorp- tion rates for all pellets is somewhat faster as meas- ured experimentally. This systematic deviation is probably still due to equilibrium value (see Fig. 8) which is not able to predict the equilibrium data accurately over the whole H2S concentration range.
Table 9. Parameters for the H2S and 2 M MDEA system at 298 K
Parameters References
mHls = 2.17 Versteeg et al., 1989 K ~2s = lg This work D HIS = 9.27 x lo- lo Versteeg et al., 1989 D MDE* = 4.31 x lo-‘0 Versteeg et al., 1988
Diffusivity and solubility of H,S were estimated analogous to the “CO,-N,O” analogy (Versteeg et al., 1989).
Nevertheless, the agreement between theory and ex-
periments is reasonable.
6.3. Influence of surface adsorption of the reaction products on the absorption rate
Analysis of the composition of the aqueous MDEA solution before and after the impregnation of the y-alumina particles resulted in identical concentra- tions of MDEA. This means that adsorption of MDEA on the internal surface of y-alumina is very small. No experimental data are known for the ad- sorption of the products of the reaction between CO2 or HIS and the various alkanolamines on the internal surface. Because the absorption data of CO* in y-alumina impregnated with MDEA correspond reas- onably well with the sum of the absorption data of CO1 in y-alumina impregnated with water and the absorption data of Jou et al. (1982), it can be assumed that the products do not strongly adsorb on the sur- face. However, it cannot be excluded that the surface adsorption of CO2 decreases in the presence of the products of the COz-alkanolamine reaction.
The influence of surface adsorption of the products on the absorption rate of the gas will increase with the ratio of the amount adsorbed products on the surface to the equilibrium constant. Due to possible surface adsorption of the products the equilibrium constant can apparently be increased. For reactions of finite rate the equilibrium value only influences the absorp- tion rate of the gas at longer times (see Hogendoorn et al., 1993). However, for reactions instantaneous with respect to mass transfer, possible adsbrption of the reaction products will influence the absorption beha- viour from the start of the experiment. Because the surface adsorption of the reaction products is ex- pected to be low, it will probably have, just like the surface adsorption of CO, and H,S, a limited effect on the time-pressure curve for the absorption of CO2 in alkanolamine solutions.
7. CONCLUSIONS
An experimental study of the absorption behaviour of CO2 and Hz!3 in a-alumina and y-alumina particles impregnated with non-reactive and reactive solvents is presented. Physical absorption rate experiments of CO2 and XV20 were carried out to obtain the tortuos- ity of the porous materials. The tortuosity of the pores of the u-alumina particles and y-alumina particles
Absorption of acid gases in porous particles 3437
were, respectively, 2.0 + 0.3 and 2.4 + 0.3. All addi- .+ porosity tional parameters required for the simulation of the yi stoichiometric coefficient in relation (1) absorption of CO2 and HIS in alkanolamine solu- tions were taken from literature. The absorption of Superscripts
CO2 and H2S in a-alumina particles impregnated n, m, p. q reaction orders in reaction rate expression with these solutions could be described satisfactorily. RI Differences between experiments and simulations for 0 initial
CO2 mainly occurred at approaching equilibrium and
seemed to be primarily caused by the inaccuracy of the equilibrium
NOTATION
composition of the CO,-al- kanolamine system. An unexpected immobile surface adsorption of CO, and H2S was observed in y-
a,
alumina particles impregnated with reactive as well as
specific contact area between gas and solid,
non-reactive solvents. However, this surface adsorp-
mz mm3
tion did not influence the absorption rate of CO2 and H,S in y-alumina particles impregnated with al- kanolamine solutions significantly. The rate of CO2
CA1
and H2S absorption in y-alumina particles impreg-
concentration
nated with alkanolamine solutions could, like the
of absorbed component,
experiments with a-alumina, also be described within a reasonable accuracy.
mol me3 liquid
cAl.4. concentration of adsorbed component, mol m- 3 liquid
REFERENCES
Aris, R., 1957, On shape factors for irregular particles I-The steady state problem. Diffusion and reaction. Chem. Engng Sci. 6, 262-268.
Bhairi, A. M., 1984, Experimental equilibrium between acid nases and ethanolarnine solutions. Ph.D. dissertation. Oklahoma State University.
Blauwhoff. P. M. M. and Swaaii van, W. P. M., 1980. Gas-liquid equilibria between k,S, CO, and aqueous amine solutions, in Proceedings of 2nd International Con- ference on Phase Equilibria and Fluid properties in the Chem. Ind.. D. 78. EFCE nublication 11. Berlin.
Blauwhoff, P. ‘M. M., Ver&eg, G. F. and Swaaij van,
LU I--LLJ.
W. P. M., 1984, A study on the reaction between COa and
Bosch, H., Versteeg, G. F. and Swaaijvan, W. P. M., 1989a,
alkanolamines in aqueous solutions. Chem. Engng Sci. 39,
Desorption of acid gases from loaded alkanolamine solu-
^,._ ^__
tions, in Proceedings of Process Technology, Vol. 8, Gas Separation and Purijicarion, pp. 505-512. Antwerpen.
Bosch, H., Versteeg, G. F. and Swaaij van, W. P. M., 1989b, A centrifugal reactor for the selective removal of HsS from CO, containing gases, in Proceedings of Process Techno- logy, Vol. 8, Gas Separation and Purification, pp. 513-520. Antwerpen.
[B], [Cl. concentration of non-volatile reactants and Crank, J., 1976, Mathematics of dimsion, reprint. Oxford
[D] products, mol m - 3 liquid University Press, Oxford.
constant in eq. (4), m3 mol- r Danckwerts, P. V. and McNeil, K. M., 1967, The absorption
constant in eq. (4), mol me3 liquid of carbon dioxide into aqueous amine solutions and the
length cylindrical particles m partition coefficient of A pressure, bar tortuosity radius of particle, m radial coordinate, m reaction rate related to component A, molm-31iquids-1 gas constant, Jmol-’ K-l temperature, K time, s
Hogendoom, J. A., Versteeg, G. F. and Swaaij van, W. P. M., 1993, Mass transfer accompanied by reversible chemical reactions in an inert porous sphere impregnated with a stagnant liquid. Chem. Engng Sci. 48, 2727-2740.
IUPAC, 1981, Solubility Data Series, Vol. 8, Oxides ofNitro- gen (Edited by L. Young). Pergamon Press, Oxford.
Jou, F. Y., Mather, A. E. and Otto, F. D., 1982, Solubilities of HsS and COs in aqueous methyldiethanolamine solu- tions. Ind. Enana Chem. Process Des. Dev. 21. 539-544.
Komiyama, H. %l Smith, J. M., 1974a. Intrapartiele mass transfer in liquid-filled pores. A.I.Ch.E. J. 20. 728-734.
Komiyama, H. and Smith; J. M., 1974b, Surface diffusion in liquid filled pores. A.1.Ch.E. J. 20, 1110-1117.
Laddha, S. S., Diaz, J. M. and Danckwerts, P. V., 1981, The NsO analogy: the solubilities of CO2 and NsO in aqueous solutions of organic compounds. Chem. Engng Sci. 36, 228-229.
volume occupied by gas in absorption vessel, m3 total volume of absorption vessel, m3 volume occupied by liquid impregnated particles, m3
Lee, S. Y., Seader, J. D., Tsai, C. H. and Massoth, F. E., 1993, Multicomnonent liauid-ohase diffusion and adsorotion in porous caialyst pariiclei. Chem. Engng Sci. 48, 555-607.
Leyva-Ramos, R. and Geankoplis, C. J., 1985, Model simula- tion and analysis of surface-diffusion of liquids in porous solids. Chem. Engng Sci. 50, 799-807.
Littek R. J.. Boss, M. and Knoop, G. J.. 199Oa. Dissociation
Greek letters constants of some alkanolamines at 293, 303. 318 and
fraction of total volume occupied by liquid 333 K. J. them Engng Data 35,276-277.
8. Littel, R. J., Filmer, B., Versteeg, G. F. and Swaaij van, impregnated particles W. P. M., 1991a, Modelling of the simultaneous absorp-
3438 J. A. HOGENDOORN et 01.
tion of H,S and CO2 in alkanolamine solutions: the influ- ence of parallel and consecutive reversible reactions and the coupled diffusion of ionic species. Chem. Engng Sci. 46, 2303-2313.
Littel, R. J., Swaaij van, W. P. M. and Versteeg, G. F., 199Ob, The kinetics of carbon dioxide with tertiary amines in aqueous solution. A.1.Ch.E. J. 36, 1633-1640.
Littel. R. J.. Versteee. G. F. and Swaaii van. W. P. M.. 199lb. Solubility and di&sivity data for the absorption of COS; CO2 and N,O in amine solutions. 1. them. Engng Data 37, 49-35.
Littel, R. J., Versteeg, G. F. and Swaaij van, W. P. M., 1991e, Diffusivity measurements in some organic liquids by a gas-liquid diaphragm cell. J. them. Engng Data 37, 42-45.
Littel, R. J., Versteeg, G. F. and Swaaij van, W. P. M., 1991d, Physical absorption into non-aqueous solutions in a stirred cell reactor. C/tern. Engng Sci. 46, 3308-3313.
Ma, Y. H. and Evans, L. B., 1968, Transient diffusion from a well stirred reservoir to a body of arbitrary shape. A.1.Ch.E. J. 14, 956-961.
Prasher, R. P. and Ma, Y. H., 1977, Liquid diffusion in microporous alumina pellets. A.1.Ch.E. J. 23, 303-3 11.
Rosynek, M. P., 1975, Isotherms and energetics of earbon dioxide adsorption on y-alumina at lOO-3OtJ”C. J. Phys. Chem. 79, 1280-1284.
Schrauwen, F. J. M. and Thoenes. D.. 1988. Selective aas absorption in a spray cyclone scrubber. Chem. Engng &i. 43,2189-2194.
Snijder, E. D., te Riele, M. J., Versteeg, G. F. and Swaaij van, W. P. M., 1993, Diffusion coefficients of several aqueous alkanolamine solutions. J. Chem. Ena Data. 38.473480.
Snijder, E. D.. te Riele, M. J., Versteeg, 6. F. and Swaaij van, W. P. M., 1994, Diffusion coelliclents of CO, COz, N,O and N, in ethanol and toluene. J. Chem. Eng. Data (sub- mitted).
Versteee. G. F. and Swaaii van. W. P. M.. 1987. The gas-l&id centrifugal reacior. A’novel type of gas-liquid contactor. 1. Chem. E. Symp. Series 104, B139-Bi54.
Versteeg, G. F. and Swaaij van, W. P. M., 1988, Solubility and diffusivity of acid gases (CO,,N,O) in aqueous al- kanolamine solutions. J. Chem. Engng Data 33, 29-34.
Versteeg, G. F., Kuipers, J. A. M., Beckum van, F. P. H. and Swaaij van W. P: M., 1989, Mass transfer with complex reversible reactions-I. Single reversible chemical reac- tion. Chem. Engng Sci. 44, 2295-2310.