124
COLUMBIA LIBRARIES OFFSITE .HEALTH SCIENCES STANDARD HX00028630 ATWATER EXPERIl^ffiNTS ON THE MBITABOLISM.
COLUMBIA LIBRARIES OFFSITE.HEALTH SCIENCES STANDARD
HX00028630
ATWATER
EXPERIl^ffiNTS ON THE MBITABOLISM.

Columbia (HnitJers^ttp
College of l^\)^^\tiwxsi mt ^urgeon£(


Bulletin No. 69—(lievisf-a Kditiou)
U. S. DEPARTMENT OF ArxRICULFHRE,OFFICE* OF EXPERIMENT STATIONwS,
A. C. TRUE, Director.
EXPERIMENTS
ox THE
METABOLISM OF MATTER AND ENERGY
IN THE HUMAN BODY.
W. 0. ATA\ATER, Ph. 1)., AND F. (i. BENEDICT, PIu D.
\\ ITH THE COOPKKATIOX (ft. ,
A. W. SMITH, M. S., AND A. P. BRYANT, M. 8.
WASHINGTOi^^:
GOVERNJMENT PRINTING OFFICE.
1890.

LIST OF PUBLICATIONS OF THE OFFICE OF EXPERIMENT STATIONS ON
THE FOOD AND NUTRITION OF MaiM.'
charts. Food iiud Diet. By W. O. Atwater. (Four charts. 2(5 by 10 inches.) I'riio
per sot, iininoinitcd, 7") cents; nionnted, +1.
Hill. I'l. Mt'tlioiis and Kisults of Investigations on the Chemistry and Economy of
loud. Hy W. (>. Atwater. Pp. 222. Trice, 15 cents.
Bui. 2M (Revised edition). The t'hemical Composition of American Food Materials.
IJy \V. «>. .\twater and A. 1'. Bryant. I'p. 87. Price, 5 cents.
Mill. 29. l)ietary Stndies at the University of Tennessee in 18ir>. By 0. !K. Wait,with couuuents by W. O. Atwater and C. D. Woods. Pp. 45. Price, 5
cents.
Bui. SI. Dietary Studies at the ruivcrsity of Missouri in 18it5, and Data Relatin>![ to
Bread and Meat Consumption in Missouri. By 11. P.. Gibson, 8. Calvert,
and 1). W. May, with comments by W. O. Atwater and C. D. Woo<lsPp. 24. Price, 5 cents.
Bnl. \V2. Dietary Studies at I'nrdue University, Lafayette, Ind., in 1895. By W. K.
Stone, with comments by W. O. Atwater and C. D. Woods. Pp. 28. Price,
5 < cuts.
Bnl. :ir>. Food and Nutrition Investigations in New .Tersey in 1895 and 1896. liy
E. B. Voorliees. Pp. 10. Price, 5 cents.
Bui. :>7. Dietary Studies .it the Maine State College in 1895. By W. H. Jordan.Pp. 57. Price, 5 cents.
Bui. :!S. Diitary Studies with Reference to the Food of the Negro in Alabama in
I8!'5and 189H. Conducted with the Cooperation of the Tuskegee Normaland Industrial Institute and the Agricultural and Meehanieal College ot
Alabama. Keported by W. O. Atwater and C. D. Woods. l'i». 69. Price,
5 cents.
Bnl. 40. Dietary Studies ill New Mexico in 1895. liyA.Goss. Pp.23. Price, 5 cents.
Bnl. 43. Eos.se3 in Boiling Vegetables and the Composition and Digestibility ofPotatoes and Eggs. By H. Snyder, A. J. Frisby, and A. P. Bryant. Pp. 31.
Price, 5 cents.I^ii!. II. Keport of Preliminary Investigations on the Metabolism of Nitrogen and
'.'arbon in the Human Organism with a Resi)iration Calorimeter ofSpecial Construction By \V. O. Atwater, C. ]>. Woods, and F. 0.Benedict. Pp. 61. Price, 5 cents.
Bui. 45. ,\ Digest of Metabolism Experiments in which the Balance of Im (tine an<l
(tntjjo was Determined. Uy W. O. Atwater and G. F. Lang worthy.Pp. 134. , Price, 2") cents.
Bnl. 4(1. Di.Uary Studies in New York City in 1895 and 1896. By W. O. Atwater andC. D. Woods. Pp. 117. Price, 10 cents.
Bnl. .52. Nutrition Investigations in Pittsburg, Pa., 1894-1896. By Isabel Fievier.
Pj). 18. Price, 5 cents.Bui. 53. Nutrition Investigations at the University of T<'nne88ee in 1896 and lS'.t7.
By C. E. Wait. Pi).46. Price, 5 cents.
Bnl. 54. Nutrition Investigations in New Mexico in 1897. By A. (Joss. Pp.20. Price,
.5 cents.Bnl. .55. Dietary Studies in Chicago in 1895 and 1896. Conducted with the Coopera
tion of .lane A<ldaiiis and ('aroline L. Hunt, of Hull House. Reported b\
W. O. ,\.t water aiul .V. P. Bryant. Pp. 76. Price, 5 cents.Bui. 56. History and Present Status of lustnictiou in Cooking in the Public School
of New York City, h'eported by Mrs. Louise E. Hogan, with an iiitro
ductioii liy A. C. True, Ph. I). Pp.70. Prict% 10 cents.Bui. ti:!. Deseri))tion of ;i New Respiration Calorimeter and Experiments on the Con-
nervation of Energy in tlie Hiiiuaa liody. By W. O. Atwater and E. B.Rosa. Pp.91. Price, 10 cents.
Bill. tki. I'ho Physiological Ell'ect of (!reatiii and Creatinin and Their Value asNutrieiils. By .I. W. Mallet. Pp.21. Price, 5 cents.
''Ill 67. Studies on Bread and Bread Making. By Harry Siwyder and L. .\. Voorhees.l*p. 51, Price, 10 cents.
l-AU.MKItS' BUI.I.KTINS.
Bui, 23. Foods: Nutritive Valiu- and Cost, By W. O. .Vtwater. Pp, .32.
Bill. 34. MeatH: Composition and Cooking. By C. D. Woods. Pp.29.Bui. 7«. Milk as Food. Pp.39.Bnl. K5. Fish as Food, By C. 1', Langworthy. Pp. 30.Fiul. 93. Sugar a» Food. By Mary Hininan Abel. Pp.27.
• For tho««> piiblieiitiouH to wliieli a jirico is allixed, a|)plic.ition should be made tothe Hiiperintendent of Documents, L'nioii Buihling, Washington, I). C, the olTicer
designated by Jaw to sell Govi.Tiiment publications.
Bulletin No. 69—(ReviBed Edition.) 302
U. S. DEPARTMENT OF AGRICULTURE.OFFICE OF EXPERIMENT STATIONS.
A. C. TRUE, Director.
EXPERIMENTS
ON THE
METABOLISM OF MATTER AND ENERGY
IN THE HUMAN BODY.
BY
W. 0. ATWATER, Ph. D., AND F. d. BENEDICT, Ph. D.
WITH THE COOPERATION OF
A. W. SMITH, M. S., AND A. P. BRYANT, M. S.
washi:n^gto:n^:
GrOVERiSrMENT PRINTINa OFFICE.
1899.
".^rLEHER OF TRAN'SMriTAL.N'SM
u. s. departisrent of agriculture,Office of Experiment Stations,
Washington^ JJ, C, October i.o, inoa.
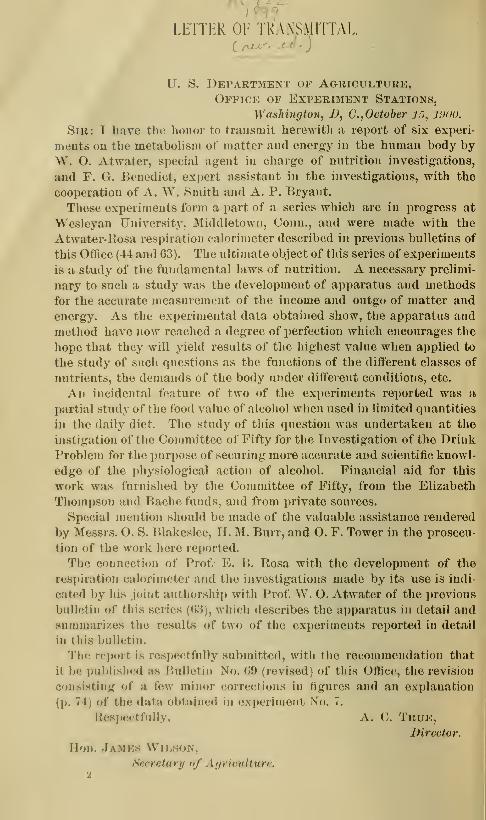
SiE : I have the honor to transmit herewith a report of six experi-
ments on the metabolism of matter and enerj>y in the human body by
W. O. Atwater, special agent in charge of nutrition investigations,
and F. G. Benedict, expert assistant in the investigations, with the
cooperation of A. W. Smith and A. P. Bryant.
These experiments form a part of a series whicli are in progress at
Wesleyan University, Middletown, Conn., and were made with the
Atwater-Rosa respiration calorimeter described in previous bulletins of
this Office (44 and 63). The ulciraate object of this series of experiments
is a study of the fundamental laws of nutrition. A necessary prelimi-
nary to such a study was the development of apparatus and methods
for the accurate measurement of the income and outgo of matter and
energy. As the experimental data obtained show, the apparatus and
method have now reached a degree of perfection which encourages the
hope that they will yield results of the highest value when applied to
the study of such questions as the functions of the different classes of
nutrients, the demands of the body under different conditions, etc.
An incidental feature of two of the experiments reported was a
partial study of the food value of alcohol when used in limited quantities
in the daily diet. The study of this question was undertaken at the
instigation of the Committee of Fifty for the Investigation of the Drink
I*roblem for the purpose of securing more accurate and scientific knowl-
edge of the physiological action of alcohol. Financial aid for this
work was furnished by the Committee of Fifty, from the Elizabeth
Thompson and Bache funds, and from private sources.
Special mention should be made of the valuable assistance rendered
by Messrs. O. S. Blakeslee, H. M. Burr, and O. F. Tower in the prosecu-
tion of the work here reported.
The connection of Prof. E. B. Rosa with the development of the
respiration calorimeter and the investigations made by its use is indi-
cated by his joint authorship with Prof. VV. O. Atwater of the i)revious
bulletin of this series (03), which describes the apparatus in detail andsniiimarizes the results of two of the experiments reported in detail
in this bulletin.
The report is respectfully submitted, with the recommendation that
it be published as Bulletin No. C9 (revised) of this Office, the revision
consisting of a few minor <',orrections in figures and an ex])lanation
(p. 74) of the data obtained in experiment No. 7.
HoHpe<trully, A. C. True,Director.
Hon. Jamks Wilson,Secretary of A (/riculture.
2
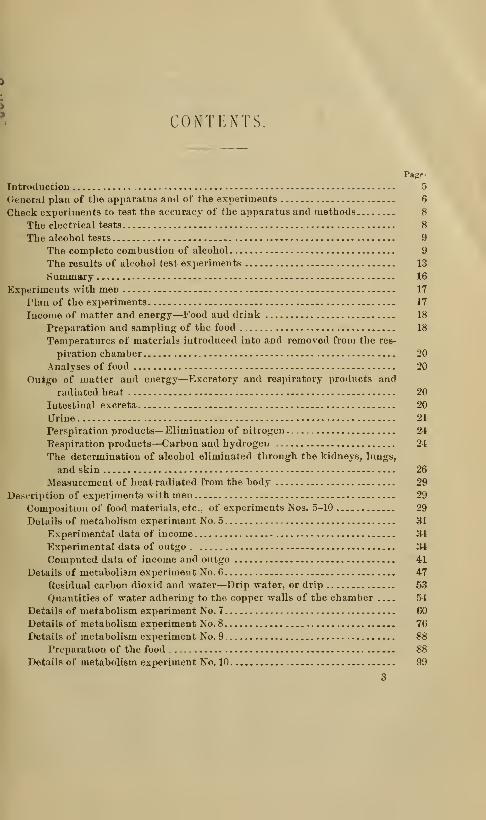
' CONTENTS.
Page.
Introductiou - 5
General plan of the apparatus and of the experiments 6
Check experiments to test the accuracy of the apparatus and methods 8
The electrical tests 8
The alcohol tests 9
The complete combustion of alcohol 9
The results of alcohol test experiments 13
Summary 16
Experiments with men 17
Plan of the experiments 17
Income of matter and energy—Food and drink 18
Preparation and sampling of the food 18
Temperatures of materials introduced into and removed from the res-
piration chamber 20
Analyses of food 20
Outgo of matter and energy—Excretory and respiratory products and
radiated heat 20
Intestinal excreta 20
Urine 21
Perspiration products—Elimination of nitrogen 24
Respiration products—Carbon and hydrogen 24
The determination of alcohol eliminated through the kidneys, lungs,
and skin 26
Measurement of heat radiated from the body 29
Description of experiments with men 29
Composition of food materials, etc., of experiments Nos. 5-10 29
Details of metabolism experiment No. 5 31
Experimental data of income 34
Experimental data of outgo . 34
Computed data of income and outgo 41
Details of metabolism experiment No. 6 47
Residual carbon dioxid and water—Drip water, or drip 53
Quantities of water adhering to the copper walls of the chamber 54
Details of metabolism experiment No. 7 60
Details of metabolism experiment No. 8 76
Details of metabolism experiment No. 9 88
Preparation of the food 88
Details of metabolism experiment No. 10 99
3

METABOLISM OF MATTER AND ENERGY IN THEHUMAN BODY.
INTRODUCTION.
The present report describes in detail six of a series of experi-
ments upon the metabolism of matter and energy in the human body.
These experiments were made with the respiration calorimeter de-
scribed in detail in a previous bulletin,^ which also summarized the
results of two of the six experiments here described. Four experi-
ments in which only the balance of income and outgo of matter was
determined were previously made with this apparatus, or, more accu-
rately speaking, that portion of it which is properly called a respiration
apparatus, and reported in Bulletin 44 of this Office.
The ultimate purpose of the research to which these experiments
belong is the study of some of the fundamental laws of nutrition.
The plan of the whole inquiry is based upon the principle that the
chemical and physical changes which take place within the body, and
to which the general term ''metabolism" is applied, occur in obedience
to the laws of the conservation of matter and energy. That the law of
the conservation of matter applies within the living organism no one
would question. It might seem equally certain that the metabolism of
energy within the body takes place in accordance with the law of the
conservation of energy. The quantitative demonstration is, however,
desirable, and an attested method for such demonstration is of funda-
mental importance for the study of the general laws of metabolism of
both matter and energy.
Accordingly the more immediate object of the present inquiry has
been to develop an apparatus and method of inquiry by which the
metabolism of both matter and energy in the body could be quanti-
tatively measured and the action of the law of the conservation of
energy demonstrated, if practicable. It was believed that if this first
object could be accomplished, at least within reasonable limits, it would
be possible to devise and carry out experiments for the satisfactory
study of a number of important questions, including among others the
functions of the several classes of nutrients of food and the demandsof the body under the different conditions.^
'U. S. Dept. Agr., Office of Experiment Stations Bui. 6.3. See also Bnl. 44 of the
same office and account of the apparatus as a calorimeter and of the results of
experiments in Storrs (Conn.) Sta. Rpt. 1897, p. 212.
-For further statements upon this subject see U. S. Dept. Agr., Office of Experi-
ment Stations Bui. 63, pp. 7-12, and Bui. 21 of the same office, pp. 99-135. For a
discussion of the sources of error in these experiments see Bui. 63, just mentioned,
pp. 90-94.
5
We need to know more than we do at present of the ways in which
llic different materials are used in the body for the building or repair
of tissue, or the yielding of energy. It is desirable to learn whether in
their service as fuel to supply the body with muscular power and heat
their physiological value is or is not equal to their calorimetric value.
To put it in another way, we need to learn not only whether the total
energy of different food materials is transferred into kinetic energy in
the body, but also under what circumstances and to what extent the
body avails itself of that energy. To this end it is desirable to experi-
ment with as large a variety of materials as possible, including com-
mon forms of i)roteids, fats, sugars, and starches.
The experiments here reported give data bearing upon the metabo-
lism of matter and energy, the conservation of energy, and the action
of the ordinary nutrients of food in the body. They thus bear upon all
of the subjects just indicated.
In addition to this some studies of the nutritive action of alcohol
were made at the instigation of the Committee of Fifty for the Investi-
gation of the Drink Problem. The committee wished more accurate
and scientific information concerning the i^hysiological action of alcohol
than has been hitherto possible to obtain. To this end a considerable
sum has been devoted by the committee from its own treasury for the
prosecution of these experiments. This sum has been supplemented
by other gitts from private sources and also by appropriations from
the Elizabeth Thoini)son and Bache funds. The same laboratory
privileges which have been extended by Wesleyan University to the
general nutrition investigations conducted at that institution under
the auspi(;es of the TJ. S, Department of Agriculture and the Storrs
Experiment Station have been extended to this special investigation.
By a fortunate cooperation of the several agencies named a consid-
erable amount of inquiry has been jmssible. Although this alcohol
investigation has been conducted with funds which were not supplied
by the Department, it is entirely fitting that the details of the investi-
gation, so far as it is of si)e('ial interest in connection with the laws of
nutrition, shouhl l)e published in connection with the other metabo-
lism ex])eriments of this series. They are, accordingly, included in
the Keri<*s herewith reported. Exi)eriinents Nos. 7 and 10 are so called
alcohol experiments—that is to say, the daily menu in each of these
experiments inchub'd a ceitain amount of alcohol which replaced aniHodynamic amount of fats, sugars, and starches. In some of the later
experimentH, not rei>orted here, it has likewise rei)laced the equivalent
sugar, starch, and fat, an<l in still others it has been added to the
nutrients of an «)ther\vise (ln])]icate e\]»eriment.
GENERAL PLAN OF THE APPARATUS AND OF THE EXPERIMENTS,
The name "respiration calorimeter" as applied to the api)aratns
nsed in these exj)erimentH is suggested by the tact that it is essentially
a respiration apparatus, with a])pliances for (calorimetric measure-
ments. As a respiration apparatus it is similar to that of Pettenkofer.
As an instrument for measuring heat it is essentially a calorimeter.
The heat is absorbed and carried away by a current of water as rapidly
as it is generated in the chamber. It is therefore a water calorimeter.
The arrangements for the measurement of both the respiratory products
and the heat given off by the body differ in important respects from
those of any other apparatus with which we are familiar. The essen-
tial features of the apparatus are
:
(1) A chamber in which the subject of the experiment—a man—lives,
eats, drinks, sleeps, and works during a period of several days andnights. The chamber is 2.15 meters (7 feet) long, 1.22 meters (4 feet)
wide, and 1.92 meters (6 feet 4 inches) high. It is furnished with a
folding chair, table, and bed.
(2) Arrangements for ventilation by means of a current of air which
is drawn from out of doors and passes through the chamber. Theventilating current of air is maintained, its volume is measured, andsamples are taken for analysis by a specially devised apparatus desig-
nated as a meter pump. The temperature of the air current is measuredand so regulated as to be the same on entering the chamber as uponleaving it. The samples for analysis are taken before it enters andafter it leaves the chamber. The results of the analyses, with the vol-
ume as measured, serve as data for computing the amounts of carbon
dioxid and water given off from the body through the lungs and skin.
(3) Arrangements for passing the food and drink into the chamberand removing the solid and liquid excreta. Weighings and analyses
of these materials, including determinations of nitrogen, carbon, andhydrogen, give data for calculating the income and outgo of nitrogen;
and, taken in connection with the determinations of carbon dioxid andwater in the respiratory products, show the income and outgo of carbon
and hydrogen of the body. The analyses of the food and solid andliquid excreta include also determinations of proximate ingredients, andthus serve for determining the so-called digestibility of the food, i. e.,
the proportions of nutrients actually made available.
(4) Arrangements for measuring the heat given off from the body of
the man in the chamber, and the heat equivalent of the muscular workdone. The heat given off is carried away by a current of cold water,
which passes through a series of pipes, called absorbers, inside the
chamber. By regulating the temperature of the water as it enters, andalso its rate of flow through the pipes, it is possible to carry away the
heat just as fast as it is generated, and thus maintain a constant tem-
perature inside the chamber. The amount of outgoing water and its
increase of temperature are measured, thus determining the amount of
heat carried away.
In order that the heat taken up and carried out by the cold waterpassing through the absorbers shall represent exactly the amount givenoff from the man's body or otherwise produced in the chamber, it is
necessary to provide that there shall be no passage of heat through the

8
walls of the calorimeter, or rather that the small quantities that pass
in and out shall exactly counterbalance each other; and that the ven-
tilating current of air shall leave the chamber at the same tempera-
ture as it enters, so that it shall carry out neither more nor less heat
than it brings in. The special apparatus and methods for accomplish-
ing these two objects are described in detail in a previous bulletin.^
The excess of water vapor in the air leaving the chamber over that
in the air entering represents the water given off from the body of the
subject, and the heat required to vaporize it must be added to the heat
carried off by the current of water to obtain a true measure of the total
heat given off' by the subject.
The heats of combustion of the food and of the unoxidized compounds
of the feces and of the urine are determined by use of a bomb calorim-
eter.^ These data with those for heat given off in the chamber, allow-
ance being made for temperature of food and drink passed in and excre-
tory products passed out of the chamber, serve for computing the
income and outgo of energy of the body.
CHECK EXPERIMENTS TO TEST THE ACCURACY OF THE APPARATUSAND METHODS.
In order to test the accuracy of the apparatus as a calorimeter andthe methods for determining the income and outgo of matter, twoseries of ex[)eriments were made. For the details of the experiments
and the explanations of the methods employed reference may be madeto the detailed description referred to above.^ In the first series a
known amount of heat was generated within the chamber by means of
an electric current. In the second series alcohol was burned within
the chamber, thus producing not only a known amount of heat but at
the same time a known quantity of carbon dioxid and M^ater.
THE ELECTRICAL TESTS.
The tests were made by passing an electric current through a resist-
ance coil placed within the chamber, the voltage at each end of the corl
and the current passing through the coil being measured. These, with
the time during which the current was maintained, gave data for the
computation of the amount of total heat generated within the chamber.
The heat given off was measured in the manner already indicated bydetermining the increase in temperature of a known amount of water
jjassing througli the chamber. The agreement of these two quantities
was taken as the test of the accuracy of the apparatus as a calorimeter.
Five tests in all have been made. The results are summarized in the
following table. The total heat, as measured by the water current,
'U. 8. Dept. Agr., Office of Experiment Stations Bnl, 63.
*U. S. Dopt. Apr., Office of J"x])eriment StatioiiB Bnl. 21, and Storrs (Conn.) Sta.
Kpt«. 1894 and 18!>7.
*U. 8. Dept. Agr., Office of Experiment Stations Bui. 63.
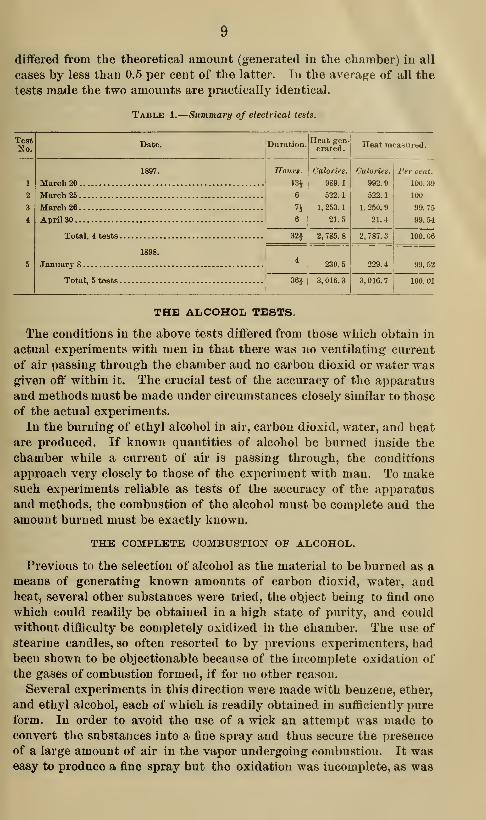
differed from the theoretical amount (generated in the chamber) in all
cases by less than 0.5 per cent of the latter. In the average of all the
tests made the two amounts are practically Identical.
Table 1.
—
Summary of electrical tests.
TestKo.
Date. Duration.
1897. Hour*.
March 20 13^
March 25'
6
March 26 7J
April 30 6
Total, 4 tests 32f
1898. I
January 8
Total, 5 tests 36f
2, 785. 8
230.5
3, 016. 3
Heat measured.
Calories.
992.9
522.1
1, 250.
9
21.4
Per cent.
100. 39
100
99.75
99.54
2, 787. 3
229.4
100. 06
3, 016. 7 100. 01
THE ALCOHOL TESTS.
The conditions in the above tests differed from those which obtain in
actual experiments with men in that there was no ventilating current
of air passing through the chamber and no carbon dioxid or water wasgiven oft" within it. The crucial test of the accuracy of the apparatus
and methods must be made under circumstances closely similar to those
of the actual experiments.
In the burning of ethyl alcohol in air, carbon dioxid, water, and heat
are produced. If known quantities of alcohol be burned inside the
chamber while a current of air is passing through, the conditions
approach very closely to those of the experiment with man. To makesuch experiments reliable as tests of the accuracy of the apparatus
and methods, the combustion of the alcohol must be complete and the
amount burned must be exactly known.
THE COMPLETE COMBUSTION OF ALCOHOL.
Previous to the selection of alcohol as the material to be burned as a
means of generating known amounts of carbon dioxid, water, andheat, several other substances were tried, the object being to find one
which could readily be obtained in a high state of purity, and could
without difficulty be completely oxidized in the chamber. The use of
stearine candles, so often resorted to by previous experimenters, hadbeen shown to be objectionable because of the incomplete oxidation of
the gases of combustion formed, if for no other reason.
Several experiments in this direction were made with benzene, ether,
and ethyl alcohol, each of which is readily obtained in sufficiently pure
form. In order to avoid the use of a wick an attempt was made to
convert the substances into a fine spray and thus secure the presence
of a large amount of air in the vapor undergoing combustion. It waseasy to produce a fine spray but the oxidation was incomplete, as was

10
shown by the sooty flames and odors. An attempt was made to secure
a wick Iree from carbon by tbe use of asbestus, but owing to the poor
capillarity of the latter a constant rate of combustion could not be
maintained. Various nioditications of tlie method by the use of asbestus
were tried, but without success. Hither the rate of combustion could
not be regulated or the oxidation was not complete.
The method of securing the com])lete combustion of ethyl alcohol,
which proved most satisfactory and was afterwards used in the alcohol
tests of the accuracy of the measurements of carbon dioxid, water,
and heat in the calorimeter, was as follows:
The essential feature of the Hame was a central draft of air. Tosecure this an ordinary small kerosene lamp with an Argand burner
and chimnej' was found very satisfactory; that is to say, the alcohol
was used in this simple lamp in exactly the same way that kerosene
would be burned. The liame of tlie burning alcohol was nonluminous,
but it still remained to show conclusively thai, there was no trace of
unoxidized material in tlie vapors Irom the burning alcohol. If the
supi)ly of oxygen is insuflicient, several i)roducts are, at least theoret-
ically, capable of being formed. Such products are carbon monoxid,
aldehyde, acetic acid, and hydrocarbons.
In or<ler to test for these corni)ounds, it is first necessary to free themfrom the carbon dioxid and water—that is, from tlie produ(;ts of com-
plete combustion of the burning alcohol. For this purpose the lamp in
which the alcohol was burning was placed under an inverted funnel,
the stem of which was sealed to a glass tube connected with a system
of tul)es and solutions lor the removal of diflereut combustion ])roducts
from the air. A strong suction from a water pump maintained a cur-
r«'nt of air througli tlie whole system, so that a large proportion,
assumed to be nearly all, of the jiroducts of combustion were drawn in
and through the apparatus along with some of the air from the room.
The current thus i)assing in at the inverted funnel was first drawnthrough bottles containing a saturated solution of caustic potash, whichsufficed for the removal of ])ractically all the carbon dioxid and water,
as well as volatile li(|uids formed from the incomplete combustion of the
alcoliol. Tests for su(;h substances were subsequently made by another
method. For the removal of the last traces of carbon dioxid, soda
lime contained in Utnbes, was (•mi)loyed. A clear solution of bariumhydroxi<l inserfe«l in the system showed that the removal of carbon
dioxid was (•oiii])lete.
(Jaseous hydroiarbons and carbon monoxid that might have been
formed by incom]>let('! oxidation of the alcohol are practically insoluble
in caustic jKitasli solution, and their ju-esencM' in the air current freed
from carbon dioxid is <'asily established by passing the air through a.
short combustion tube containing granulated cupric oxid heated to red
nesH, and finally throiigli a solution of barium liydroxid. In this wayany incompletely oxidized gas would be oxidized to carbon dioxid,
which wouhl proihn-e, a turbidity or j»recipitate in this latter solution.

11
A preliminary test was made by drawing ordinary room air through
the apparatus in order to demonstrate the absence of any hydrocarbons
or carbon monoxid. The barium hydroxid solution remained clear.
The alcolio! lamp previously described was then placed under the funnel
of the apparatus and lighted. The flame of the burning alcohol wasnonlnminous. Two hundred grams of 90 per cent alcohol was burned
at the rate of about 1 gram in two minutes. At the end of this period
of nearly seven hours there was no cloudiness in the barium hydroxid
solution, indicating that no products of incomplete combustion hadpassed the potassium hydroxid solution.
While such a test as that just described indicates that no gaseous
products of incomplete combustion are formed when alcohol is burnedin a lamp supplied with an Argand burner, provided tlie flame is non-
luminous, it is possible that a considerable amount of liquid products
might be formed, and even a trace of alcohol might be volatilized
unburned.
In order to determine whether such compounds of incomplete oxida-
tion were present, a second test was made, in which the products of
combustion resulting from the burning of 500 grams of alcohol were
passed through two flasks surrounded by a freezing mixture of salt andice to condense all volatile nongaseous products. The condensed com-
pounds, amounting to 150 cubic centimeters, were carefully tested for
alcohol and for carbonaceous matter of any kind. A very delicate andeasily applied test for small quantities of alcohol has been devised byE. W. Davy.' A few drops of the liquid supposed to contain alcohol
is added to a solution of one part molybdic acid in ten parts of strong
sulphuric acid and the whole gently warmed in a porcelain capsule.
If alcohol is ])resent, a blue coloration apjjears immediately or after a
few moments, even when the solution contains no more than 0,1 per
cent of alcohol.
Before applying this test to the condensed products of the combus-tion of alcohol the liquid was first subjected to two fractional distillations,
thereby concentrating the volatile products, if such existed, to about15 cubic centimeters. A few drops of this distillate was tested in the
manner just indicated, but the entire absence of any blue coloration in
the molybdic solution implied the absence of alcohol. The delicacy of
the test was verified by means of a very weak alcoholic solution of
known strength. Since the test is sufficiently delicate to show the
presence of even 0.1 per cent of alcohol in a solution, it is evident that
there could not have been as much as 15 milligrams of alcohol in the
condensed i)roducts of the combustion of 500 grams of alcohol. In
other words, if any were present, there must have been less than 3 parts
in 100,000.
It remained, however, to show the absence of any organic matter in
the condensed liquid. Accordingly air freed from all traces of carbon
dioxid was passed over the remaining portion of the distillate and the
'Allen, Commercial Organic Analysis, 2. ed., Vol. I, p. 59.
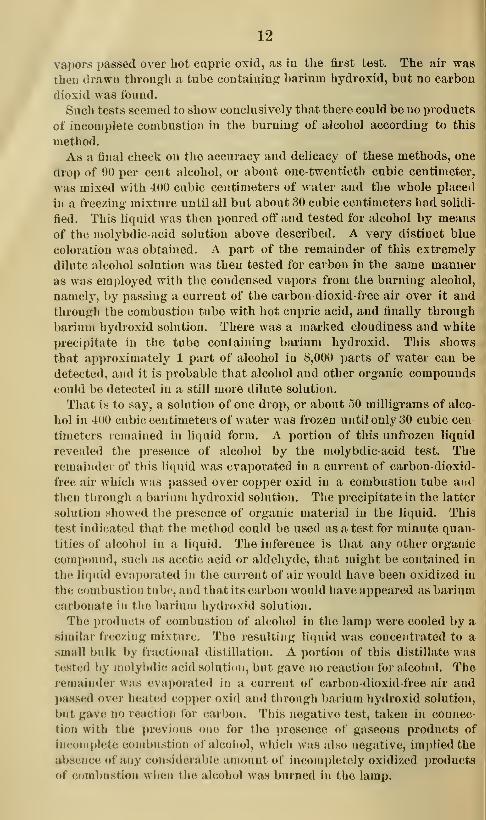
12
vapors passed over hot cupric oxid, as in the first test. The air was
then drawn through a tube containing- barium hydroxid, but no carbon
dioxid was found.
Such tests seemed to show conclusively that there could be no products
of incomplete combustion in the burning of alcohol according to this
method.
As a final check on the accuracy and delicacy of these methods, one
arop of 00 per cent alcohol, or about one-twentieth cubic centimeter,
was mixed with 400 cubic centimeters of water and the whole placed
in a freezing mixture until all but about 30 cubic centimeters had solidi-
fied. This liquid was then poured off and tested for alcohol by means
of the molybdic-acid solution above described. A very distinct blue
coloration was obtained. A part of the remainder of this extremely
dilute alcohol solution was then tested for carbon in the same manner
as was employed with the condensed vapors from the burning alcohol,
namely, by passing a current of the carbon dioxid free air over it and
through the combustion tube with hot cupric acid, and finally through
barium hydroxid solution. There was a marked cloudiness and white
precipitate in the tube containing barium hydroxid. This shows
that approximately 1 part of alcohol in 8,000 parts of water can be
detected, and it is probable that alcohol and other organic compoundscould be detected in a still more dilute solution.
That is to say, a solution of one drop, or about 50 milligrams of alco-
hol in 400 cubic centimeters of water was frozen until only 30 cubic cen-
timeters remained in liquid form. A portion of this unfrozen liquid
revealed tlie presence of alcohol by the molybdic-acid test. Theremainder of this liquid was evaporated in a current of carbon-dioxid-
free air which was passed over copper oxid in a combustion tube and
then through a barium hydroxid solution. Tlie precipitate in the latter
solution showed the presence of organic material in the liquid. This
test indicated that the method could be used as a test for minute quan-
tities of alcohol in a liquid. The inference is that any other organic
comi)ound, such as acetic acid or aldehyde, that might be contained in
the liquid evaporated in the current of air would have been oxidized in
the combustion tube, and that its carbon would have appeared as barium
carbonate in the barium liydroxid solution.
The products of combuvstion of alcohol in the lamp were cooled by a
similar freezing mixture. The resulting liquid was concentrated to a
small bulk by fractional distillation. A portion of this distillate wastested by molybdic acid solution, but gave no reaction for alcohol. Theremainder was evaporated in a current of carbon-dioxid-free air and])asse(l over lirated copper oxid and through barium hydroxid solution,
but gave no reaction for carbon. This negative test, taken in connec-
tion with the previous one for the i)resence of gaseous products of
inc()iii]>lete combustion of alcohol, which was also negative, implied the
absence of any considciabic amount of incompletely oxidized products
of combustion when the alcohol was burned in the lamp.
13
These tests appear to prove that, if the combustion of alcohol in this
form of lamp is not complete, the products of incomplete combustion are
so extremely small that they would affect the results, when alcohol is
burned in the calorimeter for the production of a known amount of
carbon dioxid, water, and heat, by less than 0.01 per cent, a value far
within the limits of experimental error.
THE RESULTS OF ALCOHOL TEST EXPERIMENTS.
In the detailed description of these experiments in the previous bul-
letin it was explained that ethyl alcohol of about 90 per cent was used.
The theoretical quantities of carbon dioxid and water which would be
produced by its combustion were computed from the known composi-
tion of ethyl alcohol and water and the amounts of these materials in
the alcohol actually used. The heat of combustion was determined by
burning specimens of the alcohol with oxygen in the bomb calorimeter
above referred to. Different determinations of the heat of combustion
made by this apparatus agreed with tolerable closeness. The aver-
age of the results was not far from that obtained by Berthelot. Wecan hardly believe that the heats of combustion as thus determined
were very far out of the way.'
In the test experiments the alcohol was burned inside the respiration
chamber by use of the lamp above described. The general method of
conducting the experiments was the same as followed in the metabolism
experiments with a man inside the chamber.
These tests were made from time to time during the progress of the
metabolism experiments described beyond. Table 2 summarizes the
final results of nine experiments thus made.
Table 2.
—
Summary of nine alcohol test experiments tvifh respiration calorimeter.
Date.
1897.
April 27-29
May 10-11
May 26-27
October 27-28
November 2-3
December 2
1898.
January 6
January 24-27
May 9
Totala
Duration.
Hrs. min.
52 31
29
33
34
35
11
Alcoholburned.
Orams.
955.4
798.8
505.4
797.7
788.2
245.3
112.2
1, 607.
8
699.7
Carbon dioxid.
Required.
Orams.
1, 657.
2
1, 385.
6
876.7
1, 384.
8
1,365.1
423.1
193.5
2, 784.
4
1, 206. 9
9, 892. 5
Found.
Orams.
1, 657. 6
1, 384.
4
887.8
1, 335.
7
1, 376.
7
417.6
193.5
2, 769. 7
1,198.9
Ratio ofamountfound toamountrequired.
9, 886.
2
Per cent.
100.0
99.9
101.3
[96. 6]
100.8
98.6
100.0
99.5
99.4
99.
a Omitting the carbon diosid and water in test No. 4 and the water in test No. 3.
' For detailed results see U. S. Dept. Agr., Office of Experiment Stations Bui. 63.

14
Table '2.—SumnMry of nine alcohol teat experiments rvith respiration calorimeter—Cont'd.
Date.
1897.
Duration,Alcoholbarned.
Hra. min. Gramn
AprU 27-29 ...
May 10-11 ....
May2e-27 ....
October 27-28
.
November 2-3.
December 2 . .
.
52

15
test. The sixth tilcohol test experiment was made in the early part of
December, 1897, but as the plans for the following metabolism experi-
ment were delayed, another test of short duration, No. 7, was carried
on immediately preceding metabolism experiment No. 9. The agreement
of theoretical quantities with those actually found was again very sat-
isfactory. In the latter part of January, 1898, the eighth alcohol test
experiment was made, following which came metabolism experiments
N"os. 10, 11, and 12, with no intervening alcohol check experiments.
Between metabolism experiments Nos. 10 and 11, however, that
portion of the heat-measuring apparatus which has to do with pre-
venting any loss or gain of heat by its passage through the metal
walls of the chamber was tested to insure its accuracy. In this test
there was no current of water flowing through the absorbers, nor wasthe ventilating air current maintained. The thermal junction circuit
between the copper and zinc walls was kept constant, i. e., at zero
deflection, by regulating the temperature of the air immediately sur-
rounding the ©uter (zinc) wall in the usual way.' The temperature of
the interior of the chamber under these circumstances remained con-
stant during the whole period, six hours, of the test. This implies that
the variations in the temperature of the air of the room outside the
calorimeter were without effect upon the temperature of the interior of
the chamber. This is equivalent to saying that no more heat passed
through the walls in one direction than in tlie other. In order that this
should be the case the mean temperature of the copper and zinc walls
must have been the same. The zero deflection corresponds to this
equality of temperature. The inference is, therefore, that the thermal
circuit was in good order. The alcohol test experiment No. 9, after
metabolism experiment No. 12, gave results closely agreeing with the
theoretical, thus showing the apparatus to be in good order. Since,
therefore, the whole apparatus was in good order before metabolismexperiment No. 10 and after metabolism experiment No. 12, and the
special test between Nos. 10 and 11 implied that the thermal junctions
were in order, it seems fair to assume that the results of exijeriments
Nos. 10, 11, and 12 are reliable so far as the condition of the apparatuswas concerned.
These individual test experiments continued from five to seventy-
eight hours each. The total time was three hundred and seventeen
hours. The rate of the burning of the alcohol ranged from 10 to 27
grams per hour, and the strength of the alcohol from 90.21 to 90.63 per
cent absolute. The determinations of water in tests Nos. 3 and 1 werenot satisfactory. In test No. 3 this discrepancy is apparently accountedfor by the fact that the air in the apparatus was much dryer at the
close of the experiment than at the beginning, and it is not impos-
sible that the excess of water found may be due to the evaporation of
•For detailed description of this part of the apparatus, see U. S. Dept. Agr.,
Office of Experiment Stations Bui. 63, pp. 19-21.
16
moistore from the surface of the absorbers during the experiment. In
the metabolism experiments the man within the chamber can weigh
the absorbers, and thus the dittereuces in amounts of water condensed
upon their surfaces can be determined, but in the alcohol test experi-
ments this is impossible. The endeavor was made to have the conditions
inside the apparatus, especially of temperature and moisture, the sameat the beginning and the end of the tests. In view of the difficulty of
making these conditions actually the same, and the considerable
amount of water that may adhere to the surface of the condensers, it
is not strange that discrepancies should at times be found in the
determination of water in the alcohol test experiments. In actual
experiments with man it has not been uncommon to find variations in
the weights of absorbers of 100 grams or more between the beginning
and the end of the six-hour experimental periods. The reason for the
discrepancy in test No. 4 is not so apparent, nor was there any appar-
ent cause for the small proportion of carbon dioxid found. The deter-
minations of heat were, however, very close to the theoretical values,
and the test is included in the table with the others. As mentioned
above, however, another test was made before the beginning of the
next metabolism experiment, in which the results were very close to
the theoretical. Omitting the determination of water in tests Nos. 3
and 4, the maximum difference between the amounts of water actually
found and the theoretical was 1.2 per cent, and the average difference
only 0.<> per cent. Omitting the determination of carbon dioxid in test
No. 4, the maximum variation was 1.3 per cent from the theoretical
amount, and the average only 0.1 per cent. In test No. 7 the propor-
tion of heat measured is larger than usual. It will be observed,
however, that this test continued only through one period of six
hours. Some time is required to get the ai)paratus into e(iuilibrium,
and the heat measurements of the first experimental period are accord-
ingly sometimes incorrect. It is, perhaps, hardly fair to include this
test with tiie others, though the period was so short and the quantities
involviMl so small that it doen not materially affect the total averages.
If it be excluded from the averages the maximum difference betweenthe theoretical and experimental amounts of heat is 0.8 per cent, andthe average variation less tlian 0.1 per cent. In either case, the average
variation is only 0.1 per cent.
HUMMARY.
The ;iccursyy of apparatus and methods for the determination of
carbon dioxid, water, and heat, which have been previously described
and which were used in tlie iiietal)oli8m experiments here reported, wastested with an electrical current by which known amounts of heat wereproduced in the chamber ol' the apparatus, and by burning alcohol in
the chamlier and tlius j»ro<lucing known amounts of carbon dioxid,
water, and heat.
I
17
The amounts of heat produced by the electric current and the
amounts actually measured by the calorimeter ajjfreed almost exactly;
the diftereuces averaged scarcely one teD-tliousandtb of tbe whole.
In the tests by the burniug of alcohol the differences between the
theoretical quantities and those actually found were likewise very
small, and averaged: For carbon dioxid one-thousandth, water six-
thousandths, and for heat one-thousandth of the whole. To state the
case in another way, the determinations of carbon, hydrogen, and heats
of combustion of alcohol by the respiration calorimeter are as accurate
as are ordinarily obtained by the usual methods of combustion with
the combustion furnace and the bomb calorimeter.
These results seem to indicate that the methods of determining the
amounts of carbon dioxid, water, and heat given off witbin tbe cham-
ber are reasonably accurate and that the respiration calorimeter maybe regarded as an instrument of precision.
EXPERIMENTS WITH MEN.
PLAN OF THE EXPERIMENTS.
The plan of the metabolism experiments may be briefly outlined as
follows
:
A man is selected who is in good health, has apparently normal
digestion, and who does not find the confinement in the chamber
uncomfortable. A diet is selected which provides materials as pala-
table and in as much variety as is consistent with convenient prepa-
ration and with accurate sampling and analysis. The quantity and
composition of the diet are generally such as to maintain the body
nearly in nitrogen and carbon e(iuilibrinm under the conditions of the
experiment, whether of work or of rest. In order that the subject
may become accustomed to this diet and reach approximate nitrogen
eqiTilibrium with it before the experiment proper begins, a preliminary
digestion experiment of four days or more immediately precedes the
metabolism experiment. Any change found desirable is made, and the
preliminary experiment is continued until nitrogen equilibrium is sup-
posed to be reached. In most cases no change has been found neces-
sary, and the preliminary experiment has continued four days. During
the period of the preliminary feeding the subject is in general engagedin his customary occupation, but he conforms his muscular activity
more or less to that ot the coming experiment. Thus, if this is to be
a "work" experiment, he rides on a bicj'cle or walks a considerable
distance each day. If it is to be a "rest" experiment, he avoids all
unnecessary exercise.
For supper on the last day (usually the fourth) of this i>reliminary
digestion experiment, about (».7 gram of lam})bla( k is taken with the
food, in order to facilitate the separation of the feci'S of the preliminary
experiment from those of the metabolism experiment proper (see p. 21).
The subject enters the chamber on the evening preceding the beginning
of the experiment, which commences at 7 a. m,
12388—i^o. 69—02 2

18
It is assumed that when the subject has essentially the same activity
from (lay to day, sleeps regularly at night, and takes his meals regn
larly. the hour just before breakfast will be the one at which the body
will be most nearly in uniform condition from day to day. That is toj
say, it is believed that at tliis hour there will be the smallest amount of
material in the aHmentary canal, and that the quantity of glycogen in
the muscles and elsewhere will be most nearly the same. Furthermore,
during the period of rest at night the evolution of heat, carbon dioxid,
and water within the chamber is very nearly constant, and the amount
of moisture adhering to the surface of the walls of the calorimeter and
to the al)sorbers is probably less than at any other time.
All the determinations begin at 7 a. m. on the day after the subjec
enters the chamber, and from this time to the close of the experiment
:
record is kept of all observations which furnish data for computing
the income and outgo of matter and energy. The experimental day
thus begins at 7 a. m. In the experiments here reported the day is:
divided into four periods of six hours each. '
INCOME OF MATTER AND ENERGY—POOD AND DRINK.
The income of oxygen furnished by the air was not measured in these
experiments, and only the income in food and drink are considered.
The drink consisted of water and of " coftee." This coffee infusion is;
counted as water, since it was found in two tests that it contained noi
appreciable amount of nitrogen or organic matter. The food materials
included lean beef freed from fat, dried beef, deviled ham, eggs, milk,
bntter, bread and other cereal products, beans, sugar, fruit, andoccasionally alcohol.
PREPARATION AND SAMPLING OF FOOD.
Considerable difficulty is experienced in preparing the food in such a
manner and in such variety as to provide both for accuracy of sam-
pling and palatability. Upon the accuracy in sampling depends the
ac<!uracy of tlie whole experiment, for unless the sample represents the
exa<tt composition of the food consumed by the subject the measure-
ments of the income ajid outgo of both matter and energy are vitiated.
In the earlier experiments, Nos. 5-8, the food was prepared fresh each
day, and the effort was made to take the samples in such a manner as
to insure as great accuracy as possible. The beef was finely chopped in
a meat ciitter, made into l)alls of eijual weight, and fried, one-half of
ea<-h ball being given to the subject and the other half reserved for
analysis. In <',iitting the bread alternate slices were taken for food andfor analysis. In experiments in which canned fruit was served a
sample can was taken for analysis, as it was found to be impracti-
cable to sample the finiit and liquor accurately. The eggs were all of as
nearly the same size and aj>l>earance as could be found, and each time

19
eggs were eaten one was taken for a sample. All the other food mate-
rials were sampled by taking aliquot j)ortions at each serving. At the
end of the experiment the separate samples of each material were
united in a composite sample, which was analyzed in the usual manner.
Experience showed tliis method of preparing and sampling the food
to be open to several objections. It was not certain that the meat taken
for analysis did not lose an appreciable amount of water while the por-
tion to be eaten was being weighed. If there were such loss the por-
tion weighed last would be the drier. Even if the weights of meat
taken for eating and for analysis from day to day are the same, it does
not necessarily follow that the composite sample for analysis will have
exactly the same composition as the meat eaten. Another uncertainty
has to do with the slight errors which occur if the sample of bread for
analysis contained more or less crust than the bread eaten. Still more
uncertaiu is the similarity of composition of two cans of fruit, even
though put up by the same firm. While it is probable that the boiled
eggs taken for analysis and those eaten were very nearly alike, weight
for weight, exact agreement in composition is neither proven nor prob-
able. Similar uncertainties as to the identity of composition of the
portions taken for analysis and those eaten might be suggested for the
other food materials.
These and similar considerations suggested by the experience in
experiments Nos. 5-8 persuaded us that an improvement in the method
of ^preparation and sampling of the food materials was desirable. To
this end a diet was selected which was intended to be (1) as simple as
possible, (2) subject to little probability of variation from day to day,
(3) easily prepared, and at the same time (4) as palatable and agree-
able to the subject as practicable. Quantities of each material suffi-
cient for the whole experiment, with allowance for analysis and for loss,
were sealed in glass jars, each containing the amount for one meal,
before the beginning of tlie experiment. The perishable materials were
sterilized. The only material not thus treated was milk. This was pur-
chased fresh each day and an aliquot sample taken and preserved with
formalin. These daily aliquots were united and the composite sample
analyzed. In this way the food for each meal was, with the exception
of the milk, put in cans and held ready to be passed into the chamberwhen wanted. This method, it is believed, avoids a large proportion
of the errors involved in the ordinary sampling of the food. Since the
different food materials were all prepared and canned at the same time
from the same lot of material, the contents of one jar or can could not
vary greatly in composition from the contents of another jar of the
same material. Several jars of each material were taken for analysis,
and it is believed that these samples represent very closely the food
eaten l)y the subject, and that the food from day to day would contain
very nearly the same quantity of each element and compound.
20
TEMPKBATUBE OF MATEBIALS INTRODUCED INTO AND REMOVEDFROM THE RESPIRATION CHAMBER.
To insure the greatest accuracy in measurements of income and outgo
of energy, the temperature of the food and drink as introduced into the
chamber, as well as that of solid and liquid excreta as removed, sliould
be known. The errors involved by introducing or removing such
materials at temperatures varying but little from that of the chamber,
which is usually about 20° C, are but slight, and would, perha])s, in the
course of an experiment nearly counterbalance each other. The follow-
ing precautions, however, were taken. The temperatures of the coffee,
milk, and water were measured by inserting a thermometer in the
liquid immediately before its introduction into the respiration chamber.
Temperatures were read to tenths of degrees centigrade. Beef canned
in glass jars was warmed in an ordinary water bath for one hour before
use, and the temperature of the air in the water bath taken immediately
before the beef was to be used. The bread, butter, cereal products, etc.,
were i)laced in a water oven at a temperature of about 20° C, the exact
temperature being noted immediately before use. In later experiments
the use of the water bath at the ordinary temperature was discarded,
the materials being placed on a shelf against the wall of the room andthe temperature of the air observed. The variations above or below
20° multiplied by the si)ecific heat of the substance gives a measure of
the heat introduced in hot materials or the heat taken up by cool
materials.
The urine and feces were usually allowed to remain in the chamberuntil they attained the temperature of the latter. In some cases where
the urine was removed shortly after it was voided its temperature wastaken and the proper correction applied.
ANALYSES OF FOOD.
The methods of analysis were mainly those adopted by the Associa-
tion of Oflficial Agricultural Chemists, but such modifications andchanges have been made as experience has shown to be necessary or
desirable.'
OUTGO OF MATTER AND ENERGY—EXCRETORY AND RESPIRA-TORY PRODUCTS AND RADIATED HEAT.
INTESTINAL EXCRETA.
Tlir outgo ot matter in the feces includes both undigested material
and metabolic i)roducts. In the experiments no attempt has been madeto distinguish between these, and the feces are taken as representing
matter and energy unavailable for use in the body.^
' Sea diHcnwioD of tliiH aiibject and description of inetboilH of samyiling and of anal-
JHIH in IJ. 8. \)i:]tt. Agr., f )fflf<i of Kxpf^rinnmt Stations JJul. 44.
• For fnrther diHCtiHHion of thi« Hubject see ytorrs (Couu.) Sta. RptB. 189G, p. 153,
and 18117, p. 163,*
21
Sampling and analysis.—Various methods for the separation of the
feces from a given diet from that of the preceding or succeeding diet
have been adopted by different experimenters. The metliod used in
these experiments consists in administering a small amount of lamp-
black or powdered charcoal in gelatin capsules with the meal immedi-
ately preceding or succeeding the diet under investigation. For exam-
ple, if it is desired to begin with a given diet at breakfast the lamp-
black will be taken with the supper on the night previous. It has
been found that the feces resulting from a meal of bread and milk pos-
sess a distinctively characteristic consistency and facilitate to a
marked degree the separation of the feces of a mixed diet. It has
therefore been our custom to have a considerable amount of bread and
milk in the meal with which the lampblack is taken. While this is
not as essential as was formerly supposed, it makes the separation
more positive and certain. At the same time considerable other food
besides bread can be added to the meal without materially altering the
consistency of the feces, provided a fairly large amount of milk be
included. Experiments have been tried with the use of subnitrate of
bismuth. This reagent is colored black in the feces, owing to the for-
mation of bismuth sulphid. While under certain conditions this
method of separation may give very excellent results, it is not consid-
ered as reliable by any means as the lampblack method.
For the collection of the feces copper cans 16 centimeters long, 11 cen-
timeters wide, and 6^ centimeters deep, of an elliptical cross section,
and provided with close fitting covers, were used. The cans were
weighed before being passed into the respiration chamber and the
increase of weight on their removal taken as the weight of the fresh
feces. The feces after weighing were placed in shallow dishes anddried in a water oven for three or four days, after which they were
analyzed according to the usual method.
Loss of nitrogen in drying.—Various experimenters have found a
greater or less loss of nitrogen in drying feces from different animals.
In the experiments here reported no attempt was made to determine
this loss of nitrogen, since preliminary experiments had indicated that,
as the drying is actually conducted in this laboratory, the loss is quite
small. A later and somewhat extended series of experiments in this
laboratory confirmed the previous results, and indicated that the total
amount of nitrogen lost in drying the feces from a four-day experiment
for twenty-four hours in air in a drying oven at about 96° C. does not
exceed half a gram.
URINE.
With the exception of the comparatively small amount of unavailable
nitrogen rejected in the feces practically all the nitrogen of the food is
eliminated in the urine in the form of urea, uric aciti, creatin and crea-
tinin, and allied nitrogenous compounds. The nitrogen in the urine is
taken as a measure of the amount of protein compounds metabolized.
22
While this is thecommon usage in metabolism experiments, it isof course
inc'OiTet't iu so far as the urine contains creatinin and allied compounds
which were in the food. The error thus introduced, however, is not
large. The carbon and hydrogen in organic combination iu the urine
represent partially oxidized compounds, and the heat of combustion of
the dried residue of the urine is a measure of the amount of energy which
is carried away from the body in these partially oxidized compounds.
Sdinplinf/ (Old totah/.sis.—The urine of six-hour periods, beginning with
the experimental day at 7 a. m., was collected in glass jars, tightly
sealed, and, after remaining in the chamber for about three hours in
order to come to the temperature of the apparatus, was jjassed out
through the food aperture. It was then weighed and its specific gravity
taken, after which an aliquot portion, usually one-half, was reserved to
make a part of a composite sample for the day, and the remainder was
used for the determination of nitrogen and other constituents. The
nitrogen was determined in the fresh urine by the Kjeldahl method.
Portions of 100 or 200 grams of the composite sample for the whole
experiment were evaporated to dryness in a partial vacuum, and deter-
minations of carbon and hydrogen were made in this dried residue.
Loss of urea in dry in f/.—Even when urine is dried in a vacuum at com-
paratively low temperature there is danger of some decomposition by
which nitrogen may be lost, in the form either of ammonia or, more prob
ably, of ammonium carbonate. The process of drying is also tedious.
For this reason in the latter experiments an attempt was made to dry
the urine at 100° C. and to determine the loss of nitrogen during this
drying.
In order to estimate the amount of this loss of nitrogen several
samjdes were dried in a flask over a water bath or calcium chlorid
bath giving a temperature of from 100 to 105*^ C. A current of air
was forced through the flask by means of a water blast. This air wasfreed from carbon dioxid by passing it over soda-lime before it reached
tiie flask. The air as it came from the flask was passed through a
known amount of a standard solntion of acid in another flask, after
which it was dried by ]>assing through suli)huri(! acid and the carbon
dioxid removed by soda lime. After the urine had been brought nearly
to dryness in the first flask, the standard acid in the second llask wastitrated and the amount of nitrogen in the ammonia wliich had been
absorbed by the acid was cahuilated. The increase in weight of the
soda lime tube and the sulplinricacid tube immediately following it
gave the amount of carbon dioxid that liad been given off from the
urine. In two exi)eriment8 the projwrtions of nitrogen and of carbon
dioxid giv(;n off conesi»ondc(l (piite nearly to the i)ro])ortions in ammo-nium carbonate, 'i'lie natnial inference was that it would be within
the limits of error to assume that all the nitrogen and carbon lost in
drying were in ammoninni <;arbonate. Of conrse this conld not be
exactly true, becaus«^ there is a certain amount of free carbon dioxid
iu the urine.
23
lu experiments Nos. 5, 6, 7, and 8 the urine was dried in a partial
vacuum at room temperature, and from the results of several special
experiments in which the amount of ammonia given off was determined
it was assumed that the loss of nitrogen in the drying was so small
that it might be left out of account. In experiment No. 9 and those
following, instead of drying the urine in a partial vacuum, as was done
in experiments Nos. 5-8, 200 grams of fresh urine was evaporated iu a
dish over a water bath. The nitrogen was determined in the fresh
urine and iu the dried residue. The difference between the calculated
weights of nitrogen iu the 200 grams of fresh urine and in the dried
residue was assumed to be due to nitrogen carried away in combina-
tion with carbon in the form of ammonium carbonate, and the corre-
sponding loss of carbon was calculated. The loss of hydrogen was so
small that it was left out of account.
Heat of combustion of urine.—The heat of combustion of the solid
constituents of urine has been determined by two methods, each of
which has given, in general, fairly satisfactory results. The most satis-
factory method is that described by Kellner.' This consists in satu-
rating a cellulose "absorption block'' of known weight and known heat
of combustion with a known amount of urine, drying in an oven at
about 60° C, and burning in the bomb calorimeter. The total heat of
combustion of absorption block and dried residue of urine, less that
of the absorption block, gives the heat of combustion of the urine.
The other method consists in drying the urine iu a partial vacuum at
ordinary room temperature, or over a water bath, as described above,
and burning the dried residue in the bomb calorimeter. As a matter
of fact, the dried residue which was prepared for determination of car-
bon and hydrogen was used for the determinations of heats of combus-
tion. In the few cases iu which this method was followed allowance
was made for the heat of combustion of the urea estimated to be lost
as ammonium carbonate.
The heats of combustion were determined in the urine of the four
days of the actual metabolism experiment in each case, but not in tliat
of the four days of the preliminary digestion experiment. The deter-
minations were made in separate samples of the urine of each day andin composite samples of that of the four days. The heats of combus-
tion were determined, both in the separate day samples and in the
composite four-day samples, by the Kellner method. For the determi-
nations in the dried residues, when made, only the composite samples
were used. The results are given in the tables, for comparison with
those obtained by the Kellner method. In the computations of energy
of outgo the results from the individual day sami3les are used.
The nitroyen lag.^—As was stated above, the urine in these experi-
ments is collected from 7 a. m. on the beginning of the experimental
day until 7 a. m. the next day in periods of six hours. One purjDOse of
' Landw. Vers. Stat., 47 (1896), p. 297.
2U. S. Dept. Agr., Office of Experiment Stations Bui. 44, pp. 3.5,36.

24
this division into periods is to obtain information, if practicable, regard-
ing the nitrogen lag, i. e., the interval of time during which the excre-
tion of nitrogen l;»gs behind the nielabolisni in the body. We have
found comparatively few data for determining the exact duiation of
this lag. It is not known, for instance, at what time the nitrogen of
the food eaten for bi eakfast begins to appear in the urine, nor when the
nitrogen of the food eaten for supper of any given day is all metabolized
and excreted. Still less do we know how long a period intervenes
between the metabolism of nitrogen of tissue and its excretion. It is
believed by some experimenters that, under ordinary conditions, the
actual nitrogen consumed in the food is soon excreted. In previous
experiments' of this series a lag of six hours is assumed in one case
and twelve hours in another. One advantage in making the diet uni-
form for the four days pre(;eding the metabolism experiments, as has
been done in the cases here reported, is that during this time the sub-
ject will reach approximate nitrogen equilibrium and that for the pur-
pose of the experiment the "nitrogen day," i. e., the twenty-four hours
during which the nitrogen is excreted may be taken as coincident with
the exjjerimental day, thus allowing for no lag. This i)robably gives
results as nearly coriect as would be obtained by any such arbitrary
assumption. The data are, however, given in the tables by which the
calculations can be revised to allow for a nitrogen lag of six, twelve, or,
in some cases, tweuty-ftmr hours' duration. For this i)urpose the nitro-
gen in the urine is determined for periods of from six to twenty- four
hours after the end of each experiment.
PERSPIRATION PRODUCTS—ELIMINATION OF NITROGEN.
The amount of matter eliminated in the i)erspiration is not large.
During several of the rest experiments it was found that the nitrogen
thus eliminated amounted to less than 25 milligrams per day. In work
experiments, on the other hand, as much as 0.2 gram of nitrogen waseliminated by the skin in a day.
The nitrogen of perspirsition was determined as follows: The subject
took an ordinary bath and afterward rinsed his body with distilled
water before entering the chamber. His underclothing, which was of
medium weight, was carelully rinsed witii distilled water after the usual
washing. He had a clean suit of underclothes every night to replace
the suit worn during the day. The latter suit was washed with dis-
tilled water, which was then evaporated nearly to dryness and the
nitrogen in the residue was determined by the Kjeldahl method. Thenitrogen of the products of persjuration was thus determined in rest
experiments Nos. 5 and 7, and in all the work experiments.
RESPIRATION PRODUCTS- OARIJON AND HYDROGEN.
In all the experiments the only res))iratory ])ioducts determined were
carbon dioxid and water. I'Vom these the carbon and hydrogen were
'U. 8. Dept. Agr., OOice of Experiment Stations Bui. 44, pp. 49, 52, 61.
25
calculated. The amounts of intestinal gases, as methane, and of other
volatile organic products given off from the body of the subject, were
believed to be very small aud are here left out of account.' We hope,
however, to find means later for determining these substances, and also
for determining the amount of oxygen used from the air current.
The method of measuring, sampling, and analyzing the air of the ven-
tilating current was described in detail iu a previous bulletin.^ In brief,
the volume is now measured by a meter pumj) of special construction,
which serves the threefold purpose of maintaining the current, measur-
ing and recording the volume automatically, and delivering aliquot
samples of one-hundredths of the whole amount for analysis. In the
experiments here recorded, however, samples drawn by aspirators were
used for analysis. The aspirators, also described in the bulletin just
referred to, are arranged to take samples of both the incoming and out-
going air. The samples are drawn continuously during the six hour
periods. Each sample represents not far from one oue-hundred-and-
sixtieth of the total current.
These analyses of both incoming and outgoing air were made in
duplicate, save that in the earlier experiments, Nos. 5, (», and 7, the
analyses of the incoming air were not duplicated. The justitication for
omitting the duplicates is found in the fact that the carbon dioxid varies
but little from day to day, and still less from six-hour period to six-hour
period, and that the water is frozen out of the incoming air current
before the sample is taken, so that the amount remaining in this curreut
as actually analyzed is extremely small and quite constant. On this
supposition, the analyses of the air of the four six-hour periods serve
in a sense the purpose of duplication. In the later experiments, how-
ever, duplicate samples of the incoming as well as the outgoing air were
taken by the aspirators and analyzed. In still later experiments not
yet described, samples of the outgoing air were taken by aid of the
meter pumps and analyzed, so that the analysis of the outgoing air was
made iu quadruplicate.
The samples of incoming and outgoing air were taken by the aspira-
tors from the current immediately before and immediately after it left
the chamber of the calorimeter. The water in both the incoming and
outgoing air was mostly removed by coolers before the samples were
taken. This cooling was accomplished by passing the air through a
"freezer" consisting of copper pipes immersed in cold brine, so that the
temperature was reduced to not far from —20° C. The freezers in which
the outgoing air current was cooled were specially adapted for weighing.
In this way the larger portion of the water of respiration and perspira-
tion was condensed, and its amount directly determined. After passing
'See Billings, Mitchell, and Bergey, on the Composition of Expired Air and its
Eftects upon Animal Life, Washington, Smithsonian Institution, 1895; aud Bergey,
Methods for the Determination of Organic Matter in Air, Washington, Smithsonian
Institution, 1896.
^U. S. Dept. Agr., Office of Experiment Stations Bui. 63.
26
tbe freezer the air was sampled, and the carbon dioxid and the remain-
ing- water were determined. Thi' determination of water was made bypassing the sampk^ through a U-tiibe containing pumice stone saturated
with sulphuric acid. The carbon dioxid was removed by soda lime
contained in other U-tubes. The exact arrangement of tubes and
details of calculations have been referred to in the previous bulletins
above cited.
THE DETERMINATION OF ALCOHOL ELIMINATED THROUGH THEKIDNEYS, LUNGS, AND SKIN.
Since a portion of the alcohol ingested may be excreted through the
kidiu^ys, lungs, and skin it is essential, in experiments on tbe metab-
olism of matter and energy in which alcohol makes part of the diet,
to determine the amount of alcohol which thus escapes oxidation.' It
becomes necessary, therefore, to examine the urine, outgoing air cur-
rent, freezer water, and drip water for the presence of alcohol. In the
last two we should expect to find so much of the alcohol eliminated
from the lungs and skin as was condensed with tbe water either on the
absorbers or in tbe freezers. The remainder of the alcohol from the
lungs and skin would be in the air current.^ The urine and the drip
and freezer waters were subjected to fractional distillation to separate
the alcohol, which was finally determined by oxidation with chromic
acid by the method described by Bodliinder.' An aliquot sample of
the main air current was drawn through bulbs containing concentrated
sulphuric acid where all tbe alcohol vapor was absorbed.^ The alcohol
thus retained was determined, as before, by oxidation with chromic
acid. Tbe amount of alcohol thus estimated to be given oti" from tbe
body nnoxidized was in each case very small. Tbe figures for tbe
amounts thus determined in experiment No. 7 are given in Table 41.
Similar deterniinations in experiment No. 10, as made by tbe modified
method described beyond, are shown in Table 83. Tbe highest amount,
somewhat over 4 per cent of the amount ingested, was observed on a
single day in experiment No. 7.
We have found, however, that these figures are not correct. Themethod used for the determination of the alcohol in experiment No. 7
involves at least two errors, both of which make the amount as deter-
mined too lari^c. One error occurs in the determination of alcohol bytbe chromate method. Tbe other is due to the presence of reducing
material, other than alcohol, in tbe air. This latter error also applies
to tbe dcterniiiiations in exi)criment No. 10. l>oth of these sources of
•It is Ikmt. assiiinod tliiit the feces would contain no considerable amount of the
ah'ohol ing<'8t«Ml, though they ini^lit contain an appreciable amount of alcohol as aproduct of fcrmciitation. Sec Bodliinder in Arch. I'hysiol. [lMliif;crJ, 32, (1883), p. 424.
^It is hcrcaHHUiucd tiiat no conBidcral)lc amount of alcohol would bo absorbed andretained by tin; clothing.
'Arch. I'hyhiol. [I'liiiger], 32, (1883), p. 398.
<Kee Benedict and Norris on "The Determination of Small QuantitieH of Alcohol,"
Jour. Amer. Cbeni. Soc., 20 (1898), p. 299.
27
error have been made the subject of especial investijratioTi in this
laboratory.
An account of the investigations upon the chromate method has
already been published.' From this it appears that in the methoddescribed by Bodljiuder the end reaction is not sharp and, in our
experience, the results obtained are too large. In view of the necessity
of as accurate measurements as possible of small quantities of alcohol,
a modification of this method was devised and has been described.'
This consists essentially in collecting the alcohol in concentrated sul-
phuric acid, oxidizing it with potassium bichromate in excess, reducing
the remainder of the chromic acid by a slight excess of a solution of
ferrous ammonium sulphate and determining the excess of ferrous iron
by titration with potassium permanganate solution. The accuracy of
this modified method was tested by a considerable number of exper-
iments in which known and very small amounts of alcohol were added
to water, to urine, and to a current of air. The results obtained in all
these tests were reasonably accurate. In no instance did the error
exceed a small percentage of even the very small amount of alcohol
used. The details are given in the article referred to.
The quantities of reducing matter in the air were studied by experi-
ments of several kinds. A current of ordinary air drawn through a
solution of potassium bichromate in sulphuric acid showed more or less
reduction even after passing through tubes packed with cotton. Theuse of a moistened air filter, as suggested by Remsen,^ is in these
experiments objectionable, because it is desirable to use the same air
current for both moisture and alcohol determinations. In several
experiments in whicli the man had no alcohol the quantity' of reducing
material in the air was determined by the modified method for the
determination of alcohol just mentioned; that is to say, the sample
of the outgoing air current was drawn through sulphuric acid and the
reducing matter determined—as in the case of the alcohol experiments
—
by the use of chromic acid, ferrous ammonium sulphate, and potassium
permanganate solutions. In every case the reduction was consider-
able, though there were vSlight variations in the amounts on diiferent
days and in different experiments. The amount of reduction in these
experiments without alcohol was such as to correspond to from 0.96
gram to 1.20 grams of alcohol in the air from the chamber during a
period of twenty-four hours. The amount of reduction found in the
experiments in which alcohol formed a part of the diet ranged from0.71 gram to 1.05 grams in twenty-four hours. In other words, the
amount of reducing material in these particular experiments appears
to be very nearly the same without as with alcohol in the diet. Thenatural inference would be that what was called alcohol in the outgoing
current of air consisted of other reducing substances. We should,
however, be unwilling to make any such positive assertion without
'See Benedict and Norris on "The Determination of Small Quantities of Alcohol,"
Jour. Amer. Cbera. See, 20 (1898), p. 293,
•^Natl. Bd. Health Bui., Washington, 1 (1879-80), p. 233; 2 (1880-81), p. 517.
28
further experiment. Meanwhile we may add that confirmation of the
at least approximate correctness of this method of determining the dif-
ferences in the quantity of reducing matter in the air current and
detecting the addition of small quantities of alcohol to the air in the
chamber were found in some incidental observations connected with
the experiments. In one case, as stated elsewhere, a small amount of
coffee containing alcohol was accidentally spilled upon the copper floor
of the chamber. As the amount was known, approximately, a corre-
sponding quantity was given to the subject to make up the regular
daily raiion. The alcohol thus spilled naturally evaporated and was
carried out in the air current. The amount of alcohol found for this
day in the outgoing air current exceeded the usual amount by very
nearly the amount spilled. In an experiment made since those here
described alcohol in the form of whisky was taken with sugar and
water. The mixing was generally done outside the chamber, but in
one case the materials were passed into the chamber separately and
there mixed. In the mixing the whisky was poured into a cup and the
sugar and water were added later. Opportunity was thus given for an
evaporation of a small amount of the alcohol of the whisky. Larger
amounts of alcohol were found in the air current than in the other
days when the mixing was done outside.
These observations seem to warrant the following inferences: (1) Themodified method, as above described, gives a very nearly accurate meas-
ure of the small amounts of alcohol and other reducing material in the
air current, in the urine, and in the drip water and freezer water; (2)
in the determination of alcohol in the air current an allowance should
be made for other reducing materials. It seems to us not improbable
that allowances should also be made for the small amounts of reduc-
ing materia] other than alcohol in the urine and the freezer and drip
waters. The need of further investigation of the subject is evident,
and such investigation is now being made. Meanwhile it seems proper
to state the amounts as actually found without making corrections.
(.'J) Under the circumstances of these experiments, in which approxi-
mately 72 grams of alcohol was administered daily in six doses, the
<|uantity of alcohol eliminated could not have been more than li gramspel' day, or about 2 jxt cent of the whole. If an allowance for reduc-
ing maJerial other than al<;ohol in the air current was based upon the
determinations thus far made, there would be practically no alcohol
remaining wliich could have been excreted Mirough the lungs and skin,
and the total amount which (;ould have been eliminated daily in the
urine and otherwise would be inconsiderable.
The details of the determinations of alcohol and other reducing
matters are not rejmrted in this bulletin.
It is theoretically j)ossible tliat products of the partial oxidation of
alcohol, such as aldehyde and acetic acid, may have been eliminated bythe kidneys, lungs, or skin in these experiments, but we are not aware
29
of auy evidence which would lead us to expect svn-h elimination to anyconsiderable extent. Efforts were made to find evidence of aldehyde
and acetic acid in the urine, drip and freezer waters, and outgoing air
currents, but not even traces were detected. The tests, however, were
not sufficiently delicate to warrant the affirmation that no traces of
these substances were present and the time at our disposal did not
suffice for devising tests which would be conclusive.
MEASUREMENT OF HEAT RADIATED FROM THE BODY.
The details of the method of measuring the heat given oft" by the
subject were described in the bulletin referred to above. These meas-
urements were made from the time the subject entered the chamber on
the evening preceding the commencement until the close of the experi-
ment, at 7 a. m. on the fourth day following. The measurements for
the experiment proper began at 7 am.
DESCRIPTION OF EXPERIMENTS WITH MEN.
In planning a metabolism experiment for the study of a given ques-
tion, as stated above, the diet should be arranged to fulflll three condi-
tions: (1) It should be palatable and of such variety that the subject
will not tire of it during the experiment: (2) it should furnish the
amounts of nitrogen (protein) and energy desired for the ])urposeof the
experiment; and (3) the food materials should be in such forms as to
admit of accurate sampling.
In the description of each exjjeriment the menu or ration for each
day is shown. A daily programme is made out which serves as a
guide both for the subject and for those conducting the experiment. It
shows the hours at which the subject is expected to rise and retire, the
hours at which he shall receive his meals, and when he shall weighhimself and the system of absorbers inside the apparatus. This pro-
gramme follows the menu in the description of each experiment.
During each experiment the subject keeps a diarj'-, or record, showingthe results of all determinations of weights and temperatures made byhimself in the chamber of the calorimeter. A summary of this diary
follows the programme in the description of each experiment.
The subject of experiments ISIos. 5 to 10 here described was Mr. E.
Osterberg, who was also the subject of experiments Nos. 1 and 2, andof a number of later experiments. He was 31 years of age, 5 feet 8
inches (1.87 meters) in height, and weighed about 150 pounds (68 kilo-
grams). He was in excellent health and accustomed, as laboratory
janitor and chemical assistant, to moderate muscular labor.
COMPOSITION OF FOOD MATERIALS, ETC., OF EXPERIMENTSNOS. 5-10.
The composition of all the food materials used in the experimentsdescribed in this bulletin is given in Table 3, page 30. The methods of
analysis were referred to on page 20. Attention is called to the fact
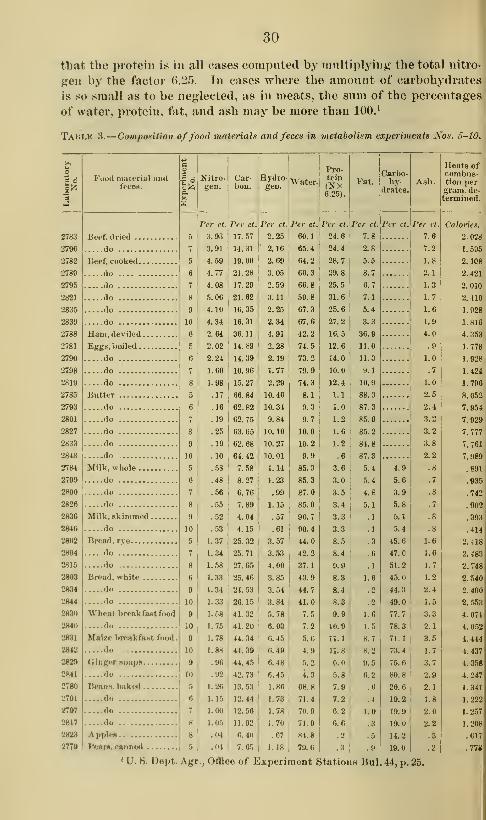
30
that the protein is iu all cases computed by multiplying the total nitro-
gen by the factor 6.25. In cases where the amount of carbohydrates
is so small as to be neglected, as in meats, the sum of the percentages
of water, protein, fat, and ash may be more than 100.'
Tai'.le 3.
—
Composition offood maieriala and feces in meiaboHsm experiments Xos. o-lO.
2 .So
2783
2796
2782
2789
2795
2821
2835
2839
2788
2781
2790
2798
2819
2785
2793
2801
2827
2833
2843
2784
2799
2800
2826
2836
2846
2802
2804
2815
2803
2834
2844
2830
2840
2831
2842
2829
2841
2780
2791
2797
2817
2823
2779
Fuud material andfeces.
Beef, dried .
.
do
Beef, cooked.
do
do
do
do
do
I 6 1 Nitre- Car- Hydro-^^^
a'A^ gen. bon. ; gen.
Per ct.\Per ct
Ham, deviled 6
Eggs, boiled\
5
do 6
do 7
doI
8
Butter!
5
do
do
do
do
do
Milk, whole
do
do
do
MUk, Bkimmed
do
Bread, rye
do
do
Bread, white
do
do
Wheat break fant food
do
Maize breakfant food.
do .
6
7
8
9
10
5
8
6
9
10
9
10I
9 '
10;
Ginger nnaps 1
do 10
BeanH. baked 5
do 6
do 7
do 8
Apples I 8
Pears, canned 5
3.93
3.91
4.59
4.77
4.08
5.06
4.10
4.34
2.64
2.02
2.24
1.60
1.98
.17
.16
.19
.25
.19
.10
..53
.48
.56
.55
.52
.53
1.37
1.34
1.58
1.33
1.34
1.33
1.58
1.75
1.78
1.88
.96
.02
1.26
1.15
1.00
1.05
.04
.04
17.57
14.31
19.00
21.28
17.29
21.62
16.35
16.31
36.11
14.89
14.39
10.96
15.27
66.84
62.82
62.75
63.65
62.68
64.42
7.58
8.27
6.76
7.89
4.04
4.15
25.32
25.71
27.65
25.46
24.53
26.15
41.32
41.20
44.34
44.39
44.45
42.73
13.53
12.44
12.66
11.92
6.40
7.65
Per ct. Per ct.
2.25i
60.1
Pro-tein(NX6.25).
Fat.Carbo-hy.
drates.
2.16
2.69
3.05
2.59
3.11
2.25
2.34
4.91
2.28
2.19
1.77
2.29
10.46
10.34
9.84
10.10
10.27
10.01
1.14
1.23
.99
1.15
.57
.61
3.57
3.53
4.00
3.85
3.54
3.84
5.78
6.03
6.45
6.49
6.48
6.45
1.86
1.73
1.78
1.70
.07
1.18
65.4
64.2
60.3
66.8
59.8
67.3
67.6
42.2
74.5
73.2
79.9
74.3
8.1
9.3
9.7
10.0
10.2
9.9
85.3
85.3
87.0
85.0
90.7
90.4
44.0
42.2
37.1
43.9
44.7
41.0
7.5
7.2
5.6
4.9
5.2
4.3
68.8
71.4
70.9
71.9
84.8
79. t!
Per ct
24.6
24.4
28.7
29.8
25.5
31.6
25.6
27.2
16.5
12.6
14.0
10.0
12.4
1.1
1.0
1.2
1.6
1.2
.6
3.6
3.0
3.5
3.4
3.3
3.3
8.5
8.4
9.9
8.3
8.4
8.3
9.9
10.9
11.1
11.8
6.0
5.8j
7.9I
7.2I
6.2j
6.0I
.2
.3,
Per ct.
7.8
2.8
5.5
8.7
0.7
7.1
5.4
3.3
36.9
11.0
11.3
9.1
10.9
88.3
87.3
85.9
85.2
84.8
87.3
5.4
5.4
4.8
5.1
.1
.1
.3
.6
.1
1.6
.2
.2
1.6
1.5
8.7
8.2
9.5
6.2
.6
.4
1.0
.3
Per ct.
4.9
5.6
3.9
5.8
5.1
5.4
45.6
47.0
51.2
45.0
44.3
49.0
77.7
78.3
71.1
73.4
75.6
80.8
20.6
19.2
19.9
19.0
14.2
19.0
Ash.
Per ct.
7.6
7.2
1.8
2.1
1.3
1.7
1.6
1.9
4.0
.9
1.0
' U. B. Dept. Agr., Office of Experiment StatiouH Bui. 44, p. 25.
31
Table 3.
—
Composition offood materials aridfeces in metahoUsm experiments Nos. 5-10-
Continued.
>>uo"S 6
rTO

32
the theoretical values for income and those actually found for outgo of
energy. The daily menu in this experiment was as follows:
Table 4.
—
Daily menu—Metabolism experiment Xo. 5.
MeDu. Grams.
BREAKFAST.
Boiled eggs ' 95
ButterI
15
Milk 250
Rye bread 100
Sugar 15
Coffee 290
UINNKK.I
Beef, friedj
120
Butter 10
Milkj
25
Kye bread 100
Menu.
DiNNEB—continued
Baked beans
Canned pears
Sugar
Coffee
SUPPER.
Dried beef
Butter
Milk
Bye bread
Sugar
Coffee
Grams.
125
150
10
300
25
10
500
125
10
30C
The beef was cooked in the form of "Hamburg steak;" i.e., finely
choi)i)ed in a meat cutter and Iried. A little onion was added to makethe meat palatable to the subject. The eggs were "hard boiled" andwere eaten with salt and pepper. The quantity of pepper was too
small to take into account in computing the income of organic matter.
The dried beef was eaten cold without preparation other than cutting
in thin slices. Ordinary creamery butter was used; it was kept in a
refrigerator, together with the baked beans, the canned pears, and the
milk. The milk was procured fresh each day, as was the bread, whichwas obtained from a local bakery. Three hundred grams of warm coffee
infusion was served with each meal; it was prepared in the usual way.
The following is the daily i)rogramme for this experiment, although,
owing to lack of experience, it was not followed as closely as in the
later experiments:
Table .5.
—
Daily programme—Metabolism experiment No. 6.
7.0(1 a. m ..

33
The diiiry of the subject was begun the second day. It is summa-rized in Table G.
Table 6.
—
Sitmmari/ of diary—Metabolism experiment i\'o. 5.
May 00 a.m.
45 a.m.
00 a.m.
00 m . .
.
00 p.m.
00 p.m.
00 p. m
.
50 p.m.
00 a. m
.
00 a.m.
10 a.m.
30 a.m.
30 a.m.
30 p.m.
00 p.m.
30 p. m.
45 p.m.
10 p.m.
30 p.m.
20 p.m.
30 p. m.
00 a.m.
,10 a. m.
.40 a.m.
,00 a.m.
.00 m...
,00 p.m.
,00 p.m.
OOj). m.
,10p.m.
,00 p. m.
.00 p.m.
.00 a.m.
10 a. m
.
20 a.m.
Time.
1807.
"Weight ofsubjectwith
clothes.
Kilograms.
69.31
69.64
68.82
Pulserate perminute.
54
73
Tempera-ture.
°F.
97.4
97.8
98.8
99.0
99.6
99.6
99.2
96.2
98.0
98.9
99.6
99.2
99.0
99.0
98.8
96.6
98.6
98.8
96.8
Hygrometer.
Drybulb.
°C.
20.5
20.3
20.7
20.8
21.0
21.4
20.9
20.7
21.0
20.6
20.3
20.7
20.
21.0
21.0
20.8
20.9
21.1
20.8
21.2
20.7
21.0
21.2
22.2
21.2
20.8
21.0
"Wetbulb.
°0.
16.9
15.9
16.4
16.6
16.7
16.9
17.9
17.2
16.9
16.5
16.0
16.8
17.2
16.9
16.8
16.0
16.4
16.2
16.1
16.2
16.1
16.0
16.6
19.6
18.0
17.0
16.4
The subject weighed himself on a platform scale sensitive to 10 gramswith a weight of 75 kilograms and capable of weighing 100 kilograms.
In this experiment the weight of the subject without clothes was not
taken. Inasmuch, however, as it was a rest experiment and the sub-
ject did not perspire greatly and the clothes were the same at the dif-
ferent weighings, the figures are probably not far out of the way as
indications of the changes of body weight. The body temperature
was taken by the subject with a registered clinical thermometer.
12388—:^o. 09—02 3
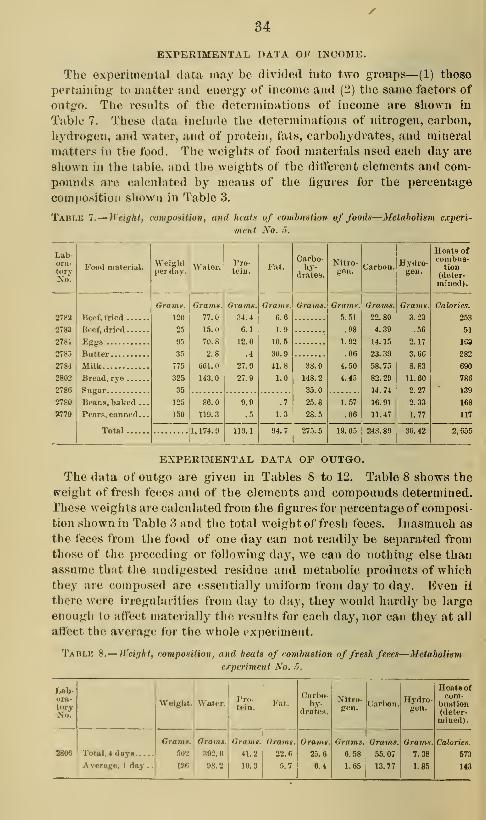
34
EXPERIMENTAL DATA OF INCOME.
The experimental data may be divided into two groups—(1) those
pertaining to matter and energy of income and (2) the same factors of
outgo. The resnlts of the determinations of income are shown in
Tabk' 7. These data inchide the determinations of nitrogen, carbon,
hydrogen, and water, and of protein, fats, carbohydrates, and mineral
matters in the food. The weights of food materials used each day are
shown in the table, and the weights of the difterent elements and com-
pounds are calculated by means of the figures for the percentage
composition shown in Table 3.
Table 7.— Weight, composition, and heats of combnation of foods—Metabolism experi-
ment No. 5.
Lab-ora-torvNo.
Food niat-erial.
2782 Beef, fried
2783 Beef, dried
.
2781 Eggs
2785 Butter
2784 Milk
2802 Bread, rye ....
2786 Sugar
2780 Beans, baked .
8779 Pears, canned
.
Total ....
^eight'^per day.
Orams.
120
25
95
35
775
325
35
125
150
Orams.
I
77.0
15.0
70.8
I
2.8
}
661.0
\143.0
Pro-tein.
Grams.
34.4
6.1
12.0
.4
27.9
27.9
86.0
119.3
11, 174. 9 119.
1
Fat.
Grams.
6.6
1.9
10.5
30.9
41.8
1.0
.7
1.3
Carbo-
Grams.
38.0
148.2
35.0
25.8
28.5
275.5
Nitro-gen.
Carbon.
Orams. Grams.
5.51
.98
1.92
.06
4.50
4.45
1.57
.06
19.05
22.80
4.39
14.15
23.39
58.75
82.29
14.74
16.91
11.47
Hydro-gen.
Grams.
3.23
.56
2.17
3.66
8.83
11.60
2.27
2.33
1.77
248.89 36.42
Heats ofcombus-
tion(deter-mined).
Calories.
253
51
169
282
690
786
139
168
117
2,655
EXPERIMENTAL DATA OF OUTGO.
The data of outgo are given in Tables 8 to 12. Table 8 shows the
Freight of fresh fe(-es and of the elements and compounds determined.
These weights are calculated from the figures for percentage of composi-
tion shown in Table 3 and the total weight of fresh feces. Inasmuch as
the feces from the food of one day can not readily be separated from
those of the preceding or following day, we can do nothing else than
assnme that the undigested residue and metabolic products of which
they are composed are essentially uniform from day to day. Even 11
there were irregularities from day to day, they would hardly be large
enough to atlect materially the results for each day, nor can they at all
affect the average for the whole experiment.
Tablb 8.— JVeif/ht, composition, and heats of combustion offresh feces—Metabolism
experiment No. 5.
Lab-ora-toryNo.
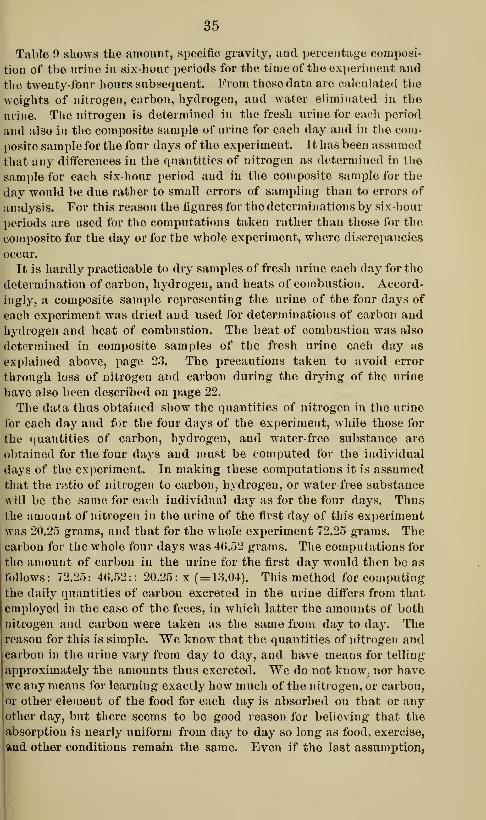
35
Table 9 shows the amount, specific gravity, and percentage composi-
tion of the urine in six-hour periods for the time of the experiment and
the twenty-four hours subsequent. From these data are calculate<l the
weights of nitrogen, carbon, hydrogen, and water eliminated in the
urine. The nitrogen is determined in the fresh urine for each period
and also in the composite sample of nrine for each day and in the com-
posite sample for the four days of the experiment. It has been assumed
that any differences in the quantities of nitrogen as determined in the
sample for each six-hour period and iu the composite sample for the
day would be due rather to small errors of sampling than to errors of
analysis. For this reason the figures for the determinations by six-hour
l)eriods are used for the comi^utations taken rather than those for the
coujposite for the day or for the whole experiment, where discrepancies
occur.
It is hardly practicable to dry samples of fresh urine each day for the
determination of carbon, hydrogen, and heats of combustion. Accord-
ingly, a composite sample representing the urine of the four days of
each experiment was dried and used for determinations of carbon and
hydrogen and heat of combustion. The heat of combustion was also
determined in composite samples of the fresh urine each day as
explained above, page 23. The precautions taken to avoid error
through loss of nitrogen and carbon during the drying of the urine
have also been described on page 22.
The data thus obtained show the quantities of nitrogen in the urine
for each day and for the four days of the experiment, while those for
the quantities of carbon, hydrogen, and water-free substance are
obtained for the four days and must be computed for the individual
days of the experiment. In making these computations it is assumedthat the ratio of nitrogen to carbon, hydrogen, or water free substance
will be the same for each individnal day as for the four days. Thusthe amount of nitrogen in the urine of the first day of this experiment
was 20.25 grams, and that for the whole experiment 72.25 grams. Thecarbon for the whole four days was 46.52 grams. The computations for
tlie amount of carbon in the urine for the first day would then be as
follows: 72.25: 46.52:: 20.25: x (=13.04). This method for computing
the daily quantities of carbon excreted in the urine differs from that
employed in the case of the feces, in which latter the amounts of both
nitrogen and carbon were taken as the same from day to day. Thereason for this is simple. We know that the quantities of nitrogen andcarbon in the urine vary from day to day, and have means for telling
approximately the amounts thus excreted. We do not know, nor havewe any means for learning exactly how much of the nitrogen, or carbon,
or other element of the food for each day is absorbed on that or any[other day, but there seems to be good reason for believing that the
jabsorption is nearly uniform from day to day so long as food, exercise,
and other conditions remain the same. Even if the last assumption,
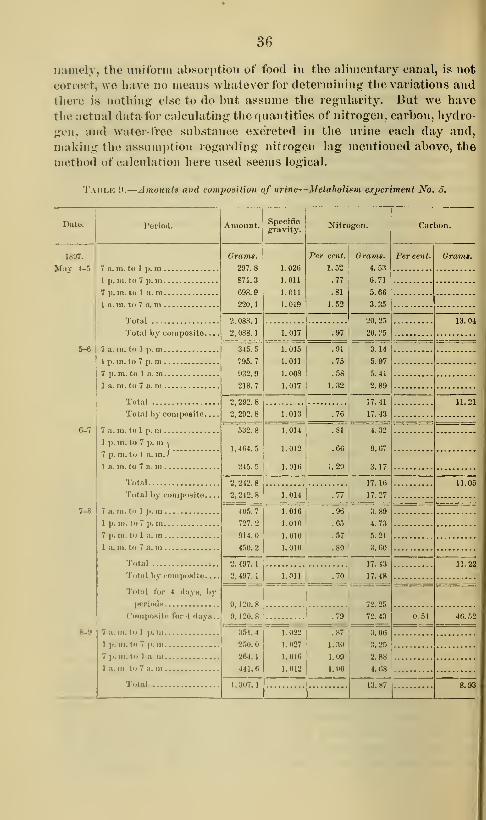
36
namely, the uniforin absori)tion of food in the alimentary canal, is not
correct, we ba\'e no means whatever for determining^ the variations and
tliere is notliing else to do but assume the regularity. But we have
the actual data for calculating the quantities of nitrogen, carbon, hydro-
gen, and water-free substance excreted in the urine each day and, ]
niMkiiii,^ the nssnmption regarding nitrogen lag mentioned above, the
method of calculation here used seems logical.
Tablk il.
—
Amounts and vomposilion of urine—Metabolism experiment No. 5. ,
Date. I'erio.l.

37
Table 9.
—
Amounts and composition of urine—Metabolism experiment No. 5—Cont'd.
Dale.

38
which, multiplied by the total number of liters of air in the ventilating
current gives the total weight of carbon dioxid exhaled, as shown in
column (\ Column /' shows the weight of carbon in the carbon dioxid
exhaled. In Table 11 are similar data for the water given off by the
subject. The plan of this table differs from that of Table 10 in that the
major part of the water is condensed in the freezers. The amount not
so condensed is determined the same way as the total amount of carbon
dioxid exhaled and is .shown in column d, while column /gives the total
amount of water exhaled.
Table 10.
—
Jiecord uf carbon dioxid in ventilating air current—MetahoUsm experiment
No. 5.

39
Table 11.
—
Record of water in ventilatimj air current—Metabolism experiment No, 5.
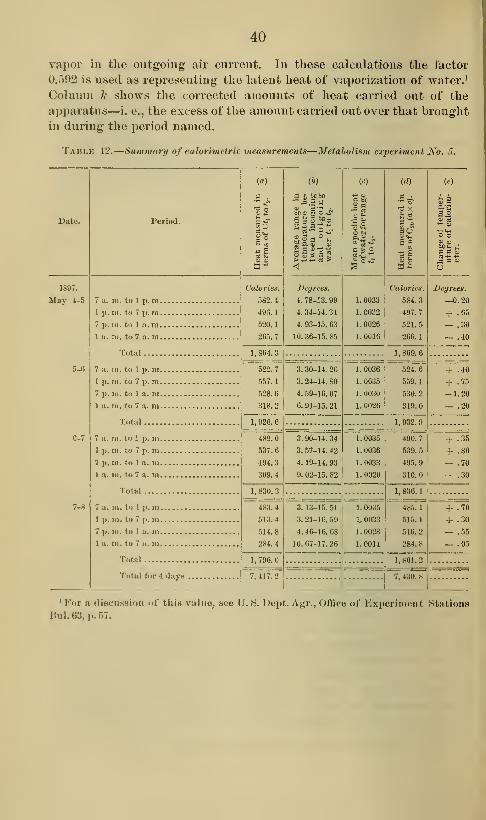
40
vapor in the outgoing air current. In these calculations the factor
0.592 is used as representing the latent heat of vaporization of water.'
Column A' shows the corrected amounts of heat carried out of the
apparatus—i. e., the excess of the amount carried out over that brought
in during the period named.
Taiu.e 12.
—
Sunniiarif of calorimetric measurements—Metaholism experiment No. 5.
Date.
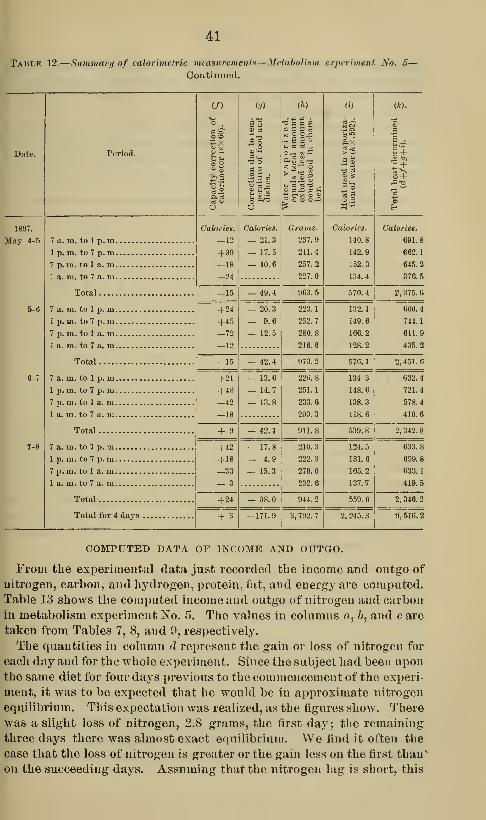
41
Table 12.
—
Summarn of calorimefric measurements—MetahoJism e.rperiment No. 5-
Coutiuucd.
Date.
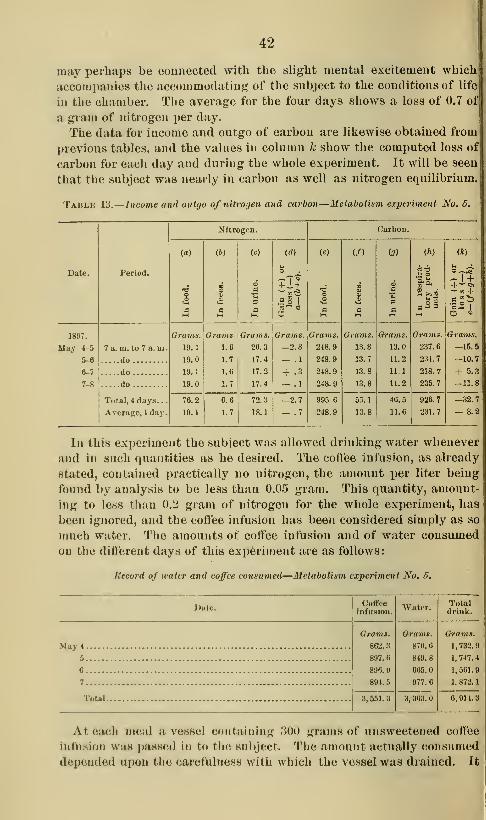
42
may perhaps be connected with the slight mental excitement which
accompanies the accommodating of the snbject to the conditions of life
in the chamber. The average for the four days shows a loss of 0.7 ol
a gram of nitrogen per day.
The data for income and outgo of carbon are likewise obtained from
previous tables, and the values in column k show the computed loss ol
carbon for each day and during the whole experiment. It will be seen
that the subject was nearly in carbon as well as nitrogen equilibrium.
Tablk 13.
—
Income and outgo of nitrogen and carbon—Metabolism experiment No. 5.
^
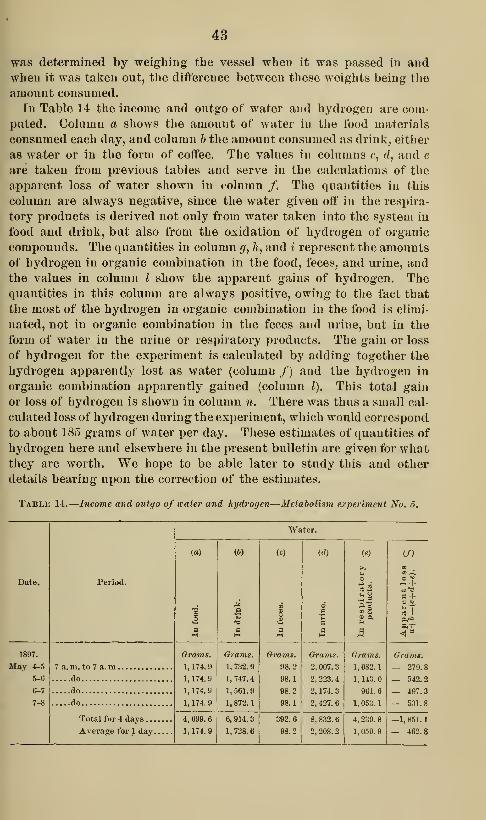
43
was determined by weighing the vessel when it was passed in andwhen it was taken out, the diflerence between these weights being tlie
amount consumed.
In Table 14 the income and outgo of water and hydrogen are com-
puted. Column a shows the amount of water in the food materials
consumed each day, and column h the amount consumed as drink, either
as water or in the form of coffee. The values in columns e, d, and e
are taken from previous tables and serve in the calculations of the
apparent loss of water shown in column f. Tlie quantities in this
column are always negative, since the water given oft' in the respira-
tory products is derived not only from water taken into the system in
food and drink, but also from the oxidation of hydrogen of organic
compounds. The quantities in column g, Ji, and i represent the amountsof hydrogen in organic combination in the food, feces, and urine, andthe values in column / show the apparent gains of hydrogen. Thequantities in this column are always positive, owing to the fact that
tlie most of the hydrogen in organic combination in the food is elimi-
nated, not in organic combination in tlie feces and urine, but in the
form of water in the urine or respiratory products. The gain or loss
of hydrogen for the experiment is calculated by adding together the
hydrogen apparently lost as water (column /) and the hydrogen in
organic combination apparently gained (column I). This total gain
or loss of hydrogen is shown in column 7i. There was thus a small cal-
culated loss of hydrogen during the experiment, which would correspond
to about 185 grams of water per day. These estimates of quantities of
hydrogen here and elsewhere in the present bulletin are given for whatthey are worth. We hope to be able later to study this and other
details bearing upon the correction of the estimates.
Table 14.
—
Income and outgo of water and hydrogen—Metabolism experiment No. 5.

44
Tablk 14.
—
Tncomr and ouii/o of uaiir (i)nl Inidrofien— Meiahort»m e.rperiment No. /i-
Contiuued.
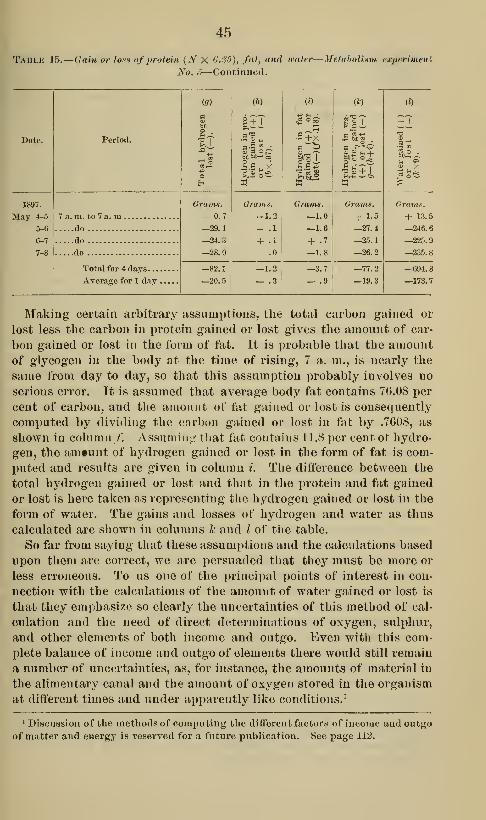
45
Table 15. -(lain or Josh of protein, (N X ().35), fot, and water-
No. 5—Continued.
-Metabolism experiment
Date.
1897.
May 4-5
5-6
6-7
7-8
Period.
7 a. m. to 7 a. mdo
do
do
Total for 4 days
Average for 1 day .
to)
Orams.
— 0.7
—29.1
—24.3
—28.0
—82.1
—20.5
s+Tft——
<u aj op
w
Grams.
—1.2
- .1
+ -l
.0
—1.2
— .3
(i)
+j (J .
9+x
III
n
Orams.
—1.0
—1.6
+ .7
—1.8
-3.7
(k)
Grams.
+ 1.5
—27.4
—25.1
—26.2
—77.2
—19.3
(I)
+T
GraWiS.
-I- 13.5
—246. 6
—225. 9
—235.
8
—694. 8
—173. 7
Making certain arbitrary assumptions, the total carbon gained or
lost less tlie carbon in protein gained or lost gives the amount of car-
bon gained or lost in the form of fat. It is probable that the amountof glycogen in the body at the time of rising, 7 a. in., is nearly the
same from day to day, so that this assumption probably involves no
serious error. It is assumed that average body fat contains 76.08 per
cent of carbon, and the amount of fat gained or lost is consequently
computed by dividing the carbon gained or lost in fat by .7608, as
shown in column /". Assuming' tliat fat contains 11.8 ])er cent ot hydro-
gen, the amount of hydrogen gained or lost in the form of fat is com-
puted and results are given in column i. The difference between the
total hydrogen gained or lost and that in the protein and fat gained
or lost is here taken as representing the hydrogen gained or lost in the
form of water. The gains and losses of hydrogen and water as thus
calculated are shown in columns h and I of the table.
So far from saying that these assumptions and the calculations based
upon them are correct, we are jjersuaded that they must be more or
less erroneous. To us one of the principal points of interest in con-
nection with the calculations of the amount of water gained or lost is
that they emphasize so clearly the uncertainties of this method of cal-
culation and the need of direct determinations of oxygen, sulphur,
and other elements of both income and outgo. Even witli this com-
plete balance of income and outgo of elements there would still remain
a number of uncertainties, as, for instance, the amounts of material in
the alimentary canal and the amount of oxygen stored in the organism
at different times and under apparently like conditions.'
1 Discussion of the methods of computing the different factors of income and outgo
of matter and energy is reserved for a future publication. See page 112.
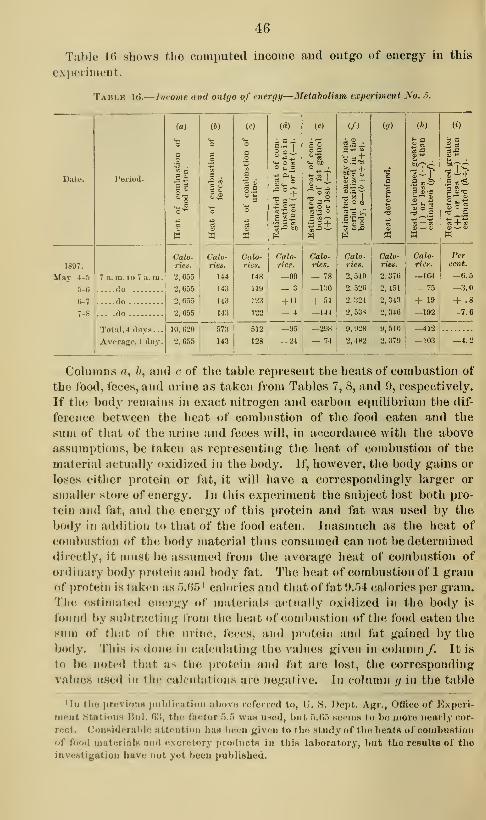
46
Table 16 shows the computed income and outgo of energy in this
experiment.
Table Hi.
—
Income and outgo of energy—Metaholism experiment No. 5.
47
the heat actually determined—i. e., the amount measured (see Table
12)—is given for comparison. Taking the estimated energy of material
actually oxidized in the body as 100, the amount of heat given off from
the body and measured is 95.8; that is to say, in this experiment there
is a discrepancy of 4.2 per cent between the theoretical energy of income
and the measured energy of outgo.
A discrepancy of this size makes the experiments unsatisfactory.
It is to be considered, however, that this is the first experiment madewith the apparatus after it had reached a stage of development which
seemed to warrant its use as a calorimeter. The experiments are com-
plicated and the possibilities of error numerous. It is not unusual, in
the development of apparatus and methods even for the simpler quan-
titative determinations in the laboratory, that the first results are
inaccurate. The sources of error have to be discovered and the proper
methods of manipulation learned by experience before accurate and
reliable results are obtained. It is not strange that with an apparatus
and methods as coniplicated as these, and with the sources of physi-
ological error and uncertainty sujieradded to those of chemical andl)hysical manipulation, the results of the earlier experiments should be
more or less erroneous. This particular subject will be referred to later.
It will be seen that, as the sources of error revealed by experience have
been at least partially eliminated in the later experiments, the agree-
ment of estimated income and measured outgo of energy is reasonably
close.
DETAILS OF METABOLISM EXPERIMENT NO. 6.
In this experiment the subject was engaged in active muscular work.
This was accomplished by a stationary bicycle connected with a small
dynamo. The energy of the external muscular work done was assumedto be entirely transformed into heat within the chamber. The larger
part was first transformed into electrical energy by the dynamo which
was belted to the wheel of the bicycle, and was then transformed into
heat by an electric lamp through which the current passed. A small
portion was transformed into heat by the friction of the bicycle dy-
namo. The latter thus served as an ergometer. The heat thus pro-
duced was measured with that given off from the body. The exercise
was continued for about eight hours per day, and the heat equivalent
of the external muscular work was estimated to be not far from 250
calories per day. The measurements of electrical friction and external
muscular work were not as accurate as desirable, so a special ergometer
is now being constructed for this purpose. A cyclometer was attached
to the bicycle in such a way as to show the number of miles that wouldhave been traveled with the same number of revolutions of the pedals
in ordinary riding.
The results of this experiment are summarized and some of the details

48
are j^iven in tlio inecediiiy bulletin of this series,' to wliieh reference
may be made lor details not repeated here.
Tln^ subject entered the apparatus on the evening of May 17, 1897,
and the experinient began at 7 a. m. the following day. The menu and
routine of the exjjeriment were as follows:
Taiji.k 17.
—
Daily menu—Mciuholiam vxperiment No. 6.
Menu.
BREAKFAST
Deviled hiiui
Boiled eggs
Butter
Milk
White bread
Sugar
Co£fee
DINNER.
Beef, fried
Butter
Milk
White bread
Grams. Menu.
20
55
20
200
150
15
205
100
30
50
125
DINNER—continued
liaked beans
Canned pears
Sugar
Coffee
SUPPER.
Deviled hamButter ,
Milk
White bread
Sugar
Coffbe
Table 18.
—
Daily proyravime—Metaboliam experiment No. 6.
Grama.
125
300
20
200
30
25
600
175
15
295
7.01) a. m ..
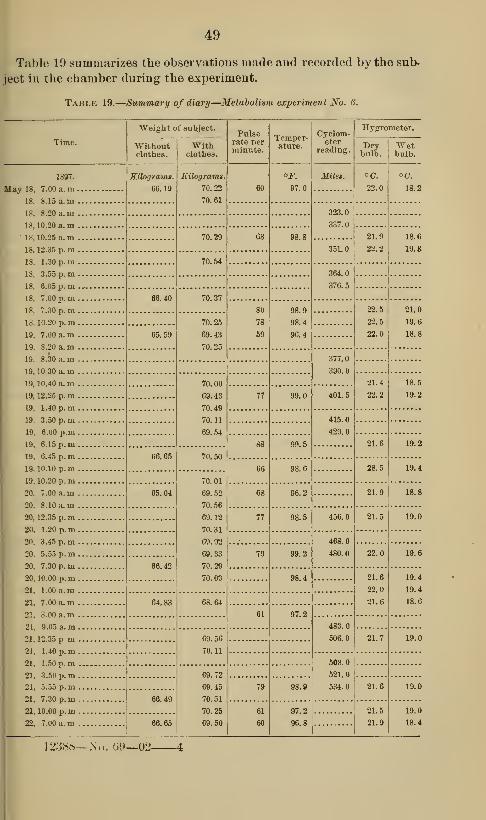
49
Table 10 summarizes the observations made and recorded by the sub-
ject in the chamber during the experiment.
Table 19.
—
Summary of diary—Metaboliavi experiment No. 6.
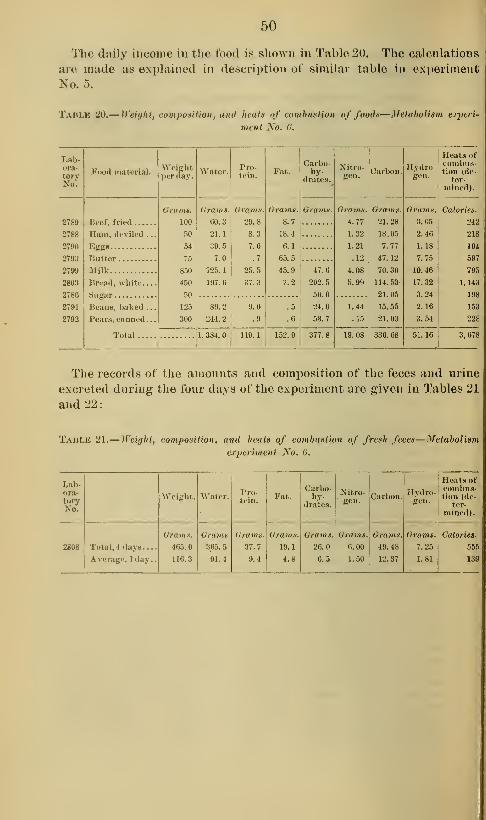
50
The daily income in the food is shown in Table 20. The calculations
are made as explained in <lescription of similar table in experiment
No. 5.
Tablr 20.
—
Weight, composition, and heats of combu8tio7t of foods—Metabolism expei-i-
vient No. 6.
Lab-ora-
toryNo.

51
Table 22.
—
Amounts and com)iosition of urine—Metabolism experiment No. 6.
Date.
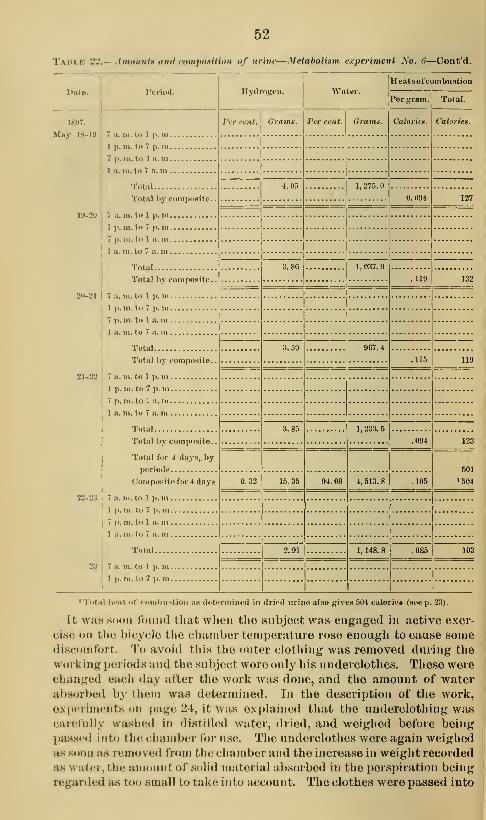
52
Tahi.k 2-2
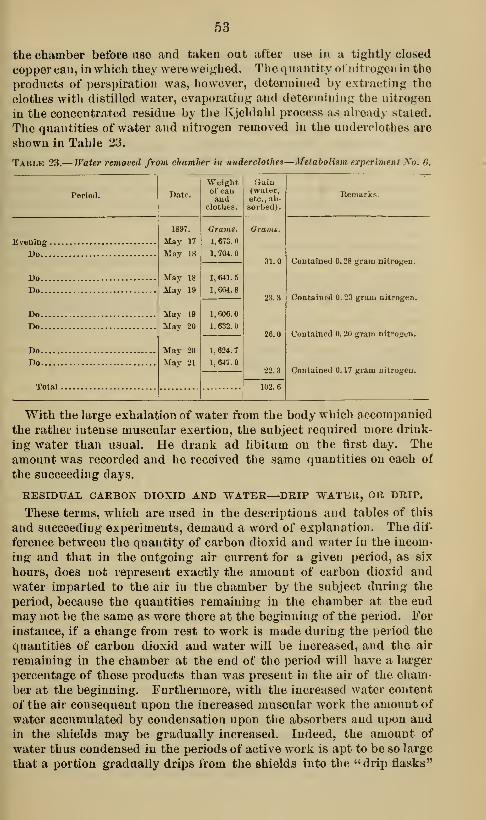
53
the chamber before use and taken out after nse in a tightly closed
copper can, in which they were weighed. The quantity ot'uitrogen in the
products of perspiration was, however, determined by extracting the
clothes with distilled water, evaporating and determining the nitrogen
in the concentrated residue by the Kjeldahl process as already stated.
The quantities of water and nitrogen removed in the underclothes are
shown in Table 23.
Tahle 23.— Water revioved from chamber in underclothes—Metaholism experiment No. 6.
Period.
54
suspended at tlie ends of the shields. This last is called drip water, or
drip. On the other hand, with a change from work to rest the carbon
dioxid and water jjiven oft" by the snbject will be diminished, and the
weijihts of these in the air of the cliamber and the weight of water con-
densed npon the surfaces of the absorbers and shields will be less at
the end than at the beginning.
It is therefore necessary to determine the gain or loss of carbon
dioxid and water in the air of the chamber and of water on the surfaces
of the absorbers and shields during each experimental period in order
to learn exactly how much of each is given oif by the subject during
the period. To this end special samples of the air are drawn from the
chamber at the beginning and the end of each period, and the quanti-
ties of carbon dioxid and water are determined. If the drip water has
accumulated in the flasks it is either passed out of the chamber and
weighed or, if the quantity is small, its volume is measured inside the
chamber. The system of absorbers and shields is weighed at the
beginning, middle, and end of each of the day periods; that is, at 7 a.
m., 1 p. m., and 7 p. m. The samples of residual air are drawn by a
small aspirator and passed over sulphuric acid and soda lime as in the
determination of these materials in the ventilating air current. Themethods employed for taking the samples, determining the carbon
dioxid and water, and applying the corrections are described in the
l^ublication already referred to."
QUANTITIES OF WATER ADHERING TO THE COPPER WALLS OF THECHAMBER.
The quantities of water which are condensed upon the inner surface
of the copper walls of the calorimeter vary with the amounts in the air
of the chamber and the temjierature of the latter. A series of special
experiments made for the purpose of testing this question has per-
suaded us that tiie quantities thus adhering to smooth sheet copper are
small and that differences under the conditions of the metabolism
experiment are so slight that they would not materially aftect the
results. The experiments for determining the (piantities of water con-
densed on the surface of copper were made as follows: A rectangular
sheet of copper ])resenting apja-oximately 2 square meters of surface
was rolled into tiie form of a spii al and suspended in a wooden box by a
wire which passed through a small hole in the toj) of the box and was
attached to the arm of a balance sensitive to centigrams. By appro-
priate devices the ten)perature and water content of the air in the box
were caused to vary tli rough ranges similar to those which obtain in
the chamber of the <tah)rimeter in different experiments. The sheet of
copper was allow(*d tx> remain for a consiilerable time, from twelve to
twenty four hours, in the atmospheie of the box, in order that the water
condensed np(»n its surface might accommodate itself to the condition
of moistunr and t<'mj)crature. The dinereiices in weight were assumed
to represent ditlerenees in the amounts of water condensed upon the
8orfa<;e. The extreme differences found in these experiments amounted
> U. S. Dept. Agr., OUice of Expuhnient StatioDS Bui. 63, pp. 37, 65.

65
to less than 3 centigrams per square meter of surface. This wouldcorrespond to 0.54 gram for the whole 18 square meters of the inner
surface of the chamber.
It seems to us extremely improbable that such variations in the
amounts of water condensed ujjon the whole interior surface of the
respiration chamber and air pipes between the points where samples
were taken for analysis would be sufficient to aifect materially the
results of the experiments. It may, however, become necessary to
take these variations into account in future efforts to secure more accu-
rate determinations of water and hydrogen, but at present we consider
the errors here involved as less than the unavoidable errors in the
determinations of water and hydrogen in the food and excretory
products.
The results of the measurements of the residual carbon dioxid andwater are summarized in the following table:
Table 24.
—
Comparison of residual amounts of carbon dioxid and water in the chamber
at the heginnimj and end of each period, and the corresponding gain or loss—Metabo-
lism experiment INo. 6.

5(;
The records of carbon dioxid and water vapor iu the ventilating air
currtMit have been given in detail in the account of this experiment in
the i)revious publication already referred to.* The results in daily
periods are summarized in Table 25. These have been corrected for the
amounts of residual carbon dioxid and water, drip, etc., and show the
total amount of carbon dioxid and water exhaled by the subject during
each day of the exi)eriment. For the details by six-hour periods refer-
ence may be made to Tables 25 and 27, pages 79 and 81 of Bulletin
No. 03.
Tahi.io 25.
—
Summari/ of varhon dioxid and neater in ventilatlnf/ air current—Metabolism
experiment No. 6.
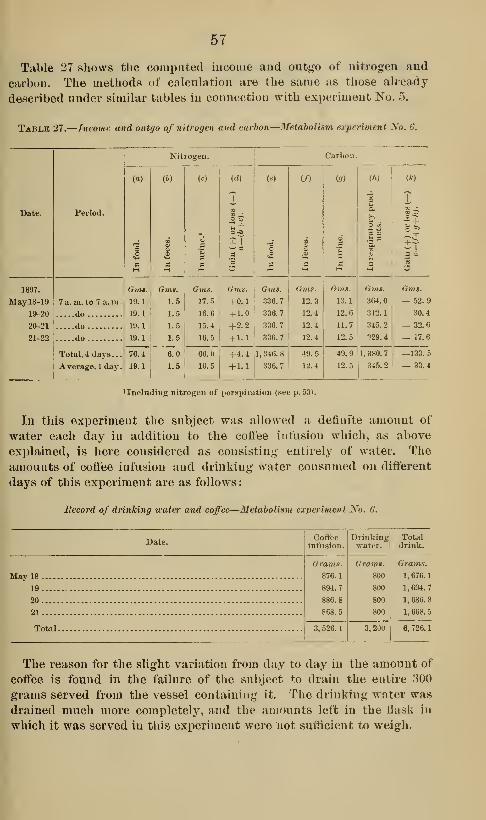
57
Table 27 vshows the coinpated income and outgo of nitrogen and
carbon. The methods of calculation are the same as those akeady
described under similar tables in connection with experiment No. 5.
Table 27.
—
Income and outgo of nitrogen and carbon—Metabolism experiment Xo. 6.
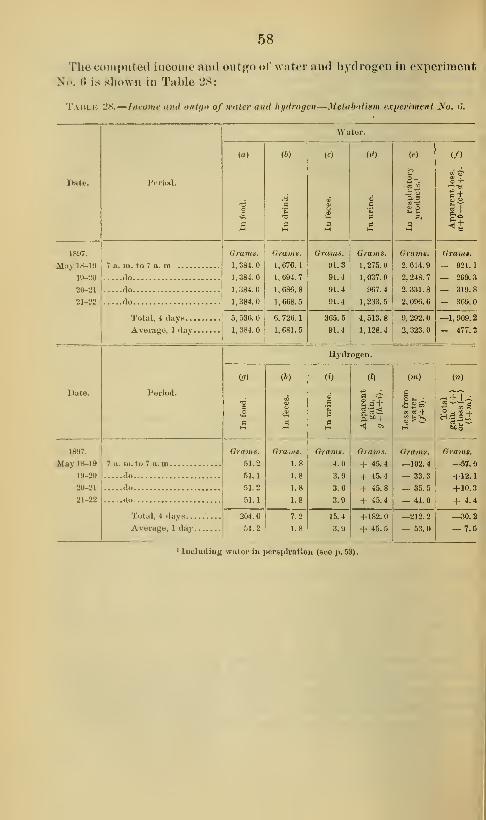
58
The com])uteil iucoine aud outgo of water and hydrogen in experiment
N<>. (> is shown in Table 28:
Tahlk I'S.
—
Income uinl ontijo of water and hiidroi/eii—MelabitHnm experhnent No. <h
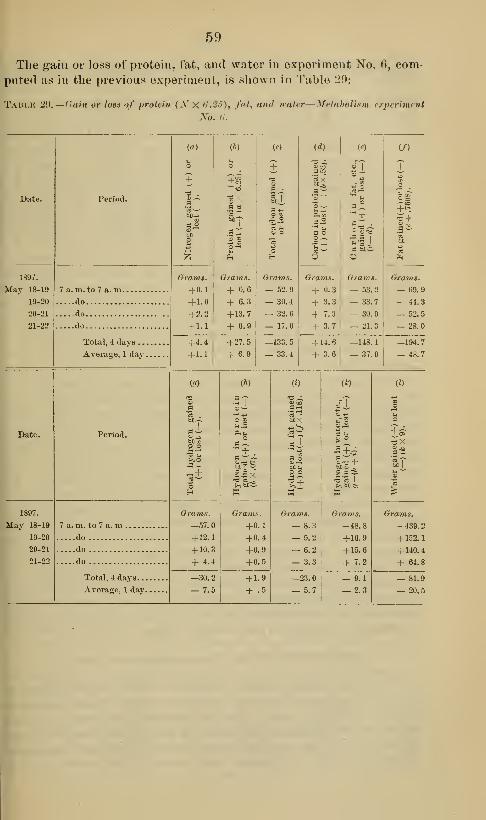
59
The gain or loss of protein, fat, ami water in experiment 'Ro. 6, com-
pntert as in the previous experiment, is shown in Table 20:
Taiu.e 2W.— (lain or loss of protein (.V X 6.25), fat, and water—Metabolism experiment
No. C.
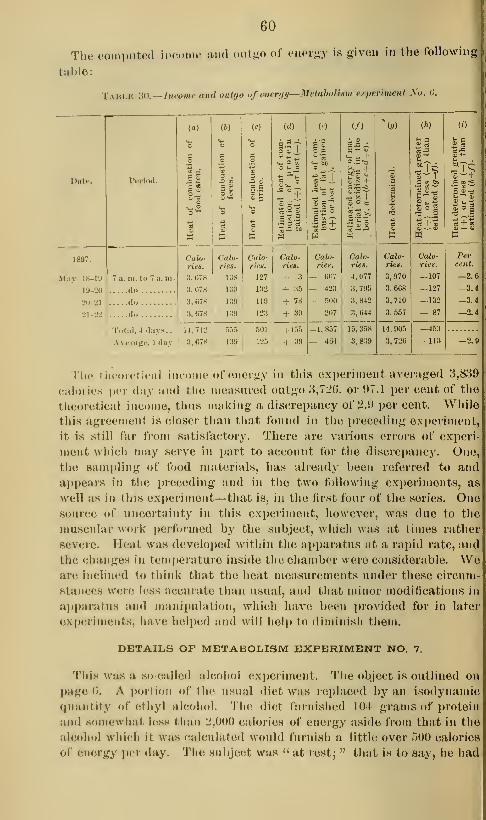
60
The computed iiMoinc and (uitiio of energy is given in the following
table:
Tablk 'SO.—Jnvome and outgo of eneriiu—MciaboHxm ejjjeriment Xo. il

61
as little nuiscular exercise as was consistent with convenience and
comfort. The total amount of protein and energy in the diet was such
as had beea found suflBcient to maintain the body nearly in nitrogen
and carbon equilibrium. Opportunity was thus given to test the com-
pleteness of the oxidation of the alcohol in the body, the agreement of
the amount of kinetic energy produced by such oxidation with the
potential energy of the same amount of alcohol as measured by its
heat of combustion in the bomb calorimeter, and also the action of the
EJcohol in protecting protein and fat from oxidation. The usual pre-
liminary period of four days was spent outside the chamber with the
same diet as in the experiment i)roper.
The subject entered the chamber on the evening of June 7, 1897.
The experiment proper began at 7 a. m. the following morning. Thesubject spent the time not required for the routine observations called
for by the daily programme in reading, writing, and sleeping. The'
alcohol was administered in the form of high-grade commercial spirits
containing 90.6 per cent of ethyl hydroxid, as it was thought desirable
in this case to test the effect of ethyl alcohol as such rather than in the
form of whisky, brandy, or other ordinary alcoholic beverage. Theamount was such as to furnish 72.5 grams of ethyl hydroxid per day.
To this amount of alcohol and 45 grams of sugar were added an
amount of coffee infasion sufdcient to make 1,000 grams per day. Thealcohol was thus administered in six doses, three larger ones with the
meals and three smaller between meals. The proportions at the
different times were: With breakfast, 150 cubic centimeters (11,5 gramsalcohol); at 10.30 a. m., 100 cubic centimeters (7.G grams alcohol); for
dinner, 250 cubic centimeters (19.1 grams alcohol); at 3.30 p. m.,
100 cubic centimeters (7.6 grams alcohol); at supper, 250 cubic
centimeters (19.1 grams alcohol); before retiring, the remainder (not
far from 100 cubic centimeters, containing 7.6 grams alcohol). Thequantities of alcohol were not large as compared with those which
moderate drinkers are accustomed to consume. The total amount,
72.5 grams, or 2J ounces, is about as much as would be contained in a
bottle of ordinary Ehine wine or claret with 10 per cent absolute alco-
hol and a little less than would be furnished in three ordinary glasses of
whisky each containing 2 ounces of 45 per cent alcohol.^ The reason
for taking the alcohol in these small doses was to avoid appreciable
eftect upon the nerves, as the purpose was to get light upon the action
of alcohol under normal bodily conditions. As will be seen from Table
33, the pulse and body temperature did not differ materially from those
of other experiments and the subject was not conscious of any mental
or physical disturbance or other special effect of the alcohol except
possibly a slight sense of dullness at times. The subject was a Swede,
and had come to this country after reaching maturity. He had been
accustomed from boyhood to occasional use of malt and distilled
' See computations in The Century Magazine, May, 1888, pp. 138, 139.
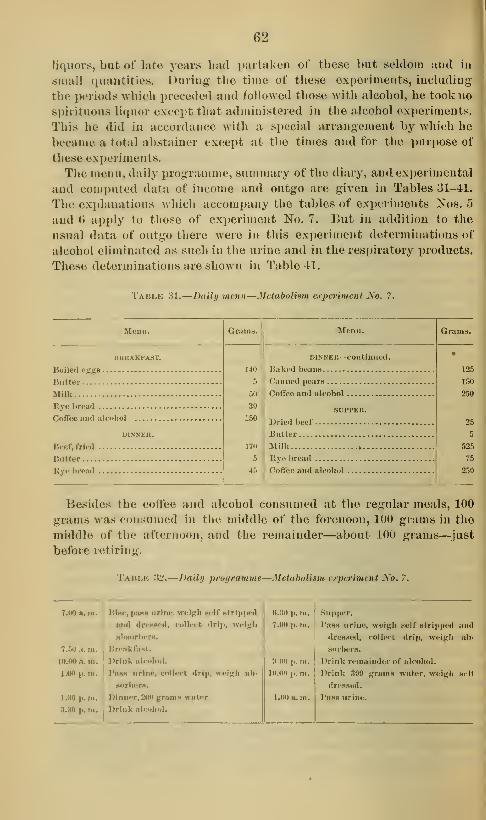
62
liquors, but of late years had i)artaken of these but seldom iiiul in
small quantities. Duriug the time of these exi)eriraents, including-
the periods which preceded and followed those with alcohol, he took no
spirituous liquor except that administered in the alcohol experiments.
This he did in accordan(;e with a special arrangement by which he
became a total abstainer except at the times and for the purpose of
these experiments.
The menn, daily programme, summary of the diary, and experimental
and computed data of income and outgo are given in Tables 31-41.
The explanations Avhich accompany the tables of experiments Nos. 5
and () apply to those of experiment No. 7. lUit in addition to the
usual data of outgo there were in this exi>eriiiient determinations of
alcohol eliminated as such in the urine and in the respiratory products.
These determinations are shown in Table 41.
'J'aiu.k 81.
—
Daily menu—MelaboUum experiment No. 7.
Menu.
BHEAKFAST.
BoUed egg8
Butter
Milk
Bye bread
Coffee and .alcohol
DIN.NEU.
Beef, fried
Butter
Kyo bread
Grams. Menu.
50
30
150
170
5
45
DINNER—continued
.
IJaked beans
Canned pears
Coffee and alcohol
SUPPEK.
Dried beef
Butter
Milk w.
Ryo bread
Coffee and alcohol
Grams.
125
150
250
25
5
525
75
250
Besides the coffee and alcohol consumed at the regular meals, 100
grams was consumed in the middle of the forenoon, 100 grams in the
middle of the afternoon, and the remainder—about 100 grams—^^just
before retiring.
Taiu.k '.V2.—Dailif programme—Metabolism experiment No. 7.
7.00 a.m.
l.l*) -A. lU.
10.00 a. ni.
1.00 ji. III.
1.30 p. ui.
3.30 p. in.
Rise, paitit urine, weigh self Htrip])ed
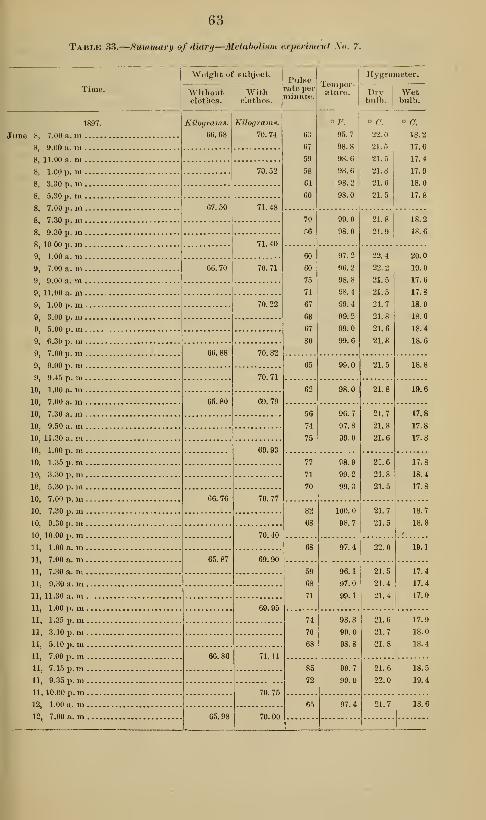
63
Table 33.
—
Summary of diary—Metabolism experiment No. 7.
Time.
8,

64
T.\HLK :^4.- JVei'ihl, ronijiosilion, and heats of combiiation of foods—Metabolism ciperi-
mint 2s 0. 7.
Labo-ni-
ton-No.
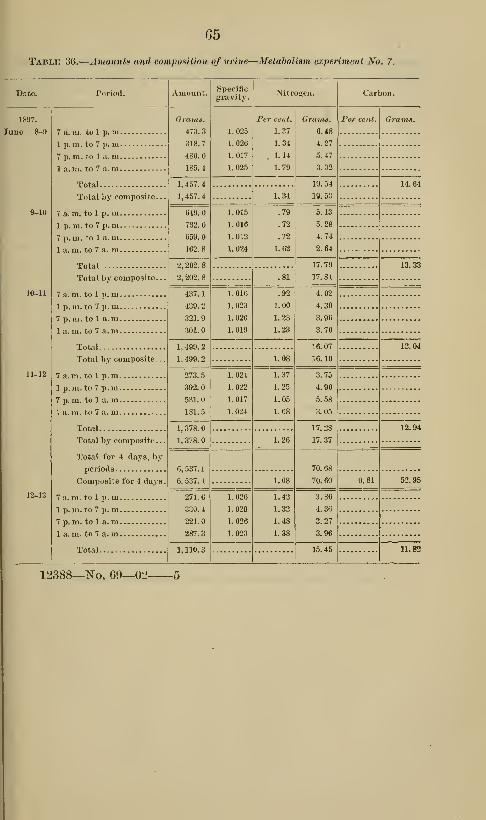
65
Table 36.
—
Amounts and composition of urine—Metabolism experiment No. 7.
Date.
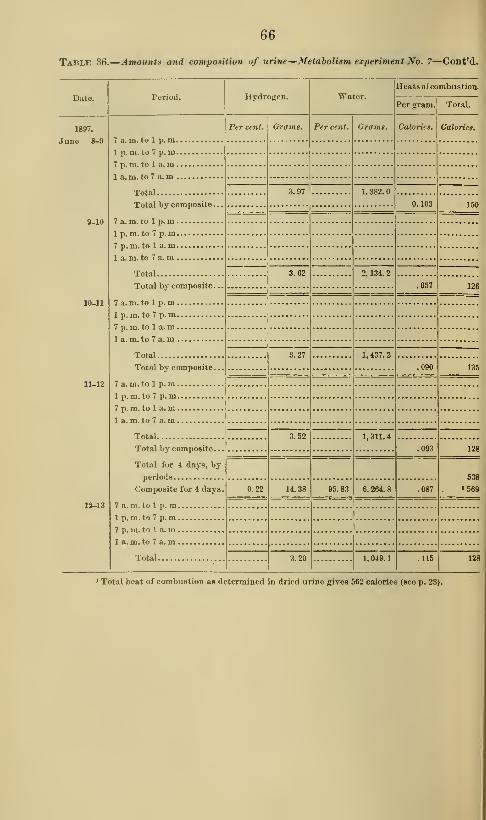
66
Table 36.
—
Ainouni» and compoxilion of urine—Metabolism experiment No. 7—Cont'd.
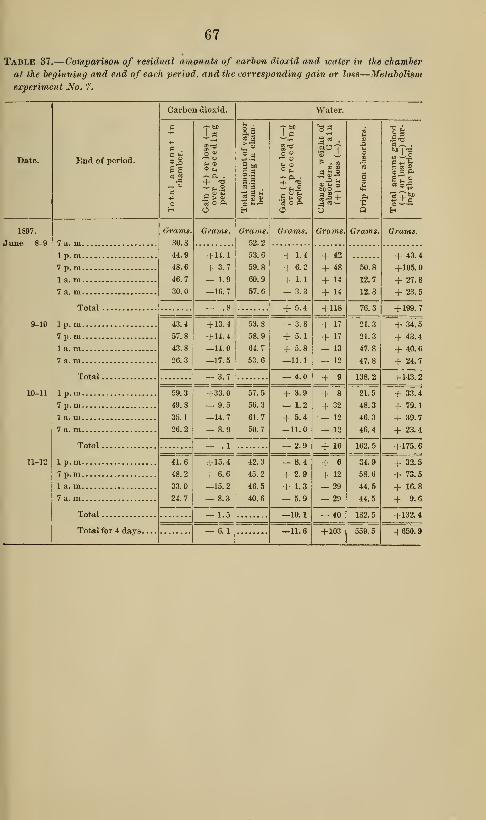
67
Table 37.—Comparison of residual amounts of carbon dioxid and water in the chamber
at the beginning and end of each period, and the corresponding gain or loss—Metabolism
experiment No. 7,
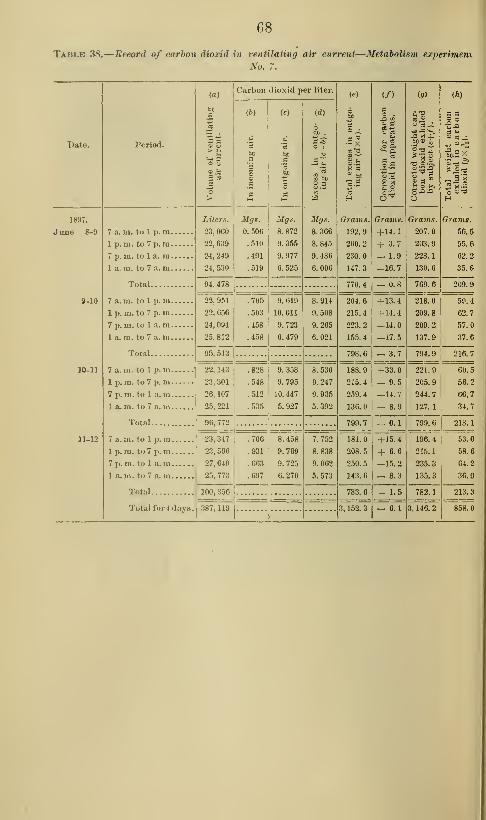
68
Table 38.
—
Record of carbon dioxid in ventilating air current—Metabolism experimem
No. 7.
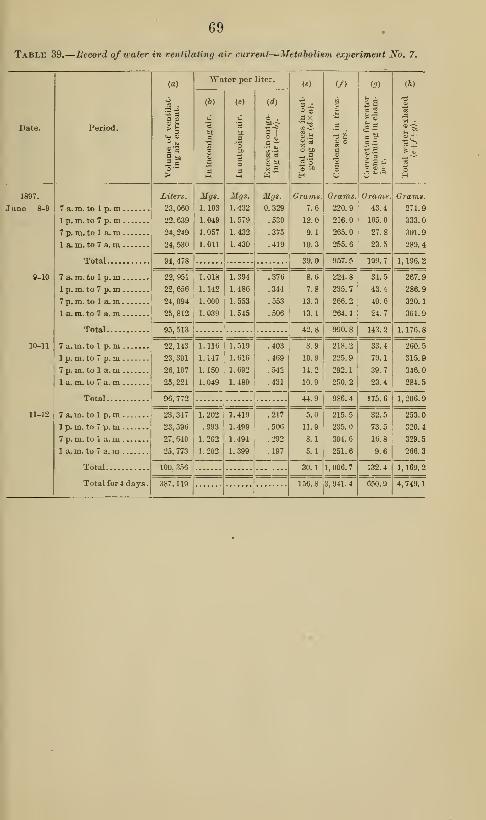
69
Table 39.
—
Record of water in ventilating air current—Metabolism experiment No. 7.

70
Tahlk 40. —Summary of calorimetrii measurements—Metabolism experiment No. 7.
Bate.
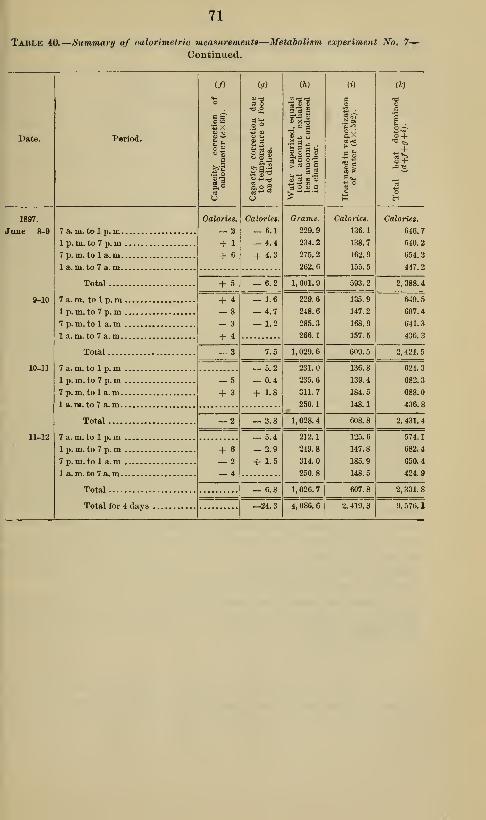
71
Table 40.
—
Summary of calorimetric measurements—Metabolism experiment No.
Continued.
7—
Date.

72
Table 41.—Alcohol excreted hy the luhiei/n and hy the skin and lungs—Metabolism ex-
pm'imint No. 7.

73
The computed data of income and outgo are as follows
:
Tabi,e 42.
—
Income and outgo of nitrogen and carbon—Metabolism experiment No. 7.

74
drinking water served the first day proved to be insufiflcieut for the
satisfying of the subject's thirst, so larger amounts were served on the
following days.
Tablb 43.
—
Income and outgo of water and hydrogen—Metabolism experiment No. 7.
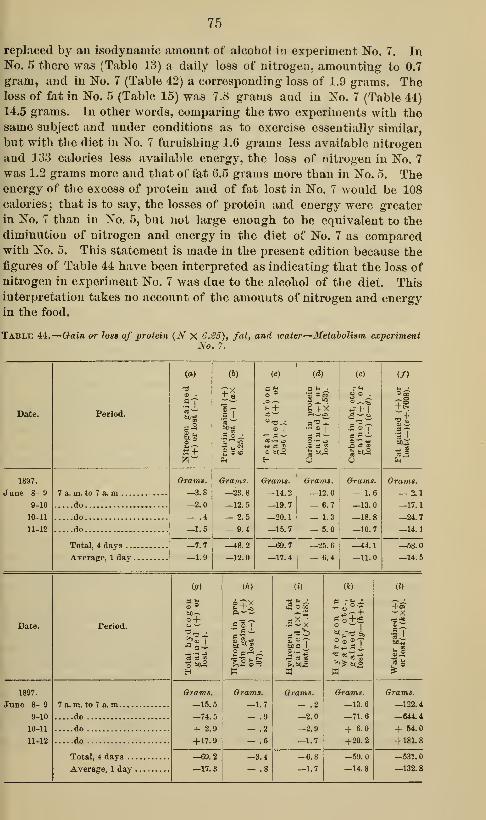
75
replaced by an isodynamic amount of alcohol in experiment N"o. 7. InNo. 5 there was (Table 13) a daily loss of nitrogen, amounting to 0.7
gram, and in No. 7 (Table 42) a corresponding loss of 1.9 grams. Theloss of fat in No. 5 (Table 15) was 7.8 grams and in No. 7 (Table 44)
14.5 grams. In other words, comparing the two experiments with the
same subject and under conditions as to exercise essentially similar,
but with the diet in No. 7 furnishing 1.6 grams less available nitrogen
and 133 calories less available energy, the loss of nitrogen in No. 7
was 1.2 grams more and that of fat 0.5 grains more than in No. 5. Theenergy of the excess of protein and of fat lost in No. 7 would be 108
calories; that is to say, the losses of protein and energy were greater
in No. 7 than in No. 5, but not large enough to be equivalent to the
diminution of nitrogen and energy in the diet of No. 7 as comparedwith No. 5. This statement is made in the present edition because thefigures of Table 44 have been interpreted as indicating that the loss of
nitrogen in experiment No. 7 was due to the alcohol of the diet. Thisinterpretation takes no account of the amounts of nitrogen and energyin the food.
Table 44.
—
Gain or loss of protein {N X 6.35), fat, and water—Metabolism experimentNo. 7.
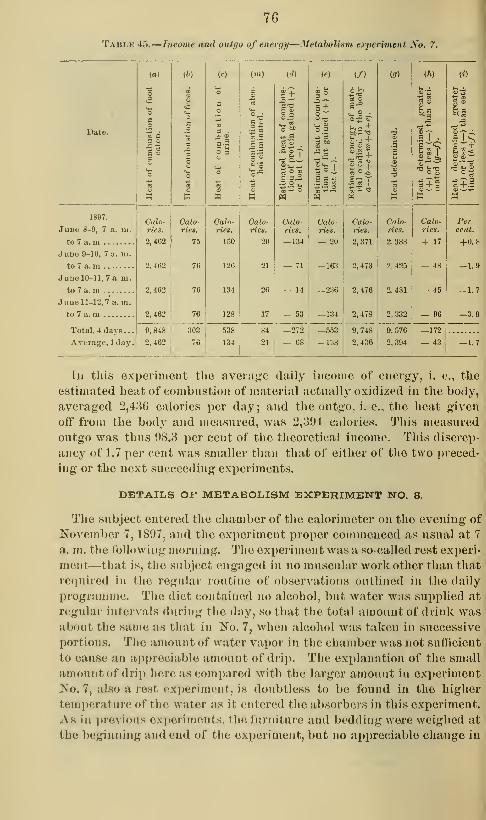
76
Tablk 45.
—
Income and outgo of eiienjy—AfetaboUsm experiment No. 7.
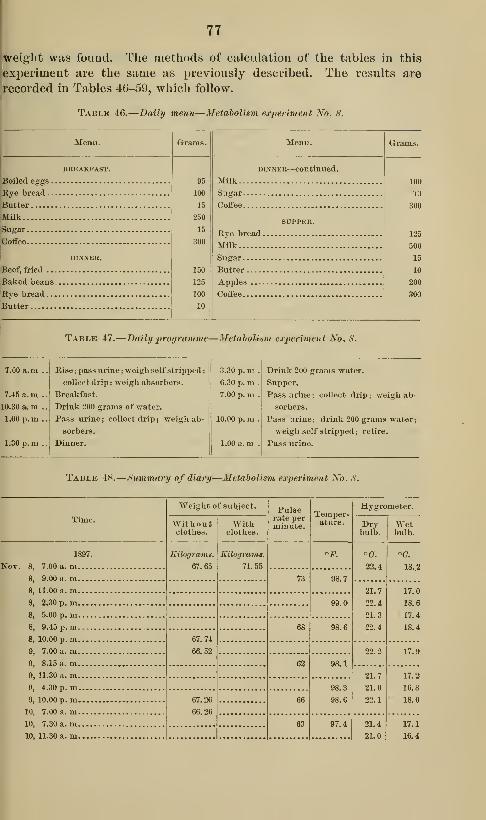
77
weight was found. The methods of calculation of the tables in this
experiment are the same as previously described. The results are
recorded in Tables 4G-59, which follow.
Table 46.
—
Daily menu—Metabolism experiment No. 8.
Boiled egga
.
Rye bread .
.
Butter
Milk
Sugar
CoflFee
Menu.
BREAKFAST.
Beef, fried . .
.
Baked beans.
Rye bread . .
.
Butter
Grams.
95
100
15
250
15
300
150
125
100
10
Menu.
DiNNKE—continued
Milk
Sugar ,
Coffee
SUPPER.
Rye bread
Milk
Sugar
Butter
Apples
Coffee ,
Grams.
100
10
300
125
500
15
10
200
300
Table 47.
—
Daily programme—Metabolism experiment No. S.
7.00 a. m .
.
7.45 a. m ..
10.30 a. m .
.
1.00 p. m .
.
1.30 p. m .
.
Rise; pass urine ; weigh self stripped
;
collect drip; weigh absorbers.
Breakfast.
Drink 200 grams of water.
Pass urine ; collect drip ; weigh ab-
sorbers.
Dinner.
3.30 p. m .
6.30 p.m .
7.00 p.m .
10.00 p. m .
1.00 a. m -
Drink 200 grams water.
Supper.
Pass urine ; collect drip ; weigh ab-
sorbers.
Pass urine; drink 200 grams water;
weigh self stripped ; retire.
Pass urine.
Table 48.
—
Summary of diary—Metabolism experiment No. S.
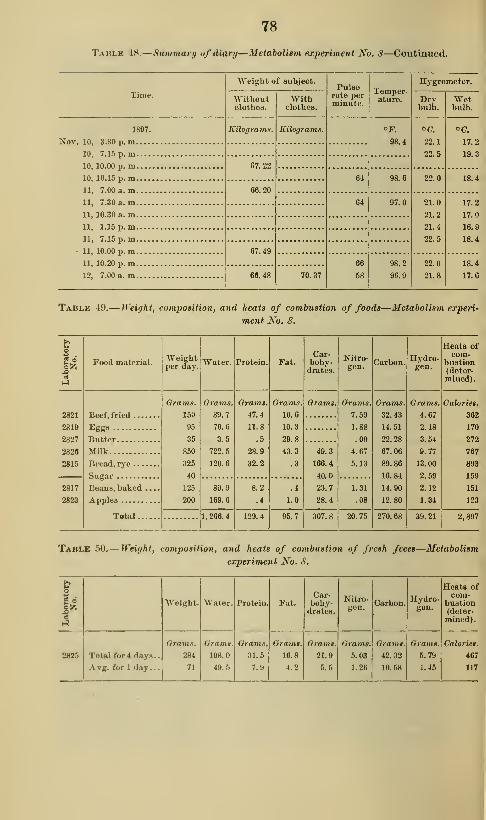
78
Tablb 48.
—
Summary of diary—Metabolism experiment No. 8—Continued.

79
Table 51.
—
Amounts and composition of urine—Metabolism experiment No. 8.
Bate.
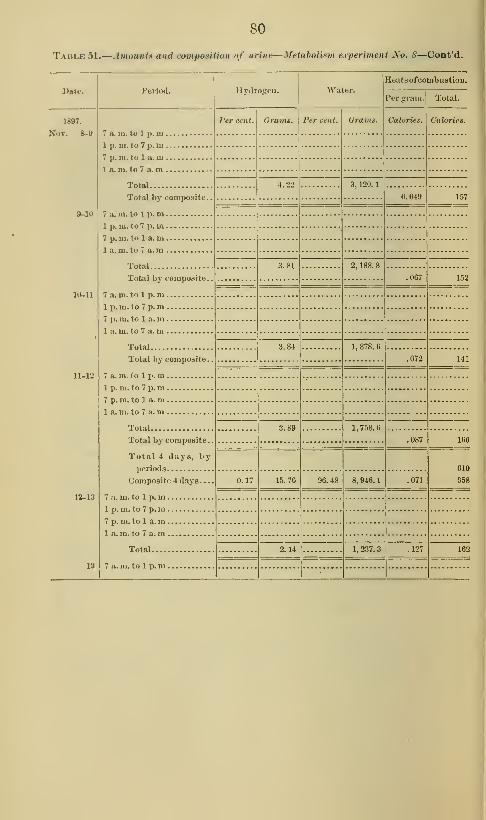
80
TABt,E 51.
—
.Imouiils atid composition of urine— Metaholism experiment Xo. S—Cont'd,
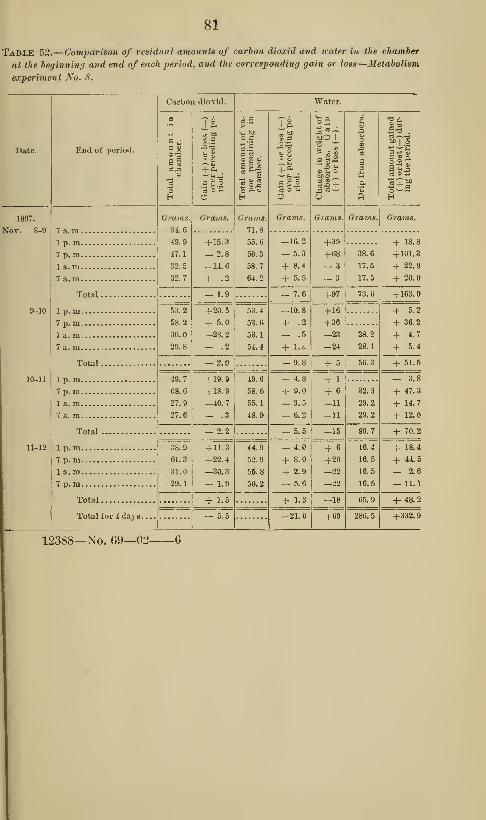
81
Table 52.
—
Comparison of residual amounts of carbon dioxid and water in the chamber
at the beijinnin;/ and end of each period, and the corresponding gain or loss—Metabolism
experiment Xo. 8.
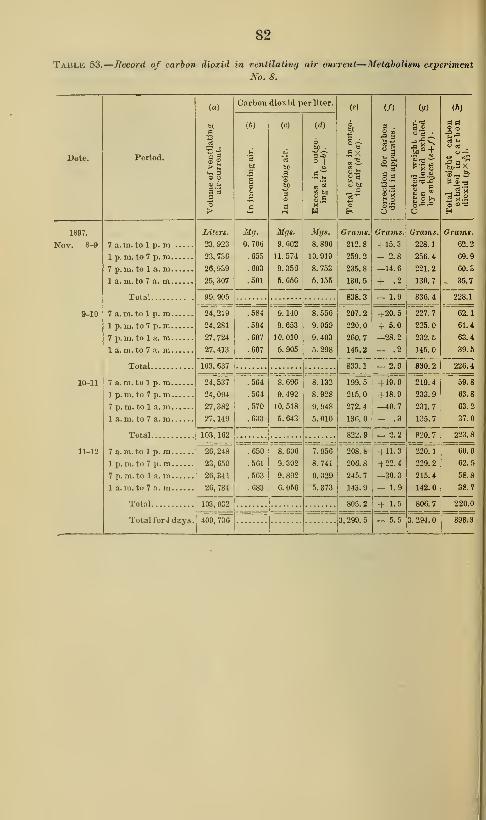
82
Tabus 53.
—
Jiecord of carbon dioxid in ventilating air current—Metabolism experiment
No. 8.

83
Table 54.
—
Record of water in ventilating air current—Metaholitm experiment No. 8.
Date.
1897.
Nov. 8-9
9-10
10-11
11-12
Period.
(a)
S =*
S bo
Water per liter.
(6)
7 a.m. to 1 p. m1 p. m. to 7 p. m7 p.m. to 1 a. m1 a. m. to 7 a. m
Total
7 a.m. to 1 p.m1 p.m. to 7 p. m7 p.m. to 1 a. m1 a. m. to 7 a. m
Total
7 a.m. to 1 p.m1 p.m. to 7 p.m
7 p. m. to 1 a. m1 a.m. to 7 a.m
Total
7 a.m. to 1 p.m1 p.m. to 7p.m7 p.m. to 1 a. m1 a.m. to 7 a. m
Total
Totalfor4day8
Liters.
23, 923
23, 736
26, 939
25, 307
Mg.
0.973
.960
.865
.699
99, 905
24, 219
24, 281
27, 724
27, 413
.778
.712
103, 637
24, 537
24, 094
27, 382
27, 149
103, 162
26, 248
23, 659
26, 341
26, 784
.795
.766
.675
.632
.749
.872
.799
.714
103, 032
409, 736
(c)
Mgt.
1.254
1.186
1.122
.972
1.256
1.038
1.081
.932
1.004
.926
.941
.866
1.014
1.098
1.076
.906
id)
a —
ilg.
0.281
.226
.257
.273
.358
.152
.303
.220
(«)
Chrams.
6.7
5.4
6.9
6.9
(/) (?)
Oramt.
215.0
197.5
280.1
254.8
Oramt.
18.8
101.3
22.9
20.0
25.9 947.4 163.0
ih)
-sn
Chrams.
240.5
304.2
309.9
281.7
.209
.160
.266
.234
.285
.226
.277
.192
8.7
3.7
8.4
6.0
26.
5.1
3.8
7.3
6.4
7.0
5.3
7.3
5.1
100.0
214.2
214.5
283.0
273.0
984.7
208. 8
212.2
284.6
252.7
958.3
229^216.2
270.6
263.1
979.4
3, 869. 8
5.2
36.2
4.7
5.4
51.5
-3.8
47.3
14.7
12.0
18.4
44.5
— 2.6
-11.1
49.2
333.9
1,136.3
228.1
254.4
296.1
284.4
1, 063.
210.1
263.3
306.6
271.1
1, 051.
1
266.0
275.3
257.1
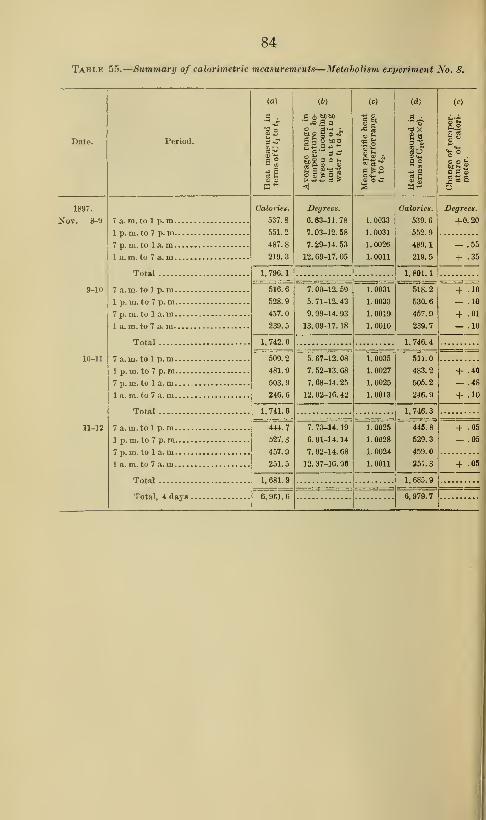
84
Table 55.
—
Summari/ of calorimetric measurements—Metabolism experivient No. 8.
Date.
1897.
Nov. 8-9
9-10
10-11
11-12
Period.
7 a. m. to 1
1 p. m. to 7
7 p. ni. to 1
1 a.m. to 7
Total
7 a. m. to 1
1 p.m. to 7
7 p. m. to 1
1 a. m. to 7
Total
7 a. m. to 1
1 p. ID. to 7
7 p.m. to 1
1 a. m. to 7
Total
7 a. m. to 1
1 p. m. to 7
7 p.m. to 1
1 a. m. to 7
p.m.
p. m.
a.m.
a. m.
p. m.
p. m.
a.m.
a. m-
p. m.
p.m.
a.m.
a.m.
p. m.
p.m.
a.m.
a.m.
Total
Total, 4 days
(a)
S a)
•*^ sa) B
Oaloriet.
537.8
551.2
487.8
219.3
1, 796.
1
(6)
a o MM'" .= .5 a
MO) e O'^
MX '-' "^ r
Degrees.
6. 63-11. 78
7. 03-12. 68
7. 29-14. 53
12. 69-17. 05
516.6
528.9
457.0
239.5
509.2
481.9
503.9
246.6
1,741.6
444.7
527.8
457.9
251.5
1, 681. 9
6,961.6
7. 00-12. 59
5. 71-12. 43
9.99-14.93
13. 09-17. 18
5. 67-12. 08
7. 52-13. 68
7.68-14.25
12. 02-16. 42
7.73-14.19
6. 91-14. 14
7. 92-14. 68
12.37-16.98
(c)
1^^
1. 0033
1. 0031
1. 0026
1.0011
id)
-OX
Soa °
1iB
Calories.
539.6
552.9
489.1
219.5
I. 0031
1. 0033
1. 0019
1. 0010
I. 0035
1. 0027
1.0025
1.0013
1. 0025
1. 0028
1. 0024
1. 0011
1,801.1
518.2
530.6
457.9
239.7
1, 746.
4
511.0
483. 2
505.2
246.9
445.8
529.3
459.0
251.8
1, 685. 9
6, 979.
7
§)£|B 3 (S

85
Table 55.
—
Summarg of calorimetric measurements—Metabolism experiment No. 8-
Continued.
Date.
1897.
Nov. 8-9
Period.
10-11
7 a.m. to 1p.m.
1 p.m. to 7p.m.
7 p.m. to 1 a.m.
1 a.m. to 7 a.m.
Total
,
7 a.m. to 1 p.m.
1 p.m. to 7 p.m.
7 p.m. to 1 a. m.
1 a.m. to 7 a.m.
Total
7 a.m. to 1p.m.
1p.m. to 7p.m.
7 p.m. to 1 a.m.
1 a.m. to 7 a.m.
Total
7 a. m. to 1p.m.
1 p.m. to 7 p.m.
7 p.m. to 1a.m.
1 a.m. to 7 a.m.
Total
Total, 4 days.
(/)
.fe'S
Calories.
+12.0
—33.0
-1-21.0
+ 6.0
— 6.0
+ .6
— 6.0
5.4
(3)
Calories
— 14.3
— 28.1
42.4
'a 5 a
h a! ee
Grains.
205.5
197.6
295.4
267.2
965.7
49.9
+24.0
—28.8
+ 6.0
+ 1.2
20.4
12.9
212.1
218.4
290.9
280.3
1,001.7
209.1
225.0
288.4
252.9
+ 3.0
— 3.0
19.7
24.6
+ 3.0
+ 3.0 44.3
975.4
232.5
229.5
280.8
262.6
1, 005.
4
— 1.2 3, 948.
2
(i)
ID >3="
w;
Calories.
121.7
117.0
174.9
158.1
(t)
a .
SI*'^
2 +
Calorie*.
659.0
641.8
631.0
398.6
571. 7 2, 330.
4
125.6
129.3
172.2
165.9
593.0
123.8
133.2
170.7
149.7
577.4
137.6
135.9
166.2
155.5
595.2
2, 337.
3
636.2
617.6
630.7
399.6
2, 284,
1
614.4
627.5
647.1
402.6
2,291.6
566.7
637.6
625.2
410.3
2, 239.
8
9, 145. 9
Table 56.
—
Income and outgo of nitrogen and carbon—Metabolism experiment No. 8.
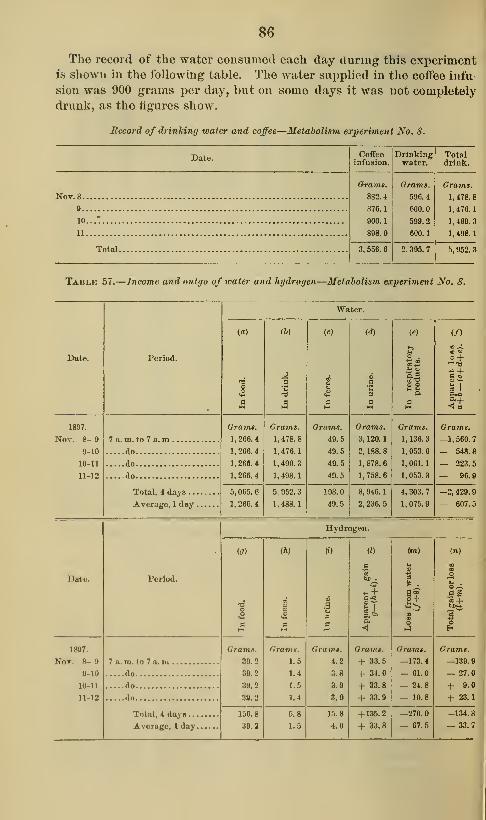
86
The record of the water consumed each day during this experimentis shown in the following table. The water supplied in the coffee infu-
sion was 900 grams per day, but on some days it was not completely
drunk, as the figures show.
Record of drinking water and coffee—Metabolism experiment Xo. 8.
Date.

87
Table 58.
—
Gain or loss of protein (JV X 6.35), fat, and water—Metabolism experiment
No. S.
Date.

88
The average daily income of ener,c:y in tliis experiment—i. e., the esti-
mated heat of combustion of material actually oxidized in the body,
averaged 2,356 calories per day, and the outgo—i. e., the heat given off
from tlie body and measured, amounted to 2,286 calories. The meas-
ured outgo was thus 97.0 per cent of the theoretical income. This dis-
crepancy of 3.0 per cent is larger than we are able to explain. Wehave been at pains to repeat a large number of the analyses of the food
materials and excreta, although they had been previously made in
duplicate or triplicate. Similar repetitions were made of a considerable
number of the analyses of experiments ISTos. 5, 6, and 7, but although
the work was done with the greatest care the results failed to give data
which would show any closer agreement of income and outgo of energy
than the figures here given. The most plausible explanation, it has
seemed to us, might be found in the faulty sampling of food materials,
an assumption which is favored by the much more satisfactory results
obtained in the succeeding experiments in which different methods of
preparation and sampling of food were adopted. These new methods
are described under the details of experiment No. 9.
DETAILS OF METABOLISM EXPERIMENT NO. 9.
Some of the details of this experiment have already been given in the
previous publication above referred to and will not be repeated in
this place. The subject entered the chamber on the evening of Jan-
uary 9, 1898, and the experiment proper began at 7 a. m. the following
morning. During the interval between this and experiment No. 8, the
method of preparation and sampling of food materials was so changed
as to enable us to obtain, we believe, more accurate samples than had
hitherto been i)Ossible. The method of sampling was that already
described, in which the food materials were i^ut up in jars before the
beginning of tlie experiment (see page 19). The experiment was a rest
experiment, and very nearly a repetition of experiment No. 8, but with
a slight reduction of the amounts of protein and energy. No alcohol
was included in the diet.
,
PREPARATION OF THE FOOD.
The beef was round steak, nearly freed from fat. It was passed
through a meat chopper, by which it was cut in very small pieces andwell mixe<l. Tliis finely chopped meat was fried in a shallow, flat-bot-
tomed pan over a gas ilame until the whole was tolerably "well done,"
and had lost the distinctly reddish color. The juice which escaped in
the cooking was discarded. The cooked meat was then thoroughly
mixed, and ])ortions api)ropriate for individual meals were weighed off",
put in small glass jars, sterilized, and set aside in a cold place. Thecontents of two or more of the jars were used for analysis, as described
on i)ag(; 19. The others were used for the experiment. The meat kept
well, the flavor was acceptable, and on the whole the method of prepa-
ration and sampling sfjemed satisfactory.
The bread was purchased at a local bakery. From an appropriate

89
number of loaves, weighing about 1^ pounds each, the crust was
trimmed ofi" and discarded. The object in removing the crust was to
avoid error due to the introduction of varying proportion of this drier
protein into the different jars. The crumb was cut into i^ieces small
enough to pass easily into glass jars, and well mixed. Portions of
appropriate weight were put in glass jars, sealed, sterilized, and set
aside in a cold place. The total quantity for a day's ration was put some-
times in one jar and sometimes in two. The contents of two or more
jars were used for analysis. The bread kept well and was palatable.
Butter iu sufficient amounts for the whole experiment, including sam-
ples for analysis, was purchased from a local creamery, and was put up
in small glass pomade jars in such quantities that one jar furnished
sufficient butter for one day. The specimens thus prepared were kept
in a cool i^lace. Separator milk was used in this experiment owing to
the greater uniformity in the content of fat as compared with whole
milk, this varying but little from O.l per cent. It was purchased fresh
each day, and a composite sample made up of aliquot portions of the
milk of each day was taken for analysis. The maize and wheat break-
fast foods were purchased in quantity sufficient for several experiments
and well mixed. The amounts required for each meal were placed in
glass jars and set aside until needed. One analysis of the maize and
one of the wheat product thus served for several experiments.
Ginger snaps were purchased in sufficient quantity for one experi-
ment and in amounts appropriate for individual meals and were put in
glass jars as was done with other food materials. " Granulated" sugar
was purchased in quantity sufficient for several experiments and kept
in a closed vessel. Amounts for a day were placed in glass bottles, and
the subject used as nearly as he could judge the amounts indicated in
the menu for each meal. The coffee infusion was prepared as explained
in the description of experiment Ko. 5.
The menu, daily programme, and summary of the subject's observa-
tions in the calorimeter are given in the following tables :
Table 60.
—
Daily menu—Metabolism experiment No. 9.
Menu.
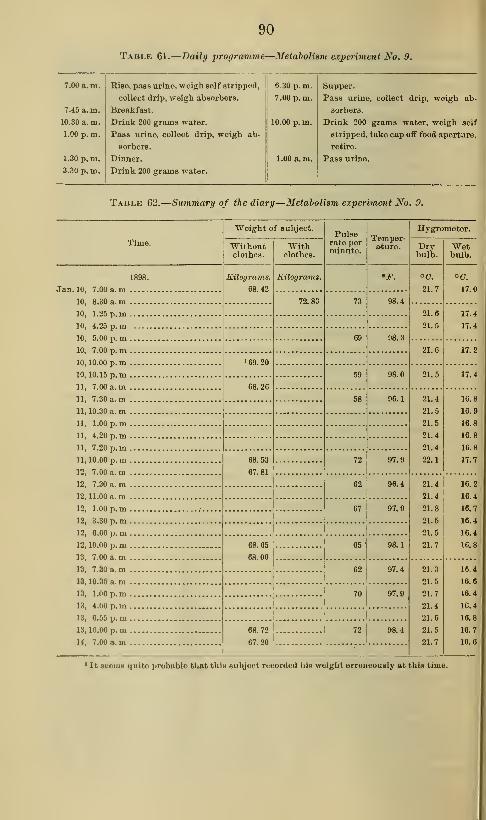
90
Table 61.
—
Daily prof/ramme—Metabolism expmwient No. 9.
7.00 a. m.
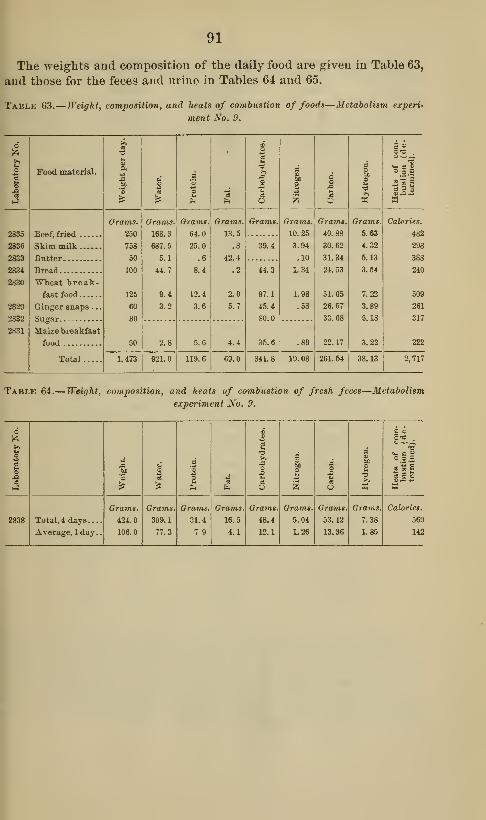
91
The weights and composition of the daily food are given in Table 63,
and those for the feces and urine in Tables 64 and 65.
Table 63.— Weight, composition, and heats of combustion of foods—Metabolism experi-
ment No. 9.
2835
2836
2833
2834
2830
2829
2832
2831
Food inaterial.
Beef, fried
Skim milk
Butter
Bread
WTieat break-
fast food
Ginger snaps . .
.
Sugar
Maize breakfast
food
Total
^
Grams.
250
758
50
100
125
60
80
50
I
Grams. ' Grams.
168.3
687.5
5.1
44.7
9.4
3.2
1,473
2.8
64.0
25.0
12.4
3.6
921.0I
119.6
Grams.
13.5
2.0
5.7
Grams.
39.4
44.3
97.1
45.4
80.0
341.8
Grams.
10.25
3.94
.10
1.34
1.98
.58
Grains.
40.88
30.62
31.34
24.53
51. C5
26.67
33.68
22.17
19.08
w
Grams.
5.63
4.32
5.13
3.54
7.22
3.89
5.18
3.22
261. 54I
38. 13
CO .
O o 9
w
Calories.
482
298
388
240
509
261
317
222
2,717
Table 64.— Weight, composition, and heats of combustion of fresh feces-
experiment Ko. 9.
Metabolism
6
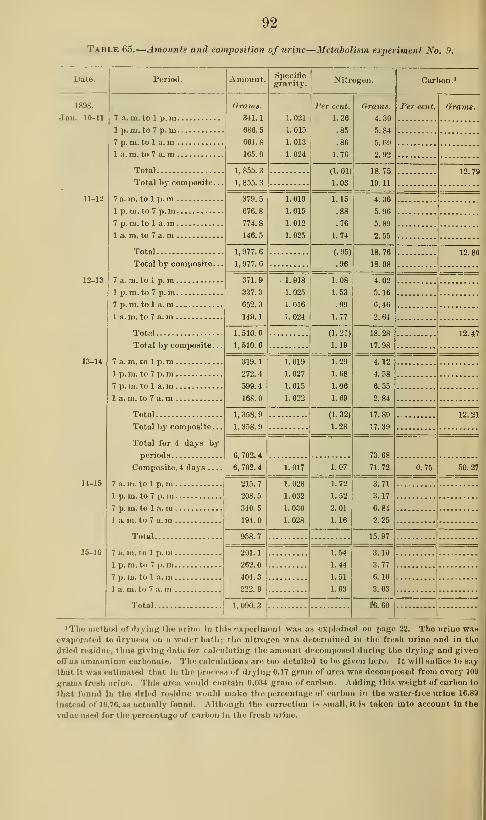
92
Table 65.
—
Amounts and composition of urine—Metabolism experiment No. 9.
Date.

93
Table 65.
—
Amounts and composition of urine—Metabolism experiment Ko. 9—Cont'd.
Date.
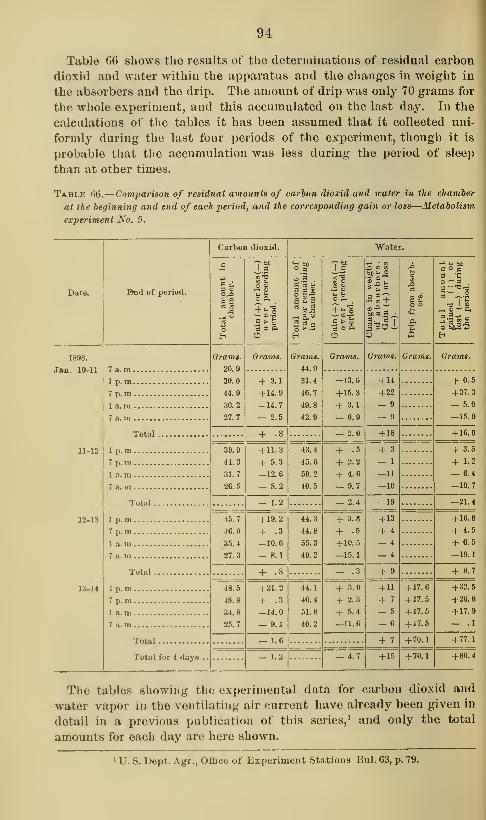
94
Table 66 shows the results of the determinations of residual carbon
dioxid and water within the apparatus and the changes in weight in
the absorbers and the drip. The amount of drip was only 70 grams for
the whole experiment, and this accumulated on the last day. In the
calculations of the tables it has been assumed that it collected uni-
formly during the last four periods of the experiment, though it is
probable that the accumulation was less during the period of sleep
than at other times.
Tablk 66.
—
Comparison of residual aviounts of carbon dioxid and water in the chamier
at the beginning and end of each period, and the corresponding gain or loss—Metabolism
experiment Xo, 9.
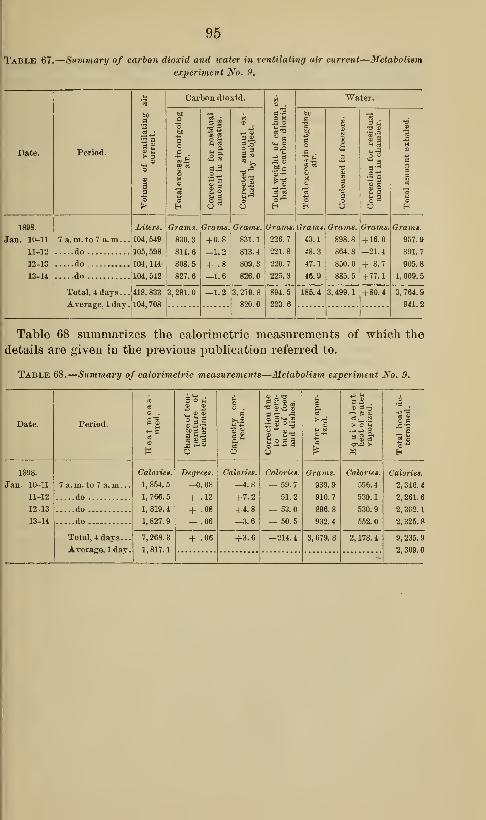
95
Table 67
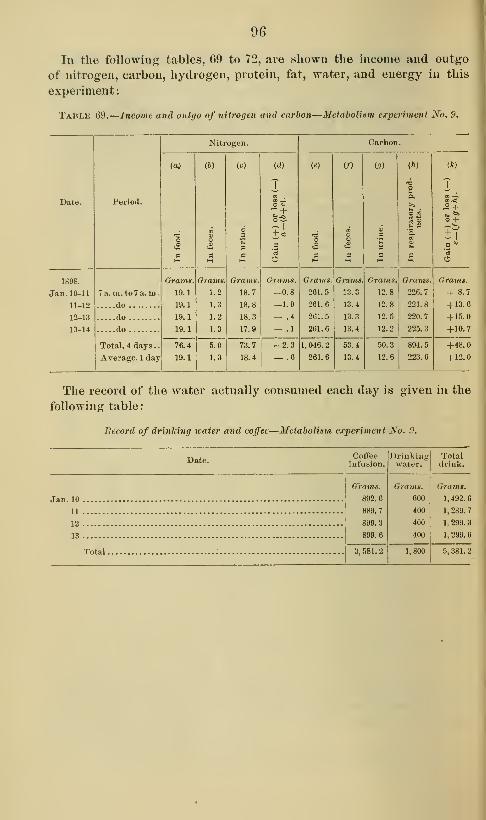
96
In the following tables, 69 to 72, are shown the income and outgo
of nitrogen, carbon, hydrogen, protein, fat, water, and energy in this
experiment:
Table 69.
—
Income and outgo of nitrogen and carbon—Metabolism experiment No. 9.

97
Table 70.
—
Income and outgo of naier and hydrogen—Metabolism experiment Ko. 9.
Date.
1898.
Jan. 10-11
11-12
12-13
13-14
Period.
7 a. lu. to 7 a. mdo
do
do ,
Water.
(a)
Qrams.
921.0
921.0
921.0
921.0
Total, 4 days
Average, 1 day
3, 684.
921.0
(6)
Grams.
1, 492.
6
1, 289. 7
1, 299.
3
1, 299.
6
5, 381.
2
1, 345. 3
ic) (d)
Grams.
77.2
77.3
77.3
77.3
309.1
77.3
Grams.
1, 784.
3
1,906.6
1, 441.
5
1, 291.
2
(«) (/)
Grams.
957.9
891.7
905.9
1,009.5
Grams.
— 405.8
— 664.9
— 204.4
— 157.4
6,423.6I
. 3,765.0 i —1,432.5
1, 605.
9
941. 2 — 358.
1
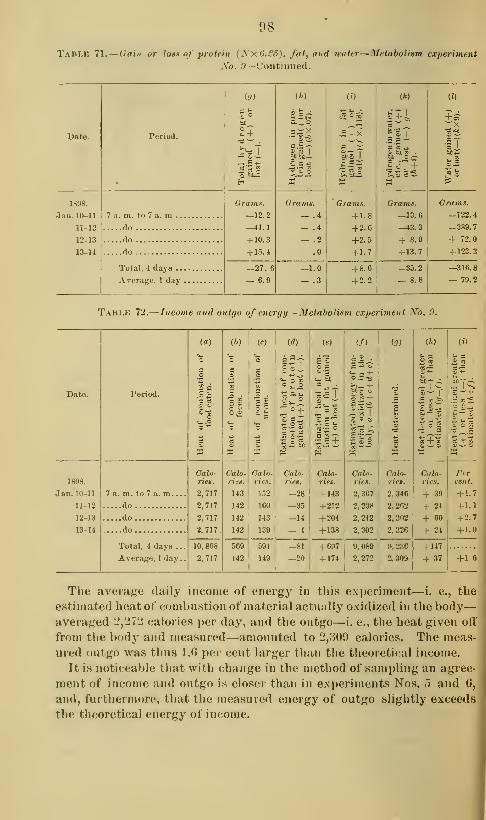
98
Tahlk 71.
—
Cain or losn of protein (Nx6.?5), fat, and water—Metabolism experiment
y'o. 9—Coutiniied.
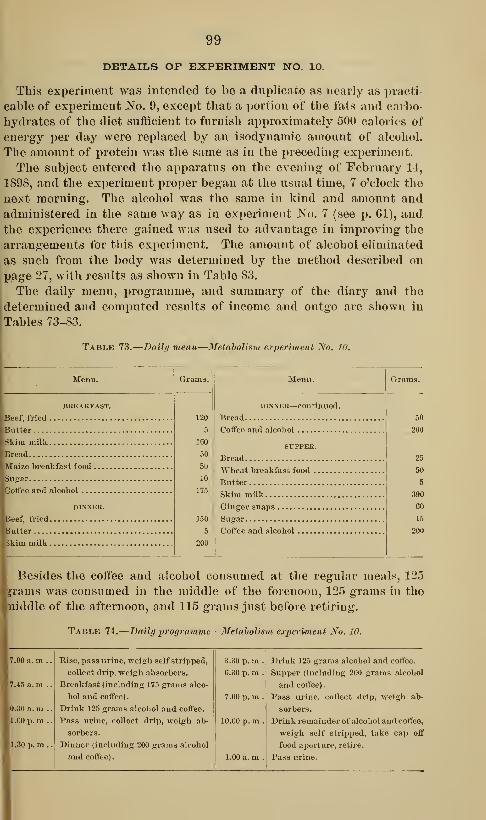
99
DETAILS OF EXPERIMENT NO. 10.
This experiment was intended to be a dnplicate as nearly as practi-
cable of experiment No. 9, except that a portion of the fats and carbo-
hydrates of the diet sufficient to furnish approximately 500 calorics of
energy per day were replaced by an isodynamic amount of alcohol.
The amount of protein was the same as in the preceding experiment.
The subject entered the apparatus on the evening of February 14,
1898, and the experiment proper began at the usual time, 7 o'clock the
next morniug. The alcohol was the same in kind and amount andadministered in the same way as iu experiment No. 7 (see p. 61), andthe experience there gained was used to advantage in improving the
arrangements for this exi^eriment. The amount of alcohol eliminated
as such from the body was determined by the method described on
page 27, with results as shown in Table 83.
The daily menu, programme, and summary of the diary and the
determined and computed results of income and outgo are shown in
Tables 73-83.
Table 73.
—
Daihi menu—Metabolism experiment JVo. 10.
Menu.
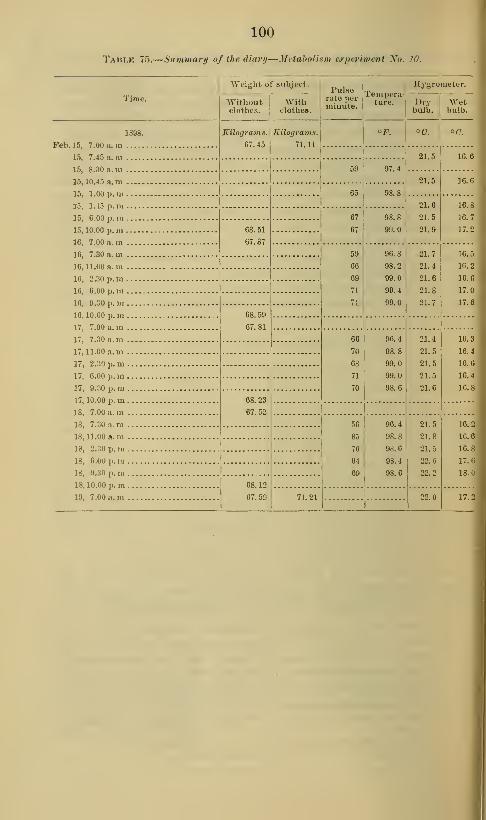
100
Taulk 75.
—
Sammary of the diuri/—Mctaholixm experiment No. 10.
Time.
1898.
Feb. 15,

101
1 ABLE 7ti.— TTeifiht, composition, and heats of combustion offoods—Metabolism experiment
Xo. 10.
2
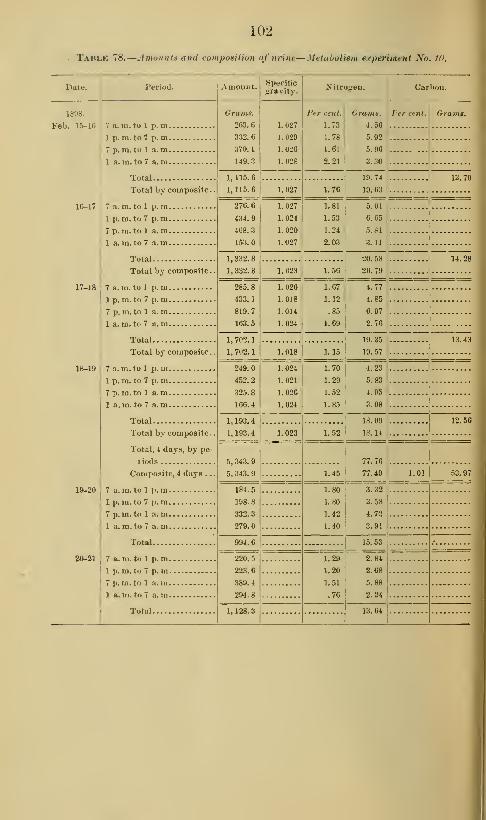
102
Tablk 78.
—
Amuuiits and compoaUion of urine— Meldholism experiment No. 10.
Date. Period.
1898.
Feb. 15-16 7 a. m. to 1 p. m.
1 p. m. to 7 p. m
.
7 p. m. to 1 a. m .
1 a.m. to7 a. in.
Amount.
Orams.
203.6
332.6
370.1
149.3
Specificgravity.
1.027
1.029
1.026
1.028
16-17
Total
Total by composite.
.
7 a. m. to 1 p. m1 p. m. to 7 p. m7p. m. tol a.m
' 1 a. m. to 7 a. m
1, 115.6
1,115.6 1.027
17-18
Total
Total by composite.
7 a. m. to 1 I), m
.
1p.m. to 7 p.m.
7 p.m. to 1 a.m.
1 a.m. to 7 a.m.
18-19
l»-20
Total
Total by composite .
7 a. m. to 1 p. m1 p.m. to 7 p. m7p.m. tol a.m
1 a.m. to 7 a.m
Total
Total by composite..
Total, 4 days, by pe-
liods
Composite, 4 days . .
.
7 a. m. to 1 p. m1p.m. to 7 p. m7 p. m. to 1 a. m1 a. m. to 7 a. m
Total.
20-21 7 a. m. to 1 p.m.
1 p. m. to 7 p. m.
7 p. TO. to 1 a. m.
1 a.m. to 7 a. m.
Total
276.6
434.9
4G8.3
153.
1.027
1.024
1.020
1.027
Nitrogen. Carbon.
Per cent.
1.73
1.78
l.«l
2.21
Grams.
4.5C
5.92
5.96
3. .30
Per cent. Orams.
1.76
19.74
19.03
1.81
1.53
1.24
2.03
5.01
C.65
3.11
1,332.8 ;.
1, 332. 8I
1.023 1.56
20.58
20.79
14.28
285.8
433.1
819.7
163.5
1.026
1.018
1.014
1.024
1.67
1.12
.85
1.69
4.77
4.85
6.97
2.70
1,702.1 1.
1, 702. 1I
1.018 1.15
19.35 |.
19.57 !-
249.0
452.2
325.8
166.4
1.024
1.021
1.026
1.024
1.70
1.29
1.52
1.85
1,193.4 .
1,193.4 i
5, 343.
9
5, 343. 9
lils198.
8
332.3
279.0
994.6
220.5
223.6
389.4
294.8
1, 128. 3
1.52
4.23
5.83
4.95
3.08
18.09
18.14
1.45
1.80
1.80
1.42
1.40
1.29
1.20
1.61
.76
77.70
77.49
^.32
3.58
4.72
3.91
15.53
2.84
2.68
5.88
2.24
13.64

103
Table 78.
—
Amounts and compoaition of urine—Metaholism experiment No. 10—Cont'd.
Date.

104
Tablk 79.
—
Comparison of residual amonnia of carbon dioxid and water in the chamber
at the beginning and end of each period, and the corresponding gain or loss—Metabolism
experiment Xo. 10.
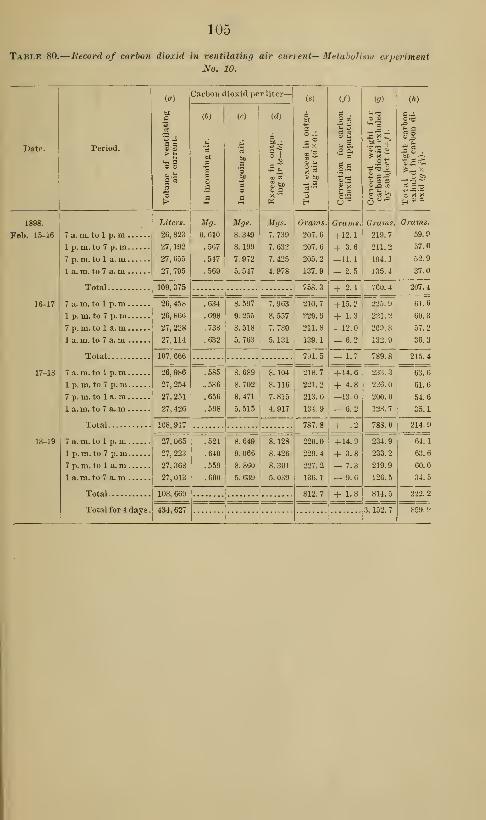
105
Table 80.
—
Record of carbon dioxid in ventilating air current— Metabolism experiment
No. 10.
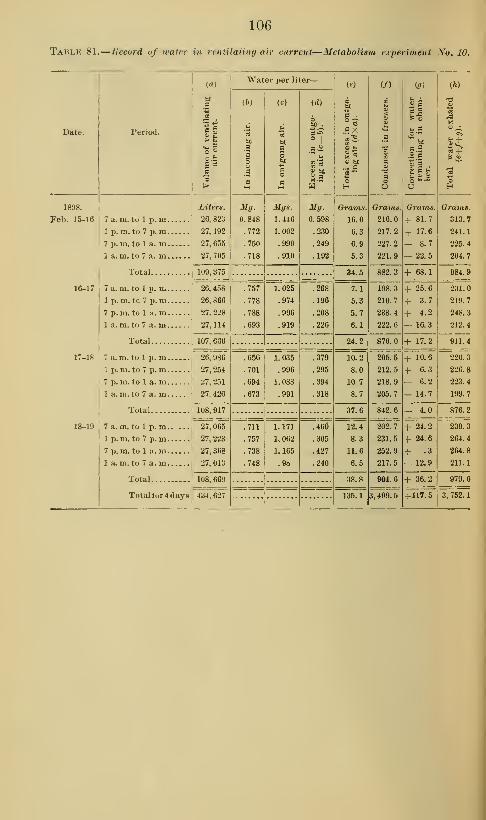
106
Table 81.
—
Record of water in ventilating air current—MetaboHavi experiment Xo. 10.
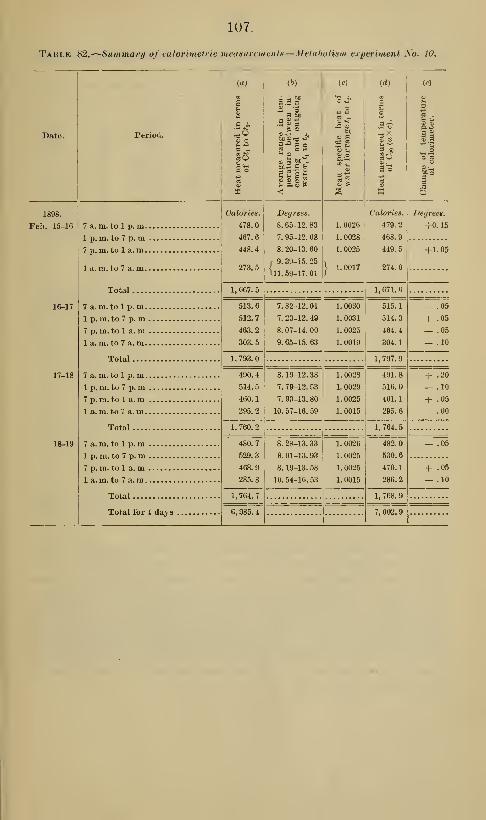
107.
Table 82.
—
Summary of calorimetric measurcmenta—Metabolism experiment No. 10.
Date.
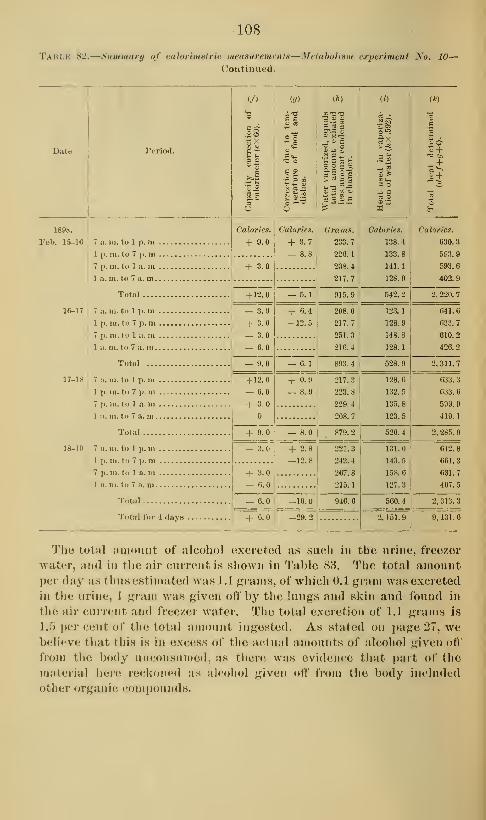
108
Taiu.k S2.—Summary of calorimetric measurements— ^[ctaholi8m experiment Xo. 10-
Coutiuued.
Date

109
Tablk 8.3.
—
Alcohol excreted hy the lidneys and by the lunys—Metaholism cxjierimeiv
So. 10.
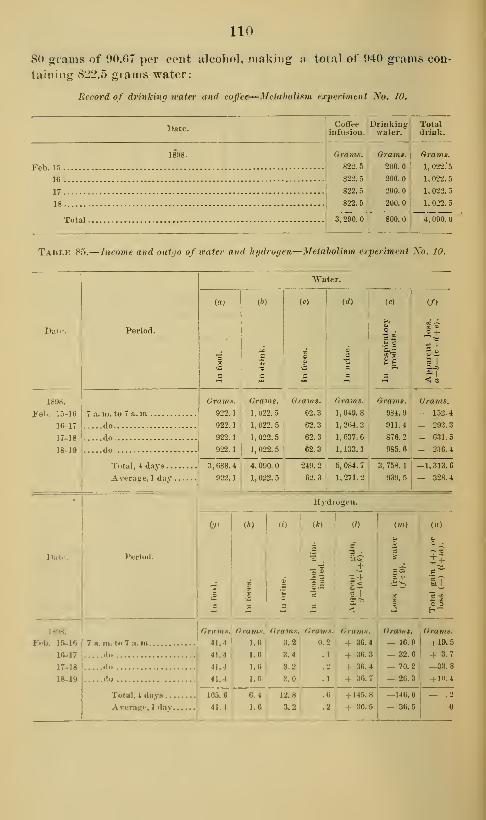
110
80 grams of OO.fiT per cent alcolinl, making a total of 040 grams con-
taining 822.5 grams water:
Record of drinking water and coffee—Metabolism experiment No. 10.
Feb. 15
.
16 .
17.
18.
Date.CofFee jDrinking
infusion, water.
Grams.

Ill
Table 86. -Gain or Josh of protein (.Vx i>.3'>), f<it, and water—Metabolism experiment
So. 10.

112
Table 87.
—
Income and outgo of energy—Metabolism experiment No. 10.


COLUMBIA UNIVERSITY LIBRARIESThis book is due on the date indicated below, or at the
expiration of a definite period after the date of borrowing, as
provided by the rules of the Library or by special arrange- .
ment with the Librarian in charge.

QP171
Atwater
At9221899


![New Insight into Phaeodactylum tricornutum Fatty Acid Metabolism… · acid metabolism of P. tricornutum were obtained from labeling experiments. Incubation of the diatom with [14C]acetate](https://static.documents.pub/doc/80x56/5e99fb3cf9afa538077bed2b/new-insight-into-phaeodactylum-tricornutum-fatty-acid-acid-metabolism-of-p-tricornutum.jpg)


