Page 1
PROCEEDINGS, 42nd Workshop on Geothermal Reservoir Engineering
Stanford University, Stanford, California, February 13-15, 2017
SGP-TR-212
1
Exploration and Development of the Platanares, Honduras Geothermal System
Steven Fercho, Doug Perkin, Lara Owens, Enrique Porras, Paul Spielman, Greg Rhodes, Ben Delwiche, Patrick Walsh
6225 Neil Road, Reno, NV 89511
[email protected]
Keywords: Honduras, Platanares, Geothermal
ABSTRACT
Platanares lies in an extensional regime with normal faulting similar to productive systems in the Basin and Range province of the
western U.S. Prolific hot springs as well as silica-altered volcanic units extend for two kilometers at the site. Extensive geologic and
geophysical exploration methods were conducted to create a detailed 3D model. Exploration drilling discovered a 178°C resource with
very high permeability in the northern area of the field, while injection was successfully located in the southern half of the field.
Temperature and permeability are significantly higher than identified during prior exploration. Tracer flow tests between injection and
production confirm high productivity, high injectivity, slow returns, and moderate pressure drawdown. Construction of a 35 MW plant
and development drilling are currently ongoing in preparation to bring the first geothermal plant in Honduras online.
1. INTRODUCTION
The first studies of the geothermal system at Platanares were conducted by Los Alamos National Lab (LANL) in the late 1980s, when a
study of six prospective hot spring sites within Honduras was performed under a grant from USAID (Goff et al., 1987b). Those sites
were: Platanares, San Ignacio, Azacualpa, Pavana, Sambo Creek, and El Olivar. Based on the extensive thermal manifestations found
with total outflow estimated at 900 GPM and geochemistry predicting reservoir temperatures of 180°C, Platanares was selected among
the six sites for further study (Goff et al., 1988b). LANL then conducted geologic and geophysical mapping at Platanares, followed by
the drilling of three core wells: PLTG-1, PLTG-2, & PLTG-3 (Figure 1, Figure 2). PLTG-1 and PLTG-3 were drilled to ~2,200 ft. with
maximum temperatures of 160°C and 165°C respectively and nearly isothermal temperature profiles at bottom (Figure 1) (Goff et al.,
1991). Both wells encountered permeability at around 2050 ft., indicated by large water entries into the wellbores and geysering out of
the wellheads (blow out preventers were not used). PLTG-2 encountered ~104°C at 1300 ft. but the well collapsed before reaching its
planned depth. Its conductive gradient and location away from surface thermal features suggest it may be located outside of the primary
reservoir. The drilling of these wells indicated the high potential of Platanares and concluded LANL’s work at the site.
Figure 1: Temperature profiles for wells at the Platanares geothermal field.
Page 2
Fercho et al.
2
After sitting undeveloped for many years, Ormat acquired the prospect as GeoPlatanares in late 2013 and initiated extensive exploration
studies, including geophysical surveys and detailed geologic mapping. Geophysical studies included a detailed gravity survey, ground
magnetics, and reprocessing of existing magnetotelluric (MT) data which were collected by the previous project owner. Density analysis
of core and field samples was performed to provide constraints for geophysical modeling of the data. Geophysical data were integrated
with geologic mapping and drilling results into a 3D model, which is regularly updated as new data are acquired with drilling and/or
additional mapping. The integrated model was used to site exploration wells by Ormat, which successfully identified permeable
production and injection zones. Full size production and injection drilling is currently ongoing and expected to be complete by mid-
2017.
2. GEOLOGY
Platanares is controlled by normal faulting within an extensional tectonic setting, similar to productive systems in the Basin and Range.
Extensive hot springs and fumaroles along the narrow canyon at Platanares (called the Quebrada de Agua Caliente) initially indicated
the presence of a geothermal system (Figure 2). Active crustal extension has resulted in fractures that enable boiling fluids to reach the
surface along the canyon, depositing silica and altering preexisting rocks. Siliceous sinter is widespread along the base of the canyon
coinciding with the occurrence of current and past hot spring activity. Conservative SiO2-chalcedony (Giggenbach et al, 1982) and
K/Mg geothermometers (Fournier, 1981) predict the resource to be near 180°C; slower-equilibrating alkali geothermometers estimate a
maximum resource temperature of 200°C (Fournier, 1981), however it is unknown if such a resource is present at exploitable depths.
Figure 2: Site location, hot springs, wells, and major fault structures at Platanares
Page 3
Fercho et al.
3
Heiken et al. (1986) and Goff et al. (1987) originally described stratigraphy in the area. Within the Quebrada de Aqua Caliente and
mountains eastward, the majority of the Platanares field is covered by the Padre Miguel Group which is composed of rhyolitic tuffs,
pyroclastic flows, and andesitic lavas. The Padre Miguel Group is underlain by the Subinal Formation which is composed of red stained
sandstones, siltstones, & conglomerates; and the Matagalpa Formation which is composed of altered andesitic lavas and interbedded
pyroclastic rocks. These units overly the Valle de Angeles Group which is a unit of redbeds consisting of siltstones, sandstones, and
conglomerates followed by the Yojoa Group schists which is the oldest unit in the region. In the far north of the field there is a major
NE trending structure called the La Bufa fault which divides the volcanics from schists of the Yojoa group to the north. The schists are
the reservoir formation in the production area of the field.
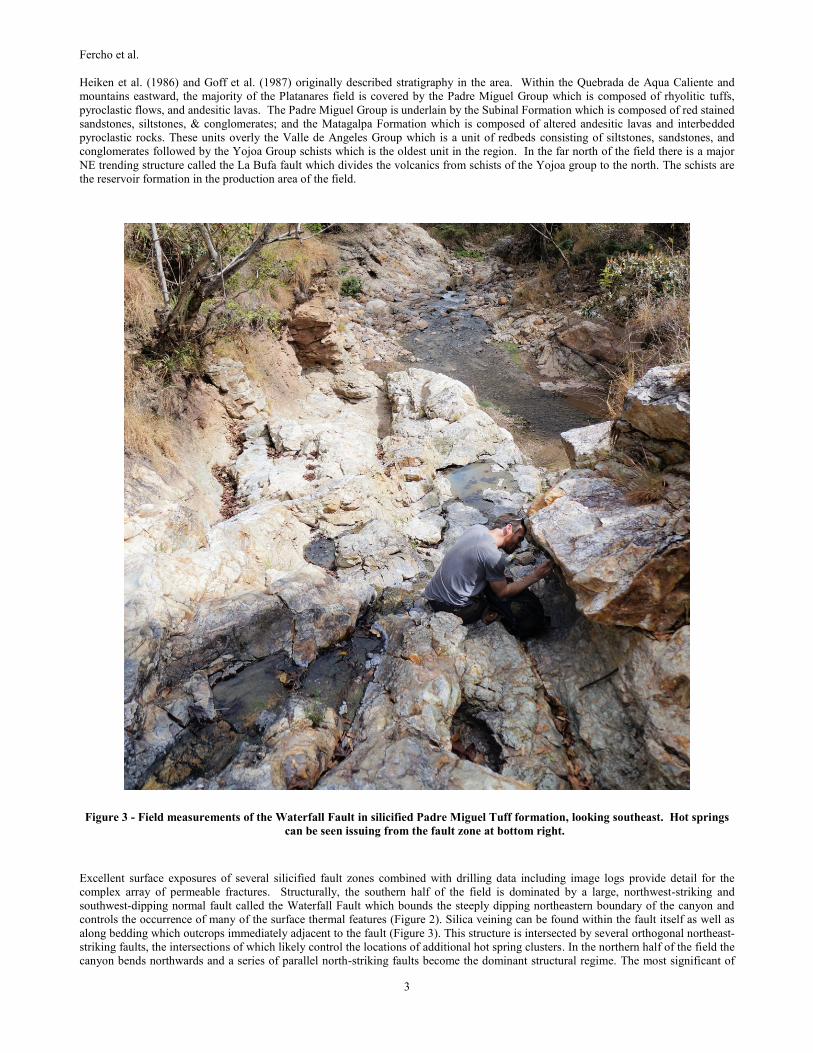
Figure 3 - Field measurements of the Waterfall Fault in silicified Padre Miguel Tuff formation, looking southeast. Hot springs
can be seen issuing from the fault zone at bottom right.
Excellent surface exposures of several silicified fault zones combined with drilling data including image logs provide detail for the
complex array of permeable fractures. Structurally, the southern half of the field is dominated by a large, northwest-striking and
southwest-dipping normal fault called the Waterfall Fault which bounds the steeply dipping northeastern boundary of the canyon and
controls the occurrence of many of the surface thermal features (Figure 2). Silica veining can be found within the fault itself as well as
along bedding which outcrops immediately adjacent to the fault (Figure 3). This structure is intersected by several orthogonal northeast-
striking faults, the intersections of which likely control the locations of additional hot spring clusters. In the northern half of the field the
canyon bends northwards and a series of parallel north-striking faults become the dominant structural regime. The most significant of
Page 4
Fercho et al.
4
these faults identified in the field is the Silica Fault, which has been observed in multiple locations with thick silica veining at the
surface and as an open fracture with an aperture of nearly one foot imaged in wellbores. Maximum horizontal stress (σH) identified
from drilling induced fractures (DIFs) in the northern half of the field is oriented northeast - southwest, while in the southern half of the
field σH rotates to north northwest - south southeast (Figure 4).
Figure 4 – DIFs recorded from well image log analysis. DIFs in OP-5 in the northern field area show maximum horizontal
stress oriented NE-SW, while in the southern half of the field σH is rotated to NNW-SSE. PLTG-1 in between the two
areas exhibits an intermediate N-S σH orientation.
3. GEOPHYSICS
A total of 1089 gravity stations were collected at Platanares from February 21st to April 4th 2014. Data were acquired on a variably-
spaced grid covering an area approximately 8 x 6 km. Station spacing ranged from 100 meters in the innermost detailed grid area, to 200
meters and 400 meters in the intermediate and regional areas of the grid, respectively. Data quality was good, despite the difficult terrain
and thick canopy in places. The average absolute difference between repeated GPS elevation measurements is 0.028 meters and the
average absolute difference between the 79 repeated gravity measurements is 0.014 mGal. The Complete Bouguer Anomaly was
computed using a reduction density of 2.40 g/cm3 Figure 5). Terrain corrections were computed using a combination of the gravity
station GPS measurements, a 1 meter Lidar grid, and SRTM 75-meter DEM (Figure 5).
In 2005 a total of 31 magnetotelluric (MT) stations were collected at Platanares by Geosystem Srl. The raw data were reprocessed using
up to date robust remote reference processing techniques by Schlumberger Geosolutions and used to create a 3D resistivity model. All
impedance tensor elements including Tipper data from 30 stations were used in the 3D inversion within the frequency range from 1000
Hz to 0.01 Hz. A mesh of 150m x 150m lateral cell size and 15-150m vertical cell size was used to accurately discretize the topography.
The resistivity model obtained by the 3D inversion shows a good fit between calculated and observed MT data, with an RMS value of
1.878 for the final model. The 3D model shows resistivity values consistent with geological observations and lithology data from wells.
The model appears to reflect lithological boundaries rather than alteration or structural features. The Padre Miguel tuff is represented by
conductive values less than 6 ohm*m, while the Valle De Angeles Group is more resistive with values greater than 15 ohm*m.
Page 5
Fercho et al.
5
Gravity modeling and interpretation of a 3D MT inversion were performed to evaluate the geological model and structural controls on
the Platanares geothermal system. In order to quantitatively interpret the gravity data along with the 3D resistivity model, 34 core
samples and 18 hand samples of the lithologies at Platanares were collected from the field for density measurement. The gravity data
were modelled along five cross-sections and compared to the resistivity model. There is a strong correlation between the thickness of
conductive features (< 6 ohm*m) and negative gravity anomalies throughout the survey area. This indicates that both the MT data and
gravity data can be explained by changes in the thickness of the Padre Miguel tuff rather than alteration. The five cross-sections were
used to derive a 3D lithology model, which was used as a starting model for 3D finite element inversion in Oasis montaj. The results of
this study suggest a small horst feature exists on the west side of the field and that the entire study area is tilted down towards the SE
with tuffs thickening and possibly changing to a lower density composition towards the SE (Figure 6).
Figure 5 – Map showing complete Bouguer gravity, MT stations, and profile line location at Platanares.
Page 6
Fercho et al.
6
Figure 6 - Profile 1 cross-section looking NE at PLTG-1, OP-3, PLTG-3, and OP-2. Yellow contour represents conductive
features less than 6 ohm*m from 3D MT inversion. Both the MT and gravity data show a deepening of the Padre Miguel
tuffs towards the SE.
4. DRILLING RESULTS
4.1 Southern Field
In late January/early February 2014 Ormat management, geologists, and geophysicist visited Platanares for a field overview, mapping of
geologic structures, core logging, and magnetics survey. Progress was good with improved understanding of controlling structures,
PLTG-1 and PLTG-3 permeable zones, and future drilling targets. During the field visit the group agreed to focus on drilling the first
full-size well at the OP-3 location followed by a slim well to locate injection in the southern part of the field. Field work focused on
mapping of lithology and fault orientations guided by existing geologic maps. Most faults were confirmed and their extent improved. A
major northwest-striking, west-dipping fault was identified correlating with alteration and thermal springs at the surface, called the
Waterfall Fault. This fault also projected to the permeable fracture zone in PLTG-1. OP-3 was planned to target the Waterfall Fault at
2220 ft. A shallower fault was also anticipated at approximately 1200 ft. depth.
The OP-3 well (Figure 2) encountered gravel and terrace deposits for 160 ft. before entering the Padre Miguel tuffs to total depth (TD).
Silica alteration within the tuffs starting around 600 ft. caused slow drilling for the remainder of the well until a drilling break and full
loss of circulation occurred at 1226 ft. Drilling continued with full losses and additional drilling breaks to 1355 ft. TD. Maximum
temperature in the well was measured at 162°C, and a flow test showed very high productivity (>500 GPM/psi and predicting ~10 MW
production). An acoustic image log was attempted in order to measure the orientation of the main production fracture, however the
large 20 inch diameter of the well combined with an obstruction at the casing shoe resulted in poor log quality.
Following the success of OP-3, an exploration injection well was targeted to intersect mapped structures at the southern OP-2 site. Upon
completion OP-2 was found to have very low permeability with maximum temperature measured 93°C with a conductive profile,
suggesting it was located outside the geothermal system. OP-4 was then targeted to locate injection with the goal of minimizing
geologic, reservoir, and drilling risks after the unsuccessful results of OP-2. The recommended target was the permeable zone identified
in the PLTG-3 core well by LANL. The well was planned to directionally target this zone within 50 ft. of PLTG-3 in order to provide
the lowest possible geologic risk to locate injection, while still being far enough from OP-3 to prevent cooling. While drilling OP-4, the
only loss in the well occurred during a small drilling break at 2569 ft. when there was a 20 barrels per hour (bph) loss. This depth was
also found to be a feed zone in the flowing temperature log. Maximum temperature was measured at 150°C during an initial flowing
pressure-temperature (PT) and build up test completed in the well. The injectivity was better but not sufficient to support injection for
the project.
Page 7
Fercho et al.
7
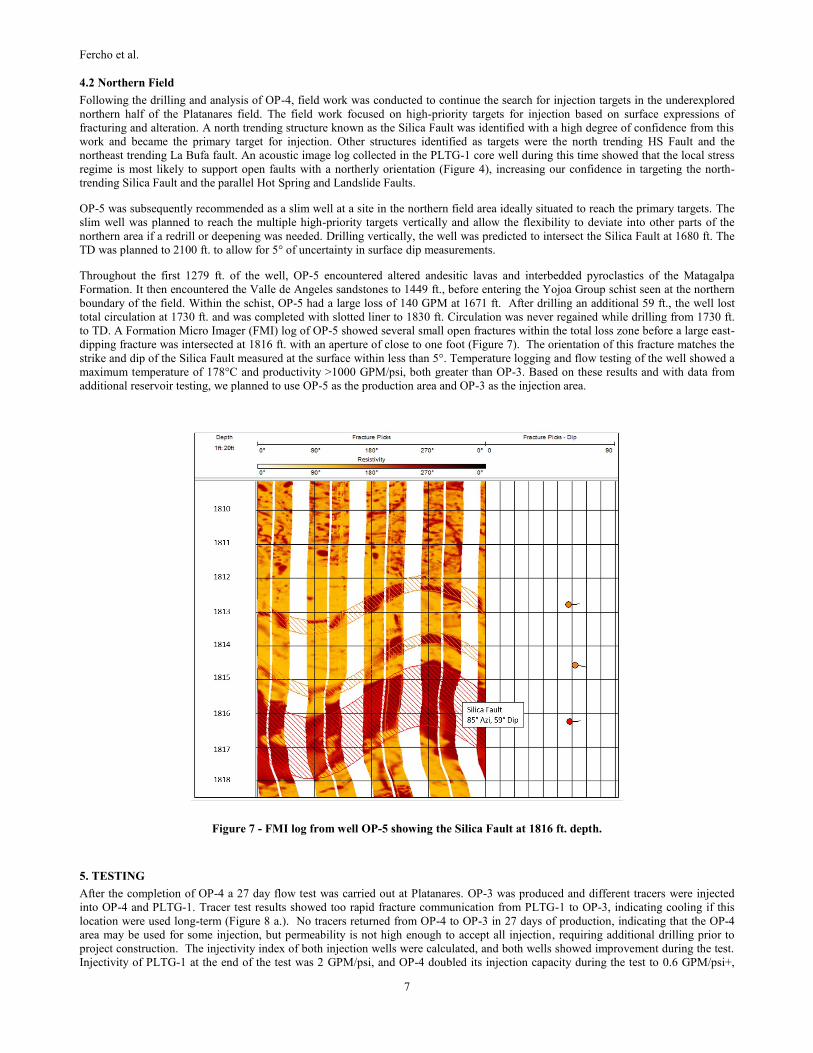
4.2 Northern Field
Following the drilling and analysis of OP-4, field work was conducted to continue the search for injection targets in the underexplored
northern half of the Platanares field. The field work focused on high-priority targets for injection based on surface expressions of
fracturing and alteration. A north trending structure known as the Silica Fault was identified with a high degree of confidence from this
work and became the primary target for injection. Other structures identified as targets were the north trending HS Fault and the
northeast trending La Bufa fault. An acoustic image log collected in the PLTG-1 core well during this time showed that the local stress
regime is most likely to support open faults with a northerly orientation (Figure 4), increasing our confidence in targeting the north-
trending Silica Fault and the parallel Hot Spring and Landslide Faults.
OP-5 was subsequently recommended as a slim well at a site in the northern field area ideally situated to reach the primary targets. The
slim well was planned to reach the multiple high-priority targets vertically and allow the flexibility to deviate into other parts of the
northern area if a redrill or deepening was needed. Drilling vertically, the well was predicted to intersect the Silica Fault at 1680 ft. The
TD was planned to 2100 ft. to allow for 5° of uncertainty in surface dip measurements.
Throughout the first 1279 ft. of the well, OP-5 encountered altered andesitic lavas and interbedded pyroclastics of the Matagalpa
Formation. It then encountered the Valle de Angeles sandstones to 1449 ft., before entering the Yojoa Group schist seen at the northern
boundary of the field. Within the schist, OP-5 had a large loss of 140 GPM at 1671 ft. After drilling an additional 59 ft., the well lost
total circulation at 1730 ft. and was completed with slotted liner to 1830 ft. Circulation was never regained while drilling from 1730 ft.
to TD. A Formation Micro Imager (FMI) log of OP-5 showed several small open fractures within the total loss zone before a large east-
dipping fracture was intersected at 1816 ft. with an aperture of close to one foot (Figure 7). The orientation of this fracture matches the
strike and dip of the Silica Fault measured at the surface within less than 5°. Temperature logging and flow testing of the well showed a
maximum temperature of 178°C and productivity >1000 GPM/psi, both greater than OP-3. Based on these results and with data from
additional reservoir testing, we planned to use OP-5 as the production area and OP-3 as the injection area.
Figure 7 - FMI log from well OP-5 showing the Silica Fault at 1816 ft. depth.
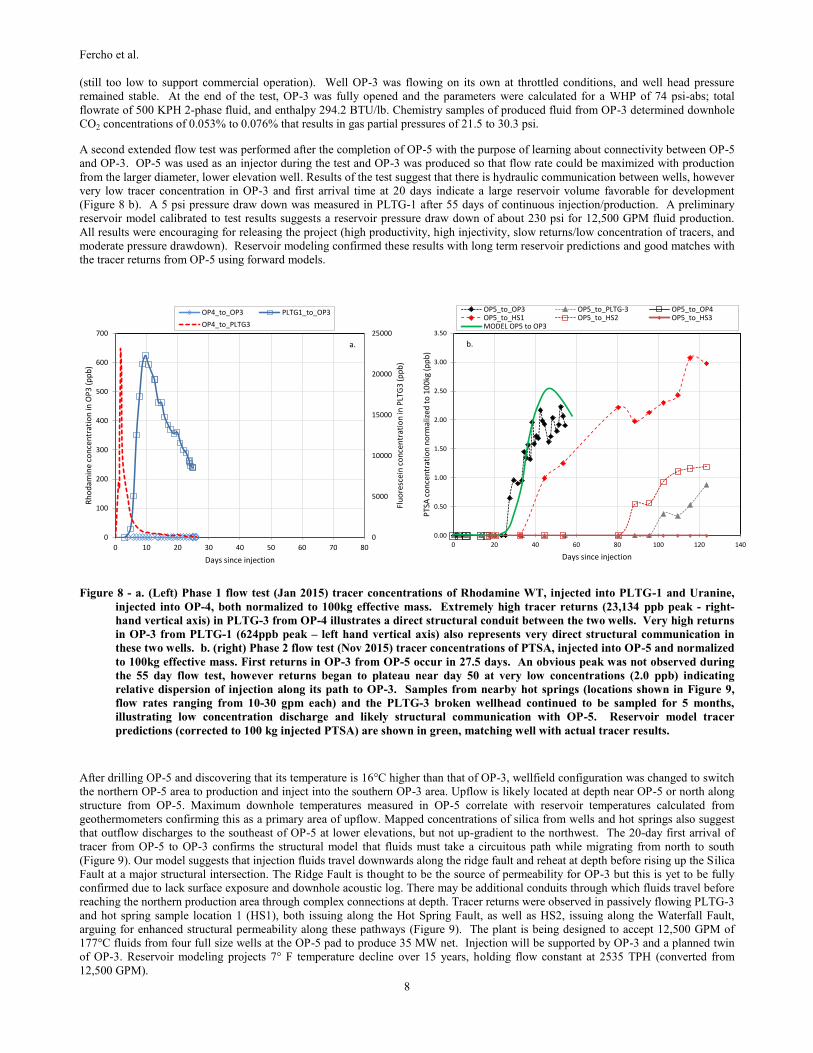
5. TESTING
After the completion of OP-4 a 27 day flow test was carried out at Platanares. OP-3 was produced and different tracers were injected
into OP-4 and PLTG-1. Tracer test results showed too rapid fracture communication from PLTG-1 to OP-3, indicating cooling if this
location were used long-term (Figure 8 a.). No tracers returned from OP-4 to OP-3 in 27 days of production, indicating that the OP-4
area may be used for some injection, but permeability is not high enough to accept all injection, requiring additional drilling prior to
project construction. The injectivity index of both injection wells were calculated, and both wells showed improvement during the test.
Injectivity of PLTG-1 at the end of the test was 2 GPM/psi, and OP-4 doubled its injection capacity during the test to 0.6 GPM/psi+,
Page 8
Fercho et al.
8
(still too low to support commercial operation). Well OP-3 was flowing on its own at throttled conditions, and well head pressure
remained stable. At the end of the test, OP-3 was fully opened and the parameters were calculated for a WHP of 74 psi-abs; total
flowrate of 500 KPH 2-phase fluid, and enthalpy 294.2 BTU/lb. Chemistry samples of produced fluid from OP-3 determined downhole
CO2 concentrations of 0.053% to 0.076% that results in gas partial pressures of 21.5 to 30.3 psi.
A second extended flow test was performed after the completion of OP-5 with the purpose of learning about connectivity between OP-5
and OP-3. OP-5 was used as an injector during the test and OP-3 was produced so that flow rate could be maximized with production
from the larger diameter, lower elevation well. Results of the test suggest that there is hydraulic communication between wells, however
very low tracer concentration in OP-3 and first arrival time at 20 days indicate a large reservoir volume favorable for development
(Figure 8 b). A 5 psi pressure draw down was measured in PLTG-1 after 55 days of continuous injection/production. A preliminary
reservoir model calibrated to test results suggests a reservoir pressure draw down of about 230 psi for 12,500 GPM fluid production.
All results were encouraging for releasing the project (high productivity, high injectivity, slow returns/low concentration of tracers, and
moderate pressure drawdown). Reservoir modeling confirmed these results with long term reservoir predictions and good matches with
the tracer returns from OP-5 using forward models.
Figure 8 - a. (Left) Phase 1 flow test (Jan 2015) tracer concentrations of Rhodamine WT, injected into PLTG-1 and Uranine,
injected into OP-4, both normalized to 100kg effective mass. Extremely high tracer returns (23,134 ppb peak - right-
hand vertical axis) in PLTG-3 from OP-4 illustrates a direct structural conduit between the two wells. Very high returns
in OP-3 from PLTG-1 (624ppb peak – left hand vertical axis) also represents very direct structural communication in
these two wells. b. (right) Phase 2 flow test (Nov 2015) tracer concentrations of PTSA, injected into OP-5 and normalized
to 100kg effective mass. First returns in OP-3 from OP-5 occur in 27.5 days. An obvious peak was not observed during
the 55 day flow test, however returns began to plateau near day 50 at very low concentrations (2.0 ppb) indicating
relative dispersion of injection along its path to OP-3. Samples from nearby hot springs (locations shown in Figure 9,
flow rates ranging from 10-30 gpm each) and the PLTG-3 broken wellhead continued to be sampled for 5 months,
illustrating low concentration discharge and likely structural communication with OP-5. Reservoir model tracer
predictions (corrected to 100 kg injected PTSA) are shown in green, matching well with actual tracer results.
After drilling OP-5 and discovering that its temperature is 16°C higher than that of OP-3, wellfield configuration was changed to switch
the northern OP-5 area to production and inject into the southern OP-3 area. Upflow is likely located at depth near OP-5 or north along
structure from OP-5. Maximum downhole temperatures measured in OP-5 correlate with reservoir temperatures calculated from
geothermometers confirming this as a primary area of upflow. Mapped concentrations of silica from wells and hot springs also suggest
that outflow discharges to the southeast of OP-5 at lower elevations, but not up-gradient to the northwest. The 20-day first arrival of
tracer from OP-5 to OP-3 confirms the structural model that fluids must take a circuitous path while migrating from north to south
(Figure 9). Our model suggests that injection fluids travel downwards along the ridge fault and reheat at depth before rising up the Silica
Fault at a major structural intersection. The Ridge Fault is thought to be the source of permeability for OP-3 but this is yet to be fully
confirmed due to lack surface exposure and downhole acoustic log. There may be additional conduits through which fluids travel before
reaching the northern production area through complex connections at depth. Tracer returns were observed in passively flowing PLTG-3
and hot spring sample location 1 (HS1), both issuing along the Hot Spring Fault, as well as HS2, issuing along the Waterfall Fault,
arguing for enhanced structural permeability along these pathways (Figure 9). The plant is being designed to accept 12,500 GPM of
177°C fluids from four full size wells at the OP-5 pad to produce 35 MW net. Injection will be supported by OP-3 and a planned twin
of OP-3. Reservoir modeling projects 7° F temperature decline over 15 years, holding flow constant at 2535 TPH (converted from
12,500 GPM).
0.00
0.50
1.00
1.50
2.00
2.50
3.00
3.50
0 20 40 60 80 100 120 140
PTS
A c
on
cen
trat
ion
no
rmal
ized
to
10
0kg
(p
pb
)
Days since injection
OP5_to_OP3 OP5_to_PLTG-3 OP5_to_OP4OP5_to_HS1 OP5_to_HS2 OP5_to_HS3MODEL OP5 to OP3
0
5000
10000
15000
20000
25000
0
100
200
300
400
500
600
700
0 10 20 30 40 50 60 70 80
Flu
ore
scei
n c
on
cen
trat
ion
in P
LTG
3 (p
pb
)
Rh
od
amin
e co
nce
ntr
atio
n in
OP
3 (
pp
b)
Days since injection
OP4_to_OP3 PLTG1_to_OP3
OP4_to_PLTG3
b.a.
Page 9
Fercho et al.
9
Figure 9 – Map showing least-squares gridded hot spring and well SiO2 concentrations at Platanares. Highest hot spring SiO2
concentrations occur downstream of OP-5 at lower elevations, illustrating the likely path of outflow. White triangles
show the locations of hot spring tracer samples. No tracer returns or high concentrations of silica occur near HS3, up-
gradient of OP5. Bold black line shows hypothesized flow path of tracer from OP-5 to OP-3 along fault planes at depth.
Silica values compiled from Janik et al (1991), Cioni et al (2007), and this study.
6. CONCLUSIONS
Extensive exploration work has proven an economic geothermal system at Platanares, Honduras. Geochemical, geophysical, and
geologic field mapping were integrated in a 3D model for the selection of drilling targets, with attention to structural environment and
fracture orientations. Reservoir temperatures match closely with those predicted by geothermometry estimations. Drilling in the
northern part of the field identified production with high flow rates and greater than 177°C reservoir temperatures. In the southern
Page 10
Fercho et al.
10
portion of the field at OP-3, high permeability injection was shown to be favorably connected to the reservoir with a long flow path
indicated by slow tracer returns. Long flow paths will allow sufficient heating before injection fluid returns to production area.
Continuous revision of the geologic model, drilling targets, and reservoir model were integral to successful field exploration and
development. Full-size production and injection drilling is nowunderway and nearly complete, with Honduras’s first geothermal power
plant expected to begin producing 35 MW net power in 2017.
REFERENCES
Cioni, R., Lelli, M., Manichini, M., Barbeti, F., Carapezza, M.L., Ranaldi, M., Ricci, T., Tarchini, L. and Cuellar, G.: New Geochemical
Investigations in the Platanares and Azacualpa Geothermal Sites of Honduras, Unpublished report to ELCOSA, (2007), 58p.
Eppler, D., Fakundiny, R. and Ritchie, A.: Reconnaissance Evaluation of Honduran Geothermal Sites, Los Alamos National Lab Report,
(1986), LA-10685-MS, 12 pp.
Fournier, R.O.: Application of Water Geochemistry to Geothermal Exploration and Reservoir Engineering, in Geothermal Systems:
Principles and Case Histories, Ryback and Muffler eds., John Wiley and Sons, NY, (1981), 109-143.
Giggenbach, W.F., Gonfiantini, R., Jangi, B.L., and Truedell, A.H.: Isotopic and chemical composition of Parbati Valley geothermal
discharges, NM Himalaya, India, Geothermics, (1983), 12, 199-222.
Goff, S., Rufenacht, H., Laughlin, A., Adams, A., Planner, H. and Ramos, N.: Geothermal core hole drilling and operations, Platanares,
Honduras, Central America, Geothermal Resource Council Transactions, (1987), 11:37.
Goff, F., Truesdell, A., Grigsby, C., Janik, C., Shevenell, L., Parades, R., Gutierrez, J., Trujillo, P. and Counce, D.: Hydrogeochemical
Investigation of Six Geothermal Sites in Honduras, Central America, Los Alamos National Lab Report, (1987b.), LA-10785-
Goff, F., Truesdell, A., Shevenell, L., Janik, c., Grigsby, C., Parades, R., Trujillo, P., Counce, D., Gutierrez, J., Adams, A., Urbani, F.
and Perdomo, R.,: Hydrogeochemical Report of the Second Honduras Sampling Trip, January-February, 1986, Los Alamos
National Lab. Report, (1988b), 105 pp., (unpublished).
Goff, S., Laughlin, A., Rufenacht, H., Goff, F., Heiken, G., Adams, A., Musgrave, J., Planner, H. and Ramos, N.: Exploration
Geothermal Gradient Drilling, Platanares, Honduras, Central America, Los Alamos National Lab Report, (1988), LA-I 1349-MS,
29 pp.
Goff F., Goff, S., Kelkar S., Shevenell L., Truesdell A., Musgrave J., Rüfenacht, H., and Flores, W.: Exploration Drilling and Reservoir
Model of the Platanares Geothermal System, Honduras, Central America, Journal of Volcanology and Geothermal Research,
(1991), 45: 101 – 123.
Heiken, G., Eppler, D., Wohletz, K., Flores, W., Ramos, N. and Ritchie, A.: 1986. Geology of the Platanares geothermal Site,
Departamento de Copan, Honduras, Central America. Los Alamos National Lab Report, (1986), LA- 10634-MS, 24 pp.
Heiken, G., Duffield, W., Wohletz, K., Priest, S., Ramos, N., Flores, W., Eppler, D., Ritchie, A. and Escobar, C.: Geology of the
Platanares Geothermal Area, Copan, Honduras, Geothermal Resource Council Transactions, (1987), 11: 263 - 266.
Heiken, G., Ramos, N., Duffield, W., Musgrave, J., Wohletz, K., Priest, S., Aldrich, J., Flores, W., Ritchie, A., Goff, F., Eppler, D. and
Escobar, C.: Geology of the Platanares Geothermal area, Departamento de Copan, Honduras, Journal of Volcanology and
Geothermal Research, (1991), 45: 41- 58.
Janik, C.J., Truesdell, A.H., Goff, F., Shevenell, L., Stallard, M.L., Trujillo Jr., P.E. and Counce, D.: A Geochemical Model of the
Platanares Geothermal System, Honduras. In: F. Goff (Editor), Honduras - A Geothermal Investigation, Journal of Volcanology
and Geothermal Research, (1991), 45: 125-146.