EXPLORING A MEASURE OF MATERNAL ORIENTATION IN FIRST TIME MOTHERS By Charlie Marie Bamford A thesis submitted to the University of Birmingham for the degree of MASTER OF RESEARCH (Clinical Psychology) School of Psychology College of Life and Environmental Sciences University of Birmingham September 2014 Word count: 15,000 (Excluding preliminaries, figures, references and appendices)
Transcript
EXPLORING A MEASURE OF MATERNAL ORIENTATION IN FIRST TIME
MOTHERS
By
Charlie Marie Bamford
A thesis submitted to the University of Birmingham for the degree of
MASTER OF RESEARCH
(Clinical Psychology)
School of Psychology
College of Life and Environmental Sciences
University of Birmingham
September 2014
Word count: 15,000
(Excluding preliminaries, figures, references and appendices)
University of Birmingham Research Archive
e-theses repository This unpublished thesis/dissertation is copyright of the author and/or third parties. The intellectual property rights of the author or third parties in respect of this work are as defined by The Copyright Designs and Patents Act 1988 or as modified by any successor legislation. Any use made of information contained in this thesis/dissertation must be in accordance with that legislation and must be properly acknowledged. Further distribution or reproduction in any format is prohibited without the permission of the copyright holder.
ACKNOWLEDGEMENTS
I would like to thank Prof. Stephen Wood and Dr. Ashleigh Lin for their support,
guidance and feedback throughout placement one. The skills they have equipped me
with have been invaluable in both completing this thesis and subsequently securing a
job in research, post-masters. Secondly, I would like to thank Ms Lucy Murry for
agreeing to supervise me as part of her Clin.Psy.D thesis. Her positive attitude towards
research and recruitment made the process a pleasurable experience, despite its
frequent frustrations. I would subsequently like to thank Dr. Ruth Butterworth for her
understanding, in depth feedback, encouragement, and commitment to her students.
Her supervision surpasses expectation and for that, I am forever grateful.
This year has been eventful; however with the support of my supervisors and various
non-faculty members, I am able to proudly submit this thesis for the degree of Master of
Research.
CONTENTS
Introduction 1
Chapter 1: The transition to psychosis of a girl initially presenting with depression
and anxiety: Is preventative intervention in the treatment of psychosis necessary?
Introduction 5
Case Introduction 7
Measures 7
Baseline 7
Three months 9
Six months 10
Twelve months 12
Discussion 16
Placement Reflection 20
Chapter 2: The usefulness of the diagnosis “Acute and Transient Psychotic
Disorder” in a Mother and Baby unit
Introduction 24
Methods 32
Results 35
Conclusion 39
Limitations 40
Personal reflection 42
Chapter 3: Exploring a measure of maternal orientation in first time mothers
Introduction 46
Methods 55
Results 61
Conclusion 72
Appendicies to Chapter 3
Appendix 1: AMOM-R 84
Appendix 2: Frequencies of responses to AMOM-R regulator subscale 85
References
References: Chapter 1 86
References: Chapter 2 87
References: Chapter 3 88
1
Introduction
This masters course marked the beginning of my personal development in
clinical psychology. Upon starting the course, I had three learning objectives. The first of
these was to develop an understanding of the role of clinical psychology, and clinical
research, in an NHS setting. The second objective was to diversify my experience of
working with patient populations, and finally, to develop confidence and competence in
conducting a research study and performing data analysis.
Prior to commencing the Clinical MRes, my professional clinical experience was
heavily focused on work with Autistic Spectrum Disorders. Moreover, it was restricted
to non-medical settings which prevented me from observing the role of the NHS, and
clinical psychology, in the treatment of these disorders. Furthermore, with the intention
of pursuing a career in clinical psychology, I deemed it important to broaden my patient
interests, whilst also working in a variety of settings. Most importantly, I wished to take
part in clinical research being conducted within an NHS setting out of personal interest. I
aspire to a career as a clinical psychologist, however maintain strong enthusiasm for
research. Being able to endorse both of these in a career would be ideal, thus,
determining the possibility of this was an objective of this course.
My first placement focused on whether earlier intervention in psychosis would
be advantageous. Having completed a psychosis module as part of my undergraduate
degree, I felt well equipped for this placement. This placement allowed me to take my
theoretical knowledge and apply it to a clinical research setting. I was able to interact
with a new patient population and develop skills in recruitment. Furthermore, this
placement provided me with invaluable training on standardized measures in psychosis.
Due to the large team involved in this placement it was difficult to ensure that my
personal development needs were met, thus I have learned the importance of regular
supervision.
My second research project focused on Acute and Transient Psychotic Disorder in
a Mother and Baby Unit, and the extent to which it overlaps with Postpartum Psychosis.
This was a highly beneficial prelude to conducting my third, larger project. It enabled me
to design and manage a project primarily on my own within an NHS setting. This project
increased my confidence in my own abilities to identify a gap in research and design a
study based on this. Moreover, it allowed me insight into the role of a clinical
2
psychologist, and a clinical researcher, in the NHS. Working with this team reflected the
various roles of an interdisciplinary team whilst also allowing me to meet with
inpatients experiencing psychosis. My first placement had focused on non-specific early
symptoms of psychosis, whilst this second placement presented a logical progression
into intense symptoms and their effects on an individual’s life and functioning. Prior to
this placement, I was less sensitive to the impact of mental illness on an individuals life. I
am now more appreciative of this, a skill much required of a clinical psychologist, or
researcher.
My final project sealed my confidence in my abilities to conduct and analyse
research. This project involved active recruitment from the normal population in order
to explore a measure of maternal orientation. Whilst I was able to draw upon my
previous recruitment experience, I was also aware of my own hesitation to approach
individuals in a less structured setting. Thus, it became a personal goal to improve my
confidence in initially approaching potential participants. The final number of
participants recruited into this study demonstrates to me that I achieved this goal. This
project exposed me to the true nature of research; recruitment is often slow and
frustrating, however the end result provides a sense of accomplishment.
A key learning curve from this study was maintaining an up to date database. In
previous studies this was maintained by another individual, or not required. I now place
great emphasis on my data input and will continue to do so in future employment.
Having learned from previous experience, I was able to make much better use of
supervision, resulting in a more comprehensive piece of work.
I initially expected a postgraduate course to be highly intense, however I was able
to use my role on the course, and interest in research, to secure an honorary assistant
psychologist position at the Barberry Eating Disorder Clinic. Without the Clinical MRes, I
do not believe this would have been possible. Prior to this course, time keeping was a
particular flaw of mine, however my determination to succeed in this field and welcome
every opportunity available ensured that this skill was readily acquired. I am proud that
I was able to complete my masters, as well as a six month assistant placement. This
assistant placement allowed me to practice the skills I was acquiring on my masters in
the workplace, whilst also furthering my understanding of clinical psychology, and
broadening my client experience.
3
Overall, I believe I have completed the personal objectives I initially outlined for
myself. I now have confidence in my own ability to conduct research. I broadened my
patient experience whilst on the MRes, however this was also predominantly in
psychosis, therefore I believe I should focus further on working with a variety of
populations. I feel the MRes has provided me with a range of skills that would be
essential for clinical practice and research. I have taken the theory from my
undergraduate degree and used it in practice, making me a more well rounded
researcher and person.
4
Chapter 1: The transition to psychosis of a girl initially presenting with depression
and anxiety: Is preventative intervention in the treatment of psychosis necessary?
5
Introduction
“Psychosis” is an umbrella term used to describe a number of psychotic
symptoms, such as hallucinations and delusions, which may affect perception, thinking,
emotions and behaviour. Symptoms of psychosis typically emerge between the ages of
15-24, with an incidence of 31 cases per 200,000 in the UK (Kirkbride et al., 2012).
Episodes of psychosis can be caused by an underlying illness such as schizophrenia,
however the presence of psychotic symptoms does not necessarily indicate mental
illness. 5-8% of the general population experience psychotic symptoms such as
hallucinating scintillations during a migraine (Allardyce, Suppes & Van Os., 2007), but
are not considered mentally unwell (Kelleher, Jenner & Cannon, 2010).
For symptoms of psychosis to be considered severe, and receive medical
intervention, they must be present for a prolonged duration, include positive symptoms
and cause a decrease in psychosocial function (Yung & McGorry, 1996). Thus, many
people experience mild psychotic symptoms with little or no intervention.
McGorry et al. (2006) argue that earlier intervention will result in less invasive
treatments and substantially improve prognosis. McGorry et al. (2006) outlines four
clinical stages of psychotic disorders. Stage zero characterises individuals not currently
exhibiting psychotic symptoms, however have elevated risk due to immediate family
members experiencing psychosis. Proposed stage zero interventions include mental
health education, drug education, and brief cognitive skills training. Stage 1a identifies
individuals experiencing mild decline in function or non-specific symptoms such as
depression or anxiety. Whilst there is no guarantee these symptoms will progress to
psychosis, cognitive-behavioural therapy and psychoeducation could reduce this risk.
Stage 1b is the final stage preceding first-episode psychosis. It is termed the ultra-high-
6
risk stage. Yung et al. (2007) further specify that stage 1b individuals have a state, rather
than trait risk; meaning current mental health is a risk factor. Yung et al., (2010) argue
that diagnostic manuals should include a “risk syndrome for psychosis”.
State risk can be determined using the Comprehensive Assessment of At-Risk
Mental States (CAARMS; Yung et al., 2005): a diagnostic tool assessing psychotic
features, including perceptual abnormalities and non-bizarre beliefs. For individuals to
be considered psychotic using this measure, symptoms must endure for one week and
occur 3-6 times a week for over an hour, or daily for less than an hour. The CAARMS
distinguishes individuals that would be considered psychotic, receiving an intensity
value of 6, from non-psychotic individuals receiving an intensity value of 5 (severe). This
is, however, a thin subjective margin. This assessment highlights individuals
experiencing severe psychotic symptoms, however if they do not occur frequently
enough to meet the psychotic intensity criteria, they will not receive the same treatment
as someone with the same symptoms that may be marginally more frequent. Thus,
McGorry et al.’s (2006) notion of treating ultra-high-risk individuals, rather than
awaiting a first episode of psychosis, appears more credible.
In order to fully comprehend psychosis, as described in the literature, an in depth
case study was conducted using the data from an individual that was assessed over
twelve months. This case study demonstrates the various stages of psychosis, as
outlined by McGorry et al (2006) and portrays an individual transitioning from the
ultra-high-risk category, to first episode psychosis.
Case Introduction
The Transitions project at the University of Birmingham identifies individuals
with non-specific symptoms, such as depression and anxiety, or specific psychotic
7
symptoms, through YouthSpace and follows their progress over a twelve month period.
YouthSpace is a service for 16-25 year olds within Birmingham and Solihull Mental
Health foundation Trust. It provides clinical services for individuals with mental health
difficulties that are referred by their GP.
The study conducts regular assessments including measures of psychotic
symptoms and psychosocial functioning measures. Over twelve months the researchers
are able to observe any progression or improvement in an individual’s symptoms.
Case Selection
For this case study, Jamila (a pseudonym) was selected. Jamila had completed
nine months of assessments with other researchers in the team and was due her final
twelve month assessment within the timeframe for this report. This provided an
opportunity for myself to conduct the final assessment and utilize the previous
assessments to generate a year summary of Jamila’s progress. This would give a holistic
impression of the life of an individual experiencing psychosis.
Background
Jamila is a 19 year-old British female of Asian-Bangladeshi ethnicity, born in the
UK. She is an only child and lives with her parents, who were born in Bangladesh. She
has a long-term boyfriend and does not drink, smoke or use recreational drugs. She has
recently completed her A-Levels and is revising for re-sits. Jamila first visited her GP in
May, 2012, regarding self-harm and depression. She described a breakdown in June
2012 and was prescribed 40mg fluxotrine, which she had taken for six months when she
initially took part in this study in November 2012.
8
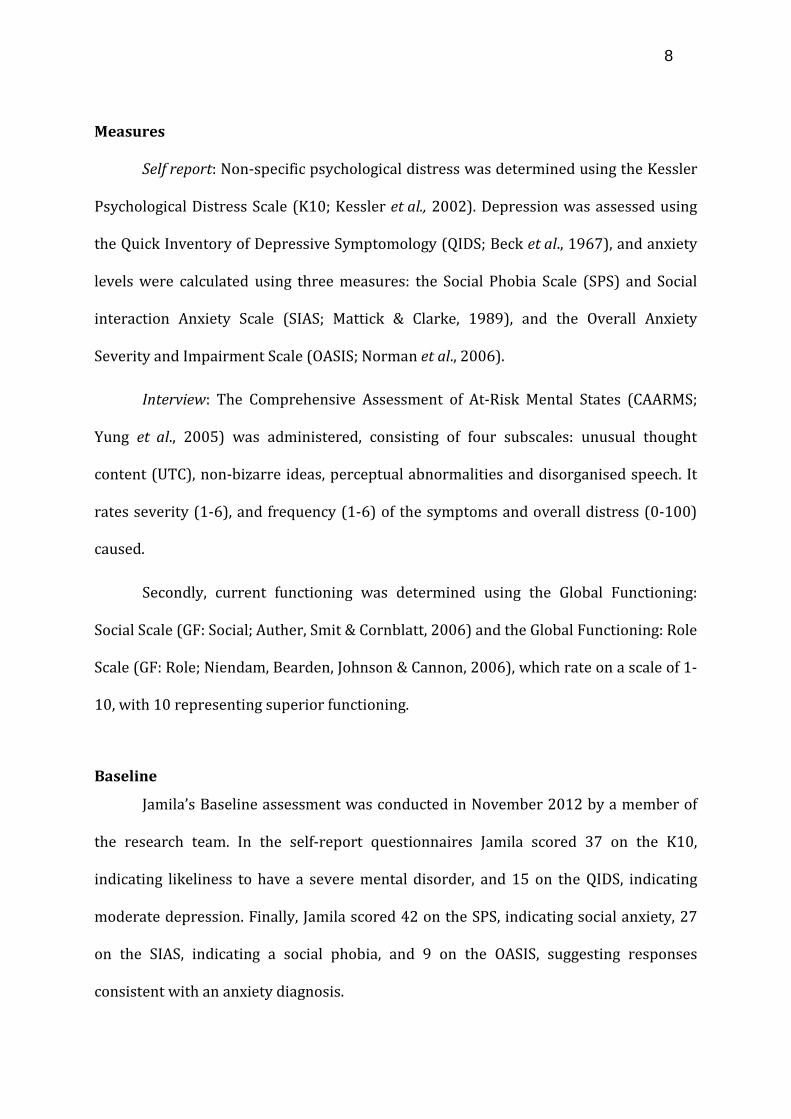
Measures
Self report: Non-specific psychological distress was determined using the Kessler
Psychological Distress Scale (K10; Kessler et al., 2002). Depression was assessed using
the Quick Inventory of Depressive Symptomology (QIDS; Beck et al., 1967), and anxiety
levels were calculated using three measures: the Social Phobia Scale (SPS) and Social
interaction Anxiety Scale (SIAS; Mattick & Clarke, 1989), and the Overall Anxiety
Severity and Impairment Scale (OASIS; Norman et al., 2006).
Interview: The Comprehensive Assessment of At-Risk Mental States (CAARMS;
Yung et al., 2005) was administered, consisting of four subscales: unusual thought
content (UTC), non-bizarre ideas, perceptual abnormalities and disorganised speech. It
rates severity (1-6), and frequency (1-6) of the symptoms and overall distress (0-100)
caused.
Secondly, current functioning was determined using the Global Functioning:
Social Scale (GF: Social; Auther, Smit & Cornblatt, 2006) and the Global Functioning: Role
Scale (GF: Role; Niendam, Bearden, Johnson & Cannon, 2006), which rate on a scale of 1-
10, with 10 representing superior functioning.
Baseline
Jamila’s Baseline assessment was conducted in November 2012 by a member of
the research team. In the self-report questionnaires Jamila scored 37 on the K10,
indicating likeliness to have a severe mental disorder, and 15 on the QIDS, indicating
moderate depression. Finally, Jamila scored 42 on the SPS, indicating social anxiety, 27
on the SIAS, indicating a social phobia, and 9 on the OASIS, suggesting responses
consistent with an anxiety diagnosis.
9
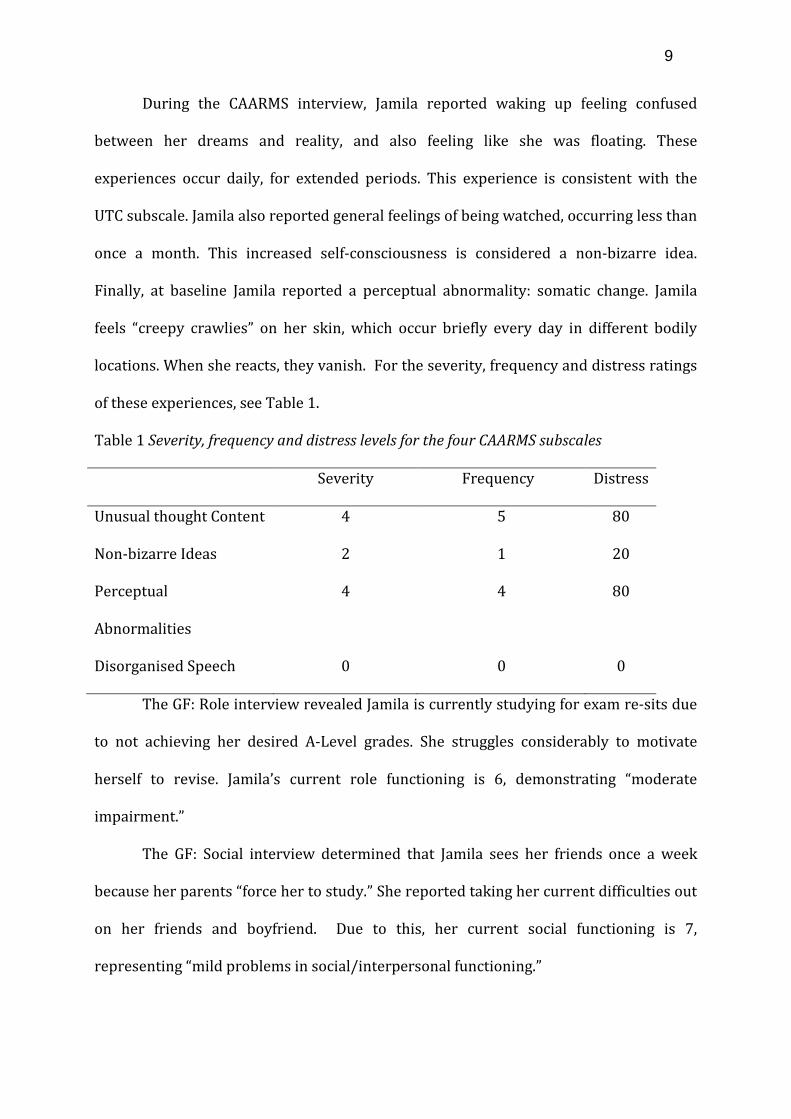
During the CAARMS interview, Jamila reported waking up feeling confused
between her dreams and reality, and also feeling like she was floating. These
experiences occur daily, for extended periods. This experience is consistent with the
UTC subscale. Jamila also reported general feelings of being watched, occurring less than
once a month. This increased self-consciousness is considered a non-bizarre idea.
Finally, at baseline Jamila reported a perceptual abnormality: somatic change. Jamila
feels “creepy crawlies” on her skin, which occur briefly every day in different bodily
locations. When she reacts, they vanish. For the severity, frequency and distress ratings
of these experiences, see Table 1.
Table 1 Severity, frequency and distress levels for the four CAARMS subscales
Severity Frequency Distress
Unusual thought Content 4 5 80
Non-bizarre Ideas 2 1 20
Perceptual
Abnormalities
4 4 80
Disorganised Speech 0 0 0
The GF: Role interview revealed Jamila is currently studying for exam re-sits due
to not achieving her desired A-Level grades. She struggles considerably to motivate
herself to revise. Jamila’s current role functioning is 6, demonstrating “moderate
impairment.”
The GF: Social interview determined that Jamila sees her friends once a week
because her parents “force her to study.” She reported taking her current difficulties out
on her friends and boyfriend. Due to this, her current social functioning is 7,
representing “mild problems in social/interpersonal functioning.”
10
Three months
Jamila’s three-month follow up took place in February 2013 during which the
same assessments were administered. Jamila reported no lifestyle changes since
baseline and her mental health was “about the same.” Her K10 score increased,
remaining indicative of a severe mental health disorder, whilst her QIDS score remained
in the range for moderate depression. Jamila’s SPS and SIAS scores increased however
remained in the ranges indicating high social phobia and social anxiety. A reliable
change index calculation of 7.72 shows Jamila’s social anxiety increase was highly
significant in the past three months. Her OASIS score marginally decreased, but did not
affect the range category.
During the CAARMS interview, Jamila reported feeling “vaguely disorientated” on
a daily basis, for between thirty minutes to one hour. This experience is consistent with
UTC phenomena, however is less intense than previously reported UTC at baseline.
Jamila described a non-specific feeling of being watched. She was able to
question the feeling but cannot “shake it.” It occurs several times every day. Jamila’s
ability to question her experience demonstrates a non-bizarre idea with no delusional
conviction. Her severity score of 5 is an increase from baseline and places Jamila in the
ultra-high-risk category for psychosis. The reliable change index is an effective method
for measuring change in a single individual (Jacobson & Truax, 1991). According to this
theory, an index score greater than 1.96 indicates a significant change in scores. A
reliable change index was calculated for Jamila’s scores for non-bizarre ideas at baseline
and three months, and emerged as 2.28. This demonstrates that the increase in Jamila’s
non-bizarre ideas is significant.
Jamila also reported hearing music and people speaking however cannot make
out what the voices say. They are clear for a period and then fade slowly, which reminds
11
her they are not real. This occurs for a few minutes every day. These experiences rated 4
on the perceptual abnormalities subscale. For this subscale, a score of 5, rather than 6,
indicates psychotic, therefore Jamila is considered ultra-high-risk for psychosis on a
second subscale. For CAARMS ratings see Table 2.
Table 2 Severity, frequency and distress ratings for CAARMS subscales at three months
Severity Frequency Distress
UnusualThought Content 2 4 10
Non-bizarre Ideas* 5 5 85
Perceptual
Abnormalities*
4 4 30
Disorganised Speech 0 0 0
* Ultra-high-risk scores
Jamila reported no change in her social life or role functioning, therefore her GF:
Social and GF: Role scores showed no change.
Six Months
Jamila’s six-month follow-up took place in May 2013. Since her last assessment
Jamila reported she had re-sat her A-Levels and was awaiting the results. She had
applied to university and had also secured a job two days a week at a photography
company.
Jamila’s K10 score returned to be consistent with that at baseline. She scored 10
on the QIDS; a decrease that now categorises Jamila with “mild” rather than “moderate”
depression. Jamila’s SPS score decreased to below baseline, however still reflects “social
anxiety.” Her SIAS score also decreased in comparison to at three-months, however
12
remained marginally higher than baseline. Finally, her OASIS score increased, returning
to baseline.
During the six-month CAARMS interview Jamila reported feeling lighter, as
though in a dream. This occurs a few times a week, varying from half an hour to all day.
This is an UTC experience outside the self, which is not held with delusional conviction.
Jamila also reported episodes of paranoia consistent with the non-bizarre ideas
subscale. She outlined that this had increased in the last three months. She is constantly
conscious of people and fears they will hurt her. Jamila is now wary of where she sits
due to wanting to know what is behind her. Although she reports a behaviour change, it
is minor rather than marked, and thoughts are not entirely held with delusional
conviction. She continues to be considered ultra-high-risk on this subscale.
In relation to the third subscale, perceptual abnormalities, Jamila reported
hearing classical music both inside and outside the house. She also hears a “demonic
growl” outside, “as though something supernatural is patrolling the streets.” She says it
“cannot be anything else.” This happens a few times a week for up to an hour. Jamila’s
experiences are true hallucinations as she can identify the classical music. She holds the
belief with some delusional conviction, however she only believes the music is real at
the time. Jamila scored a 5 for intensity, which means she has crossed the psychosis
threshold and is now considered psychotic as opposed to ultra-high-risk.
Finally, Jamila reported unintentionally typing backwards, missing words and
rearranging sentences. This happens more than four times a week for a few minutes.
There is no clear evidence of tangential ideas whilst speaking. For CAARMS assessment
ratings see Table 3.
13
Table 3 Severity, frequency and distress ratings for CAARMS subscales at six months
Severity Intensity Distress
Unusual Thought Content 4 4 50
Non-bizarre Ideas* 5 6 90
Perceptual Abnormalities** 5 4 70
Disorganised Speech 3 3 40
* = Ultra-high-risk scores ** = Psychotic scores
During the GF: Social and GF: Role interview, Jamila reported no longer taking her
problems out on her friends and that her boyfriend is now very supportive. Her social
score therefore increased from 7 at three months, to an 8, demonstrating “good social
function.” She has secured a job at a photography company two days a week. Based on
this Jamila’s role function score increased from 6, to 7, reflecting only “mild impairment”
in role function.
12 months
Jamila’s twelve-month follow-up took place in December 2013. Since her last
assessment Jamila had started university and was living in halls with four girls. She
reported that her mental health seemed “better, with some ups and downs.”
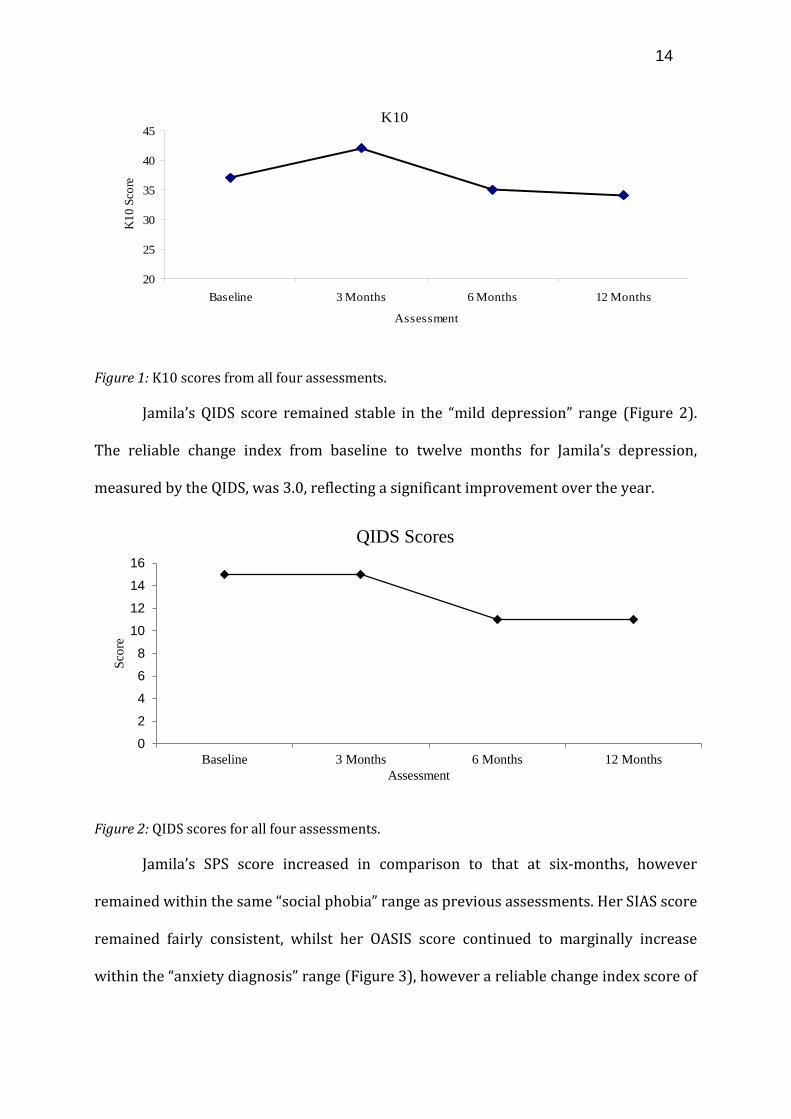
Jamila’s K10 score marginally decreased, however this did not affect the range
category. The reliable change index calculated for the K10 from baseline to twelve
months was 1.86. This is lower than the significant index of 1.96, thus, over twelve
months, Jamila showed no significant change in psychological distress (Figure 1).
14
Figure 1: K10 scores from all four assessments.
Jamila’s QIDS score remained stable in the “mild depression” range (Figure 2).
The reliable change index from baseline to twelve months for Jamila’s depression,
measured by the QIDS, was 3.0, reflecting a significant improvement over the year.
Figure 2: QIDS scores for all four assessments.
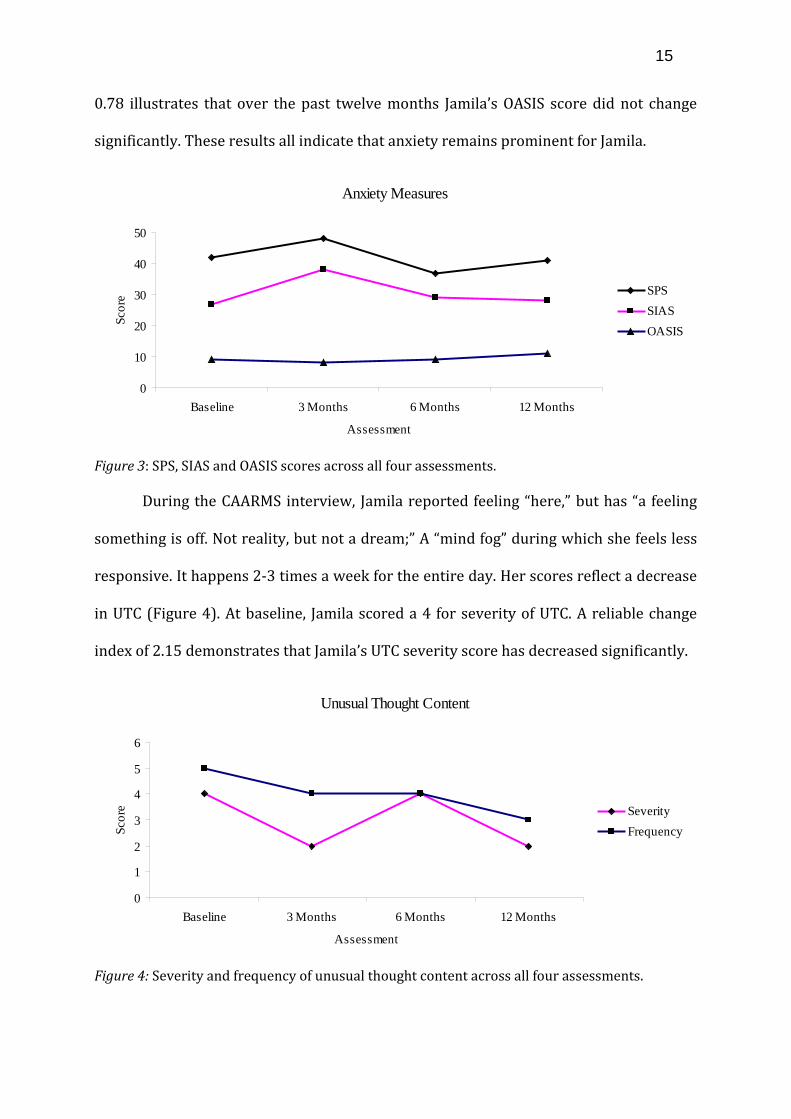
Jamila’s SPS score increased in comparison to that at six-months, however
remained within the same “social phobia” range as previous assessments. Her SIAS score
remained fairly consistent, whilst her OASIS score continued to marginally increase
within the “anxiety diagnosis” range (Figure 3), however a reliable change index score of
K10
20
25
30
35
40
45
Baseline 3 Months 6 Months 12 Months
Assessment
K10
Sco
re
0
2
4
6
8
10
12
14
16
Baseline 3 Months 6 Months 12 Months
Scor
e
Assessment
QIDS Scores
15
0.78 illustrates that over the past twelve months Jamila’s OASIS score did not change
significantly. These results all indicate that anxiety remains prominent for Jamila.
Figure 3: SPS, SIAS and OASIS scores across all four assessments.
During the CAARMS interview, Jamila reported feeling “here,” but has “a feeling
something is off. Not reality, but not a dream;” A “mind fog” during which she feels less
responsive. It happens 2-3 times a week for the entire day. Her scores reflect a decrease
in UTC (Figure 4). At baseline, Jamila scored a 4 for severity of UTC. A reliable change
index of 2.15 demonstrates that Jamila’s UTC severity score has decreased significantly.
Figure 4: Severity and frequency of unusual thought content across all four assessments.
Anxiety Measures
0
10
20
30
40
50
Baseline 3 Months 6 Months 12 Months
Assessment
Scor
e SPSSIASOASIS
Unusual Thought Content
0
1
2
3
4
5
6
Baseline 3 Months 6 Months 12 Months
Assessment
Scor
e SeverityFrequency
16
Jamila again described paranoia; believing people were following her and wanted
to hurt her. This happens every day and in multiple situations, however happens more
at home than university. She tries to “shake it” but cannot. At present she is at university
so these experiences are less intense (Figure 5). Whilst Jamila’s severity score change
from baseline to three months was highlighted as significant, her overall reliable change
index comparing baseline to twelve months, is 1.61, reflecting no significant change.
Figure 5: Frequency and severity of non-bizarre ideas across all four assessments.
The third CAARMS subscale again highlighted auditory phenomena. Jamila
reported hearing classical music and mumbled voices. Both experiences were as though
they were occurring in reality. This occurs every few days for under and hour. Hearing
classical music is a true hallucination rather than a clear auditory experience. She
continues to rate as “psychotic,” thus has sustained this for six months (Figure 6).
Non-bizarre Ideas
0
1
2
3
4
5
6
Baseline 3 Months 6 Months 12 Months
Assessment
Scor
e SeverityFrequency
17
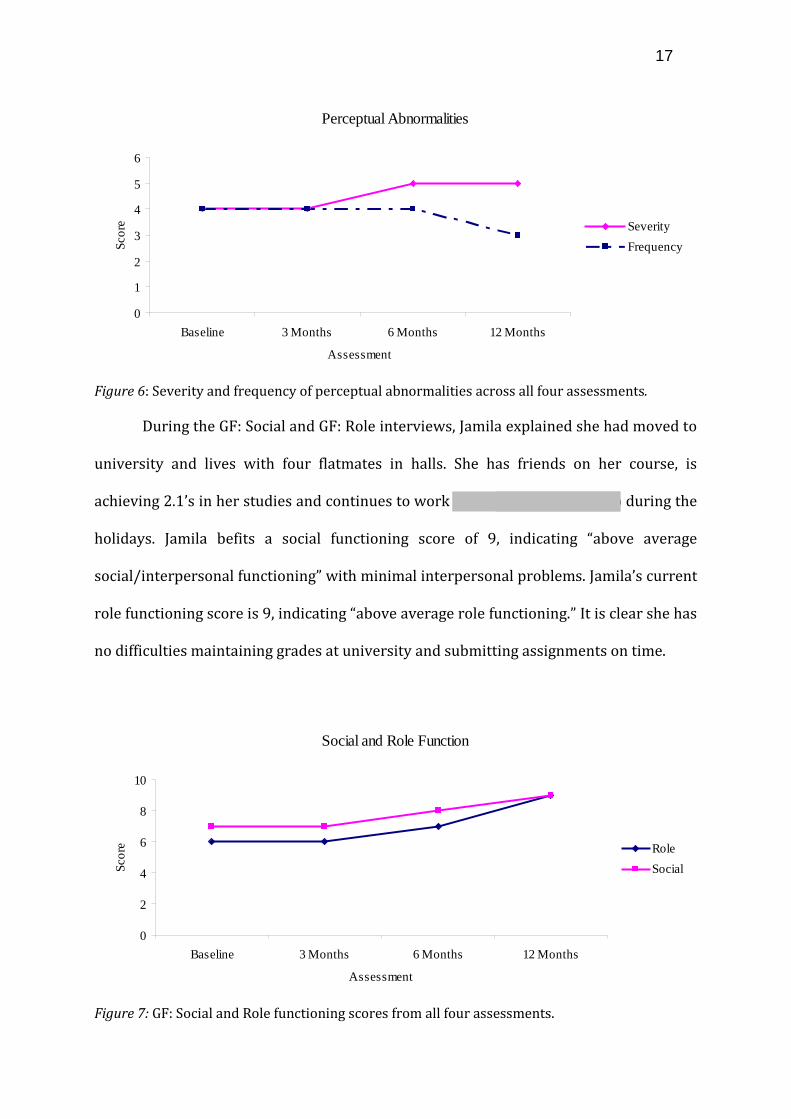
Figure 6: Severity and frequency of perceptual abnormalities across all four assessments.
During the GF: Social and GF: Role interviews, Jamila explained she had moved to
university and lives with four flatmates in halls. She has friends on her course, is
achieving 2.1’s in her studies and continues to work at the photography shop during the
holidays. Jamila befits a social functioning score of 9, indicating “above average
social/interpersonal functioning” with minimal interpersonal problems. Jamila’s current
role functioning score is 9, indicating “above average role functioning.” It is clear she has
no difficulties maintaining grades at university and submitting assignments on time.
Figure 7: GF: Social and Role functioning scores from all four assessments.
Perceptual Abnormalities
0
1
2
3
4
5
6
Baseline 3 Months 6 Months 12 Months
Assessment
Scor
e SeverityFrequency
Social and Role Function
0
2
4
6
8
10
Baseline 3 Months 6 Months 12 Months
Assessment
Scor
e RoleSocial
18
Discussion
This case study aptly demonstrates McGorry et al.’s (2006) four stages. Jamila
was originally referred to YouthSpace regarding depression and anxiety. These are non-
specific stage 1a symptoms. Subsequently at Jamila’s three-month assessment, her non-
specific symptoms had progressed towards psychosis. On the non-bizarre ideas subscale
of the CAARMS, Jamila scored 5, identifying her as being in stage 1b: ultra-high-risk for
psychosis. This was also apparent on the perceptual abnormalities subscale. Therefore,
in the space of three months, Jamila’s symptoms progressed from stage 1a, to 1b. At her
six-month assessment, Jamila’s score for perceptual abnormalities increased to 5 for
intensity and 4 for frequency, indicating a transition to psychosis. During this time,
Jamila remained in the ultra-high-risk category for non-bizarre ideas. Six months later,
at her twelve-month follow up, Jamila had maintained this transition in terms of
perceptual abnormalities. There is potential for Jamila’s psychotic symptoms to be due
to her high anxiety, which remained consistently high throughout the duration of this
study. In this instance, however, as Jamila’s psychotic symptoms increased in intensity,
her anxiety did not show a significant increase.
Interestingly, whilst Yung et al. (2010) outlined typical decline in psychosocial
function during first-episode onset, Jamila’s social and role functioning significantly
increased. At her six-month assessment, where her symptoms were identified as
psychotic, Jamila’s role score increased from 6, to 7, and her social score increased from
7, to 8. These scores further increased at her twelve-month assessment, categorising
Jamila with above average social and role functioning, whilst experiencing psychosis.
Thus, Jamila was able to manage her psychotic symptoms and improve her functioning
level, despite never receiving an intervention over the twelve month assessment period.
19
This successful management of psychotic symptoms presents a limitation to
McGorry et al.’s (2006) argument. If the notions of earlier intervention and stages were
applied to Jamila’s experiences, it is possible to argue that had Jamila received
intervention during stage 1a, it may have reduced the risk of the non-specific symptoms
developing further. If the CAARMS interview had taken place as a standard procedure
during stage 1a, Jamila may have been highlighted as at risk and carefully monitored.
This argument could be strengthened by Jamila’s progression in symptoms at her three-
month assessment in which she was considered ultra-high-risk on two separate
CAARMS subscales. Intervention here, as outlined by McGorry et al. (2006), would
involve cognitive-behavioural therapy and psychoeducation, which may have prevented
transition to psychosis. Yung et al. (2010) further argue that intervention here would
reduce the need for antipsychotic drugs, labelling an individual “psychotic,” or the
psychosicial decline co-occurring with first-episode psychosis (Yung et al., 2010).
Jamila’s increase in psychosocial functioning at this time, however, suggests that
antipsychotic drugs may not always be required in order to function normally. Whilst
early intervention may have prevented Jamila’s symptoms from developing, it is not
without limitations and stigmas. As Jamila has been able to function “above average”
despite her symptoms being considered psychotic, this questions whether earlier
intervention, in this instance, may have caused greater negative impacts than the
symptoms themselves. Yang, Wonpat-Borja, Opler and Corcoran (2010) highlight the
potential stigma associated with “psychosis risk syndromes” as it can cause negative
coping strategies and stereotypes. Corrigan, Watson and Barr (2006) further argue that
the label “psychosis” creates greater stigma than the symptoms themselves due to
directly impacting self-esteem and self-efficacy. Fusar-Poli et al. (2012) demonstrate
that between 22% and 39% of ultra-high-risk individuals transition to psychosis, whilst
20
the remaining 61% do not. This research suggests that earlier intervention would be
beneficial for two tenths of ultra-high-risk individuals, however the stigma for the
remaining 61% of individuals that would be identified as having “psychosis risk-
syndrome” may be more detrimental than their symptoms.
Whilst this case study highlights that early intervention may not always be
beneficial, there is a key limitation in identifying psychosis. The CAARMS is considered a
comprehensive assessment of at-risk mental states, however is highly subjective. In
order for an individual to reach psychosis threshold criteria they must have a severity
scale score of 6 (5 for perceptual abnormalities) and a frequency scale score of 4 or
higher. A rating of 4 for severity depicts “3 to 6 times a week for more than an hour per
occasion” whilst a rating of 3 depicts “3 to 6 times a week for less than one hour per
occasion.” Some individuals may describe symptoms lasting “around about, maybe just
under an hour.” In this instance, a subjective rating could identify an individual
experiencing psychosis, who will then receive treatment, or an individual at risk for
psychosis.
Nelson et al. (2008) found that workshops for CAARMS training may improve
people’s confidence for rating symptoms, however they do not significantly increase the
accuracy of ratings. Despite this however, Yung et al. (2005) have demonstrated good
inter-rater reliability using the CAARMS.
Overall this case study highlights that individuals are able to function well,
despite psychotic symptoms. It suggests that the current push for earlier intervention
may not be required, and could in fact generate greater stigmatization than the
symptoms themselves. It stresses the importance of considering each individual and
their functioning level, rather than using a subjective measure to determine whether an
individual reaches psychosis threshold. Whilst measures may be beneficial to form a
21
complete picture of the symptoms an individual experiences, it should not be depended
upon to decipher which individuals receive treatment. Other factors, such as social and
role function, and an individual’s distress due to the symptoms, should be incorporated
into determining whether an individual reaches the psychosis threshold.
Placement reflection
My autumn placement was initially to explore the overlap between Autism and
psychosis, which was the basis for creating my placement goals. My focus later shifted to
“Transitions;” longitudinally tracking individuals with mental health complaints to
determine those that transition to psychosis. Thus, some of the initial placement goals
were altered.
After completing an undergraduate module on psychosis, I felt I had good
foundation knowledge to progress with. The overlap between Autism and psychosis
however, was novel. The intention was for me to conduct assessment interviews with
individuals with psychosis, such as paranoid schizophrenia, to determine any autistic
overlaps. I received comprehensive training on the Positive and Negative Syndromes
Scale (PANSS) (Kay, Fiszbein & Opler, 1987) to help me administer this assessment and
mark it. I was briefly involved in the recruitment process for this study, which allowed
me to socially interact with individuals with varying degrees of mental health
difficulties. This interaction helped me to appreciate participants as individuals, rather
than research subjects.
Simultaneously to this, I received training on various measures involved in the
Transitions study such as the SOFAS (Morosini et al., 2000) and the GF: Social and GF:
Role interviews. The most valuable training, however, was on the CAARMS, conducted
by Professor Yung, whom was involved in its creation.
22
After completing the training I observed a selection of individuals conducting
assessments and was able to witness multiple interview styles, selecting aspects of each
to incorporate into my own. I believe the result of this is a confident, compassionate
interview style. I conducted five assessments and with each I grew in confidence. This
interview style and confidence will be applicable to any clinical interview setting and
therefore, will be useful in subsequent roles.
Writing up a case report has helped me to understand the data analysis process
and therefore discover what information is important in order to have a comprehensive
data set. For example, asking people to expand on words such as “weird” or “floating” in
the CAARMS demonstrated my personal interpretation could be different to what the
person is experiencing. I have learnt to collect as much detail as possible, simply by
being interested in a person’s experiences.
An implication from this placement is the importance of confidentiality. This is
something I will take with me in all of my future placements or jobs. Keeping consent,
hard data and databases all entirely separate is often neglected and this placement has
reinforced its importance.
One of my placement goals was to observe and assist in the brain scanning
process. This goal was achieved with me assisting in the preparation of two participants
in the scanning room and observing the scan, after obtaining general user status. As I
have a particular interest in scanning, this was a particular highlight of my placement.
A key thing I would have done differently would be better early time
management. As people weren’t sure what I was supposed to be doing I was given
various tasks and training across all studies taking place in the department. If I had
focussed on one study, I may have gained more in depth experience than I did across
23
two studies. An initial structure outlining some key tasks, rather than larger goals, may
have been advantageous with my supervisor, which I will ensure to do next time.
I believe I met the goals I set out to achieve and the resultant report was more
interesting and I gained greater knowledge from writing it than I would have with the
initial plan. Overall I feel my placement was highly beneficial in providing me with key
skills for my pursuit of a career in Clinical Psychology, as well as in future research.
24
Chapter 2: The usefulness of the diagnosis “Acute and Transient Psychotic Disorder” in a Mother and Baby unit
25
Introduction
For my second placement I researched the effectiveness of the diagnosis “Acute and
Transient Psychotic Disorder” in relation to psychotic experiences following childbirth.
26
Today, I intend to provide a brief overview of both the Birmingham Mother and Baby
unit, and Acute and Transient Psychotic Disorders. I will then outline the methods
involved in this research and discuss the subsequent results. Finally, I will highlight
problems encountered and how these may be addressed. I will conclude with a personal
reflection.
27
The Barberry Mother and Baby unit caters for outpatients, inpatients and community
patients. Women are often referred by a midwife who detects a personal or family
history of mental illness. The team helps to devise a care plan should these ladies
experience any postpartum difficulties. The inpatient unit caters for psychiatric
disorders associated with or exacerbated by pregnancy or childbirth; and bonding
difficulties.
28
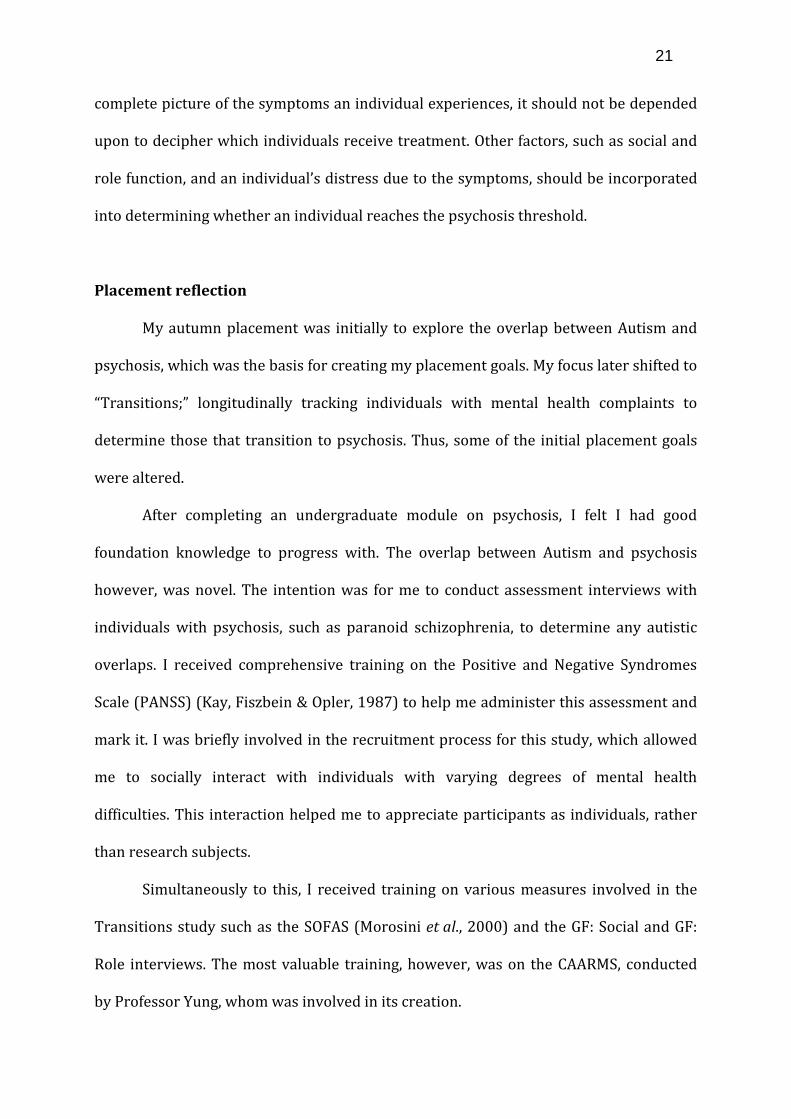
Acute and Transient Psychotic Disorder (ATPD) is an umbrella term for a group of acute
disorders. It is typically under the F23 heading in the ICD 10, however in a Mother and
Baby setting it comes under F.53; associated with postpartum disorders (WHO, 1992).
ATPD is characterized by an acute onset of psychotic symptoms; an individual will
deteriorate to a state of psychosis within two weeks. These symptoms must resolve
within two months, however can often resolve within forty-eight hours.
29
This vignette outlines a typical presentation of ATPD.
30
The rationale for this project emerged as psychiatrists at the Mother and Baby unit in
Birmingham noticed women diagnosed with ATPD presented with the same symptoms
as Postpartum Psychosis (PP), however were recovering either without medical
intervention, or before medication could take effect.
PP is a broad term covering a range of rare but severe mental illnesses. It is not an ICD
10 diagnosis, however it has clinical utility within perinatal services.
The psychiatrists at the mother and baby unit were interested in the demographic
features of women with ATPD, compared to PP, to hopefully identify ATPD earlier, and
determine whether an alternative course of treatment may be more effective.
31
Research ascertains that incidence rates of ATPD are higher in men: 5.08 per 100,000,
compared to only 2.72 per 100,000 in women (Singh et al., 2004). In contrast, stability of
ATPD over three years was higher in women, with 73% of women maintaining their
ATPD diagnosis, compared to 14% of men (Singh et al., 2004).
Further findings show that ATPD has a low association with family history (Das,
Malhotra, Raasu & Malhotra, 2001), however a trend towards stressful events occurring
within six months prior to deterioration in health (Rusaka & Rancens, 2014). Analysis of
precipitating stressful events has not been conducted, however work or family
commitments have been indicated (Pilman, 2012), as well as migration and
homesickness (Lau, 2012).
Finally, the mean age of onset is 31.8 years, with a standard deviation of 9.5 years
(Marneros & Pillman, 2002). This range is consistent with childbearing age.
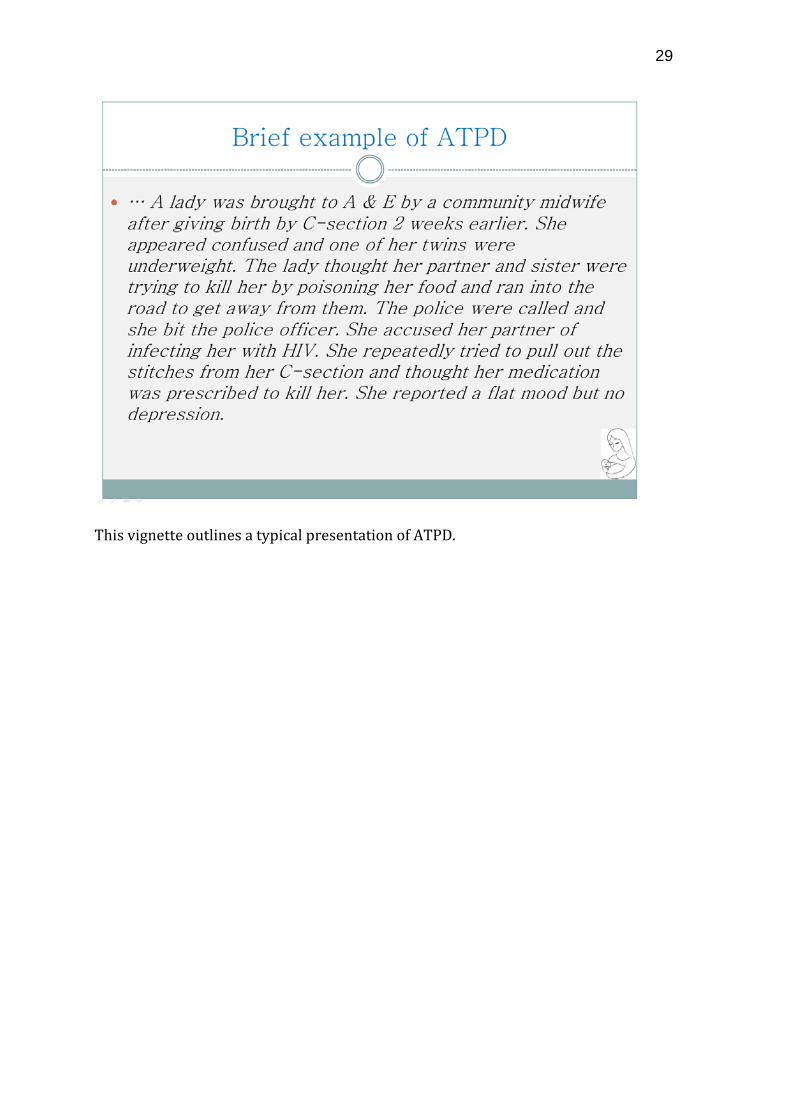
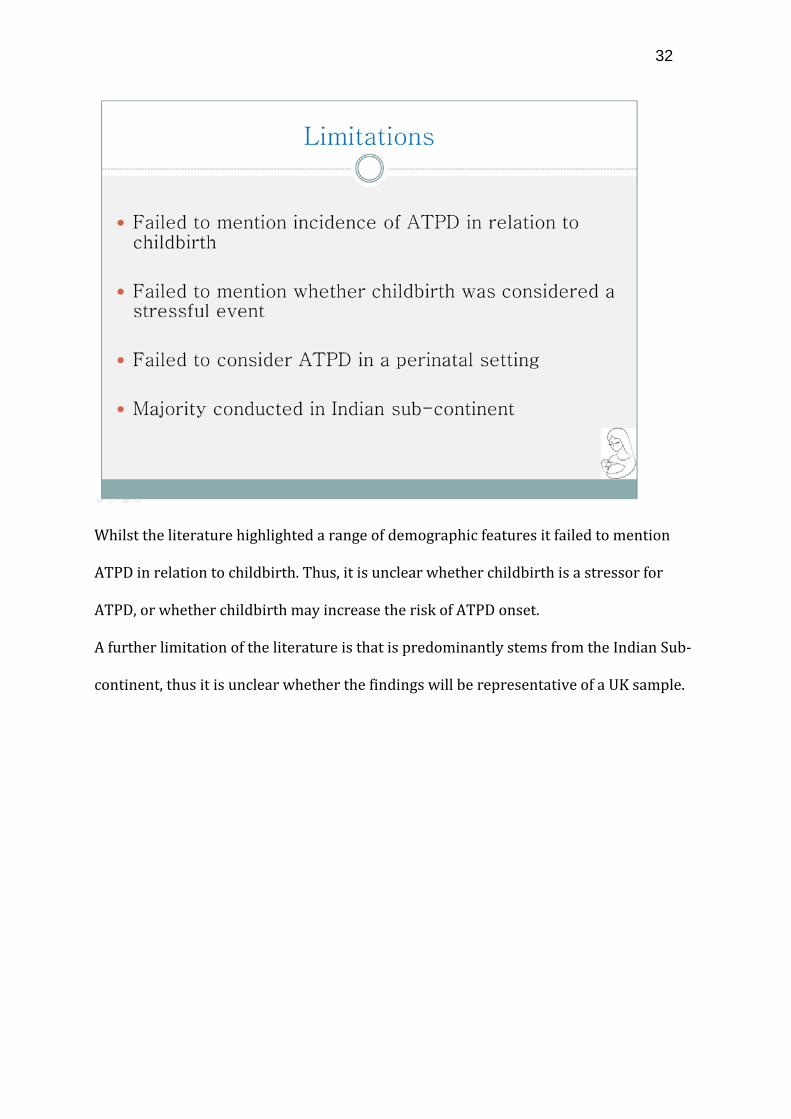
32
Whilst the literature highlighted a range of demographic features it failed to mention
ATPD in relation to childbirth. Thus, it is unclear whether childbirth is a stressor for
ATPD, or whether childbirth may increase the risk of ATPD onset.
A further limitation of the literature is that is predominantly stems from the Indian Sub-
continent, thus it is unclear whether the findings will be representative of a UK sample.
33
Method
Due to these limitations, a comparison was conducted between individuals diagnosed
with ATPD and PP. 11 women with ATPD (mean age 34.09 years) and 9 women with
typical PP (mean age 32.4 years) were selected sequentially from the Birmingham
Mother and Baby unit inpatient admissions database. Demographic and symptom
information was collated. This database was completed retrospectively, using the online
RiO notes.
34
Information collected for each participant.
35
As individuals with PP typically have a family history of mental health complaints, a
biological trigger associated with childbirth is expected. ATPD on the other hand
appears to be associated with psychosocial stressors. On this basis, differences between
the groups were hypothesised in terms of family history, illness duration (ATPD would
be shorter), onset of illness from birth, (ATPD less temporally associated with
childbirth), and finally, other stressful events such as migration.
36
Results
Chi2 were performed comparing the ATPD group data to PP. In terms of demographics,
the Chi2 revealed significant findings in terms of ethnicity; C2 (1,20) = .026, p< .05.
Subsequently, there was a significant trend in terms of migration (C2 (1,20) = .065, p= <
.1) and English fluency (C2 (1,20) = .09, p< .1).
37
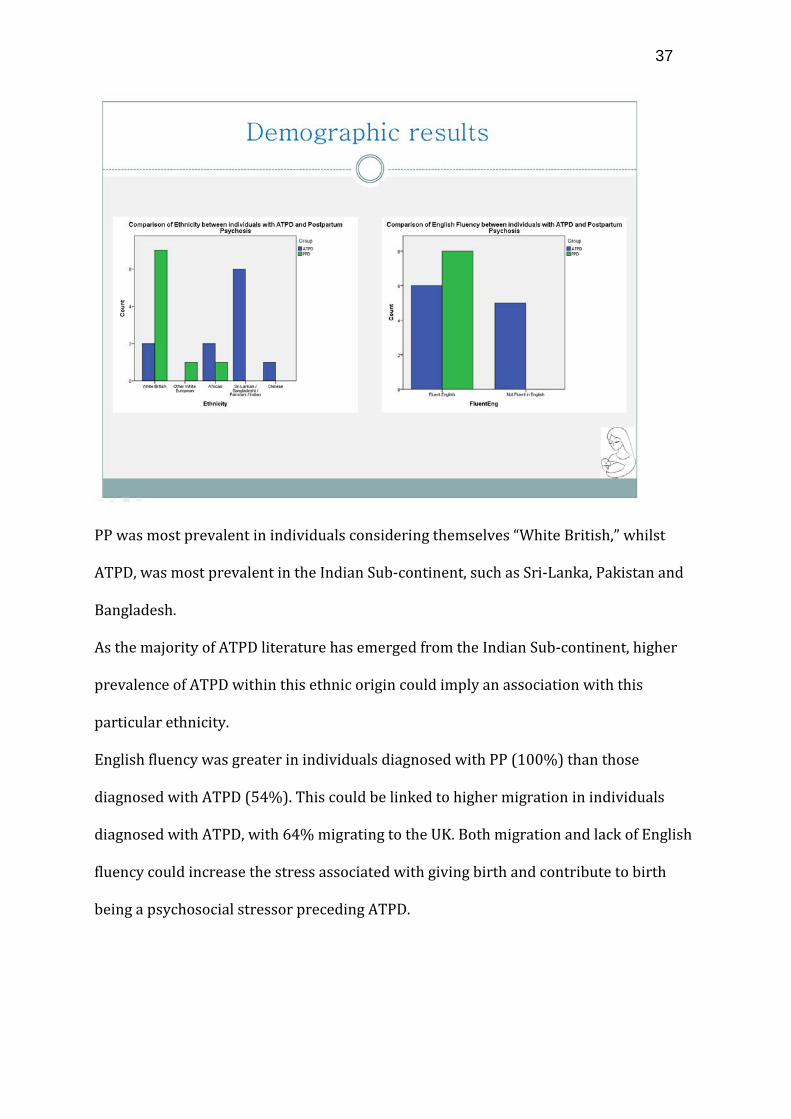
PP was most prevalent in individuals considering themselves “White British,” whilst
ATPD, was most prevalent in the Indian Sub-continent, such as Sri-Lanka, Pakistan and
Bangladesh.
As the majority of ATPD literature has emerged from the Indian Sub-continent, higher
prevalence of ATPD within this ethnic origin could imply an association with this
particular ethnicity.
English fluency was greater in individuals diagnosed with PP (100%) than those
diagnosed with ATPD (54%). This could be linked to higher migration in individuals
diagnosed with ATPD, with 64% migrating to the UK. Both migration and lack of English
fluency could increase the stress associated with giving birth and contribute to birth
being a psychosocial stressor preceding ATPD.
38
Chi2’s of the symptoms recorded indicated no significant difference in general
presentation, such as hallucinations or delusions, thus, confirming the two disorders
present similarly. A significant difference emerged, however, regarding the duration for
symptoms to emerge following birth (C2 (1, 20) = .048, p< .05). There was also a
significant trend in family history (C2 (1,20) = .077, p< .1).
39
The “proximity of symptom onset” graph demonstrates that 72% of PP women
displayed psychotic symptoms between one week and one month following childbirth.
The onset for ATPD women, however, was more varied, with dispersion from antenatal
through to four months postpartum. This finding could support a biological basis for PP
as it is immediately after birth when the most significant hormonal changes occur
(Mulder et al., 2002).
There were higher familial mental health concerns for PP (56%), than for ATPD (9%).
This again supports a biological trigger in PP onset, and alternative triggers for ATPD.
No significant differences emerged regarding stressful events such as financial or family
worries. This could imply childbirth itself is the stressful preceding event triggering
ATPD, however this can only be postulate.
40
Conclusion
Due to the small sample size, the results of this study have low statistical power, so there
is a risk of true effects being exaggerated. Therefore, there is limited application beyond
this study without further research.
The results, however, imply no significant difference in symptom presentation between
ATPD and PP. There are however differences regarding proximity of symptom onset,
and family history. These differences support the notion of a biological trigger for PP,
which is not present in ATPD. Whilst no significant stressors emerged between the two
groups, it is possible that childbirth becomes a stressful event, possibly due to increased
migration. Migrating to England may decrease social or family support available
41
following childbirth Furthermore, being unable to confidently speak the same language
as doctors could increase the stress of childbirth.
Regarding the significant difference in ethnicity, further research is required to address
whether heightened levels of ATPD in ladies from the Indian Sub-continent is due to
ethnicity, which would support King et al., (1994), suggesting ethnic minorities face
personal and social pressures that contribute to increased psychosis, or due to
subsequent factors such as migration and English fluency, which would support findings
by Cantor-Graae & Selten (2005) that migration, or family history of migration is a risk
factor in developing psychotic disorders.
42
Limitations
Limitations arose throughout this project, particularly regarding data availability.
Firstly, some participants were “open cases,” thereby still receiving outpatient care;
thus, it was difficult to conclude a point of complete recovery. In future, only closed
cases should be included.
Due to gathering data retrospectively, it was difficult to determine every demographic
or symptom required. Online RiO notes did not always report, for example, socio-
economic status, thus this could not be incorporated in demographic comparisons. It
would be more beneficial to complete the information with the individual present.
English fluency created a further limitation, as translators were required where English
was not the first language. Translators present complications due to interpreting
symptoms or phrases before relaying them, thereby information becomes altered.
43
Alternatively, a lady may have such a brief episode that before a translator can be
arranged, she has recovered.
A clear issue with this research is the small sample size. Due to the rarity of the
diagnosis this was unavoidable. If wider research was undertaken, incorporating more
trusts, the sample size would be dramatically increased and would become more
diverse; thus more representative of the UK.
44
Personal Reflection
My placement allowed me to observe the NHS process from referral to discharge. This
involved working alongside a multi-diciplinary team, learning the roles each individual
plays in treatment. Liasing with multiple members of a team is a valuable skill that I will
carry throughout future placements I worked with nurses in the inpatient facility and
with patients on the ward, which significantly impacted my research. I saw the
symptoms of postpartum psychosis first hand, allowing me to understand the distress
and functional impact of these disorders.
I was in charge of conducting the project, enforcing important time management skills,
but also relaying information to a supervisor, and seeking help when required. This is
the first project I have designed myself, therefore I gained insight into project
development; how an idea becomes research. In conjunction, I saw the advantages and
45
limitations of retrospective data collection. Whilst data can be easily obtained without
the stress of recruitment, it relies heavily on notes containing required information.
A substantial gain from this placement is an in depth understanding and practical insight
into two incredibly rare psychoses, which would be difficult to achieve elsewhere.
Whilst my undergraduate degree provided me with a basic understanding of psychosis,
this placement expanded my knowledge further. I believe that in future clinical
applications, this rare focus on psychosis will be advantageous.
Finally, my research will be presented at the international Marce conference. I consider
it a personal achievement to have my name on an academic poster, and look forward to
attending the conference.
46
Chapter 3: Exploring a measure of maternal orientation in first time mothers
47
Abstract
Background:
Childbirth is widely perceived as a joyous event which should be celebrated, however
for approximately 10% of women, postnatal depression can make this a difficult period
(Cox et al., 1993). Postnatal depression can impact parenting style, interactions between
mother and child, attachment, and cognitive functioning. Due to the significant impacts
of postnatal depression it would be advantageous to identify women at risk, during the
early stages of pregnancy. Raphael-Leff (1985) proposed maternal orientation as a
vulnerability factor for postnatal depression, and on this basis, multiple measures have
been created to identify women of a strong maternal orientation. One said measure, is
the AMOM-R.
Aim:
To assess the internal validity of the AMOM-R, a measure of maternal orientation, using
a UK sample.
Method:
50 first time mothers in their third trimester were recruited through a large
Birmingham trust. Participants completed demographic information, the AMOM-R, the
Edinburgh depression scale and the Multidimentional Perfectionism Scale.
Results and Conclusion:
The facilitator subscale of the AMOM-R had good internal validity (a=.65) however could
be improved through deletiing three questions (a=.80). An insufficient number of
participants were identified as having a strong regulator orientation in order to assess
the validity of this subscale, however there is some suggestion, based on frequency of
responses, that negatively worded regulator questions may be difficult for women to
openly endorse, thus rewording these should be considered.
48
Finally, high regulator scores were associated with increased antenatal depression,
whilst high facilitator scores were associated with decreased perfectionism.
The results of this study support the theoretical construct of maternal orientation,
however also identify some assumitions that require modification.
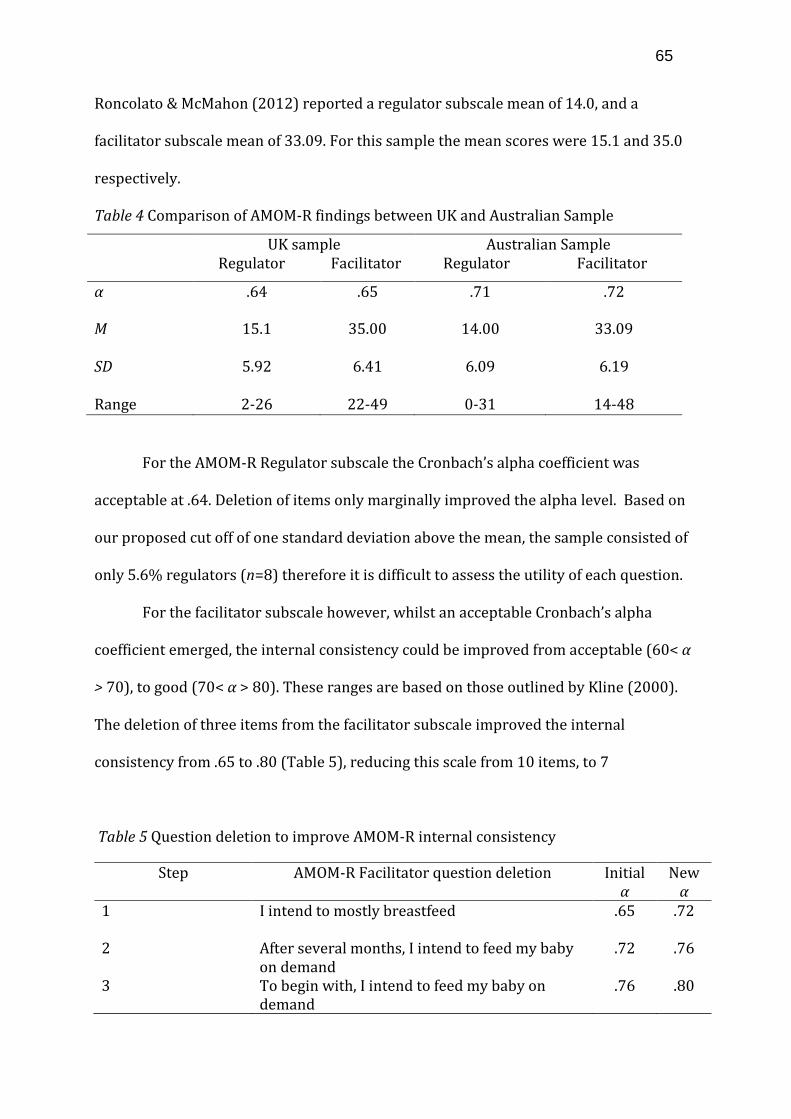
Introduction
Postnatal depression (PND) is diagnosed in approximately 10% of childbearing
women (Cox et al., 1993), with a typical episode lasting between two to six months
(Williamson & McCutchen, 2004). PND has the same characteristics as major depression,
thus a diagnosis of PND requires meeting major depression criteria, as well as criteria
for postpartum onset. The postpartum onset criterion specifies an episode within four
weeks following childbirth (DSM-IV, 2000). Interestingly, despite diagnostic criteria
specifying this four-week period, research indicates that 75% of PND cases occur within
seven months of giving birth (Cooper, Campbell, Day et al., 1988).
PND symptoms include anxiety, eating or sleeping disturbances, emotional
instability, confusion, guilt or shame, and suicidal thoughts (Beck & Indman, 2005).
Women experiencing PND often report negative feelings towards their baby and
question their maternal competency (Astbury, 1994). It is widely perceived that
becoming a mother should be celebrated, therefore women experiencing PND may be
reluctant to disclose negative experiences through fear of stigmatization or being
labeled a poor mother (Hall, 2006). Despite this assumption, negative thoughts, to an
extent, are normal following childbirth (Hall & Wittkowski, 2006).
Impact of postnatal depression
A meta-analysis revealed that multiple factors have been associated with
increased risk of PND, such as poverty, life stressors, antenatal stress, child
49
temperament, social support and marital difficulties (Beck 2001). Similarly, biological
triggers for PND have been identified, such as previous history of depression (Lee &
Chung, 2007). Antenatal depression, however, is currently the most reliable predictor of
PND (Lee & Chung 2007; Beck, 2001) with approximately 50% of women experiencing
Raphael-Leff (1993) proposes that having a strong facilitator or regulator
maternal orientation could present a risk for developing PND. She outlines these as
“interpersonal, physical, economic or sociocultural factors conspiring to prevent
mothers from fulfilling their own specific expectations of motherhood.” Becoming a
parent involves new experiences, and different maternal orientations are vulnerable
following different experiences (Van Bussel, Spitz & Demyttenaere, 2009).
For a facilitator, changes will be embraced, however idealized expectations about
becoming a mother can leave her vulnerable to disappointment. Unexpected
complications during pregnancy or childbirth can ruin the idyll the facilitator desires.
Similarly, being unable to breastfeed can have the same result, because these are all
natural maternal processes. These factors may mean a facilitator is most vulnerable to
PND in the early postpartum (Raphael-Leff, 1985).
A facilitator may feel the need to suppress natural negative feelings towards the
baby through fear of conflict with the ideal baby-self. This can result in high anxiety and
guilt, as well as over-involvement with the child. The baby crying will be viewed as a
sign of a poor mother (Raphael-Leff, 1985).
A further facilitator vulnerability factor would be returning to work earlier than
anticipated. Due to this, a facilitator is also at risk of developing PND when she has to
leave her child and acknowledge that it has its own independence, and that others are
capable of taking care of her child, rather than it being dependent on her (Raphael-Leff,
2010).
A woman with a regulator orientation, on the other hand, is most vulnerable to
developing PND either during pregnancy or in the early six to eight weeks postpartum
(Sharp & Bramwell, 2010). This is because the baby threatens their identity. She may
view the baby as a parasite, feeding on her resources, over which she has no control.
52
During the early postpartum, a regulator may feel trapped by the demands of her new
baby, particularly if there are no other carers to share the “burden” (Raphael-Leff,
2010). A regulator will aspire to return to work as quickly as possible, thus
unemployment and no respite from her baby can threaten her competence and lead to
resentment of being a mother.
There are clear distinctions between facilitators and regulators not only in their
expectations about becoming a mother, but also in subsequent mothering style
(Ronocolato & McMahon, 2012). Using the strange situation task, Scher (2001)
demonstrated that mothers with a facilitator maternal orientation have infants with
more secure attachment than those with regulator orientation mothers. Stein et al.
(1991) also found poorer quality of interaction between mothers who had recovered
from PND and their infants.
Identifying maternal orientation
Due to the risks posed by PND to both child and mother, it would be
advantageous to identify women at risk of developing PND as early as possible.
Currently, the main identifier for at risk women is previous family history of PND. This
does not, however identify women who become the first in their family to experience
PND. There is strong evidence that particular maternal orientations leave women
vulnerable to PND. Therefore assessing maternal orientation could help to identify
women with no current family history that are at risk due to their personality traits.
Moreover, it would be beneficial to develop interventions to specifically address
orientation and potentially reduce vulnerability to PND.
Sharp & Bramwell (2010) developed the Antenatal Orientation Measure (AMOM)
to identify women with facilitator or regulator orientations, based on Raphael-Leff’s
(1985) model of maternal orientation. The AMOM is an adaptation of Raphael-Leff’s
53
(1985) Facilitator Regulator Questionnaire (FRQ). It assesses the pregnancy experience
and women’s expectations about becoming a mother. The AMOM, unlike the FRQ focuses
solely on the third trimester. It comprises twenty-seven self-report items, focusing on
labour, childbirth, the baby, becoming a mother, and how the baby will be fed. Thus, the
AMOM covers the mothers expected feelings, as well as adjustments associated with
becoming a mother (Ronocolato & McMahon, 2012). The AMOM has a seven-point
bipolar response scale with a facilitator or regulator response at each end. Participants
indicate how closely their feelings are to either response.
In Sharp & Bramwell’s (2010) study, using the AMOM they were able to identify
women that endorsed characteristics of strong facilitator and regulator orientations,
through the traits outlined by Raphael-Leff (1985). They identified an association
between a regulator orientation and both antenatal and postnatal depression. Women
completed the EDS at six weeks postpartum, which revealed that 30% of regulators met
the criteria for major depression. A logistic regression further reflected that regulator
maternal orientation was a significant independent risk factor for symptoms of PND
(Sharp & Bramwell, 2010). These findings support the notion that regulator orientation
mothers are most vulnerable to PND in the early postpartum.
Subsequent to the AMOM, the AMOM-R was devised by Ronocolato & McMahon
(2012) using an Australian sample. Whilst the AMOM focused on five key areas, the
AMOM-R focuses on 3: initial expectations about the baby, the mother’s expectation of
herself in the first few weeks, and how she plans to feed her baby. These three subscales
were identified as the most effective in determining facilitator and regulator
orientations.
The AMOM response scale was further adapted in the AMOM-R to address the
notion that mothers may have mixed responses to a question. In the original AMOM,
54
women are presented with a question, such as “how do you intend to feed your baby?”
followed by a bipolar response scale. At one end would be an anchor reflecting a
facilitator response, and at the other would be a regulator response anchor. Women are
expected to respond either more towards the facilitator, breastfeeding anchor, or more
towards the regulator bottle-feeding anchor. The AMOM-R recognizes that women may
endorse characteristics of both orientations. For example, a reciprocator is aware of the
advantages of both feeding on demand, and adapting to a routine. Thus, they may not
endorse one characteristic more strongly than another. Therefore, the AMOM-R
presents the previous question in two questions: “I intend to mostly breastfeed” which
is a facilitator statement, and “I intend to mostly bottle feed” which is a regulator
statement. Women can then indicate their response on a six point scale ranging from
strongly disagree to strongly agree.
There are currently three known measures of maternal orientation: the AMOM,
FRQ and the Placental Paradigm Questionnaire. The internal consistency for the FRQ
was .21 and the Placental Paradigm Questionnaire (Raphael Leff, 2009) was .66 for the
regulator subscale and .73 for the facilitator subscale. Ronocolato & McMcMahon (2012)
present Cronbachs alpha coefficients of .71 for the regulator subscale (8 items) and .72
for the facilitator subscale (10 items). Thus, the AMOM-R has the best internal
consistency compared to other maternal orientation measures.
Aims of the study
One of the aims of this study is to further validate the AMOM-R using a UK
sample. Research using the AMOM-R is limited, and has only been completed by one
Australian research group (Ronocolato & McMahon, 2012). The incidence of PND in
Australia each year is approximately 14% (Deloitte, 2012), which is consistent with
incidence rates of 10% in the UK (Cox et al., 1993). Australia currently utilizes both
55
private and government funded healthcare services, and offer scans at the same
gestation intervals as the UK. Therefore we would expect no difference between the two
samples based on healthcare advice or treatment.
Australia has a large migrant community with 73.3% of the population having
both parents born overseas, compared to 19.4% having both parents born in Australia.
The ethnic diversity in Melbourne, Australia, is predominantly Chinese (24.7%), with
additional large English (13.5%), Australian (8.5%) and Indian (5.3%) populations
(Australian Bureau of Statistics, 2011). In contrast to this, the ethnic diversity in
Birmingham, UK, where this study will take place, is predominantly White British (53%),
with large Pakistani (13.5%) and Indian (6%) populations (Office for National Statistics,
2011). Despite the two cities being ethnically diverse in different ways, the majority
(95%) of the Australian sample was Caucasian, thus reducing likely discrepancy
between the samples based on varying ethnicities. It would be advantageous to research
the reliability of the AMOM-R scores across these two samples and subsequently seek to
validate it using a more diverse population.
The current research study, which is part of a wider study, seeks to further
validate the AMOM-R’s ability to identify women with a strong facilitator or regulator
orientation, using a UK sample of first time mothers in their third trimester. Due to the
number of anticipated similarities between the two samples, similar internal validity is
expected to that reported by Roncolato & McMahon (2012).
Aside from maternal orientation, personality traits, including perfectionism, have
been identified as risk factors for developing PND (Gelabert et al., 2012). A perfectionist
is an individual who works “unceasingly towards unobtainable goals and measure their
self worth by productivity and accomplishment” (Parker & Adkins, 1995). Research
reflects that women with higher perfectionism scores, particularly socially orientated
56
perfectionism (Macedo et al., 2009) have a higher incidence of PND (Gelabert et al.,
2012). High concern with mistakes has also been associated with PND, with 34% of
women with PND having high concern over mistakes compared to 11% of controls
(Gelabert et al., 2012; Maia et al., 2012). As a facilitator takes a more baby-led stance on
raising her child, she is unlikely to have a strong perfectionist personality. A regulator
however, may feel the pressures of others and the need to be perfect.
Aside from assessing the internal consistency of the AMOM-R with this new
sample, the construct validity will be assessed. As the AMOM-R is the only well-
supported measure of maternal orientation, no direct comparison is available. Therefore
to assess construct validity, this study will consider relationships between maternal
orientation, and other known risk factors for PND: antenatal depression and
perfectionism. It is expected that women of a strong regulator maternal orientation will
have elevated levels of antenatal depression compared to women of facilitator or
reciprocator maternal orientations. Moreover, it is expected that women with a strong
regulator orientation will have elevated levels of perfectionism, particularly socially
prescribed perfectionism.
Method
Participants
First time mothers in their third trimester of pregnancy (27-42 weeks),
registered under a large hospital trust in the West Midlands were eligible to participate.
This hospital sees over 8,000 pregnant women each year and covers a diverse ethnic
population. Further inclusion criteria included having no known complications during
pregnancy and able to read and understand English. Women were not eligible should
57
they, or their baby have significant health problems, if there was a high chance of the
participant not completing the pregnancy, or if the participant had a learning disability.
Of the 59 individuals approached to take part, 6 declined. Moreover, of the 53
that completed the study, 3 participants failed to complete more than 90% of items,
resulting in their data being excluded.
Participant age ranged from 19-42 years (M=30.1, SD=5.44), with mean
gestational age being 35.3 weeks (SD=5.5). Table 1 reflects that participants were
predominantly White British (61%), planned their pregnancy (70.4%) and had a partner
(87.2%).
58
Table 1 Sample demographics (N=50)
Demographic Category Frequency Percentage
Marital status Single 8 16 Co-habiting 13 26 Married 27 54 Civil Partner 1 2 Education None 2 4 GCSE 7 14 NVQ 8 16 A Level 2 4 Professional Qualification 14 28 Undergraduate Degree 11 22 Masters Degree 6 12 Employment Unemployed 6 12 Part Time Employment 6 12 Full Time Student 2 4 Full Time Employment 33 66 Self Employed 3 6 Ethnicity White British 33 61 Asian 5 9.3 Black 2 3.7 Mixed Background 4 7.4 White Other 6 11 Conception Planned 38 70.4 Mental Health No previous mental health history 42 77.8
59
Procedure
Ethical approval was obtained from the Edgbaston Research Ethics Committee
for a wider study of which the current study was a small component. The results of this
wider study are reported elsewhere. Recruitment took place over eight weeks. A longer
recruitment period was intended, however was unavoidably limited by delays in
receiving ethical approval.
Recruitment was multimodal, with women recruited via three routes. The
majority of women (n=50) were recruited via community midwifery clinics in South
Birmingham, run by three midwifery teams. A further small number of participants
were recruited via local NHS Trust antenatal classes (n=3) and via an advertisement on
the National Childbirth Trust social media (n=3). In midwifery clinics, the researcher
either approached women directly, or the midwives briefly discussed the study with
eligible women. Study information was provided and women were given 24 hours to
decide whether to participate. For the remaining recruitment routes, appropriate times
were arranged to meet with women. Demographic variables (Table 1) were assessed, as
well as maternal orientation, antenatal depression and perfectionism.
Measures
The Antenatal Maternal Orientation Measure Revised (AMOM-R; Roncolato &
McMahon, 2012) is a modified version of the AMOM (Sharp & Bramwell, 2004),
comprising 18 self-report questions covering characteristics associated with facilitator
and regulator maternal orientations. The AMOM-R presents women with a facilitator
orientation question and a regulator orientation equivalent, rather than bipolar
response scales. Thus, questions such as “I expect to feed my baby on demand” and “I
expect to feed my baby at set times” were both included to accommodate individuals
60
who may endorse both expectations. Responses are provided on a 6-point Likert scale,
ranging from strongly disagree to strongly agree.
The AMOM consisted of five subscales; labour, birth, what the baby will be like,
what the mother will be like in the early weeks, and her feeding plans. The AMOM-R
omits labour and birth, focusing on the remaining three categories that are considered
to best identify maternal orientation (Sharp & Bramwell, 2004). These categories are
divided into a facilitator subscale comprising 10 items, and a regulator subscale
comprising 8 items (Appendix A). High scores on one subscale indicate a tendency
towards that maternal orientation.
The Edinburgh Depression Scale (EDS; Cox et al., 1987) consists of 10 self-report
questions targeting depressive symptoms, such as “I have blamed myself unnecessarily
when things went wrong.” Responses are rated on a 4-point scale, scoring zero for low
or no depression responses, and 3 for high depression responses. Women scoring above
13 are likely to be experiencing depression. The EDS is not specific to PND, however has
shown good reliability and validity in both pregnant and postpartum populations (Cox &
Holden, 1994; Murray & Cox, 1990), with VanBussel & Spitz (2009) reporting a
Cronbach’s alpha of .80.
The Multidimensional Perfectionism Scale (MPS; Hewitt & Flett, 1991) consists of
45 items (a=.87), which measure three subcomponents of perfectionism: self orientated
perfectionism, other orientated perfectionism, and socially prescribed perfectionism.
The self-orientated subscale consists of 15 items and targets the extent that an
individual feels an unrealistic need to be perfect. The other orientated subscale consists
of 15 items, which identify to what extent an individual places high expectations on
others. Finally, the socially prescribed subscale also consists of 15 items. Individuals
61
with high social perfectionism believe that others have high expectations of them. This
scale has been used extensively in relation to women, with a cronbach’s alpha of .83,
(Hewitt et al., 1991) however only in one instance for pregnancy (Dimitrovsky et al.,
2002).
Answers are provided on a 7-point Likert scale, with7 representing strongly
agree, and 1 representing strongly disagree. The minimum raw score is 15 for each
scale, and the maximum is 105. Raw scores are converted to t-scores based on
community sample norms. A t-score less than 50 is considered normal, 55-59 is
moderately perfectionist, and 60 or above reflects elevated levels of perfectionism,
which may leave individuals at risk of pathological outcomes.
Data analysis
Data was entered into IBM SPSS (Version 20) for statistical analysis. Tests for
normality were calculated for all variables. Calculations of skewness and Kurtosis
revealed the data for all measures did not differ significantly from normal distribution
and thus, parametric tests were used in analysis.
The internal consistency of the AMOM-R was determined by calculating a
Cronbach’s alpha and further improvements were identified through question deletion.
The internal consistencies of the EDS and the social, other and self-orientated
perfectionism scales of the MPS were also calculated.
The demographic variables were categorized for analysis. For age, the
demographics were categorized into: women under 20, women aged 21-30, aged 31-40
and women over 40. Ethnicity was categorized as white British, any Asian ethnicity, any
black ethnicity and any other white ethnicity. The remaining groups were dichotomous:
62
in a co-inhabiting relationship, or single; degree level education or below; employed full
time or less than full time; and planned or unplanned pregnancy.
Participants from different demographic groups were compared across
measures, using t-tests for dichotomous demographic variables and ANOVA to compare
non-dichotomous categorical variables. For data with a significant Levene’s test for
homogeneity of variance, the t-value was provided for non-assumed equal variance.
Scores for each AMOM-R subscale were correlated with the scores on the MPS
and EDS to assess construct validity. A significance level of .05 was used for all statistical
analysis.
Results
Demographics
Table 2 shows a comparison between the demographics of this sample and the
demographics of the previous Australian sample (Roncolato & McMahon, 2012). For
marital status, education, and whether the pregnancy was planned, the two samples are
consistent. Participant employment was noticeably different between the two samples,
with 37.8% of Australian participants in full time employment compared to 66% of the
current UK sample. The Australian sample also had a larger proportion of Caucasian
participants compared to the UK sample (95.7% and 61% respectively).
63
Table 2 Comparison of demographics from current sample and Australian sample
Characteristic
Sample Feature
Current UK Sample
Freq. %
Australian Sample*
Freq. %
Marital status Partner 41 87.2 221 96.1
Education University degree 31 62 147 63.9
Planned Pregnancy Planned 38 70.4 190 82.6
Current Employment Full time 33 66 87 37.8
Ethnicity Caucasian 33 61 220 95.7
*Data from Roncolato & McMahon (2012)
Internal consistency
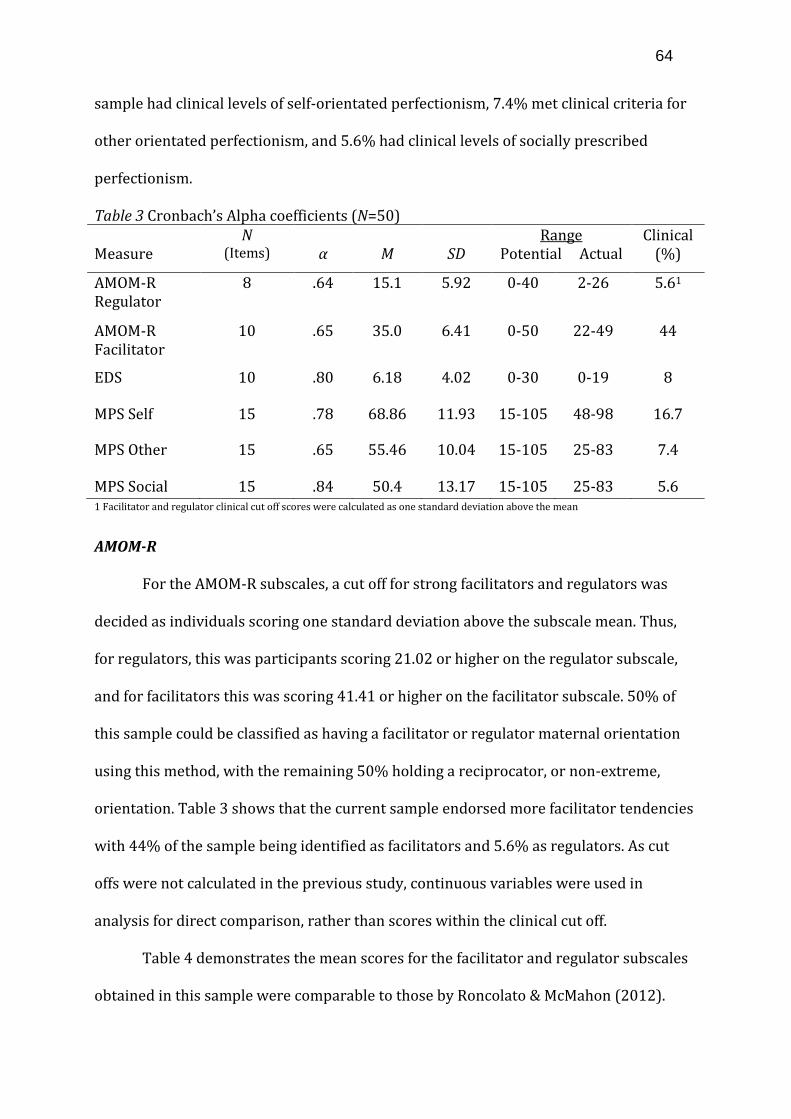
The Cronbach’s alpha coefficients for all measures are presented in Table 3.
EDS
The internal consistency of the EDS for this sample was good, with a Cronbach’s
alpha of .80. The EDS had a mean of 6.81 and a standard deviation of 4.02. These
statistics are consistent with those outlined by VanBussel & Spitz (2009). A clinical cut
off, identified as scores above 13, was applied, revealing 8% of this sample met the EDS
criteria for clinical depressive symptoms.
MPS
The internal consistencies of the three MPS subscales in this sample ranged from
acceptable, to good, with the MPS Other subscale scoring a Cronbach’s alpha of .65, the
MPS Self subscale scoring .78, and the MPS Social subscale scoring .84.
The coefficients for the MPS subscales in this non-clinical sample follow the same trend,
however are marginally lower than those presented for a clinical sample by Hewitt,
Flett, Turnbull-Donovan & Mikail (1991), as would be expected. A clinical cut off was
applied to each subscale, identified as scores over 60, which revealed 16.7% of the
64
sample had clinical levels of self-orientated perfectionism, 7.4% met clinical criteria for
other orientated perfectionism, and 5.6% had clinical levels of socially prescribed
perfectionism.
Table 3 Cronbach’s Alpha coefficients (N=50)
Measure N
(Items) α
M
SD
Range Potential Actual
Clinical (%)
AMOM-R Regulator
8 .64 15.1 5.92 0-40 2-26 5.61
AMOM-R Facilitator
10 .65 35.0 6.41 0-50 22-49 44
EDS 10 .80 6.18 4.02 0-30 0-19 8
MPS Self 15 .78 68.86 11.93 15-105 48-98 16.7
MPS Other 15 .65 55.46 10.04 15-105 25-83 7.4
MPS Social 15 .84 50.4 13.17 15-105 25-83 5.6 1 Facilitator and regulator clinical cut off scores were calculated as one standard deviation above the mean
AMOM-R
For the AMOM-R subscales, a cut off for strong facilitators and regulators was
decided as individuals scoring one standard deviation above the subscale mean. Thus,
for regulators, this was participants scoring 21.02 or higher on the regulator subscale,
and for facilitators this was scoring 41.41 or higher on the facilitator subscale. 50% of
this sample could be classified as having a facilitator or regulator maternal orientation
using this method, with the remaining 50% holding a reciprocator, or non-extreme,
orientation. Table 3 shows that the current sample endorsed more facilitator tendencies
with 44% of the sample being identified as facilitators and 5.6% as regulators. As cut
offs were not calculated in the previous study, continuous variables were used in
analysis for direct comparison, rather than scores within the clinical cut off.
Table 4 demonstrates the mean scores for the facilitator and regulator subscales
obtained in this sample were comparable to those by Roncolato & McMahon (2012).
65
Roncolato & McMahon (2012) reported a regulator subscale mean of 14.0, and a
facilitator subscale mean of 33.09. For this sample the mean scores were 15.1 and 35.0
respectively.
Table 4 Comparison of AMOM-R findings between UK and Australian Sample
UK sample Regulator Facilitator
Australian Sample Regulator Facilitator
α .64 .65 .71 .72
M 15.1 35.00 14.00 33.09
SD 5.92 6.41 6.09 6.19
Range 2-26 22-49 0-31 14-48
For the AMOM-R Regulator subscale the Cronbach’s alpha coefficient was
acceptable at .64. Deletion of items only marginally improved the alpha level. Based on
our proposed cut off of one standard deviation above the mean, the sample consisted of
only 5.6% regulators (n=8) therefore it is difficult to assess the utility of each question.
For the facilitator subscale however, whilst an acceptable Cronbach’s alpha
coefficient emerged, the internal consistency could be improved from acceptable (60< α
> 70), to good (70< α > 80). These ranges are based on those outlined by Kline (2000).
The deletion of three items from the facilitator subscale improved the internal
consistency from .65 to .80 (Table 5), reducing this scale from 10 items, to 7
Table 5 Question deletion to improve AMOM-R internal consistency
2 After several months, I intend to feed my baby on demand
.72 .76
3 To begin with, I intend to feed my baby on demand
.76 .80
66
Table 6 shows the frequencies of responses to each facilitator subscale question.
For the facilitator subscale, deleting questions 5, 6 and 7 improved the internal
consistency. For Questions 5 and 7, over 80% of participants agreed with these
statements, therefore indicating a strong facilitator response from the majority of
participants. Finally, the majority of participants endorsed a positive regulator response
to Question 6 despite the sample consisting of more facilitators.
Table 6 Frequencies of responses to each AMOM-R facilitator subscale question (N=50)
Facilitator Subscale Questions Agree (%)
Disagree (%)
(Q1) My baby will fit easily into my life 78 22 (Q2) My baby will be born being able to communicate with me 72 28 (Q3) My baby will be like someone that I already know 84 16 (Q4) My baby will be born knowing what is best for him or her 38 62 (Q5) To begin with, I intend to feed my baby on demand* 90 10 (Q6) After several months, I intend to feed my baby on demand* 36 64 (Q7) I intend to mostly breastfeed* 86 14 (Q8) In the first few weeks I will be mostly feeling fulfilled 88 12 (Q9) In the first few weeks I will mostly be enjoying the new way of life
100 0
(Q10) My baby will be able to tell who I am from early on 96 4 * Questions that improve Cronbach’s alpha when deleted
67
Table 7 Inter-correlations between facilitator maternal orientation subscale questions
1 2 3 4 5 6 7 8 9 10
1. My baby will be able to tell who I am from early on - .317* .420** .495** .253 .299* .024 .107 .193 .312*
2. My baby will fit in easily into my life - - .412** .480** .462** -.249 .065 -.301* .501** .480**
3. My baby will be born being able to communicate with me - - - .499** .593** .084 -.031 -.128 .303* .337*
4. My baby will be like someone that I already know - - - - .359* .107 .009 -.036 .413** .423**
5. My baby will be born knowing what’s best for him/her - - - - - -.039 .021 -.338* .093 .186
6. To begin with, I intend to feed my baby on demand - - - - - - .202 .452** -.065 -.131
7. After several months, I intend to feed my baby on demand - - - - - - - .162 .129 .113
8. I intend to mostly breastfeed - - - - - - - - -.150 -.166
9. I will be mostly feeling fulfilled - - - - - - - - - .660**
10. I will be mostly enjoying a new way of life - - - - - - - - - -
* Significant at p<.05 level ** Significant at p<.001 level
68
Table 7 illustrates the correlations between individual questions on the
facilitator subscale of the AMOM-R. The Cronbach's alpha was improved through
deleting questions 6, 7 and 8. The table demonstrates that question 8 (I intend to mostly
breastfeed) correlated significantly with three of the remaining nine questions,
questions 2 and 5 at a p< .05 significance level, and question 7 at a p<.001 significance
level. It failed to correlate significantly with the remaining four questions in the
facilitator subscale. The second question deleted to improve the Cronbach’s alpha,
question 7 (After several months, I intend to feed my baby on demand), failed to
significantly correlate with any of the other nine questions on the facilitator subscale.
The final question deletion that improved the Cronbach’s alpha was question 6
(To begin with, I intend to feed my baby on demand). This question only significantly
correlated with question one. It should be noted, that following the deletion of these
questions, the majority of the remaining insignificant correlations are associated with
question 5 (My baby will be born knowing what’s best for him/her). Deletion of this
question only marginally improved the Cronbach’s alpha from .80 to .81, thus its
deletion is not required.
Whilst there is an increased risk of a type 1 error due to multiple correlations, it
was deemed that the Perneger (1998) stance not to utilize a Bonferoni correction may
be more valuble, due to the nature of the correlations. As this involved highlighting
questions that may reduce the efficacy of the study, and the sample size could have been
more substansive, it felt appropriate to neglect to use a Bonferoni correction. A false
positive in this instance would not significantly hinder the findings.
69
Construct validity
To determine the construct validity of the AMOM-R, it was examined in relation
to demographic variables (Table 8) and measures of two known factors to influence
PND (EDS and MPS; Table 9).
ANOVA’s performed on non-dichotomous variables (age and ethnicity) revealed
no significant effect of age or ethnicity on either the facilitator or regulator subscale.
Mean facilitator age was 30 years, marginally higher than that of regulators (27 years),
however not significant. T-tests performed on the remaining dichotomous variables
concluded an insignificant relationship between each variable and the facilitator and
regulator scores, implying that facilitator and regulator maternal orientations are
independent of key demographic variables.
The demographic variables were also assessed in relation to scores on the EDS
and MPS subscales. A significant difference emerged between the mean EDS scores of
women educated to degree level, and women not attending university; t(50)=-2.15,
p=.04. The negative t-value indicates that women with university degrees had
significantly lower levels of antenatal depression than women not attending university.
A similar trend emerged between women in full time employment, and women
employed less than full time, t(50)=-2.99, p=.02, with women in full time employment
having significantly lower antenatal depression scores than women employed less than
full time. The most significant difference in EDS scores emerged between women who’s
pregnancy was planned, and women who had unexpected pregnancies. First time
mothers who did not plan their pregnancy had significantly higher antenatal depression
scores than those who had planned their pregnancy; t(50) = -2.56, P= .01. Finally, there
was an insignificant negative trend towards women in a married or co-inhabiting
relationship having lower EDS scores than single first time mothers; t(50)=-.79, p=.08.
The theoretical concept of maternal orientation has been well documented, and
differing maternal orientations have been explored in research using multiple report
scales (Roncolato & McMahon, 2012) The AMOM-R is a reduced version of the AMOM
and is thought to most reliably discriminate between maternal orientations. Thus far,
this measure has only been used in one known study, however these authors reported
positive findings with respect to internal consistency and construct validity with an
Australian population. Therefore, this study aimed to further validate the AMOM-R in its
ability to identify women with a strong facilitator or regulator orientation, using a UK
sample. It also considered the construct validity of the AMOM-R using two known
factors (antenatal depression and perfectionism) to further current understanding of
the theory of maternal orientation.
Demographics
The first stage of analysis focused on the demographics of the current UK sample,
and the previous Australian sample (Roncolato & McMahon, 2012). On many of the
demographics, the two samples were similar. For example, 82% of the UK sample were
either married or living with their partner, compared to 96% of the Australian sample.
This indicates that in both samples, the majority of participants were married. Similarly,
an equal number of participants across both samples had obtained a minimum
education of attending university. Finally, the majority of participants in both samples
reported a planned pregnancy. Roncolato & McMahon (2012) indicated that regulator
orientations are more common in unplanned pregnancies, and also when there is no one
to share the burden of pregnancy and child care (Raphael-Leff, 1985a). High prevalence
of planned pregnancies and partnered relationships could reduce the number of women
identified in both of these samples as having a regulator orientation.
74
As many of the demographics assessed in the two samples were similar, this
would suggest that the results would subsequently be similar if the measure was
reliable. Interestingly, there were two noticeable differences. Firstly, a larger proportion
of the UK sample was in full time employment. Due to lack of information regarding the
Australian sample, it is not possible to know whether those participants not in full time
employment were employed, worked part time, or had partners working full time. As
previously discussed, life stressors and antenatal stress can increase a woman’s risk of
developing PND (Beck, 2001). Unemployment could be considered a life stressor, and
has further been identified as a risk factor for regulators developing PND (Raphael-Leff,
1985a). If regulators are unemployed, they are unable to return to the adult life they
crave. Therefore it would be beneficial to identify the employment status of those
women in the Australian sample that are not in full time employment. With few women
in the Australian sample in full time employment, it is possible that there would be
fewer regulators present in this sample, which would make assessment of the regulator
subscale less reliable.
The second difference between the two samples regards ethnicity. The UK
sample was 61% White British, 11% White Other1, 9.3% Asian2, 7.4% Mixed
Background3 and 3.7% Black. According to the Office for National statistics (2011),
White British is the largest ethnic population in Birmingham (53%) with the second
largest ethnicity being Asian (19.5%), predominantly Asian Indian. As the majority of
the sample for this study was White British, it was broadly representative of the
Birmingham population. There were fewer participants describing themselves as Asian
than would be expected, however there were subsequently greater numbers of
1 White other incorporates: White other and White Irish 2 Asian incorporates: Asian Pakistani, Indian, Bangladeshi and any other Asian background 3 Mixed background incorporates: Mixed white/black Caribbean and Mixed other
75
participants considering themselves “White Other”, many of whom were from European
countries. Thus, it is possible that since the 2011 census there has been a greater influx
of individuals from European countries. Furthermore, it is possible that the midwifery
teams used for recruitment were in less diverse areas of Birmingham.
In the Australian sample, 95% of the participants were described as Caucasian.
The Australian Bureau of Statistics (2011) however, reflects a Chinese population that
was not represented in this sample. In some ways, the UK sample is comparable to the
Australian sample, however the UK sample consisted of more mixed ethnicities and was
more reflective of the local population.
Reliability
Responses to the AMOM-R from this sample were compared to the responses
from the Australian study (Roncolato & McMahon, 2012) to assess the reliability of the
measure. Reliability is the extent that two samples provide consistent results. Previous
research indicated that the medical advice presented to pregnant women, and the
incidence of postnatal depression, were consistent across Australia and the UK (Cox et
al., 1993).Based on this, it was expected that the samples would not differ significantly in
their responses on the AMOM-R.
The mean scores and standard deviations for each subscale in this sample were
comparable with the Australian sample. Thus, the AMOM-R scores have been consistent
across the two samples, reflecting good reliability.
The AMOM-R was able to identify 44% of the current sample as women with a facilitator
orientation and 5.6% of the sample as women of a regulator orientation. The previous
study elected to remove the bipolar response scales, however failed to calculate cut off
to identify women with extreme maternal orientations, thus it is not possible to
compare these figures to other findings for reliability. For this study, a clinical cut-off to
76
identify strong facilitator and regulator orientations was briefly explored using one
standard deviation above the mean. It would be beneficial to develop a gold standard
clinical cut off for the AMOM-R, however further studies are required to incorporate a
wider range of responses and calculate generalizable subscale means. Following this,
one standard deviation can be considered to highlight strong orientations, with an
option for two standard deviations to represent extreme, highly vulnerable women.
One difference between the Australian sample and the current sample was the
range of scores on the facilitator subscale. The Australian sample scores ranged from 14-
48, whilst the lowest facilitator subscale score in the current sample was 22-49. This is
most likely due to the smaller sample size of the current sample, which might be
expected to yield a narrower range of scores.
Internal consistency
Internal consistency is the extent in which individual items in a response scale
correlate with each other. A high correlation indicates that the questions are measuring
the same construct and that participants are responding to each question in a similar
way. Roncolato & McMahon (2012) presented good internal consistency scores for their
sample; with the regulator subscale having a Cronbach’s alpha of .71 and the facilitator
subscale having an alpha of .72. The internal consistency for each subscale of the AMOM-
R in this sample was slightly lower than that reported by Roncolato & McMahon (2012).
The Cronbach’s alpha for the regulator subscale was .64 and was.65 for the facilitator
subscale. These were both .07 lower than the Cronbach’s alpha reported for the
Australian sample. There were insufficient numbers of women scoring highly enough on
the regulator subscale to assess the utility of the individual regulator subscale questions.
It is likely that with a larger sample size, a larger proportion of women would be
identified, allowing more in depth exploration. Conversely, however, 'I will mostly be
77
feeling trapped' is the regulator subscale alternative to ' I mostly be feeling fulfilled.' The
contrast between these two adjectives is stark, with one clearly being heavily negatively
weighted. As previously outlined, many mothers find it difficult to express negative
opinions regarding motherhood (Hall, 2006), therefore the regulator expression of
“feeling trapped” would inevitably be harder for women to endorse (For frequencies see
Appendix B). There is a chance that the low numbers of regulators in this sample are to
some extent due to the wording of the regulator subscale. Further research may be
beneficial to consider the effects of decreasing the severity of the adjectives used in the
regulator subscale, to allow women to endorse them more openly.
It was possible, however, to improve the Cronbach’s alpha of the facilitator
subscale. Three items were identified as being unreliable in identifying women of a
strong facilitator maternal orientation. The first was “I intend to mostly breastfeed.”
Removing this question improved the Cronbach’s alpha from .65 to .72, placing it in line
with the Australian sample. Breast-feeding is actively promoted in both Australia and
the UK. In Australia, 96% of infants are breastfed exclusively following birth (AIHS,
2011) whilst in the UK 81% were breastfed exclusively (NHS information centre, 2012).
These statistics highlight that the majority of women elect to breastfeed. 86% of the
women in this study reported that they would initially breastfeed, which is
representative of the national published statistics. Since 2005, the NHS heavily
emphasizes the promotion of breastfeeding to pregnant women due to the biological
advantages to the child (Cattaneo et al., 2005). Due to this, there are two possible
explanations for this question being less reliable in identifying women of a strong
facilitator orientation. Firstly, the majority of women in this study were approached in
GP surgeries whilst attending antenatal appointments. This setting could generate a
social desirability bias in which women may respond positively to breastfeeding, despite
78
endorsing alternative personal beliefs. An alternative explanation could be that the
biological advantage of breast feeding is widely recognized in modern society and thus,
more women may elect to breastfeed for the benefit of their child, despite their
otherwise regulator orientation. Thus, it may be that Raphael-Leff’s (1998) proposition
that women of a regulator orientation elect to bottle feed to allow for distribution of
child care, may no longer be accurate. It is clear that in this sample, the notion of breast-
feeding failed to effectively distinguish between women of a facilitator or regulator
orientation.
Following the deletion of this question, the Cronbach’s alpha could be further
improved from .72 to .76 for this sample, through deleting question 7: “after several
months, I intend to feed my baby on demand.” Responses to this question failed to
positively correlate with responses to any of the remaining eight questions for this
sample. This implies that this question is not targeting characteristics of a facilitator
maternal orientation.
Interestingly, in conjunction with this, the third question that would improve the
Cronbach’s alpha also targets feeding schedules: “To begin with, I intend to feed my baby
on demand.” This question failed to correlate with the majority of questions on the
facilitator subscale. Most significantly, it negatively correlated with the facilitator
characteristic of expecting to feel fulfilled following childbirth. This means there was an
insignificant trend towards women who reported strongly believing they would feed
their child on demand at first, also not believing they would feel fulfilled. As feeling
fulfilled significantly correlated with other questions, it appears that this is targeting
facilitator characteristics, and feeding schedules are not.
Interestingly, 90% of participants responded positively to feeding their baby on
demand at first. Due to this, the question is not able to identify women with strong
79
facilitator orientations from women with regulator orientations. A possible explanation
for the positive response to this question could be advice provided by midwives
regarding feeding schedules. The NHS recommends feeding a baby whenever it indicates
hunger. Many hospitals practice self-demand feeding as it results in the child feeding
better at the breast and increases milk production (Iacovou & Sevilla, 2013).
Furthermore, the WHO recommends baby led feeding:
“Mothers of normal babies (including caesareans) who are breastfeeding should have no restrictions placed on the frequency or length of their babies’ breastfeeds. They should be advised to breastfeed their babies whenever they are hungry or as often as the baby wants”(WHO, 1992).
This advice could reduce the distinction between facilitators and regulators
regarding feeding schedules, with many regulators choosing on demand feeding, as
advised by healthcare workers. This operated in conjunction with the possibility of more
regulators electing to breastfeed, as breastfeeding mothers are advised to feed on
demand to encourage milk production (WHO, 1992). Therefore, more women electing to
breastfeed will most likely result in more women electing to initially feed on demand.
Following the deletion of these three questions, the AMOM-R reliably consisted of
seven questions, with the majority of these questions correlating with each other at the
p<.001 level. This reflects that these questions are all identifying characteristics
associated with one another; in that women responding positively to one question also
respond positively to subsequent questions in the subscale. This provides strong
evidence that the AMOM-R facilitator subscale is efficient in identifying women with a
strong facilitator maternal orientation.
80
Further research would be required to determine whether the three unreliable
questions identified using this sample are subsequently unreliable in further samples,
and therefore would require permanent removal.
Construct Validity
Construct validity is the extent that the AMOM-R is assessing maternal
orientation and the extent that the theory of maternal orientation is a valid predictor of
PND. Thus, the results of the AMOM-R were correlated with the results from other
measures that are subsequently known to predict PND.
AMOM-R and Depression
According to Rapheal-leff’s (1983) theory of maternal orientation, a regulator
sees a developing baby as a parasite, feeding on her resources. She is also irritated by
feeling tired and distracted by the baby’s movements. Sharp & Bramwell (2010)
proposed that a regulator would be most vulnerable to developing PND either whilst
pregnant, or in the first six to eight weeks postpartum. Therefore, one method to assess
the construct validity of the AMOM-R was to compare it to ratings of antenatal
depression, using the EDS. It was expected that women scoring highly on the regulator
maternal orientation subscale, would subsequently have higher levels of antenatal
depression than women scoring highly on the facilitator subscale.
In line with the hypothesis, there was a significant positive relationship between
regulator maternal orientation and antenatal depression. This suggests that women
scoring highly on the regulator subscale, subsequently scored highly on the EDS,
implying greater antenatal depression. These findings support the notion that women
81
with regulator maternal orientations are more vulnerable to antenatal depression.
Subsequent follow up analysis would be required to determine whether this further
linked to development of PND. Despite the small sample size and the small proportion of
participants that reached the devised clinical cut off for being identified as holding
strong regulator beliefs, this correlation emerged as significant at the p<.001 level. This
implies that there is a very strong relationship between regulator maternal orientation
and antenatal depression. The hypothesis is further supported by the lack of significant
relationship between high facilitator scores and antenatal depression.
As these findings support the background literature regarding regulator maternal
orientation and antenatal depression, it implies good construct validity of the AMOM-R;
in that the theory of maternal orientation has been supported by other known factors,
and that a regulator maternal orientation was able to predict antenatal depression.
AMOM-R and Perfectionism
Perfectionism has been identified as a risk factor for developing PND, more
specifically, socially orientated perfectionism. Rapael-Leff’s (1983) theory of maternal
orientation indicates that women of a facilitator orientation take a baby-led stance on
parenting, in that they believe their baby knows best regarding their care. If this
theoretical concept were accurate, a facilitator would be less likely to endorse
perfectionism traits, as they are not placing any demand on themselves, nor do they feel
demands from any other individual.
This hypothesis is supported by the results of this study. There was a significant
negative relationship between facilitator maternal orientation and self orientated
perfectionism. This means that the more strongly a woman endorsed facilitator
82
characteristics, the lower she scored on the MPS measure of self-orientated
perfectionism. This relationship was significant at the p<.001 level, indicating a very
strong relationship. Further support arises from the other orientated perfectionism
subscale. Again, there was a significant negative relationship between facilitator
orientation and scores on this perfectionism subscale. Finally, despite the relationship
not being significant, a negative trend emerged between facilitator orientation and
socially prescribed perfectionism.
This sample consisted of a substantial number of women scoring more than one
standard deviation above the facilitator subscale mean, and therefore meeting the
decided criteria for clinical cut off. This indicates that there are sufficient data to
calculate this relationship between facilitator orientation and reduced perfectionism.
This result provides further support for the construct validity of the theory of maternal
orientation and the AMOM-R in measuring it.
Limitations
Despite the positive findings from this study, it is not without limitations. The
most significant limitation this study faced was a small sample size. This was beyond
researcher control due to time constraints and delayed approval from the ethics board.
The sample size of this study was significantly smaller than that of the Australian
comparison study (Roncolato & McMahon, 2012). Despite this, the results were
predominantly comparable with the Australian sample, and significant findings
emerged, representing the strength of the associations.
A second limitation was the small number of women strongly endorsing
regulator characteristics. This resulted in insufficient findings to assess the internal
83
validity of the regulator subscale. It appears that facilitator orientations may be more
common, and thus a larger sample size may identify more women endorsing a regulator
orientation.
A final limitation to consider is the location of the research. The majority of
women took part in a GP surgery, whilst waiting for an antenatal appointment. It is
highly possible therefore that social desirability may have influenced their responses,
for example more women may have reported intending to breastfeed due to it being an
accepted social convention, regardless of their individual beliefs. Future research should
attempt to control for social desirability by conducting the research away from medical
facilities.
Conclusions
The results of this study indicate that the facilitator subscale of the AMOM-R has
good internal consistency and has provided reliable results across two samples with
varying ethnicity and employment status. Despite this, there is potential to improve the
measure through removing three questions. Following this, the remaining seven
questions reflect high internal consistency. Further research should focus on whether
these three questions fail to significantly correlate with the remaining questions in the
subscale, and subsequently should be permanently removed.
Furthermore, this study supports the theoretical concept of maternal orientation.
Regulators in this study were more likely to experience antenatal depression, in line
with expectation, and facilitators expressed reduced perfectionism, supporting the
assumption of facilitators assuming a baby-led parenting style. The wider study is
researching whether maternal orientation can be a predictor of PND by following
84
women up six weeks postpartum. The results of this will conclude the full utility of the
AMOM-R as well as the extent that maternal orientation can accurately be used as a
predictor of PND.
85
Appendix A Regulator Subscale Strongly
disagree Disagree Slightly
disagree Slightly agree
Agree Strongly agree
- My baby will be like a stranger at first - My baby will be unable to tell me apart from other people early on
- To begin with, I intend to feed my baby at set times - I intend to mostly bottle feed - I will be mostly trying to get the baby into a routine - I will be mostly feeling trapped - I will be mostly waiting for things to get back to normal
- After several months, I intend to feed my baby on demand
Facilitator Subscale Strongly Disagree
Disagree Slightly disagree
Slightly agree
Agree Strongly agree
- My baby will be like someone that I already know - My baby will be able to tell who I am from early on - To begin with, I intend to feed my baby on demand - After several months, I intend to feed my baby on demand
- I intend to mostly breastfeed - I will mostly be feeling fulfilled - I will be mostly enjoying the new way of life - My baby will fit easily into my life - My baby will be born being able to communicate with me
- My baby will be born knowing whats best for him/her
Appendix B Table 10 Frequencies of responses to AMOM-R Regulator questions (N=50)
Question Agree (%)
Disagree (%)
Regulator Subscale
(Q2) My baby will be like a stranger at first 22 78 (Q3) My baby will be able to tell who I am from early on 96 4 (Q18) In the first few weeks I will mostly be waiting for things to get back to normal
22 78
(Q4) My baby will be unable to tell me apart from other people early on 14 86 (Q9) To begin with, I intend to feed my baby at set times 36 64 (Q10) After several months, I intend to feed my baby at set times 78 22 (Q13) I intend to mostly bottle feed 34 66 (Q14) In the first few weeks I will be mostly trying to get the baby to adapt to a routine
74 26
(Q16) In the first few weeks I will mostly be feeling trapped 14 86
References Chapter 1 Allardyce, J., Suppes, T. & Van Os, J. (2007). Dimensions and the psychosis phenotype. International Journal of Methods in Psychiatric Research, 16, S34-S40. Auther, A., Smith, C. & Cornblatt, B. (2006). Global Functioning: Social Scale (GF: Social). Glen Oaks, NY: Zucker Hillside Hospital.
Beck, A., Ward, C., Mendelson, M., Mock, J., & Erbaugh, J. An inventory for measuring depression. (1961). Archives of General Psychiatry, 4: 561-571.
Corrigan, P., Watson, A. & Barr, L. (2006). The self-stigma of mental illness: Implications for self-esteem and self-efficacy. Journal of Social and Clinical Psychology, 25, 875-884).
Fusar-poli, P., Bonoldi, I., Yung, A., Borgwardt, S., Kempton, M., Valmaggia, L., Barale, F., Caverzasi, E. & McGuire, P. (2012). Predicting psychosis: meta-analysis of evidence of transition outcomes in individuals at high clinical risk. Archives of General Psychiatry, 69, 220 – 229.
Kelleher, I., Jenner, J. & Cannon, M. (2010). Psychotic symptoms in the general population – an evolutionary perspective. British Journal of Psychiatry, 197, 167-169. Kay, S., Fiszbein, A. & Opler, L. (1987). The positive and negative syndromes scale (PANSS) for schizophrenia. Schizophrenia Bulletin, 13, 261-279. Kessler, R., Andrews, G., Colpe, A.et al. (2002). Short screening scales to monitor population prevalences and trends in non-specific psychological distress. Psychological Medicine, 32, 959-956.
Kirkbride, J., Jackson, D., Perez, J., Fowler, D., Winton, F., Coid, J., Murray, R. & Jones, P. (2012). A population-level prediction tool for the incidence of first-episode psychosis: translational epidemiology based on cross-sectional data. British Medical Journal Open, 3. Lin, A., Nelson, B, & Yung, A. (2012). At-risk for psychosis research: where are we heading? Epidemiology and Psychiatric Sciences, 1-6. Mattick, R. & Clarke, J. (1989). Development and validation of measures of social phobia scrutiny fear and social interaction anxiety. Unpublished manuscript. McGorry, P., Hickie, I., Yung, A., Pantelis, C. & Jackson, H. (2006). Clinical staging of psychiatric disorders: a heuristic framework for choosing earlier, safer and more effective interventions. Australian and New Zealand Journal of Psychiatry, 40, 616-622. Morosini, P., Magliano, L., Brambilla, L., Ugolini, S. & Pioli, R. (2000). Development, reliability and acceptability of a new version of the DSM-IV Social and Occupational Functioning Assessment Scale (SOFAS) to assess routine social functioning. Acta Psychiatrica Scandinavica, 101, 323-329. Nelson, B., Simmons, M., Yung, A., Buckby, J., O’Dwyer, L., Francey, S., Leicester, S., Bapat, S. & McGorry, P. (2008). Identifying the ultra-high risk (prodromal) population:
Evaluation of training workshops with mental health services. Australian and New Zealand Journal of Psychiatry, 42, 236-243. Niendam, T., Bearden, C., Johnson, J. Cannon,T. (2006). Global Functioning: Role Scale (GF: Role). Los Angeles, CA: University of California, Los Angeles. Norman, S., Cissell, S., Means-Christensen, A. & Stein, M. (2006). Development and validation of an Overall Anxiety Severity And Impairment Scale (OASIS). Depression and Anxiety, 23, 245–249. Yang, L., Wonprat-Borja, A., Opler, M. & Corcoran, C. (2010). Potential stigma associated with inclusion of the psychosis risk syndrome in the DSM-V: An empirical question. Schizophrenia Research, 120, 42-48. Yung, A., McGorry, P., McFarlane, C., Jackson, J., Paton,G. & Rakkar, A. (1996). Monitoring and care of young people at incipient risk of psychosis. Schizophrenia Bulletin, 22, 283-303. Yung, A., Yuen, H. & McGorry, S. et al. (2005). Mapping the onset of psychosis: the Comprehensive Assessment of At-Risk Mental States. Australia and New Zealand Journal of Pschiatry, 39, 964-971. Yung, A. & McGorry, P. (2007). Prediction of psychosis: setting the stage. British Journal of Psychiatry, 191, S1-S8. References Chapter 2
Cantor-Graae, E. & Selten, J. (2005). Schizophrenia and Migration: A meta analysis and review. American Journal of Psychiatry, 162, 12-24. King, M., Coker, E., Leavey, G., Hoare, A. & Johnson-Sabine, E. (1994). Incidence of psychotic illness in London: Comparison of ethnic groups. British Medical Journal, 309(6962), 1115-1119. Lau, P., Cheng, J., Chow, D., Ungvari, G. & Leung, C. (2009). Acute psychiatric disorders in foreign domestic workers in Hong Kong: a pilot study. International Journal of Social Psychiatry, 55(6), 569-576. Marneros, A. & Pillman, F. (2002). Acute and transient psychotic disorders. Fortschrittle der Nurologie, 13, 276-286. Mulder, E., Robles de Medina, P., Huizink, A., Van den Bergh, B., Buitelaar, J. & Visser, G. (2002). Prenatal maternal stress: effects on pregnancy and the (unborn) child. Early Human Development, 70, 3-14. Myers, N. (2011). Update: Schizophrenia Across Cultures. Curr Psychiatry Rep, 13,305–311.
Rusaka, M. & Rancans, E. (2014). First episode acute and transient psychotic disorder in Latvia: a 6 year follow up study. Nordic Journal Psychiatry, 68(1), 24-29. Singh, S., Burns, T., Amin, S., Jones, P & Harrison, G. (2004). Acute and transient psychotic disorders: precursers, epidemiology, course and outcome. British Journal of Psychiatry, 185, 452-459. Zumpe, J., Dormon, O. & Jefferies, J. (2012) Childbearing Among UK Born and Non-UK Born Women Living in the UK. London: Office for National Statistics.
References Chapter 3
AIHW. (2011). 2010 Australian national infant feeding survey: Indicator results. Cat. no. PHE 156. Canberra: AIHW. Astbury, J. (1994). Making motherhood visible: the experience of motherhood questionnaire. Journal of reproductive Infant Psychology, 12, 78-88. Australian Bureau of Statistics. (2001). Melbourne, Indigenous Profile, http://www.censusdata.abs.gov.au/census_services/getproduct/census/2011/quickstat/SSC20867?opendocument&navpos=220. Beck, C. (2001). Predictors of postpartum depression: an update. Nursing Research, 50(5), 275-285. Beck, C. & Indman, P. (2005). The many faces of postpartum depression. Journal of Obstetrics and Gynocological Neonatal Nursing, 34(5), 569-576. Campbell, S., Cohn, J. & Maybers, S. (1995). Depression in first time mothers: mother-infant interaction and depression chronicity. Developmental Psychology, 31, 349-357. Cattaneo, A., Yngve, A., Koletzko, B. & Gozman, L (2005). Protection, promotion and support of breast feeding in Europe: current situation. Public Health Nutrition, 8(1), 39-46. Cooper, P., Campbell, E. & Day, A. et al. (1988). Non-psychotic psychiatric disorder after childbirth. A prespective study of incidence, course and nature. British Journal of Psychiatry, 152, 799-806. Cox, J., Holden, J. & Sagovsky, R. (1987). Detection of postnatal depression: development of the 10-item Edinburgh Postnatal Depression Scale. British Journal of Psychiatry, 150, 782-786. Cox, J., Murray, D. & Chapman, G. (1993). A controlled study of the onset, duration and prevelance of postnatal depression. British Journal of Psychiatry, 163, 27-31. Gelabert, E., Subira, S., Garcia-Esteve, L. et al. (2012). Perfectionism dimensions in major postpartum depression. Journal of Affective Disorders, 136(1-2), 17-25.
Dimitrovsky, L., Levy-Shiff, R. & Schattner-Zanany, I. (2002). Dimensions of depression and perfectionism in pregnant and nonpregnant women: their levels and interrelationships and their relationship to marital satisfaction. British Journal of Psychology, 136, 631-636
Hall, P. (2006). Mother’s expectations of postnatal depression: an interpretative phenomenological analysis. Community Practice, 79 (8), 256 – 260. Hall, P. & Wittowski, A. (2006). An explanation of negative thoughts as a normal phenomenon after childbirth. Journal of Midwifery and Women’s Health, 51(5), 321-330. Hewitt, P. & Flett, G. (1991). Dimensions of perfectionism in unipolar dimension. Journal of Abnormal Psychology, 100, 98-101.
Hewitt, P., Flett, G., Turnbull-Donovan, W. & Mikail, S. (1998). The Multidimensional Perfectionism Scale: reliability, validity and psychometric properties in psychiatric samples. British Medical Journal, 316, 1236-1238.
Hiltunen, P., Jokelainen, J., Ebeling, H., Szajnberg, N. & Mollanen, I. (2001). Seasonal variation in postnatal depression. Journal of Affective Disorders, 78(2), 111-118. Iacovou, M. & Sevilla, A. (2013). Infant feeding: the effects of scheduled vs. on-demand feeding on mothers' wellbeing and children's cognitive development. European Journal of Public Health, 23(1), 13-9. Kline, P. (2000). The handbook of psychological testing (2nd ed.). London: Routledge, page 13. Kurinij, N. & Shiono, P. (1991). Early formula supplementation of breast feeding. Peadiatrics, 88(4), 745-750. Leigh, B. & Milgram, J. (2008). Risk factors for antenatal depression, postnatal depression and parenting stress. BioMed Central Psychiatry, 8(24). Macedo, A., Carvalho Bos, S., Marques, M., Maia, B., Joao Soares, M., Pereira, T., Allen Gommes, A., Valente, J. & Azevedo, M. (2009). Perfectionism dimensions in pregnancy – a study in portuguese women. Archives of Womens Mental Health, 12, 43-52. Maia, B., Pereira, A., Marques, M., Bos, S., Soares, M., Valente, J., Gomes, A., Azevedo, M. & Macedo, A. (2012). The role of perfectionism in postpartum depression and symptomology. Archives of Womens Mental Health, 15, 459-468. Marcus, S., Flynn, H., Blow, F. & Barry, K. (2003). Depressive symptoms among pregnant women screened in obstetrics settings, Journal of Women’s Health, 12(4), 373-380.
McAndrew, F., Thompson, J., Fellaus, L., Large, A., Speed, M. & Ranfrew, M. (2012). NHS Information Centre. Infant feeding survey, UK, 2010. Murray, L. (1992). The impact of postnatal depression on infant development. Jounal of Child Psychiatry, 22, 543-561. Murray, D. & Cox, J. (1990). Screening for depression during pregnancy with the edingburgh depression scale. Journal of Reproductive and Infant Psychology, 8(2), 99-107. Office for National Statistics (2011) Census: Digitised Boundary Data (England and Wales) [computer file]. UK Data Service Census Support. Downloaded from: http://edina.ac.uk/census. O’hara, M. & Swain, A. (1996). Rates and risk of postnatal depression – a meta-analysis. International Review of Psychiatry, 8(1), 37-54. Parker, W. & Adkins, K. (1995). Perfectionism and the gifted. Roeper Review, 17(3), 1973-1976. Raphael-Leff, J. (1985). Facilitators and regulators: Vulnerability to postnatal disturbance. Journal of Psychosomatic, Obstetrics and Gynaecology, 4, 151-168. Raphael-Leff, J. (1985a). Facilitators and regulators: vulnerability to postnatal disturbances. Journal of Psychosomatic Obstetrics and Gynaecology, 4, 151-168. Raphael-leff, J. (1986). Facilitators and regulators: conscious and unconscious processes in pregnancy and early motherhood. British Journal of Medical Psychology, 59, 43-55. Raphael-Leff, J. (2010). Healthy maternal ambivalence. Studies in the Maternal, 2(1). Roncolato, W. & McMahon, C. (2011). Facilitators and regulators: psychometric properties of maternal orientation measures in pregnancy. Journal of Reproductive and Infant Psychology, 29(5), 240-238. Rubertsson, C., Waldenstrom, U. & Wickberg, B. (2003). Depressive mood in early pregnancy: prevelance and women at risk in a national sweedish sample. Journal of Reproductive and Infant Psychology, 21(2), 113-123. Perneger, T. (1998). What’s wrong with Bonferroni adjustments. British Medical Journal, 316, 1236.
Scher, A. (2001). Facilitators and Regulators: Maternal orientation as an antecedent of attachment security. Journal of Reproductive Infant Psychology, 19(4), 325-333. Sharp, H. & Bramwell, R. (2004). An empirical evaluation of a psychoanalytic theory of mothering orientation: implications for the antenatal prediction of postnatal depression. Journal of Reprodctive and Infant Psychology, 22(2), 71-89.
Stein, A., Garth, D., Bucher, J., Band, A., Day, A. & Cooper, P. (1991). The relationshop between postnatal depression and mother-child interaction. British Journal of Psychiatry, 158, 46-52. Van Bussel, J., Spits, B. & Demyttenaere, K. (2009). Depressive symptomology in pregnant and postpartum women: an exploratory study of the role of maternal orientations. Archives of Womens Mental Health, 12, 155-166. Williamson, V. & McCutchen, H. (2004). Postnatal depression: a review of the current literature. Australian Journal of Midwifery, 17(4), 11-16. World Health Organisation & UNICEF. (1992). The Global Criteria for the WHO/UNICEF Baby Friendly Hospital Initiative. In: Baby Friendly Hospital Initiative. Part II. Hospital level implementation.