47
Exploring New Pathways in the Management of Diabetes through DPP-4 Inhibitors YoungMin Cho, MD, PhD Department of Internal Medicine Seoul National University College of Medicine

Exploring New Pathways
in the Management of Diabetes
through DPP-4 Inhibitors
Young Min Cho, MD, PhD
Department of Internal Medicine
Seoul National University College of Medicine

Le MariageWine & Cheese

Le Mariage홍어 + 돼지고기 + 김치

Le Mariage
?

Vildagliptin (Galvus®)
A highly specific substrate of the enzyme DPP-4
Substrate-like
enzyme blocker
+
DPP-4
K-1
K1
Substrate-like
enzyme blocker:
DPP-4 complex
K2
Slow
(~ 1 h)
DPP-4Inactive
substrate-like
enzyme blocker
+Slow dissociation

0
25
50
75
100
125
-2 0 2 4 6 8 10 12 14 16 18 20 22 24Time (h)
Vildagliptin Dose-dependency of DPP-4 Inhibition in
Patients with T2DMDPP-4 activity (% baseline)
Placebo (n=16)
Vilda 10 mg (n=16)
Vilda 25 mg (n=16)
Vilda 50 mg (n=16)
Vilda 100 mg (n=15)
Vilda 200 mg (n=16)
Vilda 400 mg (n=16)
DPP-4=dipeptidyl peptidase-4; T2DM=type 2 diabetes mellitus; vilda=vildagliptin.
He YL, et al. J Clin Pharmacol. 2007; 47: 633–641.
Vildagliptin 100 mg once daily was used in this study. Galvus (vildagliptin) is approved for 50 mg once or twice daily in
combination with metformin or a TZD, and Galvus (vildagliptin) 50 mg once daily in combination with a sulfonylurea.
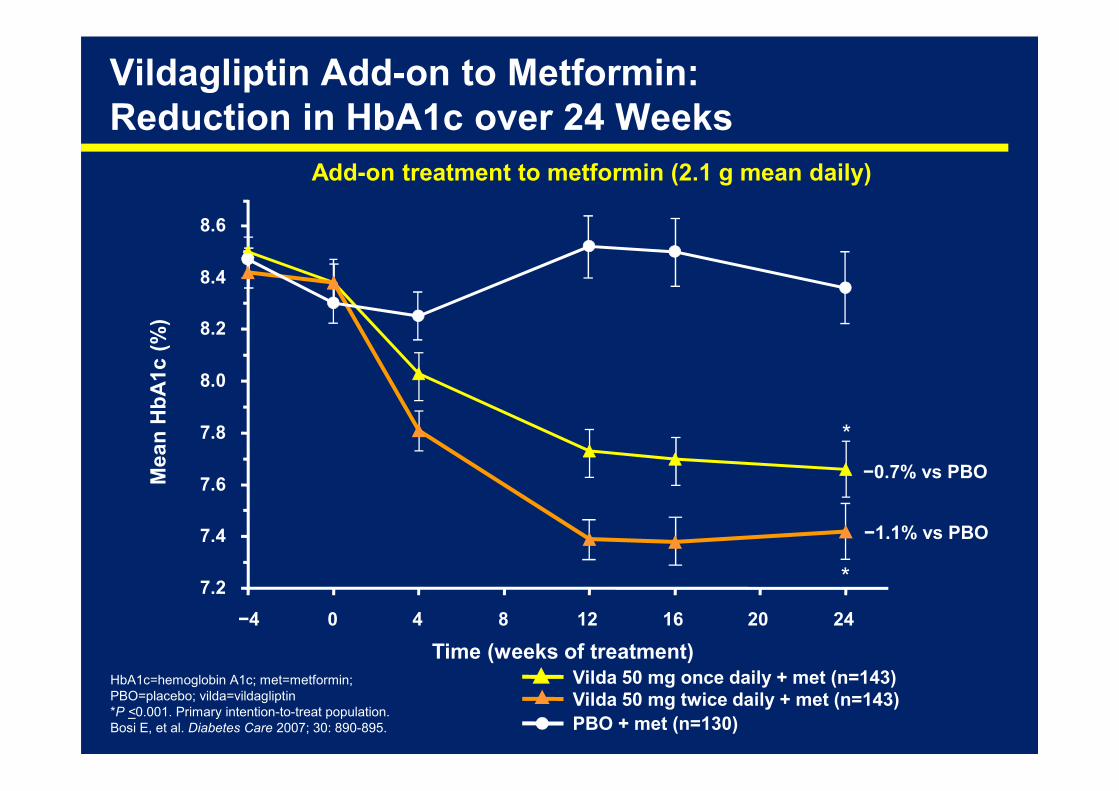
HbA1c=hemoglobin A1c; met=metformin;
PBO=placebo; vilda=vildagliptin
*P <0.001. Primary intention-to-treat population.
Bosi E, et al. Diabetes Care 2007; 30: 890-895.
Vildagliptin Add-on to Metformin:
Reduction in HbA1c over 24 Weeks
7.2
7.4
7.6
7.8
8.0
8.2
8.4
8.6
−4 0 4 8 12 16 20 24
Time (weeks of treatment)
Mean HbA1c (%)
PBO + met (n=130)
Vilda 50 mg twice daily + met (n=143)
Vilda 50 mg once daily + met (n=143)
Add-on treatment to metformin (2.1 g mean daily)
−0.7% vs PBO
−1.1% vs PBO
*
*

HbA1c=hemoglobin A1c; PBO=placebo; SU=sulfonylurea; vilda=vildagliptin.
*P <0.001 vs PBO. Primary intention-to-treat population.
Garber A, et al. Diabetes Obes Metab. 2007; 10: 1047–1056.
Vildagliptin: Reduction in HbA1c over 24 Weeks
Time (Weeks)
7.6
7.8
8.0
8.2
8.4
8.6
8.8
9.0
−4 0 4 8 12 16 20 24
Mean HbA1c (%)
PBO + glimepiride (n=144)
Vilda 50 mg once daily + glimepiride (n=132)
Vilda 50 mg twice daily + glimepiride (n=132)
−0.6% vs PBO
−0.7% vs PBO
*
*
Duration: 24 weeks
Add-on to SU:
vilda vs PBO
Add-on Treatment to an SU (Glimepiride 4 mg Once Daily)

Le Mariage
GLP-1
secretagogues

Concentration of active liraglutide is higher than
GLP-1 concentration with a DPP-4 inhibitor
*GLP-1 levels for liraglutide calculated as 1.5% free liraglutide
Adapted from: Degn et al. Diabetes 2004;53:1187–94; Mari et al. J Clin Endocrinol Metab 2005;90:4888–94

GLP-1 Levels at 1 Month After Roux-en-Y Gastric Bypass
Surgery in Obese Patients With Type 2 Diabetes
Diabetes Care 30:1709–1716, 2007

ORAL GLUCAGON-LIKE PEPTIDE-1 (GLP-1) RECEPTOR
AGONISTS FOR THE TREATMENT OF TYPE 2 DIABETES
• In vitro activity of TTP GLP-1R agonist on GLP-1R: EC50 = 4–27nM
• Specific to human GLP-1R among members of the GLP-1R family
• A single p.o. administration reduced glucose excursions after an OGTT in normal mice– ↓ food intake, ↓ body weight, ↓ fat, ↑ c-fos in PVN and ARC
• ↑insulin secretion in response to glucose in vitro (human islets) and in vivo (mice and minipigs)
• Phase Ib/IIa with TPP054 compound – Oral bioavailability = 50%
– A 14 day treatment decreased both fasting and postprandial glucose levels.
– No nausea/vomiting
C. Valcarce et al. from Transtech Pharma, High Point, NC, USA
Abstracts of the 4th International Congress on Prediabetes and Metabolic Syndrome
Journal of Diabetes 2011;3(suppl 3): 16

MariageCombinations of GLP-1 secretagogues and DPP-4 inhibitors
Potential benefits
• Higher plasma GLP-1 levels
• Physiologic route of GLP-1
secretion
• Possible effects on food
intake, weight loss, and
gastric motility
DPP4
inhibitors
GLP-1
secretagogues

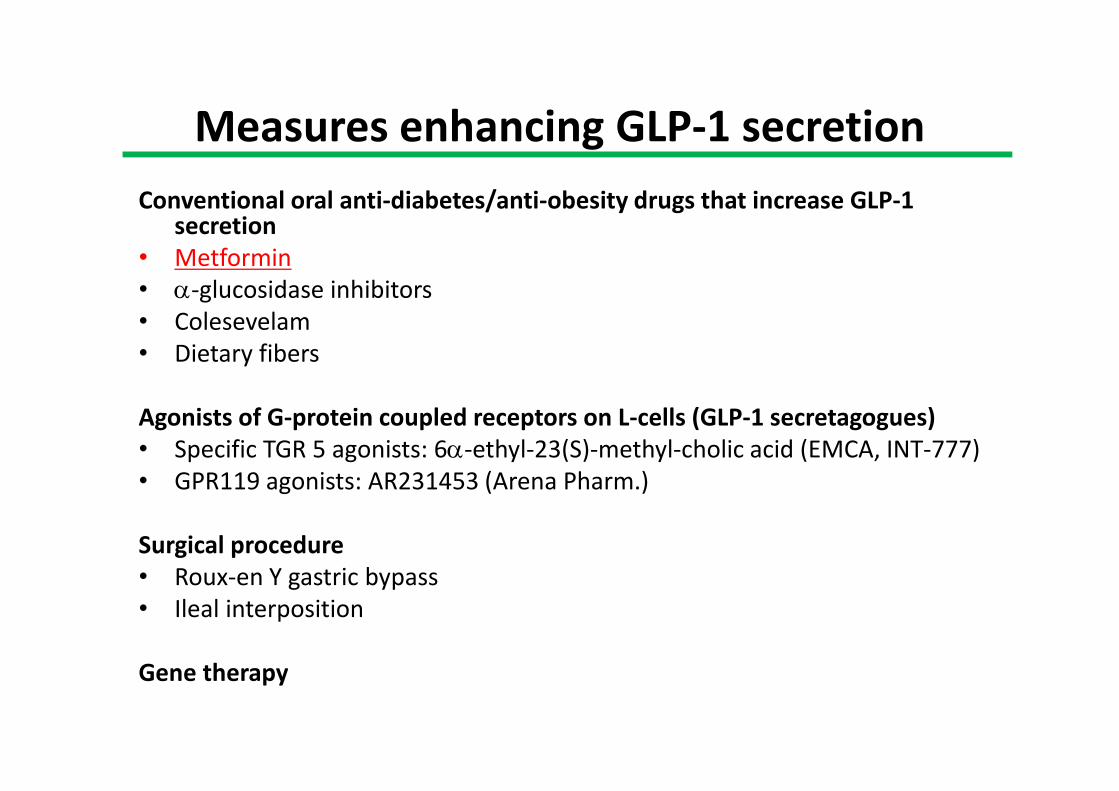
Measures enhancing GLP-1 secretion
Conventional oral anti-diabetes/anti-obesity drugs that increase GLP-1 secretion
• Metformin
• α-glucosidase inhibitors
• Colesevelam
• Dietary fibers
Agonists of G-protein coupled receptors on L-cells (GLP-1 secretagogues)
• Specific TGR 5 agonists: 6α-ethyl-23(S)-methyl-cholic acid (EMCA, INT-777)
• GPR119 agonists: AR231453 (Arena Pharm.)
Surgical procedure
• Roux-en Y gastric bypass
• Ileal interposition
Gene therapy
Cho YM, Merchant CE, Kieffer TJ: Pharmacology & Therapeutics 2011

Metformin differentially modulates
plasma levels of incretins in mice
Maida A et al. Diabetologia. 2011;54(2):339-49

Metformin at doses exhibiting GLP-1-increasing effects
exerted no effect on plasma DPP-4 activity in mice.
V, vehicle
A, AICAR 250 mg/kg
S, sitaglitpin 1 mg/kg
Maida A et al. Diabetologia. 2011;54(2):339-49

Metformin increases islet incretin receptor expression
in a PPARα dependent fashion in mice.
Maida A et al. Diabetologia. 2011;54(2):339-49

Metformin
(dimethylbiguanide)
PPARα
Beta cells
L cells
Hepatic glucose
production
GLP-1R & GIPR
GLP-1
K cells
No effect
Gastric emptying
GLP-1-mediated
?
Peripheral
glucose
disposal
Glucose
utilisation
in the gut
Cho YM & Kieffer TJ. Diabetologia 2010
Metformin: a GLP-1 enhancer and sensitizer

Co-administration of metformin/a DPP4 inhibitor increases
active GLP-1 greater than either drug alone in human subjects
Migoya EM. Clinical pharmacology & Therapeutics 2011
Healthy nondiabetic subjects (n = 16) received sitagliptin alone (100 mg once daily × 2 days),
metformin alone (500 mg twice daily on day 1 and 1,000 mg on day 2), coadministration treatment
(sitagliptin + metformin), or placebo in a blinded (double-dummy), randomized, crossover manner.
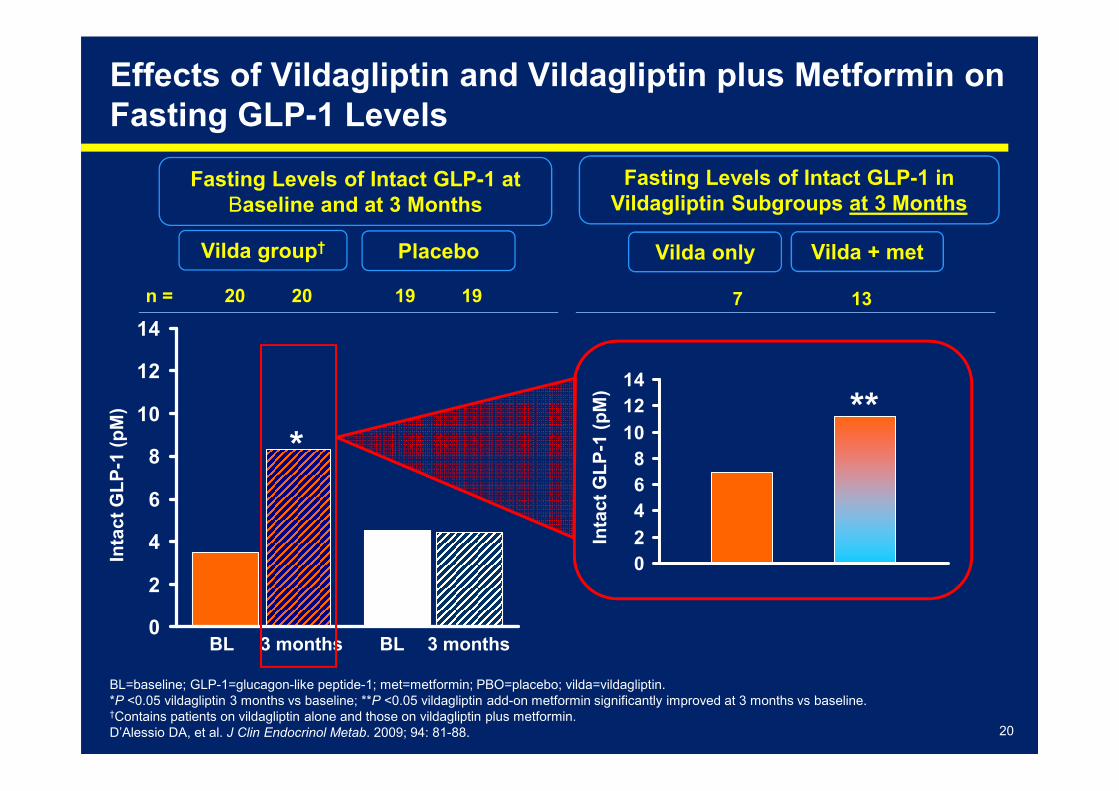
Effects of Vildagliptin and Vildagliptin plus Metformin on
Fasting GLP-1 Levels
0
2
4
6
8
10
12
14
*
Intact GLP-1 (pM)
Fasting Levels of Intact GLP-1 at
Baseline and at 3 Months
BL=baseline; GLP-1=glucagon-like peptide-1; met=metformin; PBO=placebo; vilda=vildagliptin.
*P <0.05 vildagliptin 3 months vs baseline; **P <0.05 vildagliptin add-on metformin significantly improved at 3 months vs baseline.†Contains patients on vildagliptin alone and those on vildagliptin plus metformin.
D’Alessio DA, et al. J Clin Endocrinol Metab. 2009; 94: 81-88.
Vilda group† Placebo
BL BL3 months 3 months
n = 20 20 19 19
20
Intact GLP-1 (pM)
**
0
2
4
6
8
10
12
14
Vilda only
Fasting Levels of Intact GLP-1 in
Vildagliptin Subgroups at 3 Months
Vilda + met
7 13

Inhibition of apical sodium-
dependent bile acid transporter
(ASBT, SLC10A2)
Increased concentration of bile
acids in the intestine
Stimulation of GLP-1 secretion
from L cells via the G-protein-
coupled receptor TGR5
Reviewed in Cho YM & Kieffer TJ. Diabetologia 2010
GLP-1 secretion? DPP-4 inhibition?
Mechanism of increased GLP-1 levels with metformin treatment
• DPP-4 activity in the
circulation has been reported
to be reduced in rodents or
humans treated with
metformin.
• Metformin does not directly
inhibit DPP-4 activity in vitro
• Metformin at doses exhibiting
GLP-1-increasing effects
exerted no effect on plasma
DPP-4 activity in mice.
• Metformin increased plasma
GLP-1 levels in rats genetically
lacking DPP-4.
ASBT inhibition
TGR5 activation
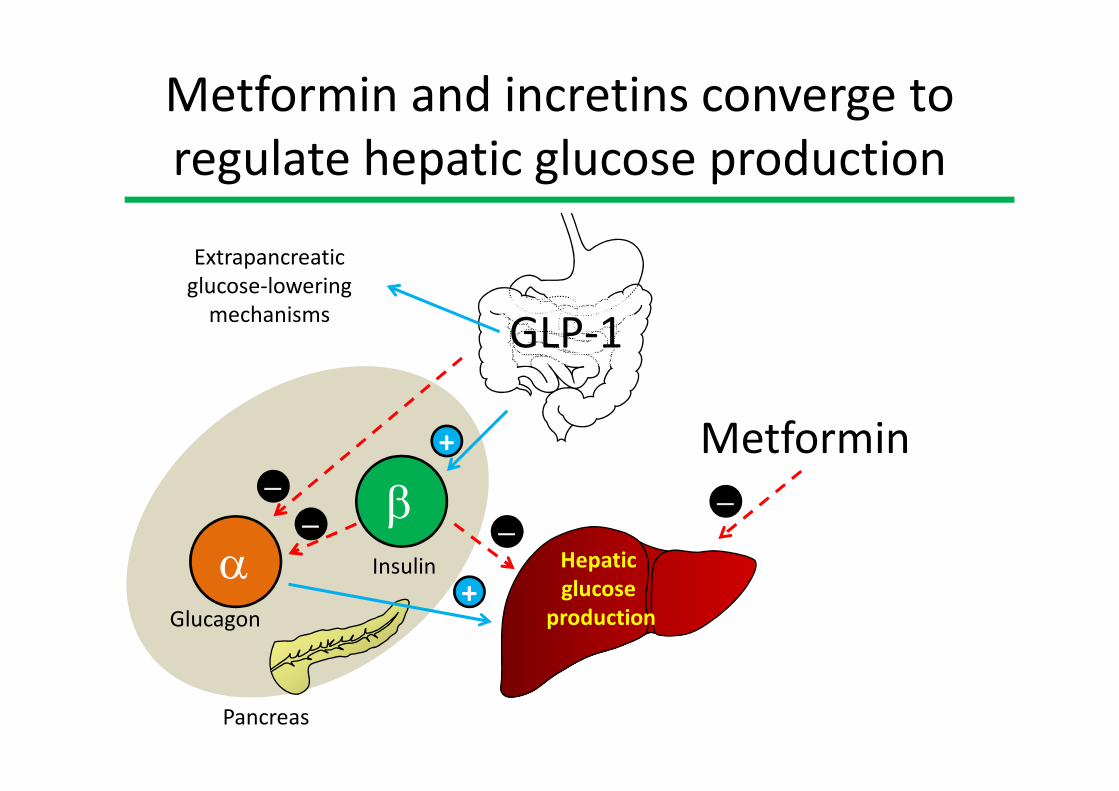
Metformin and incretins converge to
regulate hepatic glucose production
GLP-1
αβ−
−
+
Hepatic
glucose
production
−
+
−
Metformin
Extrapancreatic
glucose-lowering
mechanisms
Glucagon
Insulin
Pancreas

23
Meal
*
*
*
*
*
** * *
**
*
Vildagliptin 100 mg (n=16)
Placebo (n=16)
Acute Effects of Vildagliptin on GLP-1 Levels in
Patients with T2DM
GLP-1=glucagon-like peptide-1; T2DM=type 2 diabetes mellitus.
*P <0.05.
Balas B, et al. J Clin Endocrinol Metab. 2007; 92: 1249–1255.
Vildagliptin 100 mg once daily was used in this study. Galvus (vildagliptin) is approved for 50 mg once or twice daily in
combination with metformin or a TZD, and Galvus (vildagliptin) 50 mg once daily in combination with a sulfonylurea.
0.0
4.0
8.0
12.0
16.0
17:00 20:00 23:00 02:00 05:00 08:00
Time
Active GLP-1 (pmol/L)
*

24
Acute Effects of Vildagliptin on Glucagon Levels in
Patients with T2DM
Meal
*
* **
*
*
*
*
*P <0.05 vs placebo.
Balas B, et al. J Clin Endocrinol Metab. 2007; 92: 1249–1255.
Vildagliptin 100 mg once daily was used in this study. Galvus (vildagliptin) is approved for 50 mg once or twice daily in
combination with metformin or a TZD, and Galvus (vildagliptin) 50 mg once daily in combination with a sulfonylurea.
−60
−50
−40
−30
−20
−10
0
10
20
17:00Time
Delta Glucagon (ng/L)
20:00 23:00 02:00 05:00 08:00
Placebo (n=16)
Vildagliptin 100 mg (n=16)
*

25
Acute Effects of Vildagliptin on Insulin Secretion Rates
in Patients with T2DM
AUC=area under the curve; ISR=insulin secretion rate.
*P <0.05.
Balas B, et al. J Clin Endocrinol Metab. 2007; 92: 1249–1255.
Vildagliptin 100 mg once daily was used in this study. Galvus (vildagliptin) is approved for 50 mg once or twice daily in
combination with metformin or a TZD, and Galvus (vildagliptin) 50 mg once daily in combination with a sulfonylurea.
ISR (AUC) / glucose (AUC)
100 (pmol•kg-1•min-1)/(mg/dL)
0
2
4
6
8
18:00
* *
***
** * * * * * * * * * * * * * *
Time
20:00 23:00 02:00 05:00 08:00
Placebo (n=16)
Vildagliptin 100 mg (n=16)
**
Meal

26
Acute Effects of Vildagliptin on Endogenous Glucose
Production in Patients with T2DM
EGP=endogenous glucose production.
*P <0.05 vs placebo.
Balas B, et al. J Clin Endocrinol Metab. 2007; 92: 1249–1255.
Vildagliptin 100 mg once daily was used in this study. Galvus (vildagliptin) is approved for 50 mg once or twice daily in
combination with metformin or a TZD, and Galvus (vildagliptin) 50 mg once daily in combination with a sulfonylurea.
0
−0.3
−0.6
−0.9
−1.2
−1.5
Delta EGP (mg/kg/min)
17:00 20:00 23:00 02:00 05:00 08:00
Time
**********
*
*
**************** Placebo (n=16)
Vildagliptin 100 mg (n=16)
Meal

MOA of combination of metformin and a DPP-4
inhibitor on improved glucose homeostasis
• Increase hepatic insulin sensitivity (M>D)
• Insulinotropic action (D)
• Enhance GLP-1 levels in a synergistic manner (M+D)
• Enhance GLP-1 sensitivity in beta cells by increasing
GLP-1 receptor expression (M)
M, metformin; D, DPP-4 inhibitors

28
Vildagliptin Add-on to Metformin: Study
Design and Objective
Objective: to demonstrate superior HbA1c reduction with vildagliptin
+ metformin vs metformin monotherapy
Target population: T2DM on maximal dose of metformin;
HbA1c 7.5–11%
HbA1c=hemoglobin A1c; T2DM=type 2 diabetes mellitus
*Patient number refers to primary intention-to-treat population.
Bosi E, et al. Diabetes Care 2007; 30: 890-895.
n=130: Placebo + metformin
n=143: Vildagliptin 50 mg twice daily + metformin
n=143: Vildagliptin 50 mg once daily + metformin
24 weeks
Metformin>1500 mg
(monotherapy, stable dose)
4 weeks
N=416*

29
HbA1c=hemoglobin A1c; met=metformin;
PBO=placebo; vilda=vildagliptin
*P <0.001. Primary intention-to-treat population.
Bosi E, et al. Diabetes Care 2007; 30: 890-895.
Vildagliptin Add-on to Metformin:
Reduction in HbA1c over 24 Weeks
7.2
7.4
7.6
7.8
8.0
8.2
8.4
8.6
−4 0 4 8 12 16 20 24
Time (weeks of treatment)
Mean HbA1c (%)
PBO + met (n=130)
Vilda 50 mg twice daily + met (n=143)
Vilda 50 mg once daily + met (n=143)
Add-on treatment to metformin (2.1 g mean daily)
−0.7% vs PBO
−1.1% vs PBO
*
*

30
Vildagliptin Add-on to Metformin:
Reduction in FPG over 24 Weeks
Time (weeks of treatment)
Mean FPG (mmol/L)
−4 0 4 8 12 16 20 24
8
9
10
11Vilda 50 mg once daily + met (n=143)
Vilda 50 mg twice daily + met (n=143)
PBO + met (n=130)
−0.8 vs PBO
−1.7 vs PBO
*
**
FPG=fasting plasma glucose; met=metformin;
PBO=placebo; vilda=vildagliptin
*P=0.003 vs PBO; **P <0.001 vs PBO. Primary intention-to-treat population.
Bosi E, et al. Diabetes Care 2007; 30: 890-895.
Add-on treatment to metformin (2.1 g mean daily)

31
Vildagliptin: Efficacious in Elderly and Obese
Patients and those with Poorly Controlled T2DM
BL=baseline; BMI=body mass index; HbA1c=hemoglobin A1c;
met=metformin; PBO=placebo; T2DM=type 2 diabetes mellitus; vilda=vildagliptin
Primary intention-to-treat population.
Data on file, Novartis Pharmaceuticals, LAF237A2303.
>65 years
Mean BL ~8.3%
Add-on treatment to metformin (2.1 g mean daily)
BL BMI >30 kg/m2
Mean BL ~8.3%
-1.3
-0.8
-1.3
-0.2
0.2
0.0
-1.4
-1.2
-1.0
-0.8
-0.6
-0.4
-0.2
0.0
0.2
0.4
Vilda 50 mg twice daily + met
PBO + met
Change from BL in HbA1c(%)
n= 20 22 103 86 29 29
BL HbA1c
>9%

32
Vildagliptin: Enhances β-cell Function and Improves PPG
when Metformin Alone is not Sufficient
AUC=area under the curve; ISR=insulin secretion rate;
met=metformin; PBO=placebo; PPG=postprandial glucose; vilda=vildagliptin
*P ≤0.001 vs PBO.
Bosi E, et al. Diabetes Care 2007; 30: 890-895.
Data on file, Novartis Pharmaceuticals, LAF237A2303.
Vilda 50 mg twice daily + met (n=57)
PBO + met (n=54)
β-cell function
Adjusted mean change in
ISR AUC / glucose AUC * *
6.97.3
1.6
0.0
2.0
4.0
6.0
8.0
10.0
2-h PPG
Adjusted mean change in
2-h PPG (mmol/L)
*
*
-1.9
-2.3
-0.1
-3.0
-2.0
-1.0
0.0
Vilda 50 mg once daily + met (n=53)

33
Vildagliptin Add-on to Metformin: Significantly
Lowers HbA1c over 52 Weeks
6.8
7.2
7.6
8.0
8.4
−4 0 4 8 12 16 20 24 28 32 36 40 44 48 52
Week
Vilda 50 mg daily + met (extension, ITT n=42)
PBO + met (extension, ITT n=29)
Vilda 50 mg daily + met (core, ITT n=56)
PBO + met (core, ITT n=51)
HbA1c (%)
P <0.0001
P <0.0001
∆ –1.1 ± 0.2%
n refers to ITT population.
HbA1c=hemoglobin A1c; ITT=intention-to-treat; met=metformin; PBO=placebo; vilda=vildagliptin
Adapted from Ahrén B, et al. Diabetes Care 2004; 27: 2874-2880.

34
Vildagliptin Effective Across Hyperglycemia Spectrum
Pooled Analysis in Add-on to Metformin
-0.6
-0.9
-1.6
-1.1
-2.0
-1.5
-1.0
-0.5
0.0
BL HbA1c
<8%
n= 186 148 68 34
BL=baseline; HbA1c=hemoglobin A1c; vilda=vildagliptin
*P <0.001 from BL. Pooled analysis from studies 2303, 2354, intention-to-treat / primary intention-to-treat population.
Data on file, Novartis Pharmaceuticals.
Vilda 50 mg twice dailyChange from BL in HbA1c(%)
8< HbA1c
<9%
9< HbA1c
<10%
HbA1c
>10%
*
*
*
*

35
Initial Combination of Vildagliptin and Metformin:
Study Design and Objectives
Primary objective: to demonstrate efficacy of single-pill combination therapy of
vildagliptin and metformin compared with individual monotherapy in drug-naïve patients
with T2DM in a multicenter, randomized, double-blind, active-controlled study
Target population: drug-naïve patients with T2DM (HbA1c 7.5–11%)
*Randomized population. HbA1c=hemoglobin A1c; met=metformin; T2DM=type 2 diabetes mellitus; vilda=vildagliptin.
Bosi E, et al Diabetes Obes Metab. 2009; 11: 506–515.
Met 500 mg qd Met 500 mg bidMet 1000 mg AM
Met 500 mg PMMetformin 1000 mg bid
Vilda 50 mg qd
Vildagliptin 50 mg bidn=300
n=294
Vilda / met 50/500 mg qd
Low dose: vilda / met 50/500 mg bidn=290
50/1000 mg AM
50/500 mg PMHigh dose: vilda / met 50/1000 mg bidn=295
50/500 mg bid
Screening Titration Maintenance
N=1179*
2 weeks 2 weeks 2 weeks 2 weeks 18 weeks
24 weeks
Vilda/met 50/500 qd

36
Initial Combination of Vildagliptin + Metformin Provides
Significantly more HbA1c Reductions than the MonotherapiesMean Change in HbA1c (%)
Intention-to-treat population.
HbA1c=hemoglobin A1c; HD=high dose; LD=low dose; met=metformin; vilda=vildagliptin.
Bosi E, et al. Diabetes Obes Metab. 2009; 11: 506–515.
n = 287 277
Change from Baseline to End Point
Mean Baseline HbA1c ~8.6%
285 285
P <0.001
P=0.004
P <0.001
P <0.001
Vilda + HD met (50/1000 mg bid)
Vilda + LD met (50/500 mg bid)
Met 1000 mg bid
Vilda 50 mg bid
Duration: 24 weeks
Vilda + met vs mono

37
Safety and tolerability
Bosi E, et al. Diabetes Obes Metab. 2009; 11: 506–515

38
Initial Combination of Vildagliptin + Metformin:
Change in Body Weight
276 258271 275n =
Mean Change in Body Weight (kg)
Change from Baseline to End Point
Mean Baseline Body Weight ~88.3 kg
Duration: 24 weeks
Vilda + met vs mono
Vilda + HD met (50/1000 mg bid)
Vilda + LD met (50/500 mg bid)
Met 1000 mg bid
Vilda 50 mg bid
Intention-to-treat population.
HD=high dose; LD=low dose; met=metformin; vilda=vildagliptin.
Bosi E, et al. Diabetes Obes Metab. 2009; 11: 506–515.
not significant
Measures enhancing GLP-1 secretion
Conventional oral anti-diabetes/anti-obesity drugs that increase GLP-1 secretion
• Metformin
• α-glucosidase inhibitors
• Colesevelam
• Dietary fibers
Agonists of G-protein coupled receptors on L-cells (GLP-1 secretagogues)
• Specific TGR 5 agonists: 6α-ethyl-23(S)-methyl-cholic acid (EMCA, INT-777)
• GPR119 agonists: AR231453 (Arena Pharm.)
Surgical procedure
• Roux-en Y gastric bypass
• Ileal interposition
Gene therapy
Cho YM, Merchant CE, Kieffer TJ: Pharmacology & Therapeutics 2011

Modified from Cell Metabolism 2008;8:447-449
Exploiting New Pathways with DPP-4 Inhibitors
(=TGR5)
GLP-1
Secretagogues(L-cell-targeted drugs)
GLP-1
DPP4
DPP4
DPP4
DPP4

Exploring New Pathways
in the Management of Diabetes
through DPP-4 Inhibitors
Young Min Cho, MD, PhD
Department of Internal Medicine
Seoul National University College of Medicine


*p<0.05.1Ahrén B, et al. J Clin Endocrinol Metab 2004; 89: 2078-2084; 2Balas B, et al. J Clin Endocrinol Metab 2007; 92: 1249-1255; 3Matikainen N, et al. Diabetologia 2006; 49: 2049-2057; 4Rosenstock J, et al. Diabetes Care 2008; 31: 30-35;5Yasuda N, et al. Biochem Biophys Ref Commun 2002; 298: 779-784; 6Hinke S, et al. Biochem Biophys Ref Commun 2002; 291: 1302-1308;7Migoya E, et al. Presented at EASD 2007; abstract 0111; 8Dunning B, et al. Presented at EASD 2006; abstract 0174.
Synergy between Vildagliptin and Metformin
• Vildagliptin increases active GLP-1
levels by 2–4x through inhibition of
the DPP-4 enzyme1-4
• Metformin raises GLP-1 levels,
presumably through increasing
GLP-1 synthesis and not through
DPP-4 inhibition5-7
• Vildagliptin and metformin
synergize to maximise levels of
intact GLP-18 0
5
10
15
20
25
30
Vildagliptin
in drug-naïve
patients
(n=5)
Vildagliptin in
patients on
metformin
(n=12)
*
Effect of vildagliptin on
prandial active GLP-1 levels
in drug-naïve versus
metformin-treated patients
Active GLP-1 AUC0-2hr
(pmol/L)

0
20
40
60
80
100
120
-2 -1 0 1 2 3 4 5 6 7 8 9 10 11 12 13 14 15 16
Vildagliptin 50 mg twice daily
Sitagliptin 100 mg once daily
Relationship between Drug Exposure and GLP-1 Levels
with Vildagliptin and SitagliptinDrug Levels
Drug exposure1
DPP-4=dipeptidyl peptidase-4; GLP-1=glucagon-like peptide-1. *P <0.05 vs vildagliptin group.
Plasma levels during 24-h sampling comprising three standardized meals after 3 months of treatment in type 2 diabetic patients. 1He YL, et al. Clin Pharmacokinet. 2007; 46: 577–588; 1Herman GA, et al. Clin Pharmacol Ther. 2005; 78: 675–688; 2Marfella R, et al. J Diabetes Complications. 24: 79-83, 2010.
.
Intact GLP-1 (pmol/L)
Time (hours)
44
0 2 4 6 8 10 12 14 160
5
10
15
20
25
30
Breakfast Lunch Dinner
Vildagliptin 50 mg twice daily
Sitagliptin 100 mg once daily
Time (hours)
GLP-1 levels2

Comparison of Plasma GLP-1 Levels following
3 Months’ Treatment with Vildagliptin or Sitagliptin
GLP-1=glucagon-like peptide-1. *P <0.05 vs vildagliptin group,
Plasma levels during 24-h sampling comprising three standardized meals after 3 months of treatment in type 2 diabetic patients.
Marfella R, et al. J Diabetes Complications. 24: 79-83, 2010.
30
25
20
15
10
5
0
-20 0 15 30 6090 120 180 240 300 0 15 3060 90 120 180 240 300 0 15 3060 90 120 180 240 300 min
Breakfast Lunch Dinner
Intact GLP-1 (pmol/L)
Sitagliptin 100 mg
once daily + metformin (N=20)
Vildagliptin 50 mg
twice daily + metformin (N=18)
45

Comparison of Plasma Glucagon Levels following
3 Months’ Treatment with Vildagliptin or Sitagliptin
Sitagliptin 100 mg once daily
+ metformin (N=20)
Vildagliptin 50 mg
twice daily + metformin (N=18)
Marfella R, et al. J Diabetes Complications. 24: 79-83, 2010.
*P <0.05 vs vildagliptin group; Plasma levels during 24-h sampling comprising three
standardized meals after 3 months of treatment in type 2 diabetic patients.
90
80
70
60
50
40
30
20
Breakfast Lunch Dinner
Plasma Glucagon (mg/dL)
46
-20 0 15 30 6090 120 180 240 300 0 15 3060 90 120 180 240 300 0 15 3060 90 120 180 240 300 min

Initial Combination of Vildagliptin + Metformin:
Robust Change in FPGMean Change in FPG (mmol/L)
P <0.001
P=0.999
P <0.001
P <0.001
Vilda + HD met (50/1000 mg bid)
Vilda + LD met (50/500 mg bid)
Met 1000 mg bid
Vilda 50 mg bid
Change from Baseline to End Point
Mean baseline FPG ~10.4 mmol/L
287 277285 285n =
Duration: 24 weeks
vilda + met vs mono
Intention-to-treat population.
FPG=fasting plasma glucose; HD=high dose; LD=low dose; met=metformin; vilda=vildagliptin.
Bosi E, et al. Diabetes Obes Metab. 2009; 11: 506–515;
Data on file, Novartis Pharmaceuticals, LMF237A2302.


