1 INTRODUCTION At the 2017 National Digital Newspaper Program meeting, sponsored by the National Endowment for
the Humanities (NEH) and the Library of Congress, a recurring conversation took place concerning
how users interact with digital collections. Attendees expressed interest in observing how a user’s
individual usage session with a digital collection could possibly include interactions with different
types of digital objects, with distinct collections tied together through facets, or with objects from
entirely different subject matters. This discussion resulted in a communal acceptance that enabling
access to dissimilar but related object types was positive for user experience. However, little
published data exists that examines crossover between different digital collection areas, and this has
not been analyzed to a large extent.
The UNT Libraries’ Digital Collections include three different interfaces: The Portal to Texas
History, The UNT Digital Library, and The Gateway to Oklahoma History. The Portal to Texas
History is a repository that collaborates with over 400 partner institutions across Texas to provide
access to cultural heritage objects freely to the public; the UNT Digital Library provides access to
content created or collected by the UNT community; and the Gateway to Oklahoma History makes
available digital resources from the Oklahoma Historical Society that are collaboratively hosted by the
UNT Libraries.
The Texas Digital Newspaper Program (TDNP) is hosted by The Portal to Texas History. Arranged
as a single collection amongst over 600 collections, TDNP is the largest individual collection on the
Portal. As such, user interactions between TDNP and other collections are valuable for us to research
how interactions with this single collection move across to other (non-newspaper) objects in the
Portal.
Users have the potential to discover meaningful connections to other collections and digital objects
within each interface by using faceted navigation. Items in collections housed within a single digital
interface can be located from a unified search box on each system, allowing a user to discover
resources of all types, across multiple collections, from a single search. Thus, research projects
utilizing newspapers may also access photographs, maps, audio, or video, via facets. Enabling users to
create a constellation of digital objects across diverse resource types and collections is valuable for
both increasing usage of individual objects and enriching a user’s own research process.
2 REVIEW OF LITERATURE
David Weinberger (2012) summarizes the problem of trying to wrap our metaphorical arms around so
much digital information and how people access it, explaining that such complex systems as
“database-based science” (p. 128) are so complicated that digital repository managers get little
opportunity to understand them entirely. At minimum, observable usage patterns drawn from data
logs can demonstrate how interactions occur across different collections, contributors, and objects.
In 2010, UNT Libraries completed a usability research project, “Iogene: Interface Optimization for
Genealogists,” as a two-year study supported by the Institute of Museum and Library Services, to
examine how one of its primary target audiences worked with digital collections, with the goal of
obtaining data to support developing the interface of The Portal to Texas History object-access areas
on an iterative design approach. This research particularly emphasized partner-contributed content,
with the goal of demonstrating how users navigate between materials contributed by other
institutions. Final takeaways from this research indicated that, once discovering they could utilize
navigation options to move between objects arranged according to different partners, they frequently
chose to work with those options (Murray, p. 12). This very early data indicated to Portal designers
the importance of co-locating diverse materials for better user experience.
3
The UNT Libraries’ Digital Collections interfaces are designed on a theory similar to what the
Europeana project has adopted. Europeana is based on a model of “cultural commons,” with the goal
of employing linked data to break out of silos and allow users to create their own research context,
based on a model of sharing and searching across varied digital contributions from European
countries (2010, p. 67). This type of design, with large sets of diverse materials searchable across
different contributors and collections, becomes a complex system of navigation interactions,
contextualized by the users rather than by the interface technology.
Blumer, Hügi, & Schneider (2014) examine the impact of faceted navigation on users, in direct, full,
usability studies. Their findings related to the usefulness of and recommendations about how to tailor
facets informed the questions we posed about server log data to understand user interactions across
collections because user interactions in The Portal to Texas History are driven extensively by the
faceted navigation.
Nicholson (2013), in particular observes the value of newspapers being accessible alongside other
digital collections, though his “The Digital Turn,” does not state with certainty the ways in which
people may move between different types of digital objects. In particular, Nicholson emphasizes that
access to bodies of digitized newspapers opens the door for what researchers can now do that they
could not do before, but also that newspapers themselves are changed by digitization en masse.
Intermingling object types contributed from different partners and geographical locations enables
research crossover and offers new possibilities, but knowing whether and in what ways users actually
take advantage of this intermingling is foremost.
In user experience and usability research, four stages must take place, with each successive stage
relying on the previous one for rigorous research. These stages are defined in the acronym, “DEAR,”
meaning Discovery, Evaluation, Analysis, and Reporting. Brian Still defines the Discovery stage as an
environmental scan or a site visit (2009, p. 20), in which the researcher gathers information about how
a product is actually used, within its native environment. A research project like this, which examines
how logs report user behavior, functions as a portion of the Discovery stage, providing quantitative
data that clearly shows how individuals create a research constellation. In particular, Still warns
against using self-reported user feedback in Discovery, and quantitative tracking logs are anonymized
and automated, thus preventing data skew due to faulty reporting. Thus, while this research is not
usability or user experience research on its own because it does not directly examine users directly
interacting with a given product, the data gathered from this project supports a broader UX research
agenda by building a trove of much-needed Discovery research to describe the environment as it
exists now.
3 METHODOLOGY
3.1 Background
Attendees at the 2017 National Digital Newspaper Program annual meeting, in discussing whether
and how users interact with collections as observable through logs, admitted that little research has
actually been conducted to gather quantitative data about usage sessions that could speak to user
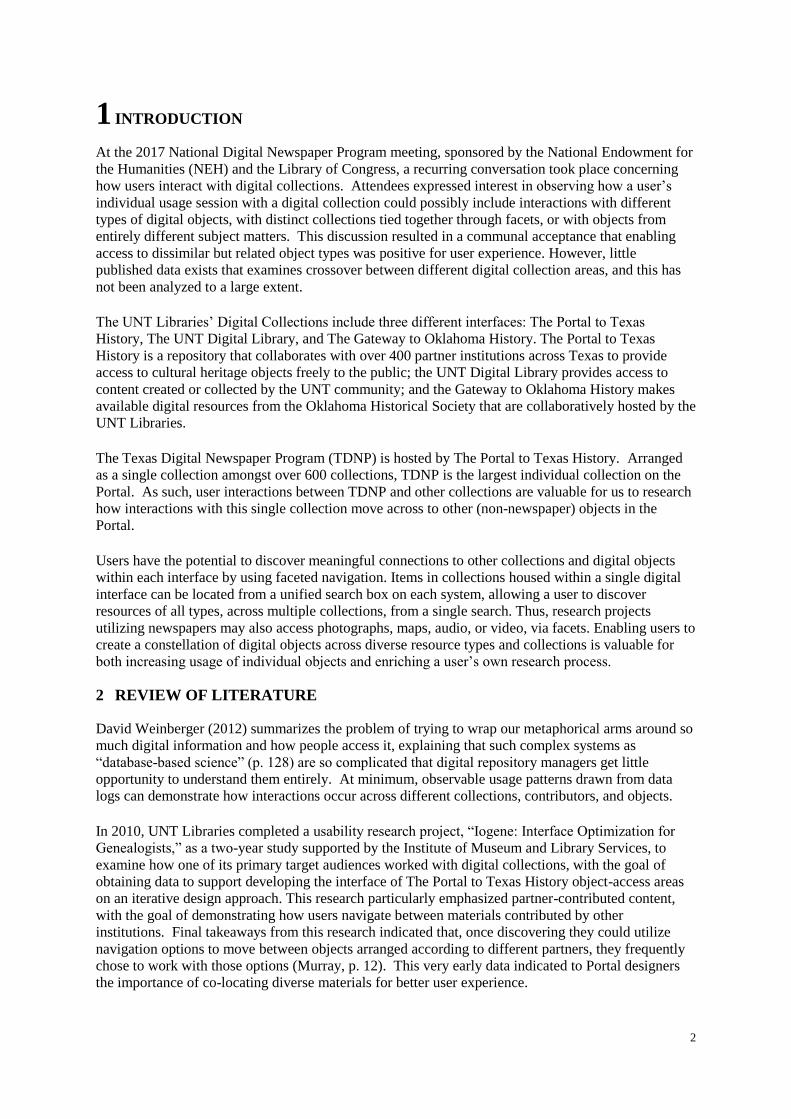
interactions. The Portal to Texas History utilizes faceted navigation (see Figure 1) to enable
connections across different types of objects, within unique usage sessions.
4
Figure 1: Faceted navigation on The Portal to Texas History’s TDNP collection, in red rectangle.
The Portal to Texas History hosts objects identified according to two important local, metadata codes:
Partner--the contributing institution of the objects, and Collection, which represents a unifying trait
across the objects, such as funding source or geographic location. Every object on The Portal to
Texas History is identified by at least one Partner and one Collection. No object can be identified
with two Partners, but any object can be tagged with multiple Collection codes.
Again, this research is intended to serve as a discovery stage in the user experience process, through
which we conduct an environmental scan of the current usage situation within TDNP. In itself, this
research is not intended to speak to user experience or usability of materials within the Texas Digital
Newspaper Program or The Portal to Texas History; rather, this data represents the current status of
user activity with newspapers. On The Portal to Texas History, we are able to trace unique usage
sessions and aggregate this to observe patterns and trends that can describe usage behaviors.
3.2 Research Questions
To avoid preconceptions and data skew, despite the discussion at the annual meeting, the questions we
pose in this research are developed to support observation of the data, grounded rather than
hypothetical or experimental. The goal of this study is to examine usage data from the Texas Digital
Newspaper Program (TDNP) collection, to answer the following questions:
1. Do usage sessions indicate access to various newspapers contributed by different partners?
2. Do usage interactions indicate issues accessed from different titles?
3. Do usage interactions indicate newspaper issues viewings from different years during a single
interaction session?
4. Do usage interactions indicate multi-resource type usage during a single interaction session?
5. Do usage interactions with newspaper issues indicate more usage time with items than usage
time that does not include newspaper content?
We are able to answer these questions by tracking usage interactions between objects, across
collections, across contributors, and across facet types.
5
3.3 Data Gathering
We employed a quantitative research model, gathering access logs from application servers operating
the UNT Libraries’ Digital Collections. These logs spanned the dates of January 1, 2018 until
December 31, 2018. From the aggregated log files, we started with a total of 1,521,182,784 log
entries.
We determined that we needed to define an interaction session to pull useful information from these
logs. Toward this end, we determined: 1. A session: equals all interactions that returned item content within a 30-minute window by a
single IP address.
2. Sessions greater than 30 minutes: we divided these into multiple sessions at each thirty-
minute mark.
3. False positives: we removed lines originating from known bots or crawlers along with other
questionable requests, such as those lacking referral information, those that did not return a
HTTP Status Code in the 200 or 300 range, log entries that were not using the GET method of
access, or requests that were for item thumbnails used throughout the digital library
infrastructure but for which we do not want to identify as a use.
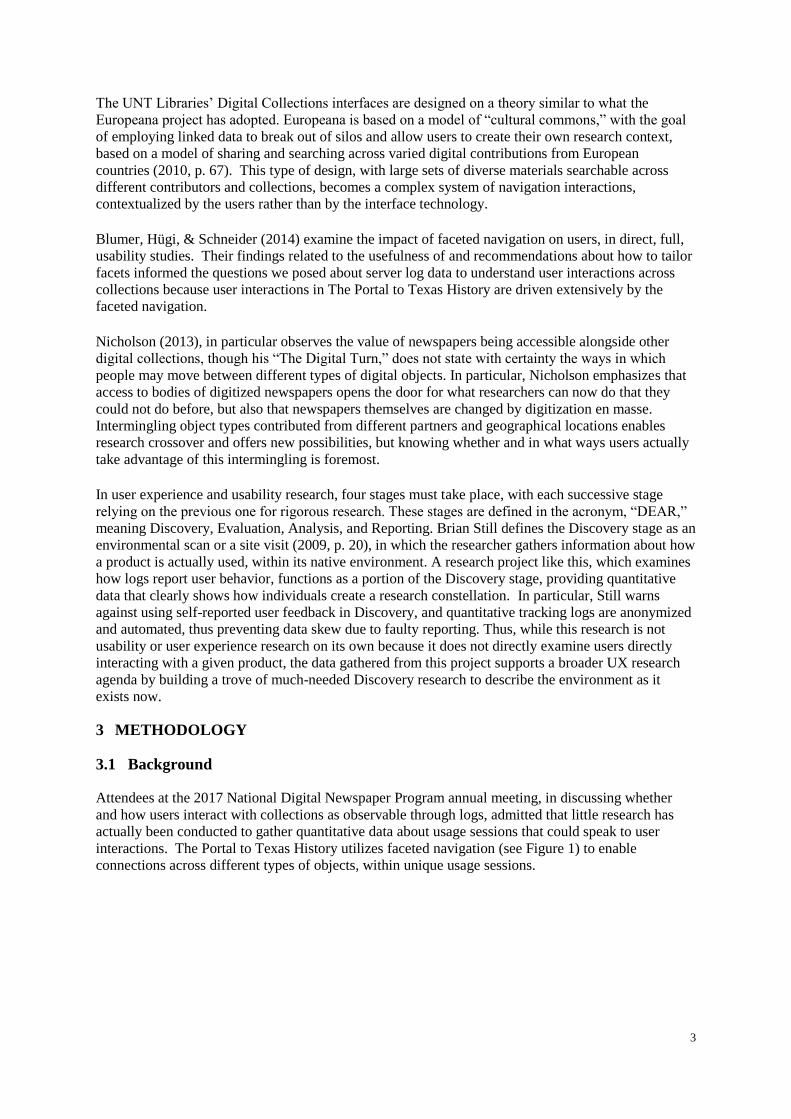
We filtered the log files down to three columns of data: The first column is the timestamp for when
the http access was made, the second column was the hashed IP address used to make the request,
and the final column was the digital item path requested, with a snippet of this is viewable in Figure 2
below. This filtering results in a much smaller dataset to work with, from 1,521,182,784 down to
98,437,856 individual lines of data.
Figure 2: Session log for interactions, hashed IP address, and object requested.
The next step was to sort all of this data by the timestamp in the first column. After that we further
reduced this data into sessions. We created a short Python script that we could feed the data into and
it would keep track of the ip addresses it came across, note the objects that the ip hash used, and after
a thirty minute period of time (based on the timestamp) it would start the aggregation again.
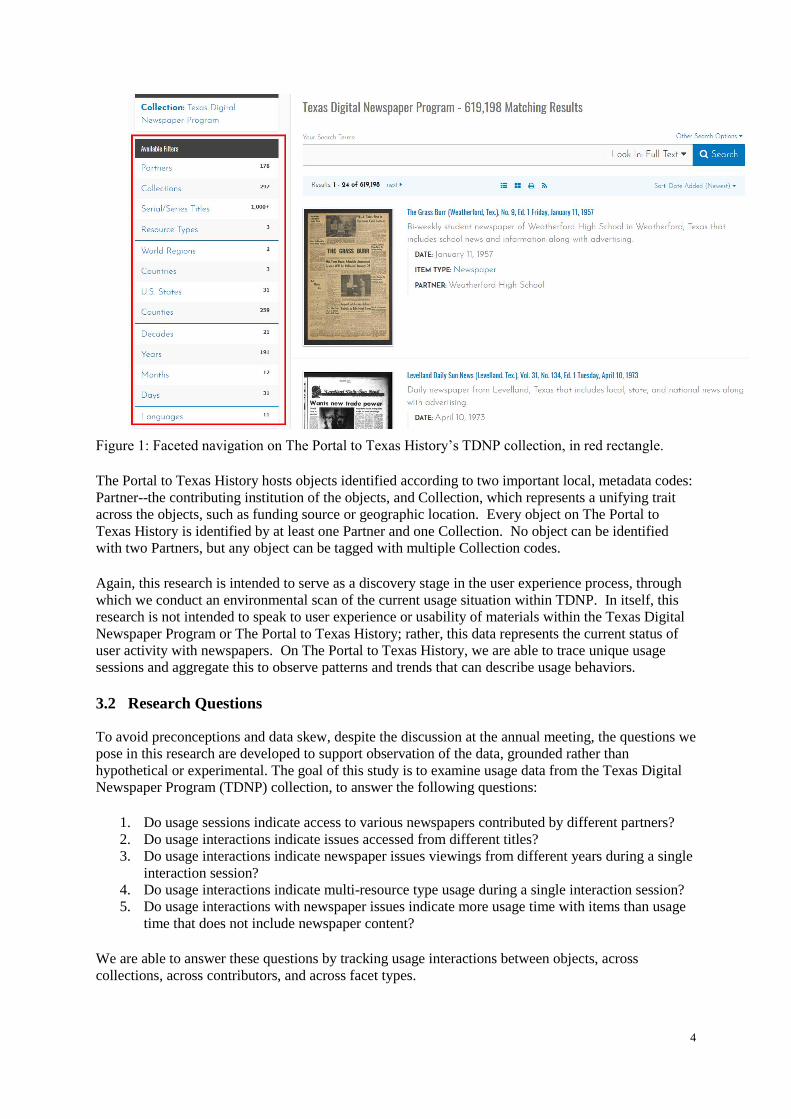
The result was a short JSON structure, displayed in Figure 3.
6
Figure 3: object interaction data per session.
This JSON structure displays the IP hash, the starting and ending timestamp for that session, and
finally the items that were used. Each of these JSON structures were placed into a file, a line-oriented
set of JSON “files” that would get used in the following steps.
This new line-oriented JSON file is 12,927,175 lines long, with one line representing a single user
session for the UNT Libraries’ Digital Collections. After extracting user sessions, we aggregated
metadata records for each item in the session. From each item’s metadata, we can see what
collections, resource types, and partners they are associated with.
4 RESULTS
For this research, we chose to both aggregate session data from all of the UNT Libraries’ Digital
Collections as well as to gather data from the subset of sessions that involved resources specifically
from TDNP because, to understand the TDNP collection data, we found it necessary to also examine
system-wide data, for easier cross-object and cross-collection comparison.
4.1.1 Items-Per-Session - UNT Libraries Digital Collections
Starting with the 12,927,175 sessions for the entire UNT Libraries Digital Collections (UNTDC),
which includes The Portal to Texas History, the UNT Digital Library, and the Gateway to Oklahoma
History, we gathered key metrics across user sessions.
First, as shown in Table 1, we identified how many item interactions by users occurred per session
during the year, across the UNTDC. To compact the data, we grouped values over 20 into bins; thus,
sessions that used between 20 and 29 items were grouped together for simpler calculations.
7
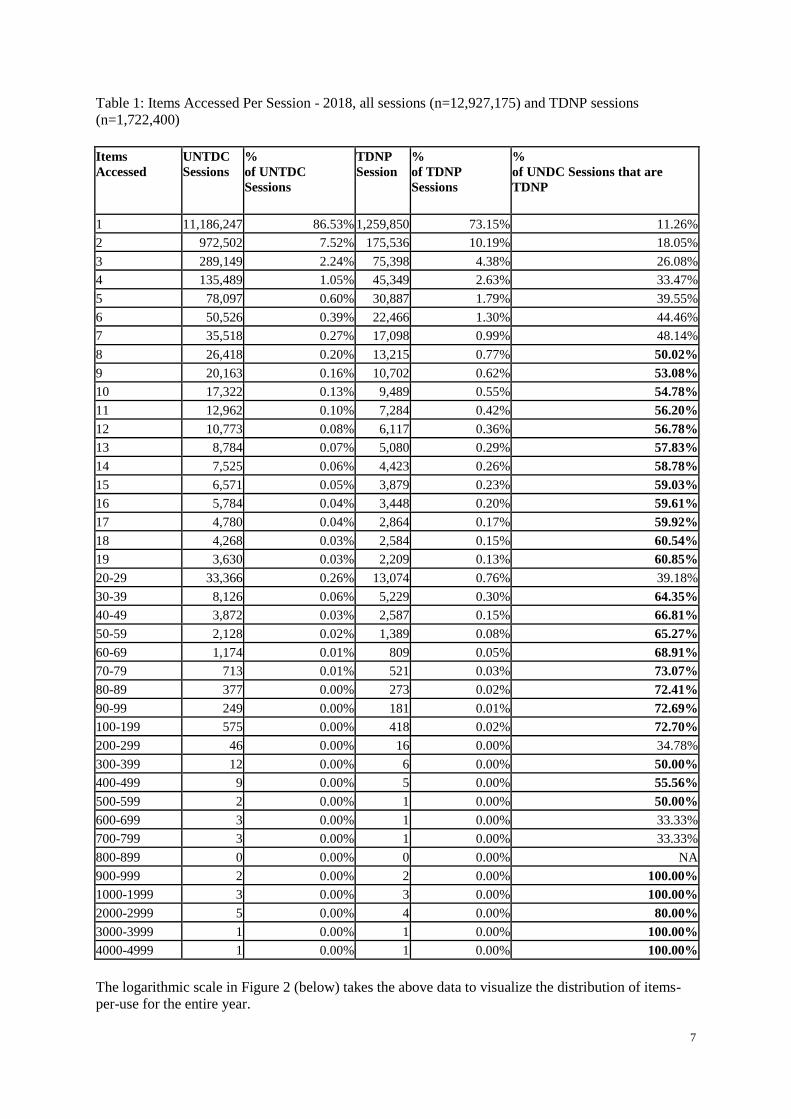
Table 1: Items Accessed Per Session - 2018, all sessions (n=12,927,175) and TDNP sessions
(n=1,722,400)
Items
Accessed UNTDC Sessions
% of UNTDC
Sessions
TDNP Session
% of TDNP
Sessions
% of UNDC Sessions that are
TDNP
1 11,186,247 86.53% 1,259,850 73.15% 11.26%
2 972,502 7.52% 175,536 10.19% 18.05%
3 289,149 2.24% 75,398 4.38% 26.08%
4 135,489 1.05% 45,349 2.63% 33.47%
5 78,097 0.60% 30,887 1.79% 39.55%
6 50,526 0.39% 22,466 1.30% 44.46%
7 35,518 0.27% 17,098 0.99% 48.14%
8 26,418 0.20% 13,215 0.77% 50.02%
9 20,163 0.16% 10,702 0.62% 53.08%
10 17,322 0.13% 9,489 0.55% 54.78%
11 12,962 0.10% 7,284 0.42% 56.20%
12 10,773 0.08% 6,117 0.36% 56.78%
13 8,784 0.07% 5,080 0.29% 57.83%
14 7,525 0.06% 4,423 0.26% 58.78%
15 6,571 0.05% 3,879 0.23% 59.03%
16 5,784 0.04% 3,448 0.20% 59.61%
17 4,780 0.04% 2,864 0.17% 59.92%
18 4,268 0.03% 2,584 0.15% 60.54%
19 3,630 0.03% 2,209 0.13% 60.85%
20-29 33,366 0.26% 13,074 0.76% 39.18%
30-39 8,126 0.06% 5,229 0.30% 64.35%
40-49 3,872 0.03% 2,587 0.15% 66.81%
50-59 2,128 0.02% 1,389 0.08% 65.27%
60-69 1,174 0.01% 809 0.05% 68.91%
70-79 713 0.01% 521 0.03% 73.07%
80-89 377 0.00% 273 0.02% 72.41%
90-99 249 0.00% 181 0.01% 72.69%
100-199 575 0.00% 418 0.02% 72.70%
200-299 46 0.00% 16 0.00% 34.78%
300-399 12 0.00% 6 0.00% 50.00%
400-499 9 0.00% 5 0.00% 55.56%
500-599 2 0.00% 1 0.00% 50.00%
600-699 3 0.00% 1 0.00% 33.33%
700-799 3 0.00% 1 0.00% 33.33%
800-899 0 0.00% 0 0.00% NA
900-999 2 0.00% 2 0.00% 100.00%
1000-1999 3 0.00% 3 0.00% 100.00%
2000-2999 5 0.00% 4 0.00% 80.00%
3000-3999 1 0.00% 1 0.00% 100.00%
4000-4999 1 0.00% 1 0.00% 100.00%
The logarithmic scale in Figure 2 (below) takes the above data to visualize the distribution of items-
per-use for the entire year.
8
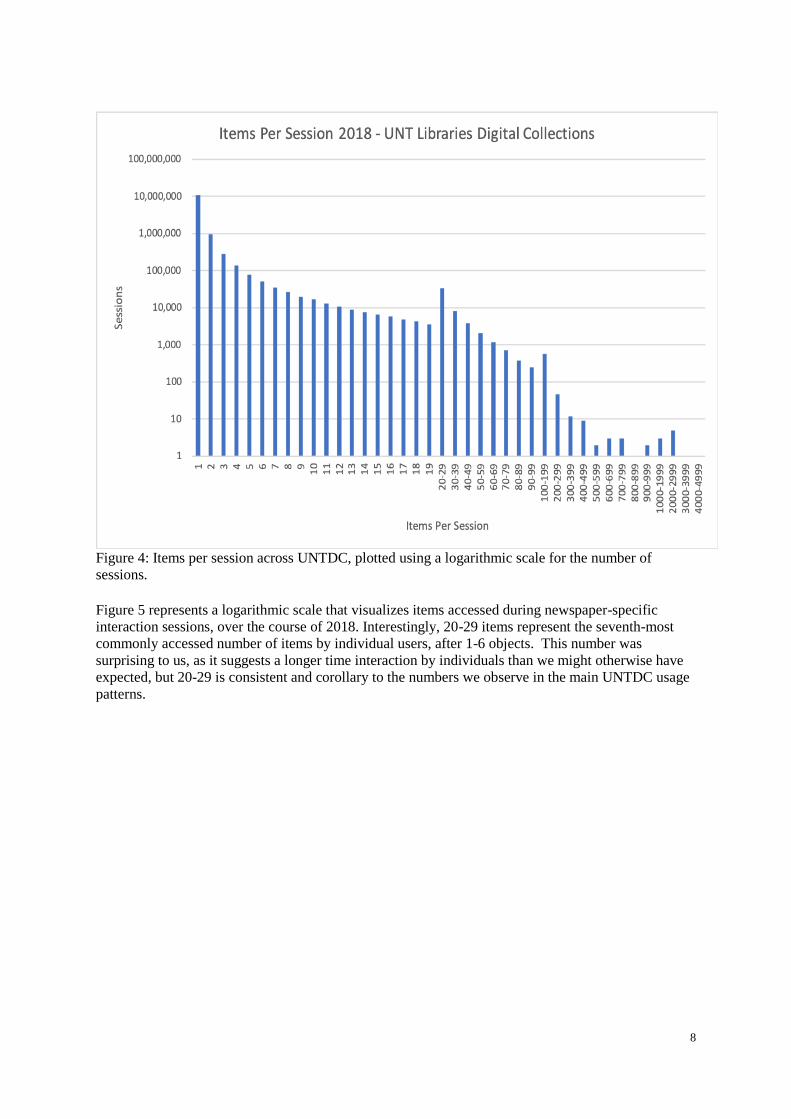
Figure 4: Items per session across UNTDC, plotted using a logarithmic scale for the number of
sessions.
Figure 5 represents a logarithmic scale that visualizes items accessed during newspaper-specific
interaction sessions, over the course of 2018. Interestingly, 20-29 items represent the seventh-most
commonly accessed number of items by individual users, after 1-6 objects. This number was
surprising to us, as it suggests a longer time interaction by individuals than we might otherwise have
expected, but 20-29 is consistent and corollary to the numbers we observe in the main UNTDC usage
patterns.
9
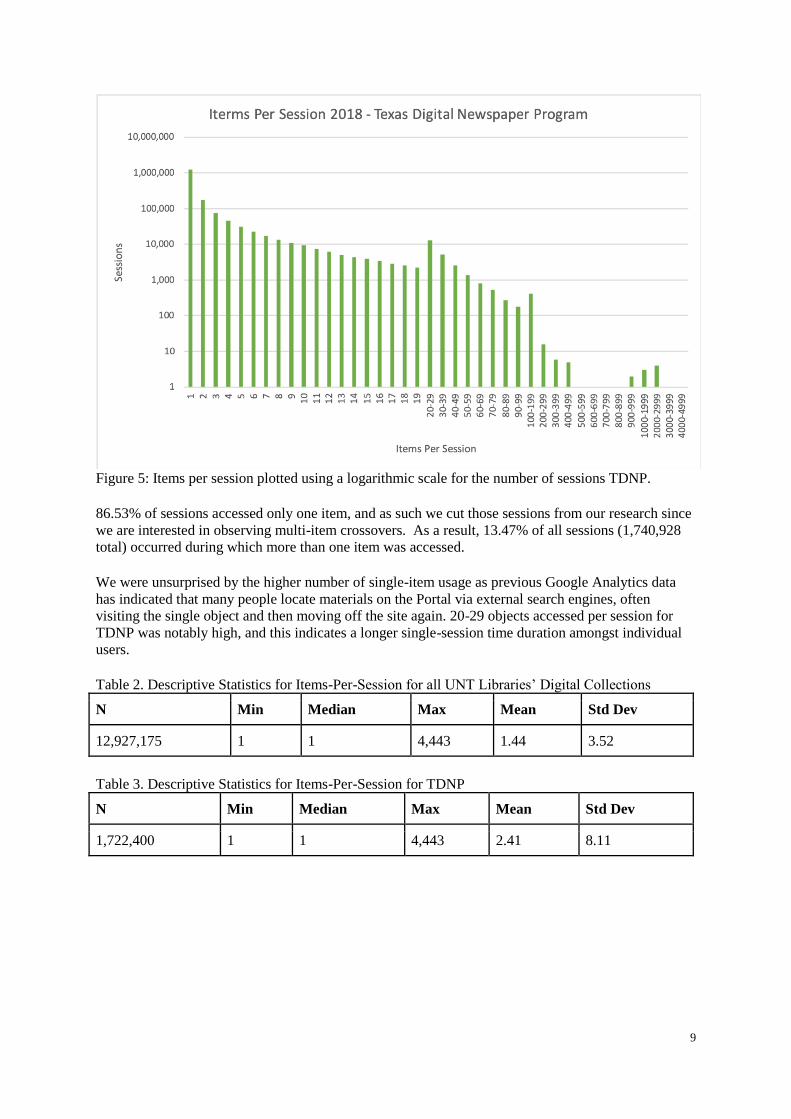
Figure 5: Items per session plotted using a logarithmic scale for the number of sessions TDNP.
86.53% of sessions accessed only one item, and as such we cut those sessions from our research since
we are interested in observing multi-item crossovers. As a result, 13.47% of all sessions (1,740,928
total) occurred during which more than one item was accessed.
We were unsurprised by the higher number of single-item usage as previous Google Analytics data
has indicated that many people locate materials on the Portal via external search engines, often
visiting the single object and then moving off the site again. 20-29 objects accessed per session for
TDNP was notably high, and this indicates a longer single-session time duration amongst individual
users.
Table 2. Descriptive Statistics for Items-Per-Session for all UNT Libraries’ Digital Collections
N Min Median Max Mean Std Dev
12,927,175 1 1 4,443 1.44 3.52
Table 3. Descriptive Statistics for Items-Per-Session for TDNP
N Min Median Max Mean Std Dev
1,722,400 1 1 4,443 2.41 8.11
10
4.1.2 Duration of Sessions - UNT Libraries Digital Collections
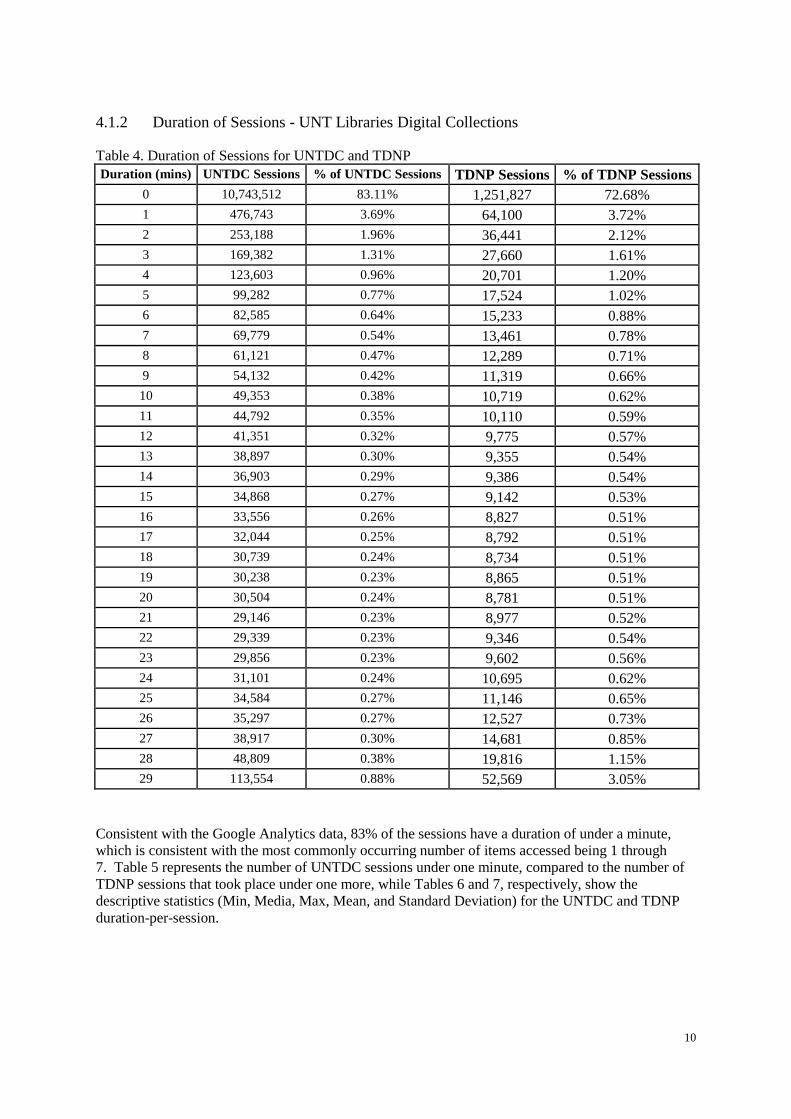
Table 4. Duration of Sessions for UNTDC and TDNP Duration (mins) UNTDC Sessions % of UNTDC Sessions TDNP Sessions % of TDNP Sessions
0 10,743,512 83.11% 1,251,827 72.68%
1 476,743 3.69% 64,100 3.72%
2 253,188 1.96% 36,441 2.12%
3 169,382 1.31% 27,660 1.61%
4 123,603 0.96% 20,701 1.20%
5 99,282 0.77% 17,524 1.02%
6 82,585 0.64% 15,233 0.88%
7 69,779 0.54% 13,461 0.78%
8 61,121 0.47% 12,289 0.71%
9 54,132 0.42% 11,319 0.66%
10 49,353 0.38% 10,719 0.62%
11 44,792 0.35% 10,110 0.59%
12 41,351 0.32% 9,775 0.57%
13 38,897 0.30% 9,355 0.54%
14 36,903 0.29% 9,386 0.54%
15 34,868 0.27% 9,142 0.53%
16 33,556 0.26% 8,827 0.51%
17 32,044 0.25% 8,792 0.51%
18 30,739 0.24% 8,734 0.51%
19 30,238 0.23% 8,865 0.51%
20 30,504 0.24% 8,781 0.51%
21 29,146 0.23% 8,977 0.52%
22 29,339 0.23% 9,346 0.54%
23 29,856 0.23% 9,602 0.56%
24 31,101 0.24% 10,695 0.62%
25 34,584 0.27% 11,146 0.65%
26 35,297 0.27% 12,527 0.73%
27 38,917 0.30% 14,681 0.85%
28 48,809 0.38% 19,816 1.15%
29 113,554 0.88% 52,569 3.05%
Consistent with the Google Analytics data, 83% of the sessions have a duration of under a minute,
which is consistent with the most commonly occurring number of items accessed being 1 through
7. Table 5 represents the number of UNTDC sessions under one minute, compared to the number of
TDNP sessions that took place under one more, while Tables 6 and 7, respectively, show the
descriptive statistics (Min, Media, Max, Mean, and Standard Deviation) for the UNTDC and TDNP
duration-per-session.
11
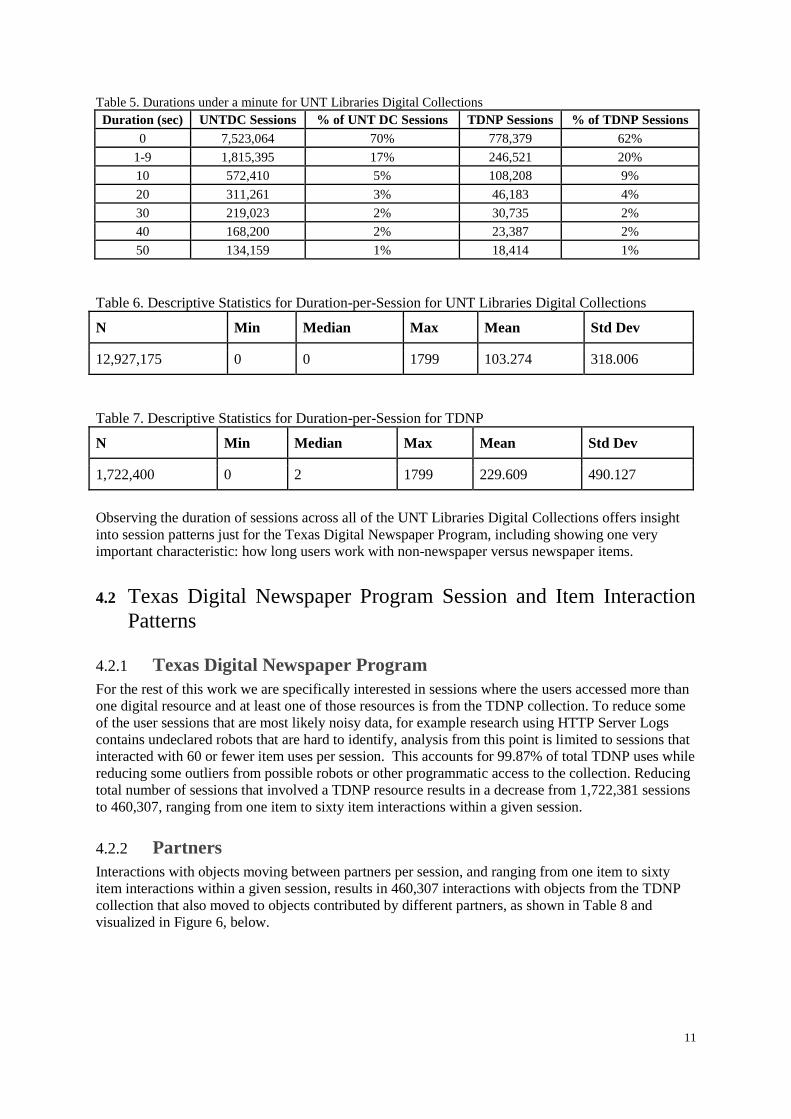
Table 5. Durations under a minute for UNT Libraries Digital Collections Duration (sec) UNTDC Sessions % of UNT DC Sessions TDNP Sessions % of TDNP Sessions
0 7,523,064 70% 778,379 62%
1-9 1,815,395 17% 246,521 20%
10 572,410 5% 108,208 9%
20 311,261 3% 46,183 4%
30 219,023 2% 30,735 2%
40 168,200 2% 23,387 2%
50 134,159 1% 18,414 1%
Table 6. Descriptive Statistics for Duration-per-Session for UNT Libraries Digital Collections
N Min Median Max Mean Std Dev
12,927,175 0 0 1799 103.274 318.006
Table 7. Descriptive Statistics for Duration-per-Session for TDNP
N Min Median Max Mean Std Dev
1,722,400 0 2 1799 229.609 490.127
Observing the duration of sessions across all of the UNT Libraries Digital Collections offers insight
into session patterns just for the Texas Digital Newspaper Program, including showing one very
important characteristic: how long users work with non-newspaper versus newspaper items.
4.2 Texas Digital Newspaper Program Session and Item Interaction
Patterns
4.2.1 Texas Digital Newspaper Program
For the rest of this work we are specifically interested in sessions where the users accessed more than
one digital resource and at least one of those resources is from the TDNP collection. To reduce some
of the user sessions that are most likely noisy data, for example research using HTTP Server Logs
contains undeclared robots that are hard to identify, analysis from this point is limited to sessions that
interacted with 60 or fewer item uses per session. This accounts for 99.87% of total TDNP uses while
reducing some outliers from possible robots or other programmatic access to the collection. Reducing
total number of sessions that involved a TDNP resource results in a decrease from 1,722,381 sessions
to 460,307, ranging from one item to sixty item interactions within a given session.
4.2.2 Partners
Interactions with objects moving between partners per session, and ranging from one item to sixty
item interactions within a given session, results in 460,307 interactions with objects from the TDNP
collection that also moved to objects contributed by different partners, as shown in Table 8 and
visualized in Figure 6, below.
12
Table 8: Partners per Session for the TDNP sessions
Partners Per Session Sessions % of Sessions
1 176,047 38.25%
2 153,315 33.31%
3 55,684 12.10%
4 28,669 6.23%
5 16,350 3.55%
6 9,661 2.10%
7 6,163 1.34%
8 3,907 0.85%
9 2,755 0.60%
10 1,967 0.43%
11 1,464 0.32%
12 1,101 0.24%
13 808 0.18%
14 645 0.14%
15 470 0.10%
16 337 0.07%
17 258 0.06%
18 183 0.04%
19 143 0.03%
20 95 0.02%
21 68 0.01%
22 44 0.01%
23 41 0.01%
24 31 0.01%
25 26 0.01%
26 14 0.00%
27 14 0.00%
28 15 0.00%
29 3 0.00%
30 5 0.00%
31 4 0.00%
32 3 0.00%
33 3 0.00%
34 3 0.00%
35 1 0.00%
36 1 0.00%
37 3 0.00%
41 1 0.00%
44 2 0.00%
47 2 0.00%
49 1 0.00%
13
Figure 6: Partners Per Session for Multi-Item TDNP Sessions (log scale)
Research question 2 posed how users interacted with different newspaper titles when sessions used
more than one item in a session, in this case whether individual usage sessions interacted with
newspaper issues from more than one title. Table 9 indicates the frequency of titles accessed per
session.
14
Table 9: Titles accessed per session within TDNP usage interactions.
Titles Per Session Sessions % of Sessions
1 225,009 48.88%
2 116,651 25.34%
3 43,080 9.36%
4 23,502 5.11%
5 14,503 3.15%
6 9,497 2.06%
7 6,541 1.42%
8 4,585 1.00%
9 3,390 0.74%
10 2,561 0.56%
11 1,902 0.41%
12 1,554 0.34%
13 1,196 0.26%
14 944 0.21%
15 803 0.17%
16 641 0.14%
17 499 0.11%
18 488 0.11%
19 448 0.10%
20 379 0.08%
21 300 0.07%
22 266 0.06%
23 229 0.05%
24 237 0.05%
25 202 0.04%
26 180 0.04%
27 173 0.04%
28 134 0.03%
29 101 0.02%
30 84 0.02%
31 66 0.01%
32 44 0.01%
33 32 0.01%
34 33 0.01%
35 16 0.00%
36 11 0.00%
37 10 0.00%
38 2 0.00%
39 6 0.00%
40 2 0.00%
41 3 0.00%
42 1 0.00%
43 1 0.00%
50 1 0.00%
15
Figure 7: Titles Per Session for Multi-Item TDNP Sessions (log scale)
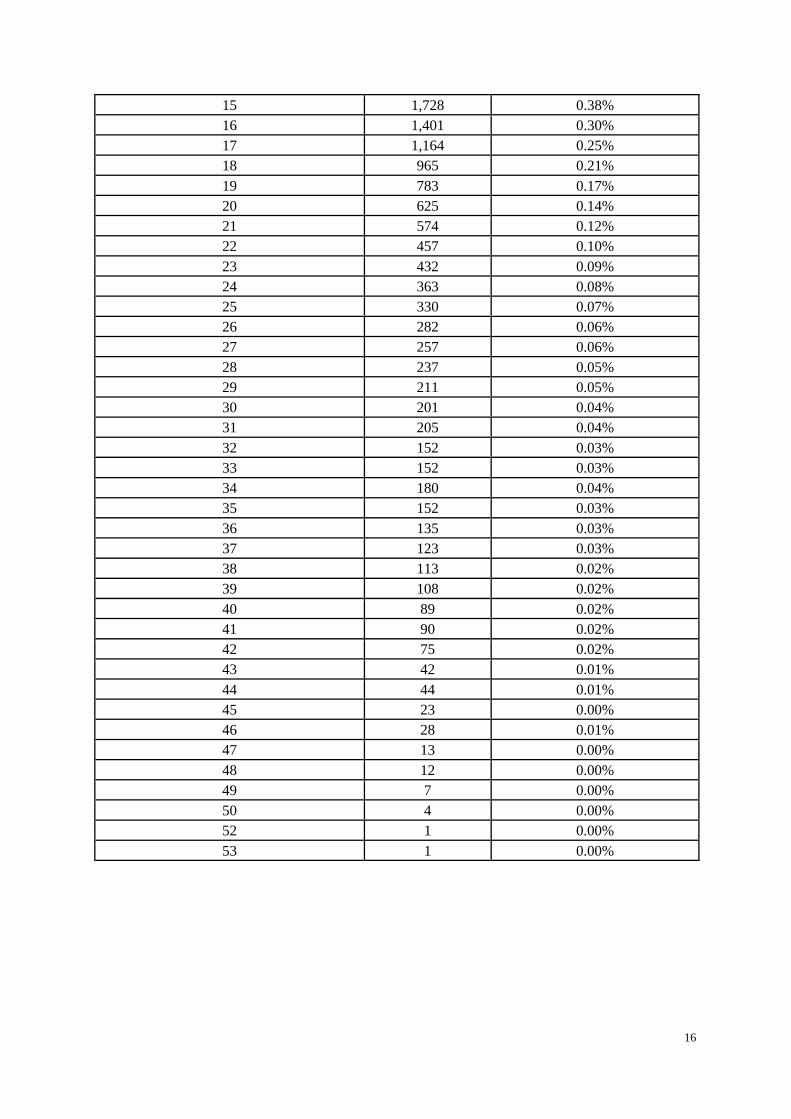
Question 3 related to whether users access newspapers from different years within a single usage
session. For example, if a user looks at a newspaper issue from 1915, 1916, and 1918 in a session,
this will result in three different years for that session. Table 10 below displays the occurrence of
years accessed during given sessions, while Figure 8 offers a visualization of this data.
Table 10: Years per Session for the TDNP sessions
Years Per Session Sessions % of Sessions
1 66,794 14.51%
2 172,208 37.41%
3 70,564 15.33%
4 41,317 8.98%
5 27,623 6.00%
6 19,048 4.14%
7 14,051 3.05%
8 10,411 2.26%
9 7,761 1.69%
10 5,858 1.27%
11 4,510 0.98%
12 3,513 0.76%
13 2,727 0.59%
14 2,163 0.47%
16
15 1,728 0.38%
16 1,401 0.30%
17 1,164 0.25%
18 965 0.21%
19 783 0.17%
20 625 0.14%
21 574 0.12%
22 457 0.10%
23 432 0.09%
24 363 0.08%
25 330 0.07%
26 282 0.06%
27 257 0.06%
28 237 0.05%
29 211 0.05%
30 201 0.04%
31 205 0.04%
32 152 0.03%
33 152 0.03%
34 180 0.04%
35 152 0.03%
36 135 0.03%
37 123 0.03%
38 113 0.02%
39 108 0.02%
40 89 0.02%
41 90 0.02%
42 75 0.02%
43 42 0.01%
44 44 0.01%
45 23 0.00%
46 28 0.01%
47 13 0.00%
48 12 0.00%
49 7 0.00%
50 4 0.00%
52 1 0.00%
53 1 0.00%
17
Figure 8: Log scale representing years accessed per session for multi-item TDNP usage interactions.
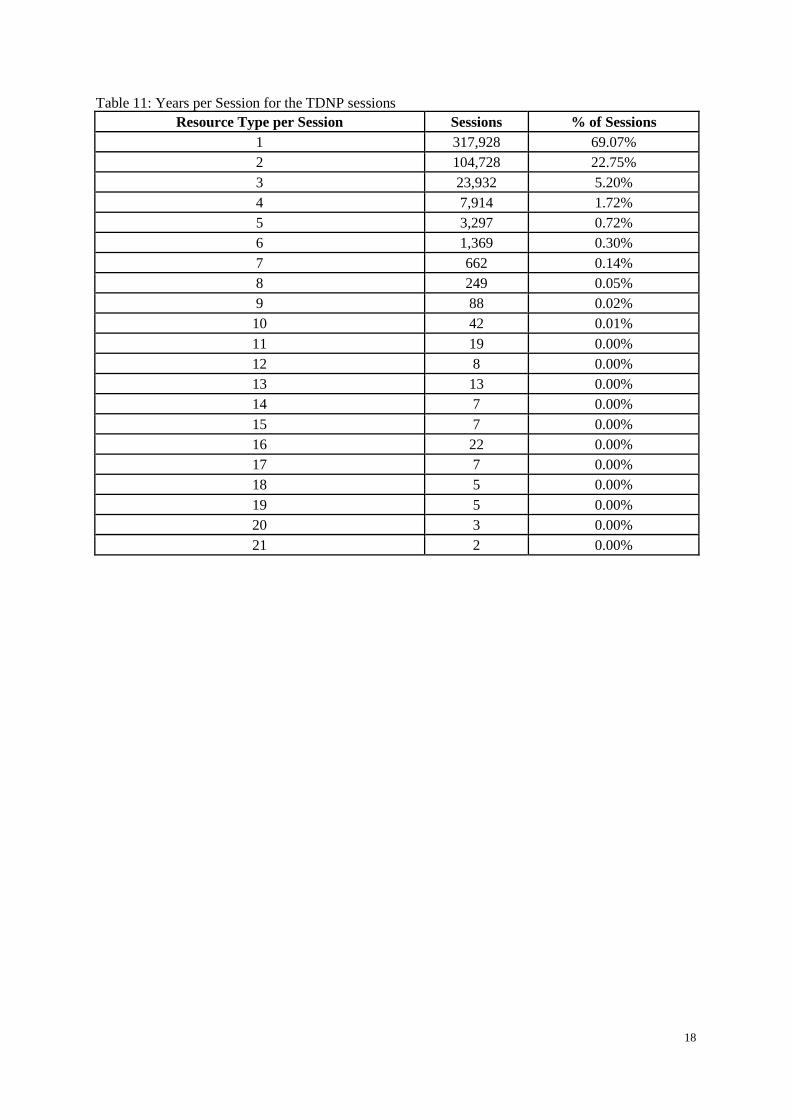
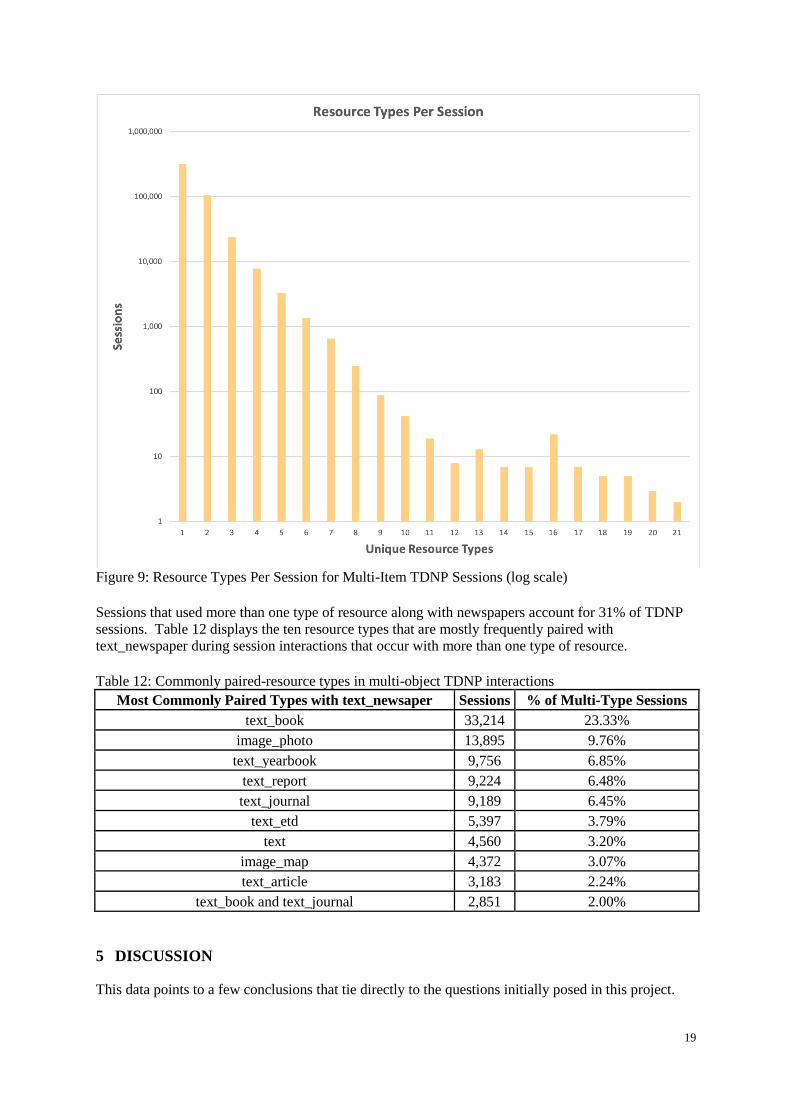
Our last research question interrogated how many different resource type interactions occurred within
a single usage session, as represented numerically in Table 11 and visually in Figure 9. An example of
this is if a user accesses a newspaper issue as well as a photograph in a given session.
18
Table 11: Years per Session for the TDNP sessions
Resource Type per Session Sessions % of Sessions
1 317,928 69.07%
2 104,728 22.75%
3 23,932 5.20%
4 7,914 1.72%
5 3,297 0.72%
6 1,369 0.30%
7 662 0.14%
8 249 0.05%
9 88 0.02%
10 42 0.01%
11 19 0.00%
12 8 0.00%
13 13 0.00%
14 7 0.00%
15 7 0.00%
16 22 0.00%
17 7 0.00%
18 5 0.00%
19 5 0.00%
20 3 0.00%
21 2 0.00%
19
Figure 9: Resource Types Per Session for Multi-Item TDNP Sessions (log scale)
Sessions that used more than one type of resource along with newspapers account for 31% of TDNP
sessions. Table 12 displays the ten resource types that are mostly frequently paired with
text_newspaper during session interactions that occur with more than one type of resource.
Table 12: Commonly paired-resource types in multi-object TDNP interactions
Most Commonly Paired Types with text_newsaper Sessions % of Multi-Type Sessions
text_book 33,214 23.33%
image_photo 13,895 9.76%
text_yearbook 9,756 6.85%
text_report 9,224 6.48%
text_journal 9,189 6.45%
text_etd 5,397 3.79%
text 4,560 3.20%
image_map 4,372 3.07%
text_article 3,183 2.24%
text_book and text_journal 2,851 2.00%
5 DISCUSSION
This data points to a few conclusions that tie directly to the questions initially posed in this project.
20
The first question related to whether usage sessions indicate access patterns to various newspaper
issues contributed by different partners. Of the 460,307 TDNP sessions that showed more than one
item use, there were 62% of these multi-item sessions that had interactions with newspaper resources
from at least two different partners. We would argue that sheer, cross-item usage indicates a benefit
to users for digital newspaper collections to be colocated whenever possible. The remaining 38% of
multi-use sessions interacted with newspaper issues contributed by a single partner institution.
The second question related to whether usage interactions show that users are accessing different
newspaper titles in their research sessions. Based on these results, 51% of the multi-item TDNP
sessions displayed interaction with more than one title during a research session, indicating that users
indeed work with the newspaper collection: searching for keywords, names, and/or places across the
newspaper titles, and reading through issues returned in search results.
Our next question asked if users read across different years within a single research session on The
Portal to Texas History. Based on our analysis of the multi-item TDNP sessions, 85% of user sessions
will make use of newspaper issues that are from different years. This provides further evidence that
users are making use of broad keyword searching capabilities and then interacting with a temporary-
wide range of issues from their search results. If users were making use of newspaper issues more
chronologically we would expect to see a higher percentage of single-year sessions than we are
seeing.
We were also interested in understanding if users interacted with multiple resource types when they
also utilized newspaper issues. For this, we were not concerned with whether they started with a
newspaper issue but simply if they utilized a newspaper issue along with other resource types during a
given research session. This data represents that 31% of multi-item TDNP sessions occurred multiple
different resource types. This provides evidence that there is value with collocating resources of
different types such as newspapers, photographs, and books because there is a great chance that they
will be used in combination. When we look at the most common resource types that are used in
conjunction with newspapers, the most common are books (23% of multi-resource type sessions)
followed by photographs at 10% and yearbooks at 7%. Books hosted on The Portal to Texas History
are broadly defined as, “book, atlas, ledger, photojournal, etc.” (https://library.unt.edu/digital-projects-
unit/metadata/fields/resource-type/#glossary-of-resource-types). These contain text and have
accompanying OCR text.
It is unsurprising that books are the most commonly accessed objects within single-sessions of
newspaper issue access because both object types contain full text, and while photographs are much
less frequently accessed with newspapers, this could be a result of lack of information about the given
photographs, such as complete dates or names--information that does exist in complete form within
books and newspapers.
The final research question was whether the data indicated longer time interactions with newspaper
content when compared to interactions in the UNTDC that did not utilize newspaper issues. The
12,927,175 user sessions from the UNT Libraries’ Digital Collections indicate a mean duration of 103
seconds compared to 229 average seconds from the 1,722,400 user sessions that interacted with at
least one item from the TDNP collection. This is a difference of 122%, though it should be noted that
the whole number also includes the TNDP users. When we calculate the average duration for non-
TDNP users this results in 11,204,775 sessions with a mean duration of 84 seconds. This represents a
172% increase in the average duration of TDNP usage when compared to non-TDNP usage in the