41
Exploring USMC Distributed Operations Through Project Albert Agent Based Modeling and Coevolution Final Briefing Mary McDonald 4 May 2005
| Date post: | 27-Dec-2015 |
| Category: |
Documents |
| Upload: | anabel-gallagher |
| View: | 213 times |
| Download: | 0 times |

Exploring USMC Distributed Operations Through Project Albert Agent Based Modeling and Coevolution
Final Briefing
Mary McDonald4 May 2005
2
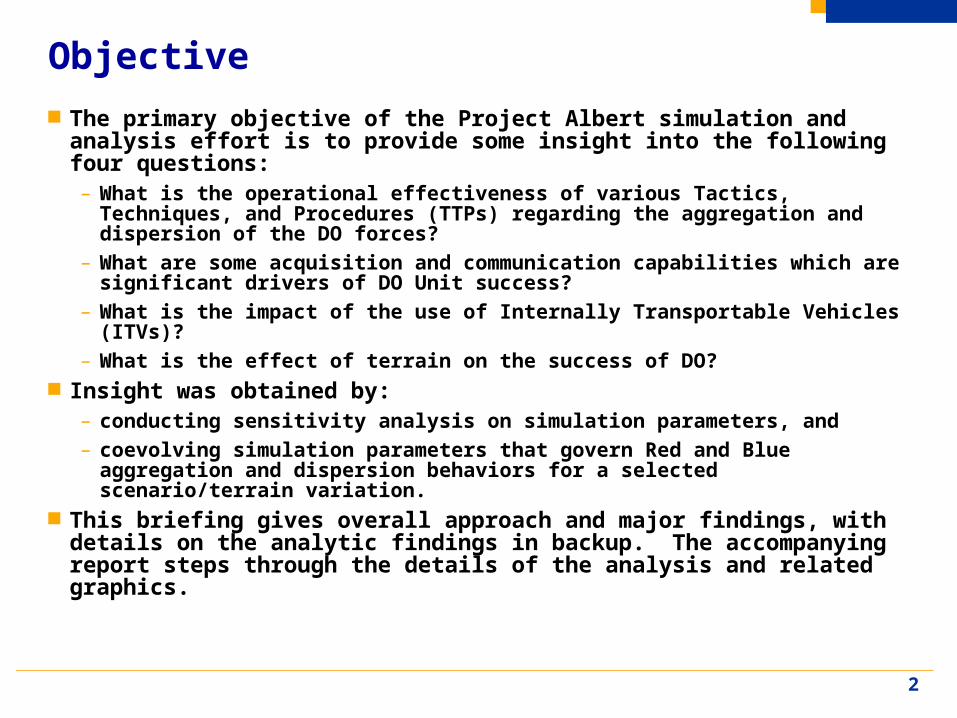
Objective
The primary objective of the Project Albert simulation and analysis effort is to provide some insight into the following four questions:– What is the operational effectiveness of various Tactics, Techniques, and
Procedures (TTPs) regarding the aggregation and dispersion of the DO forces?
– What are some acquisition and communication capabilities which are significant drivers of DO Unit success?
– What is the impact of the use of Internally Transportable Vehicles (ITVs)?– What is the effect of terrain on the success of DO?
Insight was obtained by:– conducting sensitivity analysis on simulation parameters, and– coevolving simulation parameters that govern Red and Blue aggregation
and dispersion behaviors for a selected scenario/terrain variation. This briefing gives overall approach and major findings, with details
on the analytic findings in backup. The accompanying report steps through the details of the analysis and related graphics.

3
Scenario 2006 Expeditionary Strike Group (ESG) - Marine Expeditionary Unit (MEU) based with
experimental equipment
– Size of DO Unit: Squad
– Blue: Two companies in DO mode, with one conventional company used as an exploitation force. The 18 Squads of the two DO Companies operate in distributed, non-contiguous Areas of Operation (AO).
– Blue Mission/Concept of Operations (CONOPS): Gain intel on Red locations. Try to avoid compromise by maximizing use of indirect fire assets. Locate, close with, and destroy enemy as they are encountered.
– Red: Mounted and Dismounted Infantry Units (up to squad-size conventional; and 2-3 man insurgent/terrorist teams which represent an elusive, time-critical-target threat)
– Conventional Red Mission/CONOPS: Harrass, interdict Blue. Defend training facility.
– Insurgent Mission/CONOPS: Use civilian populace to pass and gain information about Blue locations. Destroy Blue, perform suicide mission if necessary.
– Simulated Time: 24 hours
The medium complexity terrain used in this effort represents a 150 km by 150 km portion of the Southern California area which encompasses Naval Base San Diego, Marine Corps Base (MCB) Camp Pendleton, Marine Corps Air Station (MCAS) Yuma, and MCB 29 Palms.

4
Scenario Assumptions Red does not conduct electronic warfare. Red does not use weapons of mass destruction. Conventional Red force resembles a company sized element of a Russian rifle
battalion (equipment characteristics taken from the Opposing Force (OPFOR) Modeling Guide).
Insurgent Red force is a paramilitary, non-uniformed, non-state-actor force. Blue DO force is 2/3 mounted – 12 of the 18 squads were fully mobile via
Internally Transportable Vehicles. Blue has Sea Viking 06 experimental equipment. The Red insurgent teams had the following characteristics:
– assault typically at close range– rely on surprise, speed and intelligence when attacking– often use improvised explosive devices (IEDs), and sometimes willing to conduct
suicide missions– hit and run tactics – attack soft targets, e.g. dismounted infantry– avoid decisive and sustained contacts– not easily identifiable, e.g. in civilian clothes
5
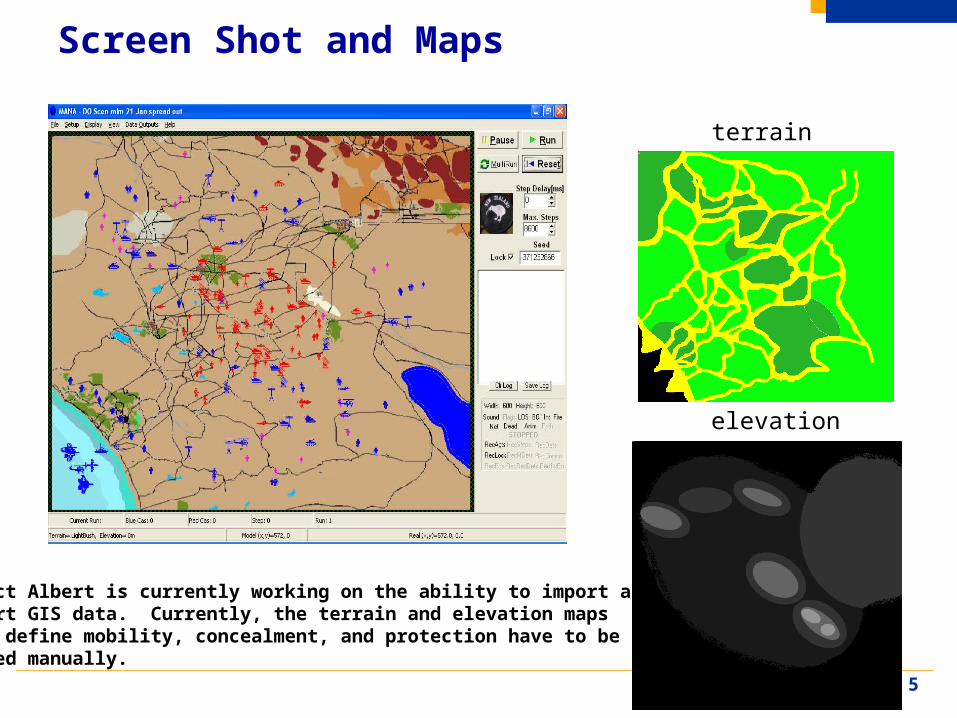
Screen Shot and Maps
Project Albert is currently working on the ability to import and convert GIS data. Currently, the terrain and elevation mapswhich define mobility, concealment, and protection have to becreated manually.
terrain
elevation

6
Modeling Approach
Map Aware Nonuniform Automata (MANA) version 3.0.37 used– Developed by New Zealand Defense Technology Agency
Model Strengths– Aggregation/Dispersion behaviors can be explicitly modeled.
– Relatively quick scenario set up time and fast run times; easy to understand and manipulate GUI to produce a variety of operational scenarios.
– Flexible and detailed treatment of situational awareness and communications, for example includes representation of Blue Force tracking update periods, track times, fusing of tracks, combat ID, reliability, latency, capacity, topology, and type of information passed over a link.
– Ability to assign mobility, concealment, and protection properties to heterogeneous terrain features. Can define a series of (possibly dynamic) waypoints, or terrain objectives, in addition to a final goal.
– Behaviors/Rules of Engagements (ROEs), types of weapons employed, and other physical capabilities (speed, sensing) can change in response to simulation events. Changes can apply to individuals or to a whole group at once.
7
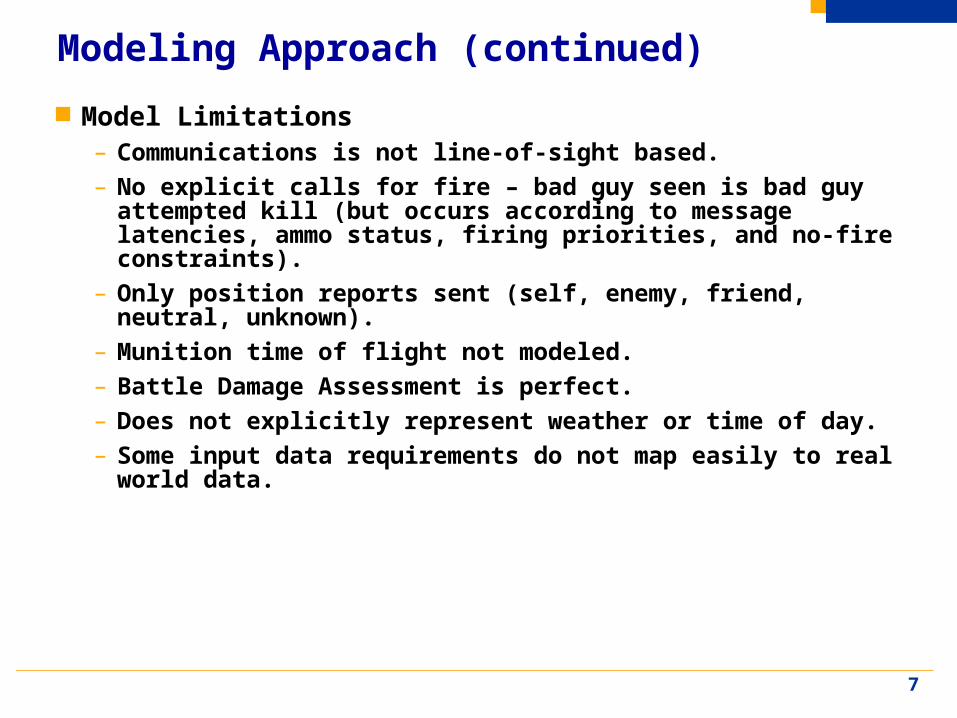
Modeling Approach (continued)
Model Limitations– Communications is not line-of-sight based.– No explicit calls for fire – bad guy seen is bad guy attempted kill (but
occurs according to message latencies, ammo status, firing priorities, and no-fire constraints).
– Only position reports sent (self, enemy, friend, neutral, unknown).– Munition time of flight not modeled.– Battle Damage Assessment is perfect.– Does not explicitly represent weather or time of day.– Some input data requirements do not map easily to real world data.

8
Measures of Effectivness

9
Discussion of Results
10
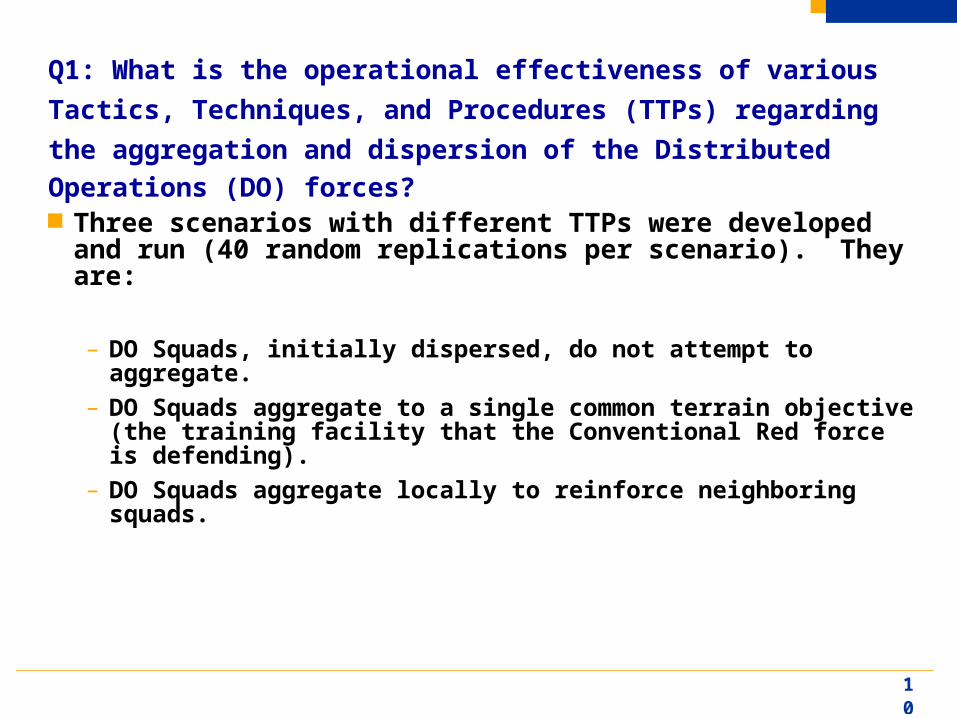
Q1: What is the operational effectiveness of various Tactics,
Techniques, and Procedures (TTPs) regarding the aggregation and
dispersion of the Distributed Operations (DO) forces?
Three scenarios with different TTPs were developed and run (40 random replications per scenario). They are:
– DO Squads, initially dispersed, do not attempt to aggregate.– DO Squads aggregate to a single common terrain objective (the
training facility that the Conventional Red force is defending).– DO Squads aggregate locally to reinforce neighboring squads.

11
Q1 Top Findings DO Squads are most vulnerable to enemy attacks overall in the scenario where they do
not attempt to aggregate – it is in this scenario that Blue experiences its highest average number killed. Also, in this scenario, their rate of detecting is lowest, especially after approximately the first five hours of simulated time. How well they are placed initially makes all the difference. If the intelligence on Red is good, they will be in a position to acquire many more detections. If they are poorly placed to begin with though, they will not see as much as if they attempted to move in concert with the other Squads.
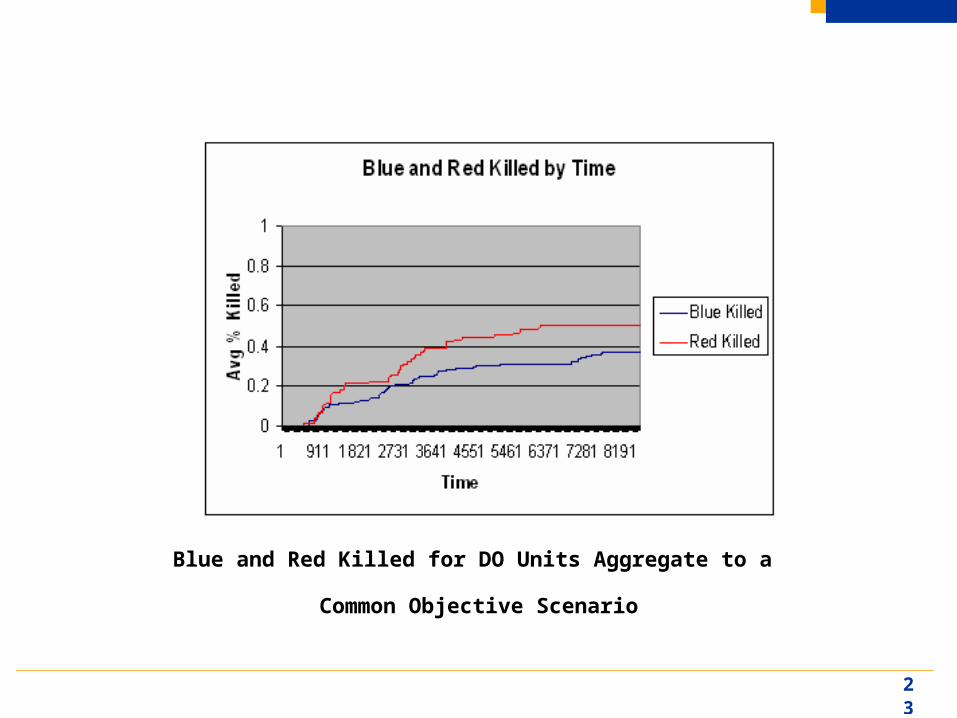
When the DO Squads attempt to move to a common objective, fewer Blue were killed. This could be due in part to the fact that once close to or at their objective, their combined organic firepower was better equipped to deal with the insurgent and conventional Red threat without needing to rely as much on the availability of indirect inorganic fires.
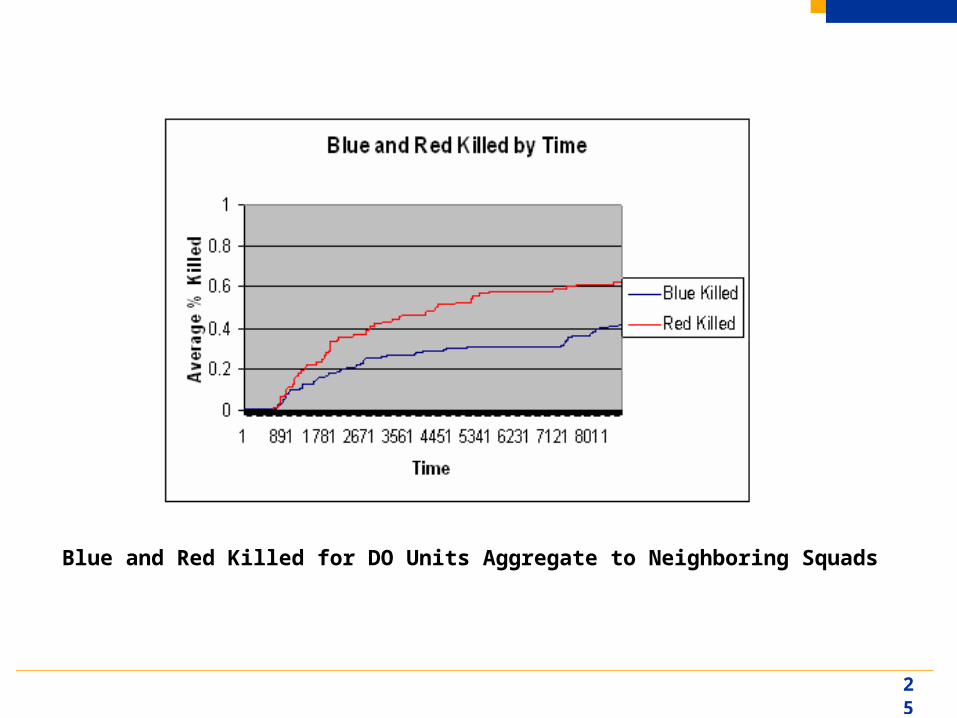
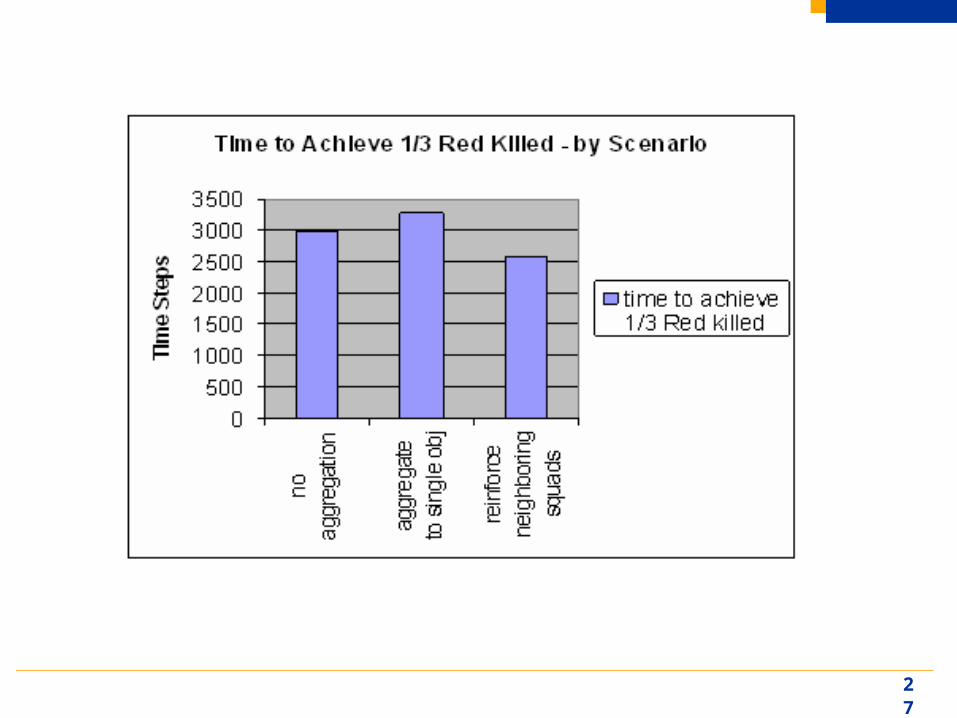
When the DO Squads attempted to reinforce neighboring squads locally vice globally, they achieved killed more Red while maintaining about the same level of Blue survivability as in the scenario when they attempted to move to a common objective. This could be due to the fact that the “local pockets” of Blue forces were able to achieve a lethal effect on a larger area of the battlespace, and also could detect Red locations more consistently across the scenario than in the scenario when they all tempted to move to a common objective. This was also the scenario in which Blue achieved 1/3 Red killed in the shortest amount of time.
12
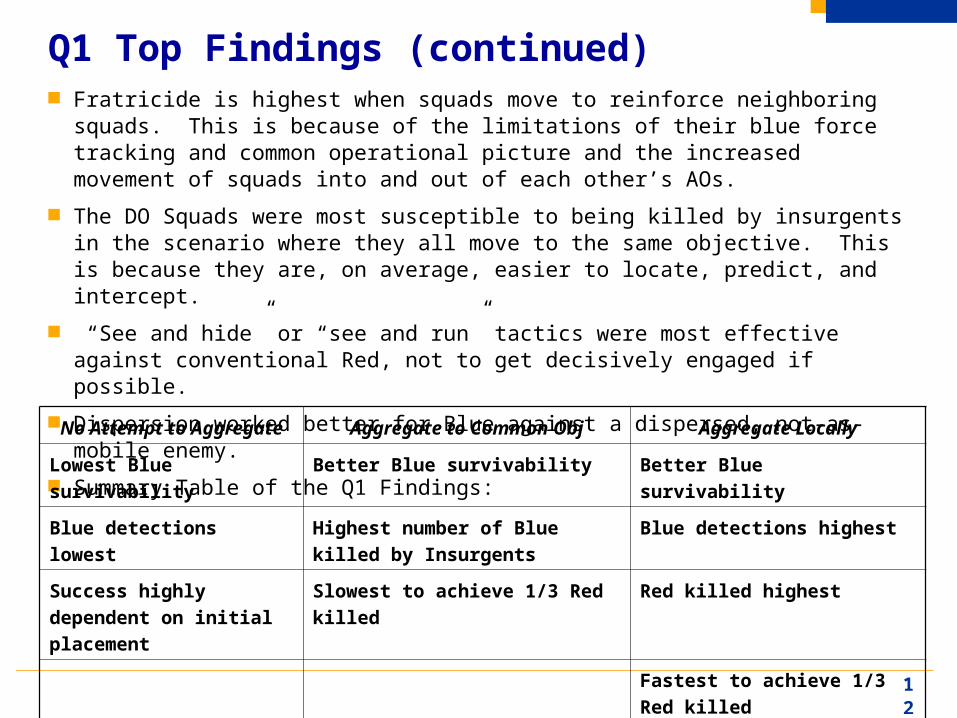
Q1 Top Findings (continued) Fratricide is highest when squads move to reinforce neighboring squads. This is
because of the limitations of their blue force tracking and common operational picture and the increased movement of squads into and out of each other’s AOs.
The DO Squads were most susceptible to being killed by insurgents in the scenario where they all move to the same objective. This is because they are, on average, easier to locate, predict, and intercept.
“See and hide” or “see and run” tactics were most effective against conventional Red, not to get decisively engaged if possible.
Dispersion worked better for Blue against a dispersed, not-as-mobile enemy.
Summary Table of the Q1 Findings:
No Attempt to Aggregate Aggregate to Common Obj Aggregate Locally
Lowest Blue survivability Better Blue survivability Better Blue survivability
Blue detections lowest Highest number of Blue killed by
Insurgents
Blue detections highest
Success highly dependent
on initial placement
Slowest to achieve 1/3 Red killed Red killed highest
Fastest to achieve 1/3 Red
killed
Fratricide highest

13
Q2: What are some acquisition and communication capabilities
which are significant drivers of DO Unit success?
Note: the cognitive processing of information is not modeled in MANA to the extent that it should be explored and considered. For example, the modeling and measuring of a cognitive ratio, as suggested by Studies & Analysis Division, is considered future work. The following parameters were varied (40 random replications per combination):
Parameter Name Description Min Max Steps
Accuracy (Acy) Target discrimination/combat ID function – the likelihood that a contact’s type (friend, enemy, neutral) will be passed correctly
60% 100% 10%
Reliability (Rly) likelihood that a given message will be successfully sent
0% 100% 10%
Latency (Lty) how long for a message to arrive at its intended destination
20 sec 10 min 20 sec
Communications Range (CR)
how far a communication link will reach
1 km 101 km 10 km
14
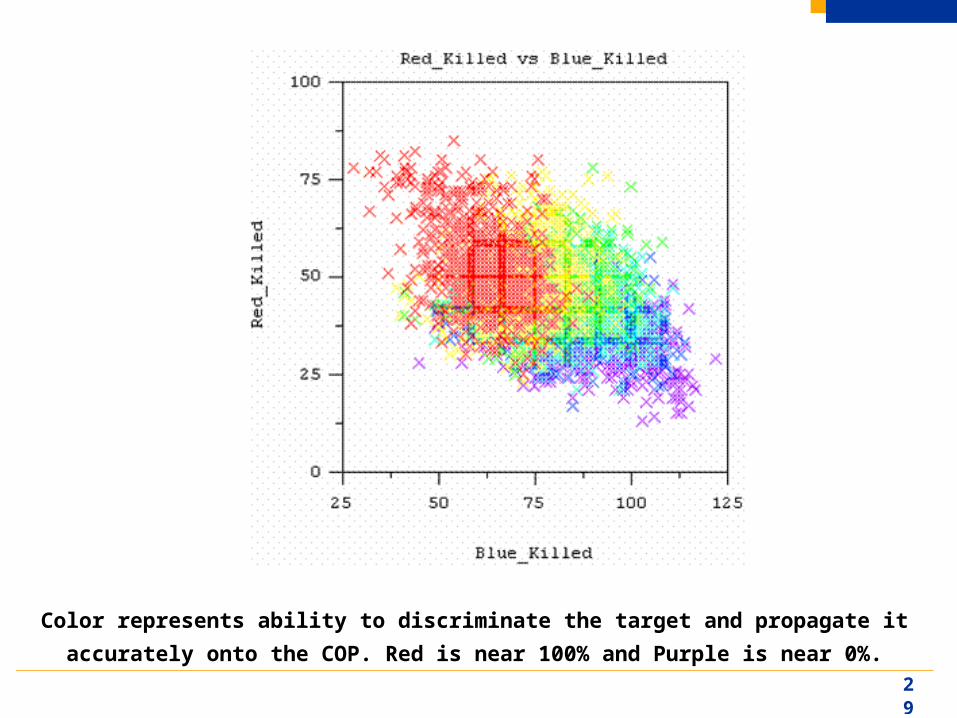
Q2 Top Findings The ability to discriminate enemy presence and intent and propagate this information onto the shared
COP (surrogated by the Accuracy parameter in MANA) was the most critical driver of Blue Survivability.
Reliability and Range were most important for the ability to incur high Conventional Red Casualties, and this is because the DO Units relied on the use of inorganic fire support assets to do the preponderance of the shooting.
The parameters varied here were not as good predictors of success at incurring Insurgents killed. The reason for this is that in the MANA scenario, insurgents represented an elusive and dangerous threat that was best dealt with through organic assets and/or evasion. The ability to discriminate enemy presence and intent was still extremely important for success and survival, but the act of accurately projecting it to the COP for other Blue to see was not a top predictor of success.
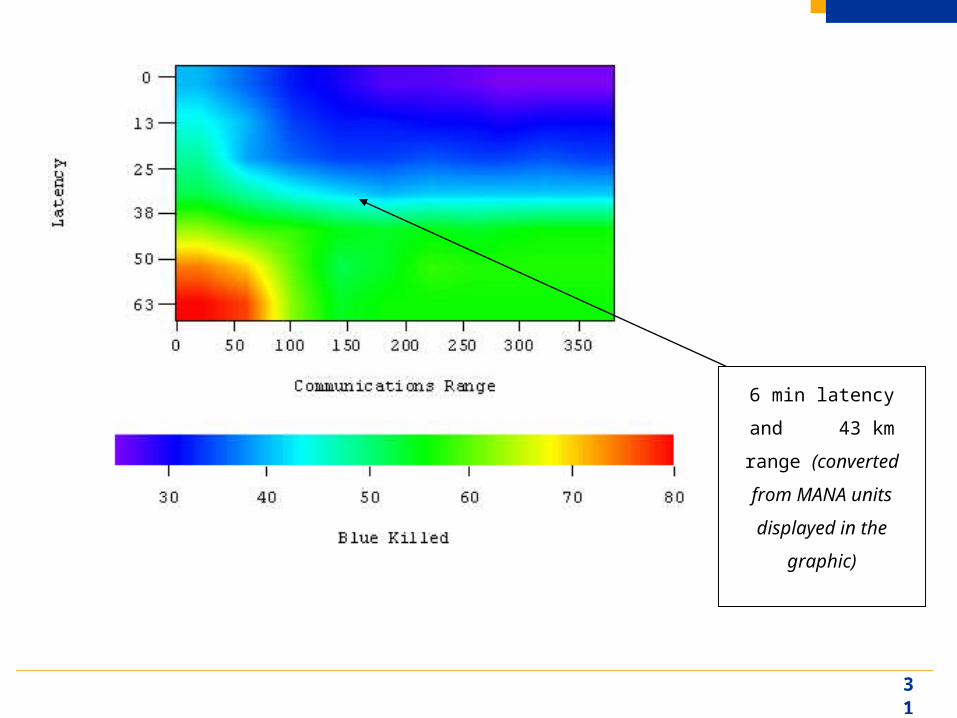
Increasing communications range increased the amount of contacts, but diminishing returns could be reached when overload became an issue. When latencies were 6 minutes or less, a communications range of approximately 43 km was sufficient to achieve a high Blue survivability. At 6 minutes of latency, Blue survivability was 72%, and communications ranges greater than 43 km yielded little improvement to Blue survivability. However, reducing latency down to 4 minutes or less led to increased Blue survivability - up to about 84%, even with communications ranges down around 25 km. An assumption was that contacts could propagate from one network link to another.
When communications range was less than 17 km, an unresponsive network could have a devastating effect, yielding situations in which over 50% of Blue were killed.
15
Q3: What is the impact of the use of Internally Transportable Vehicles (ITVs)?
The following three scenarios developed and ran (40 random replications per scenario):
– DO Force fully mounted (18 squads have access to ITVs)– DO Force 2/3 mounted (12 squads have access to ITVs)– DO Force 1/3 mounted (6 squads have access to ITVs)

16
Q3 Top Findings
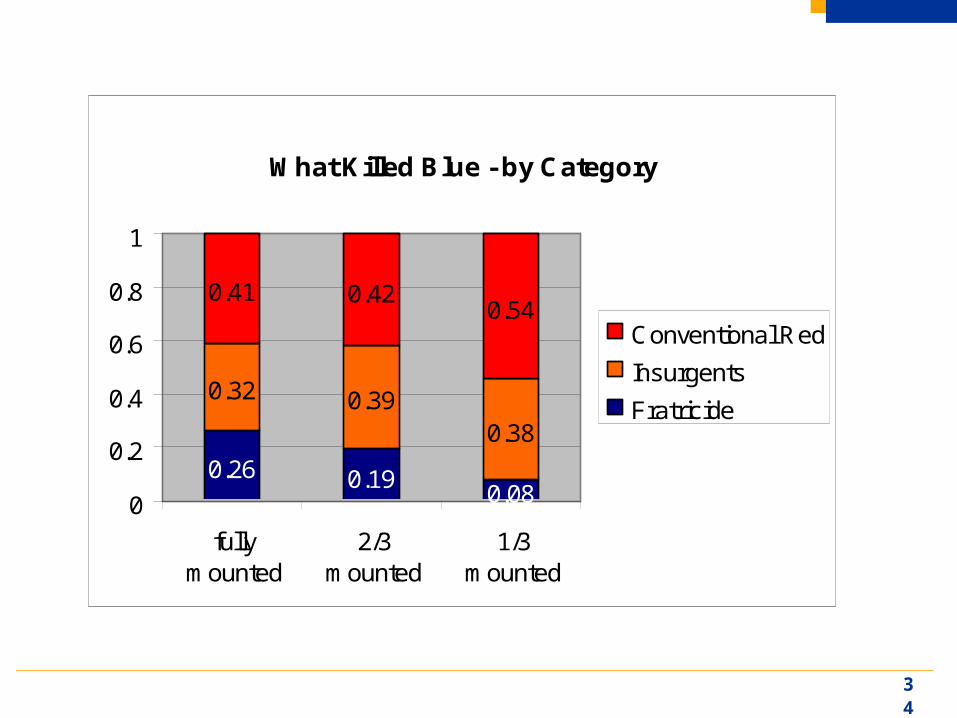
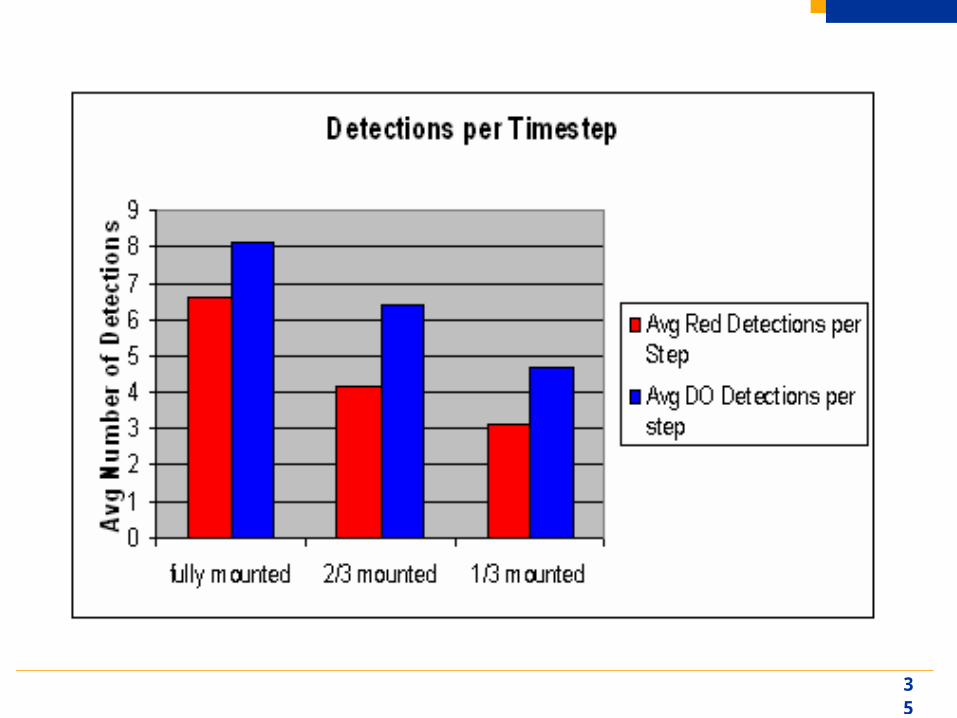
Being fully mounted allowed the DO force to achieve the greatest number of Red Kills while at the same time minimizing the number of DO killed. Even though the DO squads were assumed less stealthy when mobilized, their increased firepower and protection and ability to quickly flee many potentially hostile situations with insurgents before becoming decisively engaged allowed them to be more successful than when on foot. Also, there was less variance (e.g. less risk) in the simulation runs when the DO force was fully mounted than in the 2/3 mounted and 1/3 mounted DO force scenarios.
The DO Units acquired more enemy contacts when fully mounted in ITVs, but they were also detected much more often by Red.
When fully mounted, the DO Units were less susceptible to conventional Red attack (because they could move quickly out of the danger area for the most part), but they were more susceptible to fratricide. Especially with an imperfect network response time, they were more likely to move into impact areas of other DO Squads’ calls for fire.
ITVs were better off road when possible, for purposes of increased stealth. Also, tactics that allow mobile forces to move quickly to cordon an area, so the foot mobile force could follow on with a seizing attack, were very effective.

17
Q4: What is the effect of terrain on the success of Distributed Operations (DO)?
The base case was run with the following terrain types (40 random replications per terrain type):– Desert – Jungle– Medium Complexity (Southern California)– Mountainous
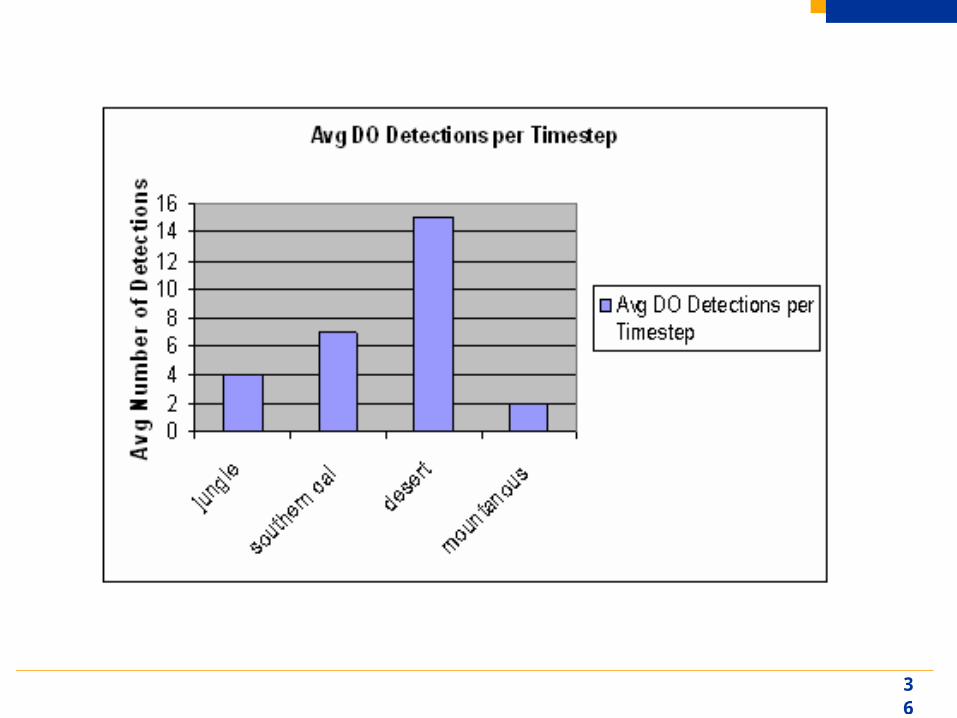
Q4 Top Findings:– Mountainous terrain protects everyone, resulting in fewer killed, and it
also prohibits DO squads’ ability to detect enemy. In the desert, there are many more detections, and consequently more kills.
– In heavily mountainous terrain, many DO squads could not aggregate when they wished to, or else were moving so slowly as to prevent the buildup of local pockets of Blue force activity.

18
Coevolution – Competitive Adaptation of Blue and Red Aggregation/Dispersion Parameters An evolutionary algorithm is a biologically-inspired approach to finding
a solution to a problem whose search space is large or whose characteristics are unknown. Inspired by the Darwinian principle of natural selection, possible solutions "compete" for survival. The stronger solutions remain to reproduce and give birth to new ones, while the weaker solutions are discarded and replaced by new (random) members. This iterative process of replacement of solutions with new ones leads to better solutions in a statistical manner.
In a coevolutionary algorithm both sides (Blue and Red) adapt and change
Natural Algorithm Experimenter (NALEX) software used. Technical details appear in the report.
Coevolutionary algorithm is a wrapper around the simulation runs (no evolutionary learning within a single simulation run)
Metric used to determine success: Average Force Exchange Ratio over 40 random replications
"War is not the action of a living force upon a lifeless mass ... but always the collision of two
living forces ... I am not in control: he dictates to me as much as I dictate to him." -- Clausewitz
19
Top Coevolution Results
The coevolutionary runs suggested that a DO Unit the size of a platoon is more survivable than a DO Unit the size of a squad. This is what “evolved” as the proposed solution.
Under the assumption that DO Units were not trying to aggregate, it was also evolved that a DO Unit of the proper size performs best when maintaining distance from other DO Units, but separated by no more than 30 km on a 150 km by 150 km piece of medium complexity terrain. In this case, they would have been able to aggregate had they wanted to in about one hour, given ITV-trafficable terrain.
(Limited) dispersion, and avoidance, was the best Red could do against a Blue DO-type attack. The more dispersed and on the move Red was, the harder it was for Blue to hit all of the Red targets with inorganic assets.

20
Backup

21
Blue and Red Killed for DO Units Do Not Aggregate Scenario

22
Histogram of DO Detections for DO Units Do Not Aggregate Scenario
23
Blue and Red Killed for DO Units Aggregate to a
Common Objective Scenario

24
Histogram of DO Detections for DO Units Aggregate to a
Common Objective Scenario
25
Blue and Red Killed for DO Units Aggregate to Neighboring Squads

26
Histogram of DO Detections for DO Units Aggregate to
Neighboring Squads
27

28
29
Color represents ability to discriminate the target and propagate it accurately onto the
COP. Red is near 100% and Purple is near 0%.

30
A Parallel Coordinates Plot Highlighting Runs that Achieve Low Blue Killed and High Red Killed
31
6 min latency and
43 km range
(converted from
MANA units displayed
in the graphic)

32

33
Blu
e K
illed
Box Plots of the Distributions of DO Killed by Scenario
34
What Killed Blue - by Category
0.26 0.190.08
0.32 0.390.38
0.41 0.420.54
0
0.2
0.4
0.6
0.8
1
fullymounted
2/3mounted
1/3mounted
Conventional Red
Insurgents
Fratricide
35
36

37

38
39
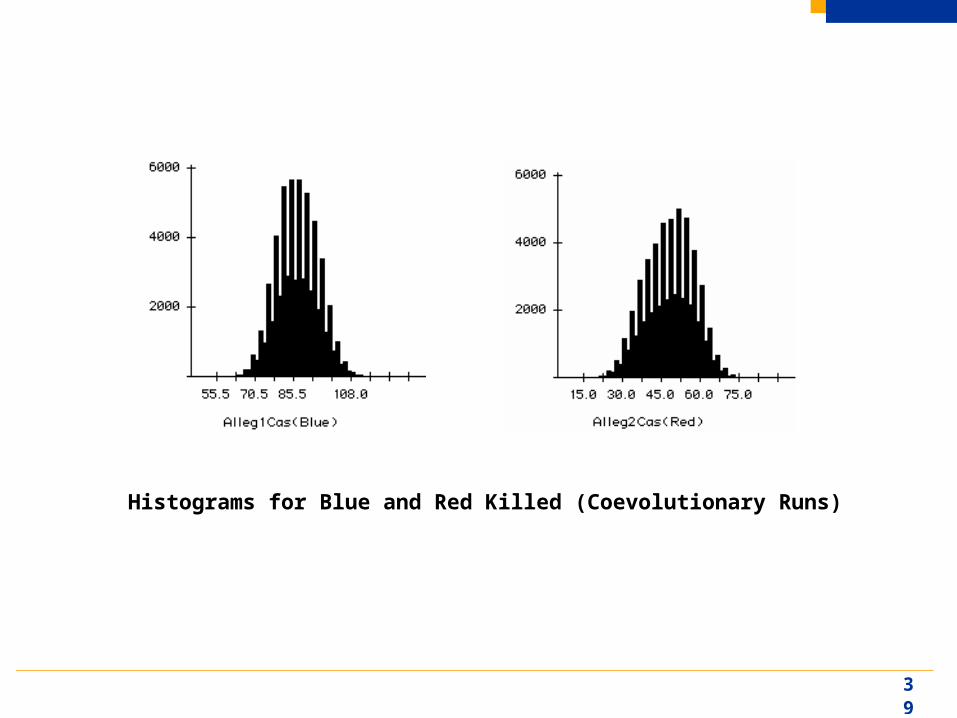
Histograms for Blue and Red Killed (Coevolutionary Runs)

40
Histograms for the Blue Parameters Evolved Over
41
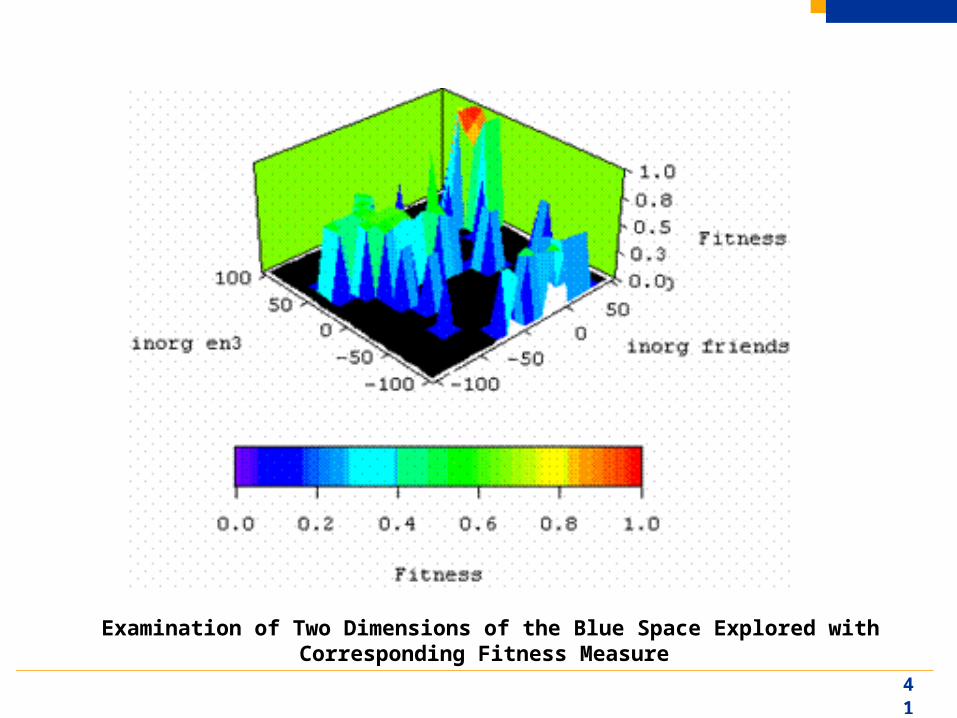
Examination of Two Dimensions of the Blue Space Explored with Corresponding Fitness Measure


