Instructions Extended HSM Spreadsheets (Updated HSM Spreadsheets originally developed by Dr. Karen Dixon, Oregon State University) Prepared for Alabama DOT & Virginia DOT December 23, 2011 1100 112th Avenue NE Suite 400 Bellevue, WA 98004
Transcript
I n s t r uc t i ons
Extended HSM Spreadsheets (Updated HSM Spreadsheets originally developed by
Dr. Karen Dixon, Oregon State University)
Prepared for Alabama DOT & Virginia DOT
December 23, 2011
1100 112th Avenue NE Suite 400
Bellevue, WA 98004
I EXTENDED HSM SPREADSHEETS V.3 - Data, analyses, studies, or training associated with, or findings and documents produced by this software are based on information compiled or collected
pursuant to 23 U.S.C. §§130 and 148 and other federal safety programs and are exempt from discovery or admission under 23 U.S.C. §§ 402 and 409.
DISCLAIMER These Highway Safety Manual (HSM) predictive analysis spreadsheet tools were developed for training purposes only. The spreadsheets are believed to be functioning correctly, but are provided without any guarantee of accuracy or completeness. No business decisions should be made based on results of these analysis tools without first validating their accuracy and completeness. Any person, organization, firm, corporation or other entity using these analysis tools does so at their own risk, and assumes all legal liability and responsibility arising out of its use and the user(s) agrees to indemnify and hold harmless VDOT, ALDOT, and any individual or entity involved with or contributing to the development or update of the predictive method spreadsheets, and for those providing access to these tools, from any damages, losses or claims by any person, organization, firm, corporation, or other entity from the use of this tool.
CONFIDENTIAL INFORMATION ‐ Data, analyses, studies, or training associated with, or findings and documents produced by, this software are based on information compiled or collected pursuant to 23 U.S.C. §§130 and 148 and other federal safety programs and are exempt from discovery or admission under 23 U.S.C. §§ 402 and 409.
ALABAMA CONFIDENTIAL INFORMATION STATEMENT ‐ Data, analyses, studies, or training associated with, or findings and documents produced by this software are protected from disclosure under the Alabama Open Records Law, Ala. Code §36‐12‐40 (1975). Any dissemination, distribution or copying of this communication, or of the data, analyses, studies, or training materials is strictly prohibited without the express written permission of the Alabama Department of Transportation.
The user of this tool acknowledges that these spreadsheets were developed from information contained in AASHTO Highway Safety Manual, 2010, and should be familiar with the concepts and procedures outlined therein when using this spreadsheet analysis tool.
ACKNOWLEDGEMENTS During 2009 and 2010, Dr. Karen Dixon, Principal Investigator of NCHRP 17‐38, developed three spreadsheets in a volunteer effort to support training efforts on the first edition of the HSM. The extended Highway Safety Manual (HSM) predictive analysis spreadsheets represent updates to these three spreadsheets. The update was funded through a partnership between the Alabama Department of Transportation and Virginia Department of Transportation. These agencies are releasing these tools for use by other individuals and agencies to support the implementation of the HSM across the nation.
The extended spreadsheets were developed by Kate Bradbury and Ida van Schalkwyk; with support from Josh Johnson, Richard Storm and Jacqueline Dowds‐Bennett (CH2M HILL).
CONTACT For enquiries regarding the original HSM spreadsheets developed by Dr. Karen Dixon, please contact Karen at (541) 737‐6337 ([email protected]). For enquiries about the expanded spreadsheets, please contact Ida van Schalkwyk at (360) 515‐0590 ([email protected]).
II EXTENDED HSM SPREADSHEETS V.3 - Data, analyses, studies, or training associated with, or findings and documents produced by this software are based on information compiled or collected
pursuant to 23 U.S.C. §§130 and 148 and other federal safety programs and are exempt from discovery or admission under 23 U.S.C. §§ 402 and 409.
III EXTENDED HSM SPREADSHEETS V.3 - Data, analyses, studies, or training associated with, or findings and documents produced by this software are based on information compiled or collected
pursuant to 23 U.S.C. §§130 and 148 and other federal safety programs and are exempt from discovery or admission under 23 U.S.C. §§ 402 and 409.
CONTENTS Intent of the Extended Spreadsheets ............................................................................................................................ 3
Functionality of the Extended Spreadsheets ................................................................................................................. 3
Color Legend .................................................................................................................................................................. 5
Task 1. Create a Project File ........................................................................................................................................... 6
Task 2. Enter Project Information .................................................................................................................................. 8
Task 3. Complete the Element Table ............................................................................................................................. 9
Task 4. Enter Required Information on Each Element Tab .......................................................................................... 11
Task 5. Generate Analysis Results and Report ............................................................................................................. 12
Task 6. Review Report and Discussion of Results ........................................................................................................ 12
*Task 7. Enter Multi‐Year Analysis Information .......................................................................................................... 13
*Task 8. Generate and Review Multi‐Year Report and Discussion .............................................................................. 14
Appendix A: Example of Output from the Extended Spreadsheets ......................................................................... A‐1
Appendix B: Modifications to Worksheet 3C in Chapter 12 ...................................................................................... B‐1
LIST OF EXHBIITS
EXHIBIT 1: Enable Macros Procedure in Microsoft Excel ............................................................................................. 6 EXHIBIT 2: Extended Spreadsheet Disclaimer............................................................................................................... 7 EXHIBIT 3: Save Spreadsheet As Prompt ...................................................................................................................... 7 EXHIBIT 4: General Information Inputs on the Project Information Sheet ................................................................... 8 EXHIBIT 5: Update Element Table Button and Element Table on the Project Information Sheet ................................ 8 EXHIBIT 6: Element Table on the Project Information Sheet ........................................................................................ 9 EXHIBIT 7: Example of completed Project Safety Performance Analysis Input Sheet ................................................ 10 EXHIBIT 7: Example Element Input Table (e.g. Segment 1) – Worksheet 1A ............................................................. 11 EXHIBIT 8: Multiple‐Year Analysis Inputs in the Multi‐Year Analysis Inputs worksheet ............................................ 13
IV EXTENDED HSM SPREADSHEETS V.3 - Data, analyses, studies, or training associated with, or findings and documents produced by this software are based on information compiled or collected
pursuant to 23 U.S.C. §§130 and 148 and other federal safety programs and are exempt from discovery or admission under 23 U.S.C. §§ 402 and 409.
Acronyms and Abbreviations AASHTO – American Association of State Highway Transportation Officials
ALDOT – Alabama Department of Transportation
HSM – Highway Safety Manual
OSU – Oregon State University
VDOT – Virginia Department of Transportation
BACKGROUND TO THE EXTENDED SPREADSHEET TOOL
1 EXTENDED HSM SPREADSHEETS V.3 - Data, analyses, studies, or training associated with, or findings and documents produced by this software are based on information compiled or collected pursuant to 23 U.S.C. §§130 and 148 and other federal safety programs and are exempt from discovery or admission under 23 U.S.C. §§ 402 and 409.
Background to the Extended Spreadsheet Tool During 2009 and 2010, a number of training courses related to the Highway Safety Manual occurred. Some of this this training was completed as part of a National Cooperative Highway Research Program (NCHRP 17‐38). This project was led by Dr. Karen Dixon from Oregon State University. As part of the ongoing training activities, the course was refined to incorporate changes based on feedback from the participants of the pilot training courses.
It was apparent that the AASHTO HSM Part C Predictive Method Worksheets (provided on pages p.12‐108 through 12‐122 of Volume 2 of the HSM) were challenging to complete, time consuming and had a high potential for errors given the relative inexperience of the class participants. To improve the learning environment and support implementation of the HSM, Dr. Dixon developed automated spreadsheets for each chapter in Part C.
These spreadsheets are seeing increased usage across the country as states continue to implement the HSM. Given the time savings and improved quality the spreadsheets provide, response and use of the tools have been significant and positive. In April 2011, VDOT realized that enhancement to the tools could increase the learning experience and project development usage.
In particular, VDOT initiated discussion related to an extended version of the spreadsheets that would:
a) Eliminate the need for user manipulation of Site Total worksheet to perform the site‐specific EB method, b) Create an automated report that summarizes the results of the analysis in table, graphic, and text format, and c) Perform a multi‐year analysis.
Subsequently, VDOT and ALDOT collaborated on the development of the extended spreadsheets. During August 2011, work on the extended spreadsheets was initiated as part of a HSM training contract with the Alabama University Transportation Center. CH2M HILL completed Version 3 of the extended spreadsheets in October 2011.
The extended spreadsheets are official products of a project funded by the Alabama Department of Transportation through the Alabama University Transportation Center. The State of Alabama has released the spreadsheets to the industry at no cost and as is. A primary motivation for this public release is the state and national commitment of ALDOT to the goal of reducing the likelihood and severity of crashes on public roadways. ALDOT also recognizes that the original NCHRP 17‐38 spreadsheets and training were jointly funded and developed through the efforts of a number of individuals and states. The work developed under contract with the University Transportation Center builds upon the existing efforts of Dr. Karen Dixon.
Users should carefully review the disclaimer prior to the use of the spreadsheets. The extended spreadsheets will require the user to read, understand, and accept the disclaimer before the spreadsheets can be used.
A disclaimer is included in the footer of each printed page of the worksheets as a default (and can be changed by the user): Federal law 23 USC § 409 prohibits the discovery or admission into evidence of “reports, surveys, schedules, lists, or data” compiled or collected for the purpose of highway safety improvement projects that might qualify for federal safety improvement funding.
ASSUMPTIONS
2 EXTENDED HSM SPREADSHEETS V.3 - Data, analyses, studies, or training associated with, or findings and documents produced by this software are based on information compiled
or collected pursuant to 23 U.S.C. §§130 and 148 and other federal safety programs and are exempt from discovery or admission under 23 U.S.C. §§ 402 and 409.
Assumptions The assumption is made that the user of the spreadsheets (original and expanded) is familiar with the HSM and is using the spreadsheets alongside the HSM. The selection of appropriate values for use in the worksheets requires familiarity with the HSM and the development and the use of the information contained therein. The spreadsheets are intended to reduce input and analysis time by automating the predictive method calculations.
Each of the Safety Performance Functions (SPFs) in the HSM has a valid volume range. In the case of the multi‐year analysis, it is presumed that the user will only use the spreadsheet across valid volume ranges, i.e. the extended spreadsheets will not provide any indication to the user that the volume ranges were exceeded.
Functionality of the Original Worksheets The original spreadsheets developed by Dr. Dixon present a spreadsheet for each chapter in Part C of the HSM, with the following worksheets:
Instructions ‐ Provides instructions for the spreadsheet (and a description of the intent of the spreadsheets)
Intersection Tables – Worksheet with intersection‐related tables (for the particular Part C chapter) that incorporates default values from Part C of the HSM and the functionality to provide locally‐derived values for use with the spreadsheet.
Segment Tables ‐ Worksheet with intersection‐related tables (for the particular Part C chapter) that incorporates default values from Part C of the HSM and the functionality to provide locally‐derived values for use with the spreadsheet.
Intersection 1, Segment 1, etc. – Part C worksheet sets 1 and 2 for calculating the predicted average crash frequency for the particular project element across different severity levels.
Site Total – Analysis for site‐specific EB analysis using results from the intersection and segment worksheets (predicted average crash frequency for each of the project elements). This analysis requires observed crash history (in annual average values) for each segment and intersection in the project. The associated HSM worksheets are 3A and 3B.
Project Total – Analysis for project‐specific EB analysis using results from the intersection and segment worksheets. This analysis allows the user to use a project‐wide EB analysis using a combined observed crash history across all project elements (only recommended for locations where the historic crash data cannot be summarized by segment and intersection). The associated HSM worksheets are Worksheets 4A and 4B.
Construction – A sheet with tables that allow for pull‐down menus in the analysis of the HSM worksheets.
INTENT AND FUNCTIONALITY OF THE EXTENDED SPREADSHEETS
3 EXTENDED HSM SPREADSHEETS V.3 - Data, analyses, studies, or training associated with, or findings and documents produced by this software are based on information compiled or collected
pursuant to 23 U.S.C. §§130 and 148 and other federal safety programs and are exempt from discovery or admission under 23 U.S.C. §§ 402 and 409.
Intent and Functionality of the Extended Spreadsheets Intent of the Extended Spreadsheets The intent of the extended spreadsheets is to: automate the manipulation needed in the original spreadsheets; add standard reports that present results in tabular, graphical and text formats; and add multi‐year analysis all without creating a stand‐alone software tool where the user enters information and the results are presented as an automated process. By having access to the individual project element worksheets, the analyst is able to identify how CMFs change with changes to project elements along with changes in predicted and expected crash frequencies. This allows for the development of a greater understanding during the training process and ease of use for testing the impact of adjustments to cross section characteristics or signalization on anticipated safety performance. The extended spreadsheets include an additional worksheet, the Report worksheet, that summarizes analysis results for reports and further reduces the time associated with processing analysis results.
Functionality of the Extended Spreadsheets The extended HSM spreadsheets build upon the original HSM spreadsheets developed by Dr. Dixon. Functionality was added to the extended spreadsheets using macros within Microsoft Excel 2007. The list below presents the changes made to the original spreadsheets (modification to existing worksheets, changes in process, and addition of worksheets and functionality). Note that there are still three separate spreadsheets, one for each chapter in Part C of the HSM: Chapter 10 for two‐lane two‐way rural highways, Chapter 11 for rural multilane highways and Chapter 12 for urban and suburban arterials.
The user starts the analysis on a Project Information worksheet. a) First the user enters all the general project information (the spreadsheet macros automatically completes
this information on each of the project element worksheets, the Site Total worksheet, and the Report worksheet).
b) Second the user identifies the following elements in the project analysis: ‐ the number of segments in the project, ‐ the number of intersections in the project, ‐ whether a multiyear analysis will be performed (yes/no), and ‐ whether the analysis includes the calculation of the predicted average crash frequency or both the
predicted and expected average crash frequency. c) A macro (push button) then uses information in (b) to automatically generate a table of project elements.
d) The user completes information for each of the project elements (basic location information) and indicates whether the intersections (if there are any) are signalized or unsignalized
e) A macro (push button) then uses information from (d) to automatically generate a worksheet for each project element.
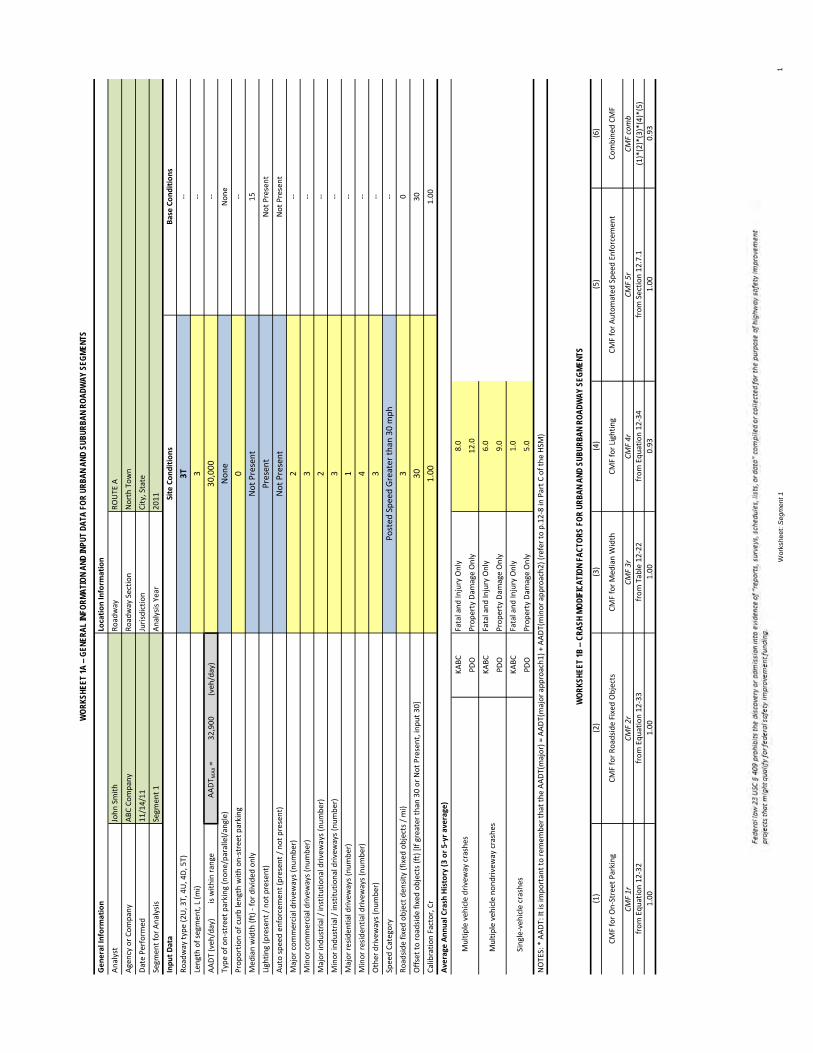
Worksheet Table 1A for each project element a) The user enters observed crash history by severity and collision type (where applicable for the particular
chapter and analysis goals) on Worksheet Table 1A for each project element using project‐element specific information.
b) Table 1A is used to collect project element‐specific conditions for calculating the predicted average crash frequency. The table consists of three columns: description, base conditions and site conditions. The user enters element‐specific information in the site conditions column. The table is wide: to view the full table the user typically has to either zoom out to view the entire table (which would render the text unreadable) or scroll to the right (the description column is no longer visible). Table 1A was modified,
INTENT AND FUNCTIONALITY OF THE EXTENDED SPREADSHEETS
4 EXTENDED HSM SPREADSHEETS V.3 - Data, analyses, studies, or training associated with, or findings and documents produced by this software are based on information compiled
or collected pursuant to 23 U.S.C. §§130 and 148 and other federal safety programs and are exempt from discovery or admission under 23 U.S.C. §§ 402 and 409.
presenting the description first, then site conditions and lastly the base conditions: allowing the user to view the description and the site conditions columns on the same screen without scrolling.
c) The worksheet contains various additional features to prevent common input errors. For example, it prevents the user from entering information for a STOP controlled intersection when a signalized intersection is being analyzed (and vice versa); the worksheet also limits the selection of approaches for signalization etc. to the total number of legs of the intersection, etc.
d) In the Urban Arterial Intersection worksheet (Chapter 12), ‐ The user selects whether pedestrian volumes are known or estimated (after selecting the intersection
type). When the user selects known, the user can enter an actual numeric value, otherwise, the user will be presented with a drop‐down menu that represents the default values presented in the HSM.
‐ The number of bus stops and alcohol sales establishments are presented in a drop down menu consistent with the tables in the HSM.
After the user has completed all the individual worksheets for each of the elements in a project, a push button activates a macro that automatically generates the Site Total and Report worksheets. a) In the original set of spreadsheets the Site Total worksheet was set up for a project with two segments
and two intersections. If a project had a different number and combination of project elements, the user had to manipulate the Site Total worksheet (create physical linkages between the Site Total worksheet rows for each project element). This manipulation was time consuming and the risk of errors in the analysis is high. The expanded set of spreadsheets automatically generates a Site Total worksheet where project element information (including observed crash history) is already linked, i.e. no user manipulation is necessary.
b) The spreadsheets only provide for a Site Total analysis – crash data are available by segment and intersection for most states. The Project Total worksheet was a common cause of confusion among users and is no longer included in the set of spreadsheets.
c) Worksheet 3C of Chapter 12 (Urban and Suburban Arterials) was modified to support improved user understanding. The changes were driven by user questions and concerns.
d) A Report worksheet summarizes results from each of the project element worksheets, as well as the Site Total worksheet in tabular, graphical and text format. The Report worksheet is a new addition to the set of spreadsheets and is not included in the HSM.
e) The Report worksheet does not require any input from the user. All of the content Is automatically generated.
If the user has selected to perform a multi‐year analysis on the Project Information worksheet, a worksheet titled Multi‐year Analysis Inputs will automatically be generated once the Project Information worksheet is completed. The user enters the base year for the analysis (same as the analysis year entered on the Project Information sheet), the anticipated traffic growth, and the number of years for the analysis. A macro (activated with a push button) will perform the multiyear analysis and automatically generate an additional worksheet: the Multi‐Year Analysis Report worksheet (similar in format to the Report worksheet).
The Intersection Tables, Segment Tables, and Construction worksheets are hidden (the user can unhide them if needed; and local values can be inserted into the intersection tables and segment tables once available).
Once the analysis is completed, none of the macros can be re‐used. Changes to the individual project element worksheet input tables will automatically update the Site Total worksheet and the Report worksheet. The multi‐year analysis will not update and cannot be re‐generated.
The following sections provide a more detailed description of the steps involved in performing a predicted analysis in the HSM using the extended HSM training spreadsheets. The description includes tips and detailed information for the various processes.
USER INSTRUCTIONS
5 EXTENDED HSM SPREADSHEETS V.3 - Data, analyses, studies, or training associated with, or findings and documents produced by this software are based on information compiled or collected
pursuant to 23 U.S.C. §§130 and 148 and other federal safety programs and are exempt from discovery or admission under 23 U.S.C. §§ 402 and 409.
User Instructions Color Legend
Required user input data
Required user input data restricted to dropdown values
Automatically updated information based on previous user input data
User work space (notes, comments, etc.)
Basic Steps Task 1. Create a Project File.
Task 2. Enter the project information on the Project Information worksheet and select analysis options: multi‐year analysis, and calculation of the predicted and/or expected average crash frequencies.
Task 3. Complete the element table on the Project Information worksheet.
Task 4. Enter the required information for each element (worksheets presented for each segment and intersection in the project).
Task 5. Generate the EB analysis results and analysis report for predictive analysis (predicted average crash frequency and expected average crash frequency if applicable).
Task 6. Review analysis report and the discussion of results.
If applicable:
Task 7. Enter multi‐year analysis information.
Task 8. Generate and review multi‐year report.
USER INSTRUCTIONS
6 EXTENDED HSM SPREADSHEETS V.3 - Data, analyses, studies, or training associated with, or findings and documents produced by this software are based on information compiled
or collected pursuant to 23 U.S.C. §§130 and 148 and other federal safety programs and are exempt from discovery or admission under 23 U.S.C. §§ 402 and 409.
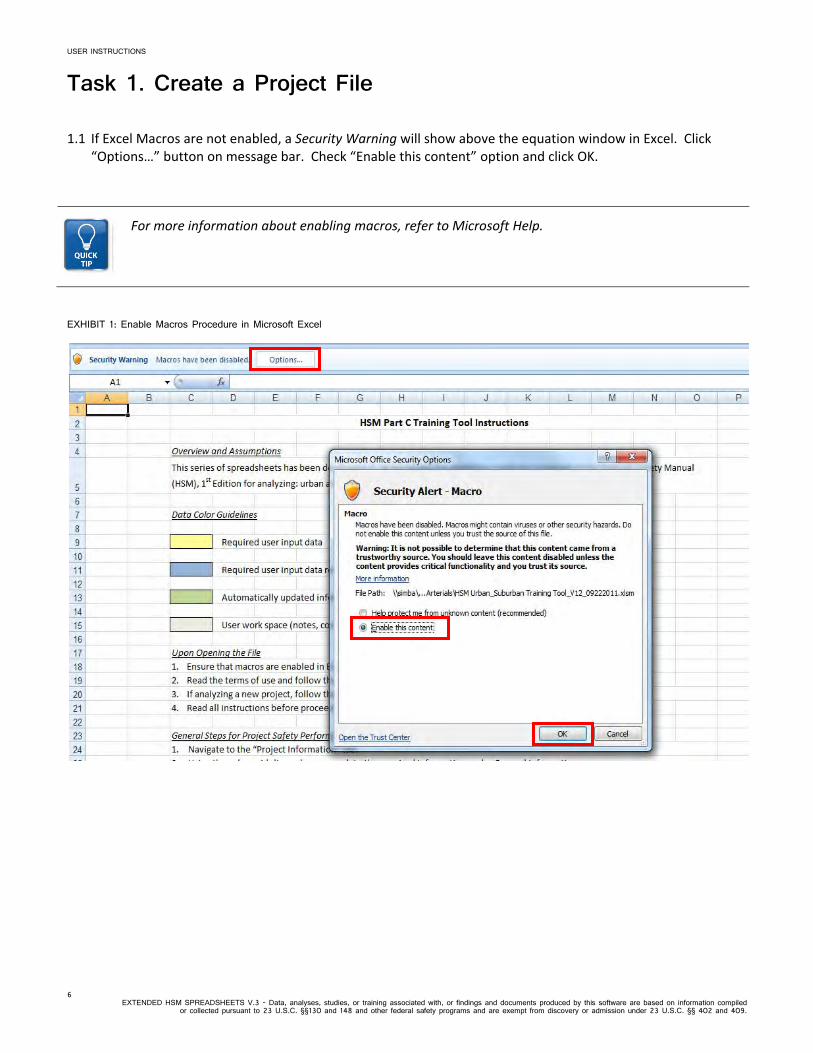
Task 1. Create a Project File
1.1 If Excel Macros are not enabled, a Security Warning will show above the equation window in Excel. Click “Options…” button on message bar. Check “Enable this content” option and click OK.
For more information about enabling macros, refer to Microsoft Help.
EXHIBIT 1: Enable Macros Procedure in Microsoft Excel
USER INSTRUCTIONS
7 EXTENDED HSM SPREADSHEETS V.3 - Data, analyses, studies, or training associated with, or findings and documents produced by this software are based on information compiled or collected
pursuant to 23 U.S.C. §§130 and 148 and other federal safety programs and are exempt from discovery or admission under 23 U.S.C. §§ 402 and 409.
1.2 Read the terms of use, confidential information, and acknowledgements. Check the box if you understand and agree and click OK. If the user does not agree to the terms of use the user will not be able to use the spreadsheets.
EXHIBIT 2: Extended Spreadsheet Disclaimer
1.3 The spreadsheet then presents a Save As? prompt. If you are starting a new project, select Yes and save the file as a new project file. If you are opening an existing analysis that was completed, select No.
EXHIBIT 3: Save Spreadsheet As Prompt
1.4 The spreadsheet opens on the Instructions worksheet. Please read all instructions before proceeding.
The extended spreadsheets use various macros – these macros can only be executed once. In other words, once you have clicked on any button the macro will no longer perform the function as intended and likely to result in run‐time errors.
USER INSTRUCTIONS
8 EXTENDED HSM SPREADSHEETS V.3 - Data, analyses, studies, or training associated with, or findings and documents produced by this software are based on information compiled
or collected pursuant to 23 U.S.C. §§130 and 148 and other federal safety programs and are exempt from discovery or admission under 23 U.S.C. §§ 402 and 409.
Task 2. Enter Project Information 2.1 Navigate to the Project Information worksheet.
2.2 Complete the General Information Table on the Project Information worksheet.
Consult the color guidelines for information regarding the different types of inputs required. Be sure to enter the desired number of segments and intersections as well as select the appropriate option from the multiple year analysis and predicted/expected crashes drop downs. This information (except for the drop downs) can be changed at any time and will update automatically.
EXHIBIT 4: General Information Inputs on the Project Information Sheet
2.3 Click the “Update Element Table” button to populate the Element Table on the Project Information worksheet.
Note that once this button is clicked, NO NEW SEGMENTS OR INTERSECTIONS CAN BE ADDED TO THE ANALYSIS. The button will be disabled and the table cannot be updated again.
EXHIBIT 5: Update Element Table Button and Element Table on the Project Information Sheet
USER INSTRUCTIONS
9 EXTENDED HSM SPREADSHEETS V.3 - Data, analyses, studies, or training associated with, or findings and documents produced by this software are based on information compiled or collected
pursuant to 23 U.S.C. §§130 and 148 and other federal safety programs and are exempt from discovery or admission under 23 U.S.C. §§ 402 and 409.
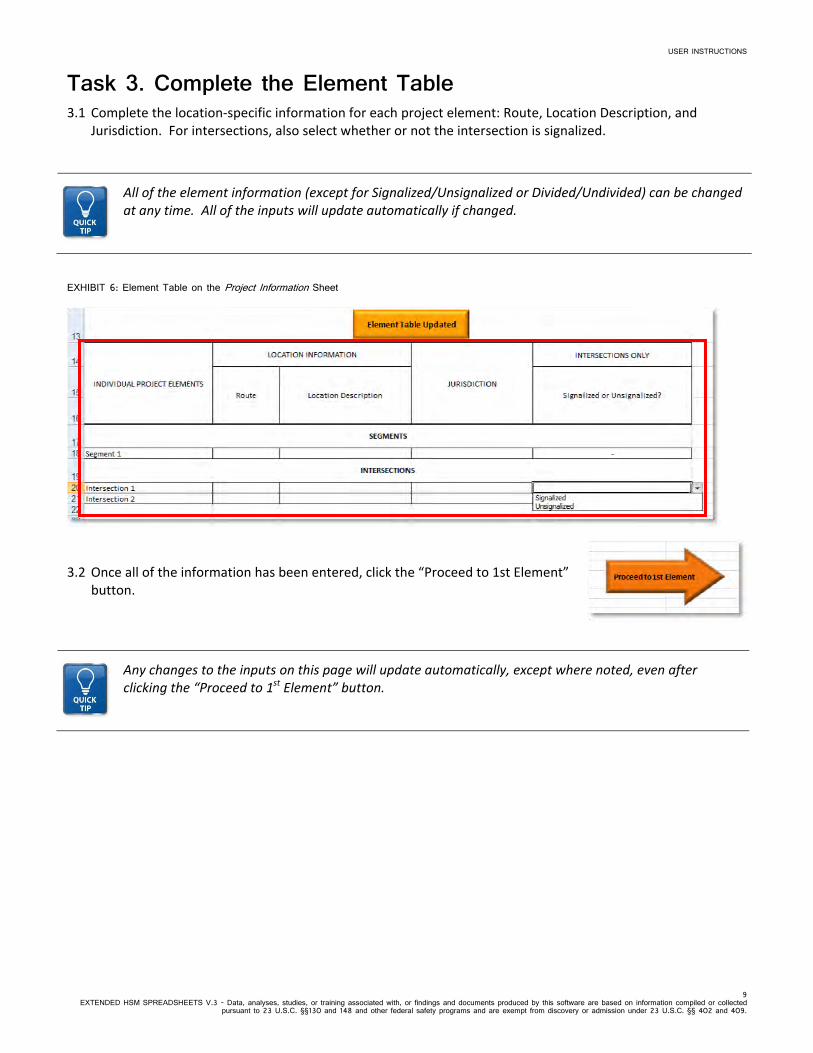
Task 3. Complete the Element Table 3.1 Complete the location‐specific information for each project element: Route, Location Description, and
Jurisdiction. For intersections, also select whether or not the intersection is signalized.
All of the element information (except for Signalized/Unsignalized or Divided/Undivided) can be changed at any time. All of the inputs will update automatically if changed.
EXHIBIT 6: Element Table on the Project Information Sheet
3.2 Once all of the information has been entered, click the “Proceed to 1st Element” button.
Any changes to the inputs on this page will update automatically, except where noted, even after clicking the “Proceed to 1st Element” button.
USER
INST
RUCT
IONS
10
EX
TEND
ED H
SM S
PREA
DSHE
ETS
V.3
- Data
, ana
lyses
, stud
ies, o
r tra
ining
ass
ociat
ed w
ith, o
r find
ings
and
docu
ments
pro
duce
d by
this
softw
are
are
base
d on
infor
matio
n co
mpile
d or
coll
ected
pur
suan
t to
23 U
.S.C
. §§1
30 a
nd 1
48 a
nd o
ther f
eder
al sa
fety
prog
rams
and
are
exe
mpt f
rom
disco
very
or a
dmiss
ion u
nder
23
U.S.
C. §
§ 40
2 an
d 40
9.
EXHI
BIT
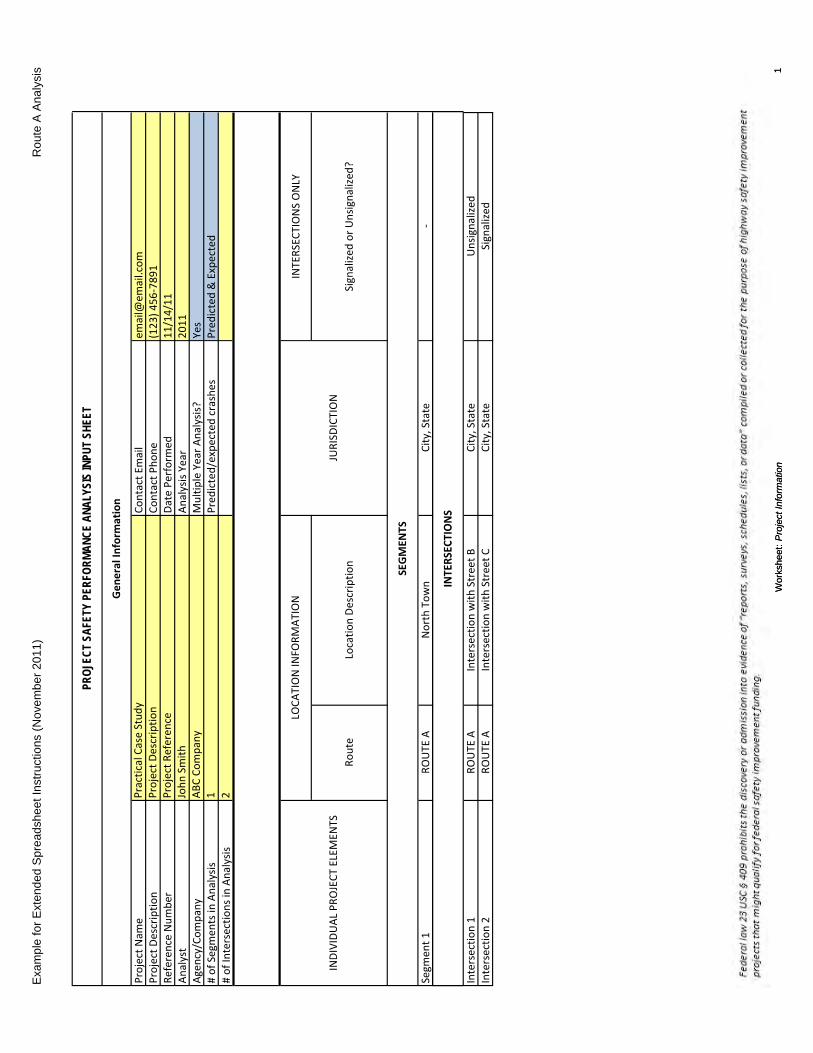
7: E
xamp
le of
comp
leted
Proj
ect S
afety
Perfo
rman
ce A
nalys
is Inp
ut Sh
eet
USER INSTRUCTIONS
11 EXTENDED HSM SPREADSHEETS V.3 - Data, analyses, studies, or training associated with, or findings and documents produced by this software are based on information compiled or collected
pursuant to 23 U.S.C. §§130 and 148 and other federal safety programs and are exempt from discovery or admission under 23 U.S.C. §§ 402 and 409.
Task 4. Enter Required Information on Each Element Tab
4.1 On the current tab (either “Segment 1” or “Intersection 1”), enter all of the required information.
Project information will update automatically. Required inputs vary depending on the type of project (i.e. Urban/Suburban Arterial, Rural 2‐Lane Road, Rural Multilane Road). An example of an urban segment is shown. Element tabs may be for segments and/or intersections, depending on the project.
EXHIBIT 8: Example Element Input Table (e.g. Segment 1) – Worksheet 1A
4.2 Review the table to confirm that all necessary information has been entered, then click the “Next Element” button. This includes Site Conditions and the Average Annual Crash History (3‐ or 5‐year average).
All element inputs can be changed after this button is pushed. They will be updated automatically. For intersections, not all site conditions will apply to every intersection, depending on whether or not the intersection is signalized.
4.3 Repeat Steps 6 and 7 for all project elements (segments and intersections).
Each SPF was developed for a particular volume range. Refer to the HSM Part C (the TRB Highway Safety Performance Committee developed a quick reference for Part C that may be useful as well). The individual element worksheet will not perform the analysis if the volume threshold is exceeded.
USER INSTRUCTIONS
12 EXTENDED HSM SPREADSHEETS V.3 - Data, analyses, studies, or training associated with, or findings and documents produced by this software are based on information compiled
or collected pursuant to 23 U.S.C. §§130 and 148 and other federal safety programs and are exempt from discovery or admission under 23 U.S.C. §§ 402 and 409.
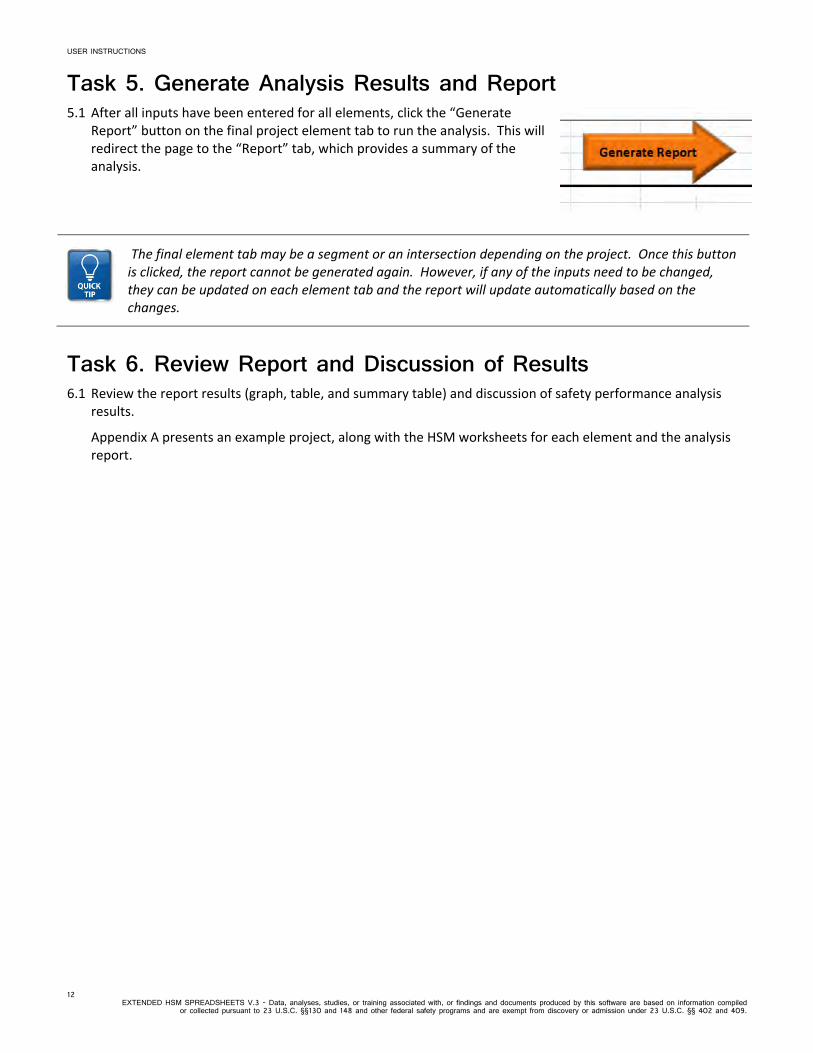
Task 5. Generate Analysis Results and Report 5.1 After all inputs have been entered for all elements, click the “Generate
Report” button on the final project element tab to run the analysis. This will redirect the page to the “Report” tab, which provides a summary of the analysis.
The final element tab may be a segment or an intersection depending on the project. Once this button is clicked, the report cannot be generated again. However, if any of the inputs need to be changed, they can be updated on each element tab and the report will update automatically based on the changes.
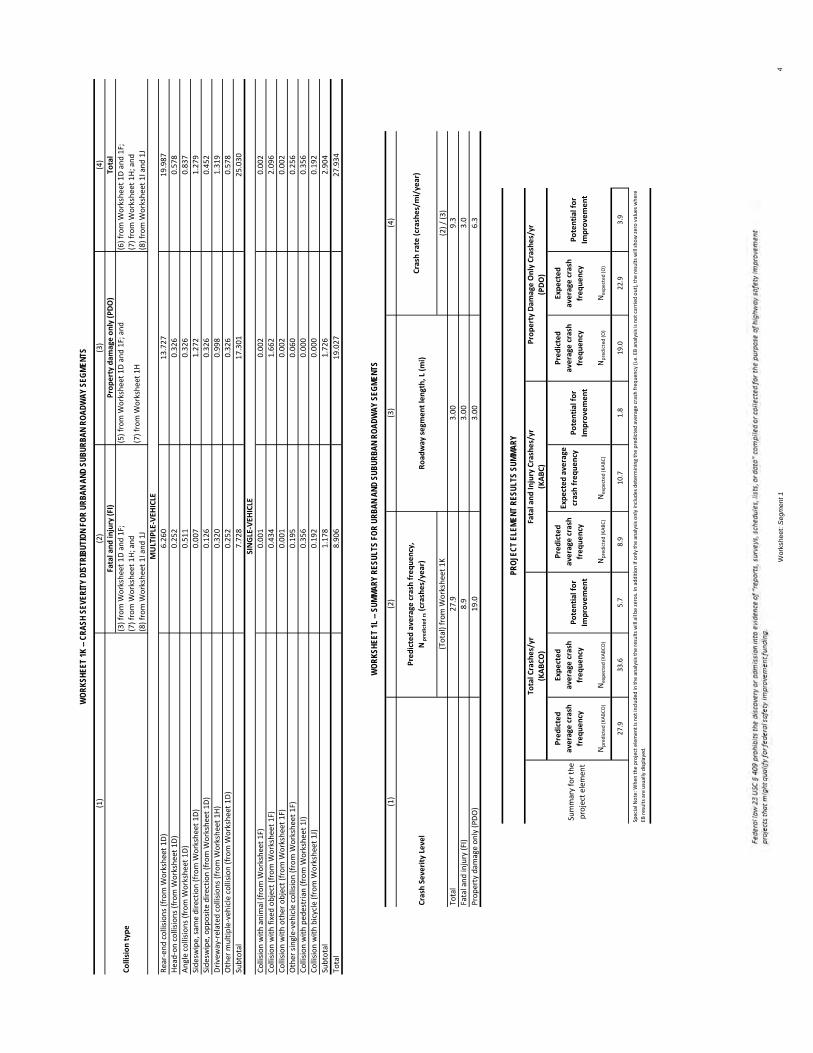
Task 6. Review Report and Discussion of Results 6.1 Review the report results (graph, table, and summary table) and discussion of safety performance analysis
results.
Appendix A presents an example project, along with the HSM worksheets for each element and the analysis report.
USER INSTRUCTIONS
13 EXTENDED HSM SPREADSHEETS V.3 - Data, analyses, studies, or training associated with, or findings and documents produced by this software are based on information compiled or collected
pursuant to 23 U.S.C. §§130 and 148 and other federal safety programs and are exempt from discovery or admission under 23 U.S.C. §§ 402 and 409.
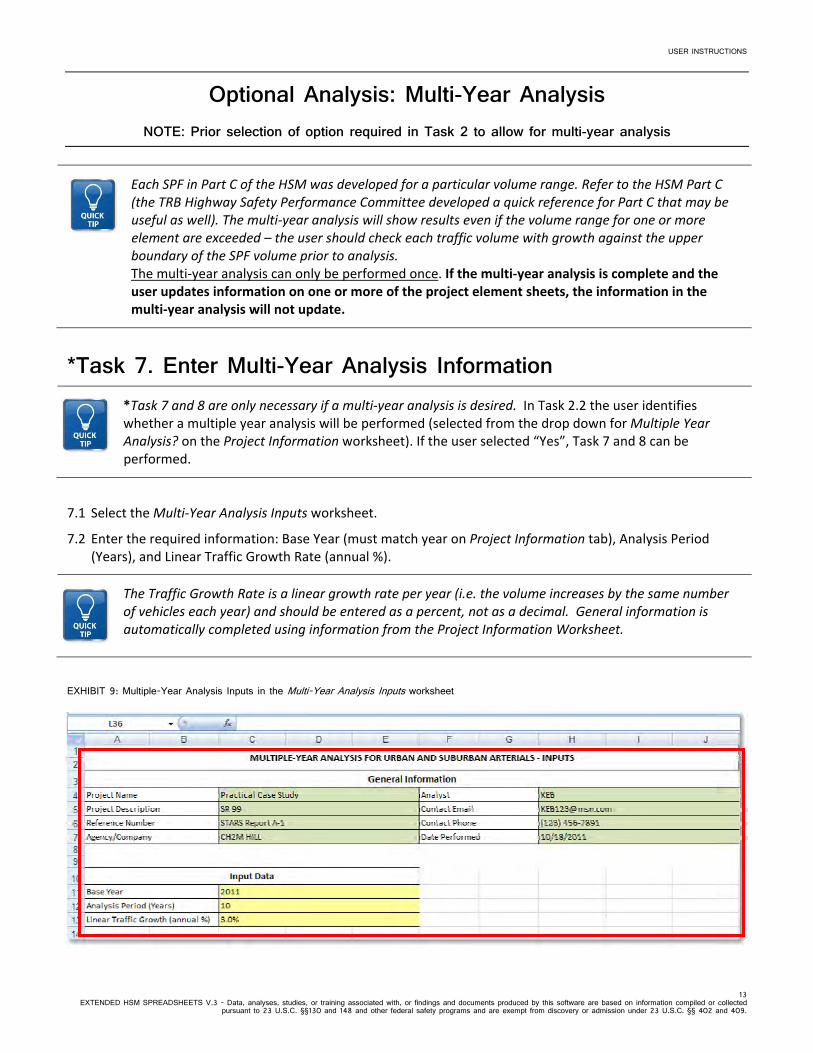
Optional Analysis: Multi-Year Analysis NOTE: Prior selection of option required in Task 2 to allow for multi-year analysis
Each SPF in Part C of the HSM was developed for a particular volume range. Refer to the HSM Part C (the TRB Highway Safety Performance Committee developed a quick reference for Part C that may be useful as well). The multi‐year analysis will show results even if the volume range for one or more element are exceeded – the user should check each traffic volume with growth against the upper boundary of the SPF volume prior to analysis. The multi‐year analysis can only be performed once. If the multi‐year analysis is complete and the user updates information on one or more of the project element sheets, the information in the multi‐year analysis will not update.
*Task 7. Enter Multi-Year Analysis Information *Task 7 and 8 are only necessary if a multi‐year analysis is desired. In Task 2.2 the user identifies whether a multiple year analysis will be performed (selected from the drop down for Multiple Year Analysis? on the Project Information worksheet). If the user selected “Yes”, Task 7 and 8 can be performed.
7.1 Select the Multi‐Year Analysis Inputs worksheet.
7.2 Enter the required information: Base Year (must match year on Project Information tab), Analysis Period (Years), and Linear Traffic Growth Rate (annual %).
EXHIBIT 9: Multiple-Year Analysis Inputs in the Multi-Year Analysis Inputs worksheet
The Traffic Growth Rate is a linear growth rate per year (i.e. the volume increases by the same number of vehicles each year) and should be entered as a percent, not as a decimal. General information is automatically completed using information from the Project Information Worksheet.
USER INSTRUCTIONS
14 EXTENDED HSM SPREADSHEETS V.3 - Data, analyses, studies, or training associated with, or findings and documents produced by this software are based on information compiled
or collected pursuant to 23 U.S.C. §§130 and 148 and other federal safety programs and are exempt from discovery or admission under 23 U.S.C. §§ 402 and 409.
*Task 8. Generate and Review Multi-Year Report and Discussion
*Task 7 and 8 are only necessary if a multi‐year analysis is desired. In Task 2.2 the user identifies whether a multiple year analysis will be performed (selected from the drop down for Multiple Year Analysis? on the Project Information worksheet). If the user selected “Yes”, Task 7 and 8 can be performed.
8.1 Once all of the information is complete, click the “Run Multi‐Year Analysis” button to perform the analysis.
8.2 Review the multi‐year summary report and discussion of the multi‐year safety performance analysis results.
15 EXTENDED HSM SPREADSHEETS V.3 - Data, analyses, studies, or training associated with, or findings and documents produced by this software are based on information compiled or collected pursuant to 23 U.S.C. §§130 and 148 and other federal safety programs and are exempt from discovery or admission under 23 U.S.C. §§ 402 and 409.
Appendix A: Example of Output from the Extended Spreadsheets
APPENDIX A: EXAMPLE OF OUTPUT FROM EXTENDED SPREADSHEETS
EXTENDED HSM SPREADSHEETS V.3 - Data, analyses, studies, or training associated with, or findings and documents produced by this software are based on information compiled
or collected pursuant to 23 U.S.C. §§130 and 148 and other federal safety programs and are exempt from discovery or admission under 23 U.S.C. §§ 402 and 409.
APPENDIX A: EXAMPLE OF OUTPUT FROM EXTENDED SPREADSHEETS
EXTENDED HSM SPREADSHEETS V.3 - Data, analyses, studies, or training associated with, or findings and documents produced by, this software are based on information compiled or collected pursuant to 23 U.S.C. §§130 and 148 and other federal safety programs and are exempt from discovery or admission under 23 U.S.C. §§ 402 and 409.
Project Information Sheet
APPENDIX A: EXAMPLE OF OUTPUT FROM EXTENDED SPREADSHEETS
EXTENDED HSM SPREADSHEETS V.3 - Data, analyses, studies, or training associated with, or findings and documents produced by this software are based on information compiled
or collected pursuant to 23 U.S.C. §§130 and 148 and other federal safety programs and are exempt from discovery or admission under 23 U.S.C. §§ 402 and 409.
Exa
mpl
e fo
r E
xten
ded
Spr
eads
heet
Inst
ruct
ions
(N
ovem
ber
2011
)R
oute
A A
naly
sis
Project Nam
eContact Email
email@
email.com
Project Description
Contact Phone
(123) 456‐7891
Referen
ce Number
Date Perform
ed11/14/11
Analyst
Analysis Year
2011
Agency/Company
Multiple Year Analysis?
Yes
# of Segm
ents in
Analysis
Predicted/expected crashes
Predicted & Expected
# of Intersections in Analysis
INTERSECTIONS ONLY
Segm
ent 1
ROUTE A
North Town
City, State
‐
Project Description
Practical Case Study
21ABC Company
John Smith
Project Referen
ce
INTERSECTIONS
SEGMEN
TS
PROJ
ECT
SAFE
TY P
ERFO
RMAN
CE A
NALY
SIS
INPU
T SH
EET
General Inform
ation
Route
Location Description
Signalized
or Unsignalized
?
LOCATION IN
FORMATION
INDIVIDUAL PROJECT ELEM
ENTS
JURISDICTION
Wor
kshe
et:
Pro
ject
Info
rmat
ion
1
Intersection 1
ROUTE A
Intersection with Street B
City, State
Unsignalized
Intersection 2
ROUTE A
Intersection with Street C
City, State
Signalized
INTERSECTIONS
Wor
kshe
et:
Pro
ject
Info
rmat
ion
1
APPENDIX A: EXAMPLE OF OUTPUT FROM EXTENDED SPREADSHEETS
EXTENDED HSM SPREADSHEETS V.3 - Data, analyses, studies, or training associated with, or findings and documents produced by this software are based on information compiled
or collected pursuant to 23 U.S.C. §§130 and 148 and other federal safety programs and are exempt from discovery or admission under 23 U.S.C. §§ 402 and 409.
APPENDIX A: EXAMPLE OF OUTPUT FROM EXTENDED SPREADSHEETS
EXTENDED HSM SPREADSHEETS V.3 - Data, analyses, studies, or training associated with, or findings and documents produced by, this software are based on information compiled or collected pursuant to 23 U.S.C. §§130 and 148 and other federal safety programs and are exempt from discovery or admission under 23 U.S.C. §§ 402 and 409.
Segment 1
APPENDIX A: EXAMPLE OF OUTPUT FROM EXTENDED SPREADSHEETS
EXTENDED HSM SPREADSHEETS V.3 - Data, analyses, studies, or training associated with, or findings and documents produced by this software are based on information compiled
or collected pursuant to 23 U.S.C. §§130 and 148 and other federal safety programs and are exempt from discovery or admission under 23 U.S.C. §§ 402 and 409.
AADT (veh
/day)
is within range
AADT M
AX =
32,900
(veh
/day)
General Inform
ation
Location In
form
ation
Analyst
John Smith
Roadway
ROUTE
A
Agency or Company
ABC Company
Roadway Section
North Town
Date Perform
ed11/14/11
Jurisdiction
City, State
WOR
KSHE
ET 1A
-- G
ENER
AL IN
FORM
ATIO
N AN
D IN
PUT
DATA
FOR
URB
AN A
ND S
UBUR
BAN
ROAD
WAY
SEG
MENT
S
Roadway type (2U, 3T, 4U, 4D, 5T)
3T
‐‐
Length of segm
ent, L (mi)
3‐‐
Segm
ent for Analysis
Segm
ent 1
Analysis Year
2011
Input Data
Site Conditions
Base Conditions
Med
ian width (ft) ‐ for divided
only
Not Present
15
Lighting (present / not present)
Present
Not Present
30,000
‐‐
Type of on‐street parking (none/parallel/angle)
None
None
Proportion of curb length with on‐street parking
0‐‐
Minor commercial driveways (number)
3‐‐
Major industrial / institutional driveways (number)
2‐‐
Auto speed enforcem
ent (present / not present)
Not Present
Not Present
Major commercial driveways (number)
2‐‐
Minor residen
tial driveways (number)
4‐‐
Other driveways (number)
3‐‐
Minor industrial / institutional driveways (number)
3‐‐
Major residen
tial driveways (number)
1‐‐
Offset to roadside fixed objects (ft) [If greater than
30 or Not Present, input 30]
30
30
Calibration Factor, Cr
1.00
1.00
Speed Category
Posted
Speed Greater than
30 m
ph
‐‐
Roadside fixed object den
sity (fixed objects / mi)
30
Average
Annual Crash History (3 or 5‐yr average)
KABC
PDO
KABC
PDO
KABC
PDO
NOTES: * AADT: It is im
portant to rem
ember that the AADT(major) = AADT(major approach1) + AADT(minor approach2) (refer to p.12‐8 in
Part C of the HSM
)
M
ultiple veh
icle driveway crashes
Fatal and Injury Only
8.0
Property Dam
age Only
12.0
M
ultiple veh
icle nondriveway crashes
Fatal and Injury Only
6.0
WOR
KSHE
ET 1B
-- C
RASH
MOD
IFIC
ATIO
N FA
CTOR
S FO
R UR
BAN
AND
SUBU
RBAN
ROA
DWAY
SEG
MENT
S
(1)
(2)
(3)
(4)
(5)
(6)
Property Dam
age Only
9.0
Single‐vehicle crashes
Fatal and Injury Only
1.0
Property Dam
age Only
5.0
CMF 1r
CMF 2r
CMF 3r
CMF 4r
CMF 5r
CMF comb
CMF for On‐Street Parking
CMF for Roadside Fixed Objects
CMF for Med
ian W
idth
CMF for Lighting
CMF for Automated
Speed Enforcem
ent
Combined
CMF
1.00
1.00
1.00
0.93
1.00
0.93
from Equation 12‐32
from Equation 12‐33
from Table 12‐22
from Equation 12‐34
from Section 12.7.1
(1)*(2)*(3)*(4)*(5)
Wo
rksh
eet:
Seg
men
t 1
1
(6)
(7)
(8)
(9)
ab
‐12.40
1.41
25.387
0.93
1.00
23.711
(6)
(7)
(8)
(9)
Crash Severity Level
SPF Coefficients
Overdispersion Param
eter, k
Initial N
brm
v
Proportion of To
tal Crashes
Adjusted N
brm
v
WOR
KSHE
ET 1C
-- M
ULTI
PLE-
VEHI
CLE
NOND
RIVE
WAY
COL
LISI
ONS
BY S
EVER
ITY
LEVE
L FO
R UR
BAN
AND
SUBU
RBAN
ROA
DWAY
SEG
MENT
S
(1)
(2)
(3)
(4)
(5)
Combined CMFs
Calibration
Factor, Cr
Predicted
Nbrm
v
from Table 12‐3
from Table 12‐3
from Equation 12‐10
(4) TOTA
L*(5)
(6) from
Worksheet 1B
(6)*(7)*(8)
Total
0.66
25.387
1.000
Fatal and Injury (FI)
‐16.45
1.69
0.59
7.931
(4) FI/((4) FI+(4) PDO)
7.932
0.93
1.00
7.408
0.312
Property Dam
age Only (PDO)
‐11.95
1.33
0.59
17.453
WOR
KSHE
ET 1D
-- M
ULTI
PLE-
VEHI
CLE
NOND
RIVE
WAY
COL
LISI
ONS
BY C
OLLI
SION
TYP
E FO
R UR
BAN
AND
SUBU
RBAN
ROA
DWAY
SEG
MENT
S
(1)
(2)
(3)
(4)
(5)
(6)
(5) TOTA
L‐(5) FI
17.455
0.93
1.00
16.303
0.688
(2)*(3) FI
(4)*(5) PDO
(3)+(5)
(9)TOTAL from W
orksheet 1C
Total
1.000
7.408
1.000
16.303
23.711
Collision Type
Proportion of Collision Type(FI)
Predicted N brm
v (FI) (crashes/year)
Proportion of Collision Type (P
DO)
Predicted N brm
v (PDO) (crashes/year)
Predicted N brm
v (TO
TAL) (crashes/year)
from Table 12‐4
(9)FI from W
orksheet 1C
from Table 12‐4
(9)P
DO from W
orksheet 1C
Head‐on collision
0.034
0.252
0.020
0.326
0.578
Rear‐en
d collision
0.845
6.260
0.842
13.727
19.987
Sideswipe, sam
e direction
0.001
0.007
0.078
1.272
1.279
Angle collision
0.069
0.511
0.020
0.326
0.837
Other m
ultiple‐veh
icle collision
0.034
0.252
0.020
0.326
0.578
Sideswipe, opposite direction
0.017
0.126
0.020
0.326
0.452
WOR
KSHE
ET 1E
-- S
INGL
E-VE
HICL
E CO
LLIS
IONS
BY
SEVE
RITY
LEV
EL F
OR U
RBAN
AND
SUB
URBA
N RO
ADW
AY S
EGME
NTS
(1)
(2)
(3)
(4)
(5)
(6)
(7)
(8)
(9)
ab
‐5.74
0.54
2.523
0.93
1.00
2.356
Crash Severity Level
SPF Coefficients
Overdispersion Param
eter, k
Initial N
brsv
Proportion of To
tal Crashes
Adjusted N
brsv
(1)
(2)
(3)
(4)
(5)
Combined CMFs
Calibration
Factor, Cr
Predicted
Nbrsv
from Table 12‐5
from Table 12‐5
from Equation 12‐13
(4) TOTA
L*(5)
(6) from
Worksheet 1B
(6)*(7)*(8)
Total
1.37
2.523
1.000
Fatal and Injury (FI)
‐6.37
0.47
1.06
0.653
(4) FI/((4) FI+(4) PDO)
0.675
0.93
1.00
0.630
0.267
Property Dam
age Only (PDO)
‐6.29
0.56
1.93
1.789
WOR
KSHE
ET 1F
-- S
INGL
E-VE
HICL
E CO
LLIS
IONS
BY
COLL
ISIO
N TY
PE F
OR U
RBAN
AND
SUB
URBA
N RO
ADW
AY S
EGME
NTS
(1)
(2)
(3)
(4)
(5)
(6)
(5) TOTA
L‐(5) FI
1.848
0.93
1.00
1.726
0.733
(2)*(3) FI
(4)*(5) PDO
(3)+(5)
(9)TOTAL from W
orksheet 1E
Total
1.000
0.630
1.000
1.726
2.356
Collision Type
Proportion of Collision Type(FI)
Predicted N brsv (FI) (crashes/year)
Proportion of Collision Type (P
DO)
Predicted N brsv (PDO) (crashes/year)
Predicted N brsv (TO
TAL) (crashes/year)
from Table 12‐6
(9)FI from W
orksheet 1E
from Table 12‐6
(9)P
DO from W
orksheet 1E
Collision with fixed
object
0.688
0.434
0.963
1.662
2.096
Collision with anim
al0.001
0.001
0.001
0.002
0.002
Other single‐vehicle collision
0.310
0.195
0.035
0.060
0.256
Collision with other object
0.001
0.001
0.001
0.002
0.002
Wo
rksh
eet:
Seg
men
t 1
2
(4)
1.412
0.343
1.069
(6)
(7)
fd
Overdispersion param
eter, k
from Table 12‐7
from Table 12‐7
Equation 12‐16
from Table 12‐7
WOR
KSHE
ET 1G
-- M
ULTI
PLE-
VEHI
CLE
DRIV
EWAY
-REL
ATED
COL
LISI
ONS
BY D
RIVE
WAY
TYP
E FO
R UR
BAN
AND
SUBU
RBAN
ROA
DWAY
SEG
MENT
S
(1)
(2)
(3)
(4)
(5)
(6)
nj * N
j * (AADT/15,000)t
Major commercial
20.102
1.000
0.408
Driveway Type
Number of driveways, nj
Crashes per driveway per year, N
jCoefficient for traffic ad
justment, t
Initial N
brdwy
0.440
Minor industrial/institutional
30.015
1.000
0.090
‐‐
Minor commercial
30.032
1.000
0.192
Major industrial/institutional
20.110
1.000
Major residen
tial
10.053
1.000
0.106
Minor residen
tial
40.010
1.000
0.080
1.10
WOR
KSHE
ET 1H
-- M
ULTI
PLE-
VEHI
CLE
DRIV
EWAY
-REL
ATED
COL
LISI
ONS
BY S
EVER
ITY
LEVE
L FO
R UR
BAN
AND
SUBU
RBAN
ROA
DWAY
SEG
MENT
S
(1)
(2)
(3)
(5)
(6)
(7)
Other
30.016
1.000
0.096
Total
‐‐‐‐
‐‐1.412
Predicted N
brdwy
(5) TOTA
L from W
orksheet 1G
from Table 12‐7
(2) TOTA
L * (3)
(6) from W
orksheet 1B
(4)*(5)*(6)
Crash Severity Level
Initial N
brdwy
Proportion of total crashes (fdwy)
Adjusted N
brdwy
Combined CMFs
Calibration factor, C
r
Fatal and injury (FI)
‐‐0.243
0.93
1.00
0.320
Total
1.412
1.000
0.93
1.00
1.319
WOR
KSHE
ET 1I
-- V
EHIC
LE-P
EDES
TRIA
N CO
LLIS
IONS
FOR
URB
AN A
ND S
UBUR
BAN
ROAD
WAY
SEG
MENT
S
(1)
(2)
(3)
(4)
(5)
(8)
Property dam
age only (PDO)
‐‐0.757
0.93
1.00
0.998
PredictedNpedr
PredictedNbrm
vPredictedNbrsv
PredictedNbrdwy
PredictedNbr
f pedr
0.013
1.00
‐‐1.00
(6)
(7)
f biker
0.007
1.00
‐‐1.00
Total
23.711
2.356
1.319
27.386
0.356
Predicted N
pedr
(9) from W
orksheet 1C
(9) from W
orksheet 1E
(7) from W
orksheet 1H
(2)+(3)+(4)
from Table 12‐8
(5)*(6)*(7)
Crash Severity Level
Predicted N
brm
vPredicted N
brsv
Predicted N
brdwy
Predicted N
br
Calibration
factor, C
r
WOR
KSHE
ET 1J
-- V
EHIC
LE-B
ICYC
LE C
OLLI
SION
S FO
R UR
BAN
AND
SUBU
RBAN
ROA
DWAY
SEG
MENT
S
(1)
(2)
(3)
(4)
(5)
(8)
Fatal and injury (FI)
‐‐‐‐
‐‐‐‐
0.356
Predicted N
biker
(9) from W
orksheet 1C
(9) from W
orksheet 1E
(7) from W
orksheet 1H
(2)+(3)+(4)
from Table 12‐9
(5)*(6)*(7)
Crash Severity Level
Predicted N
brm
vPredicted N
brsv
Predicted N
brdwy
Predicted N
br
Calibration
factor, C
r
Fatal and injury (FI)
‐‐‐‐
‐‐‐‐
0.192
Total
23.711
2.356
1.319
27.386
0.192
Wo
rksh
eet:
Seg
men
t 1
3
(5) from W
orksheet 1D and 1F; and
(6) from W
orksheet 1D and 1F;
(7) from W
orksheet 1H; and
(7) from W
orksheet 1H
(7) from W
orksheet 1H; and
(8) from W
orksheet 1I and 1J
(8) from W
orksheet 1I and 1J
WOR
KSHE
ET 1K
-- C
RASH
SEV
ERIT
Y DI
STRI
BUTI
ON F
OR U
RBAN
AND
SUB
URBA
N RO
ADW
AY S
EGME
NTS
(1)
(2)
(3)
(4)
Collision type
Fatal and injury (FI)
Property dam
age only (PDO)
Total
(3) from W
orksheet 1D and 1F;
Angle collisions (from W
orksheet 1D)
0.511
0.326
0.837
Sideswipe, sam
e direction (from W
orksheet 1D)
0.007
1.272
1.279
MULTIPLE‐VEH
ICLE
Rear‐en
d collisions (from W
orksheet 1D)
6.260
13.727
19.987
Head‐on collisions (from W
orksheet 1D)
0.252
0.326
0.578
Other m
ultiple‐veh
icle collision (from W
orksheet 1D)
0.252
0.326
0.578
Subtotal
7.728
17.301
25.030
Sideswipe, opposite direction (from W
orksheet 1D)
0.126
0.326
0.452
Driveway‐related
collisions (from W
orksheet 1H)
0.320
0.998
1.319
Collision with other object (from W
orksheet 1F)
0.001
0.002
0.002
Other single‐vehicle collision (from W
orksheet 1F)
0.195
0.060
0.256
SINGLE‐VEH
ICLE
Collision with anim
al (from W
orksheet 1F)
0.001
0.002
0.002
Collision with fixed
object (from W
orksheet 1F)
0.434
1.662
2.096
Subtotal
1.178
1.726
2.904
Total
8.906
19.027
27.934
Collision with ped
estrian (from W
orksheet 1I)
0.356
0.000
0.356
Collision with bicycle (from W
orksheet 1J)
0.192
0.000
0.192
WOR
KSHE
ET 1L
-- S
UMMA
RY R
ESUL
TS F
OR U
RBAN
AND
SUB
URBA
N RO
ADW
AY S
EGME
NTS
(1)
(2)
(3)
(4)
Crash Severity Level
Predicted average
crash frequency,
N predicted rs (crashes/year)
Road
way segm
ent length, L (mi)
Crash rate (crashes/mi/year)
(Total) from W
orksheet 1K
(2) / (3)
Total
279
300
93
Predicted
average
crash
frequency
Expected
average
crash
frequency
Predicted
average
crash
frequency
Expected average
crash frequency
Predicted
average
crash
frequency
Expected
average
crash
frequency
Npredicted (KABCO)
Nexpected (KABCO)
Npredicted (KABC)
Nexpected (KABC)
Npredicted (O)
Nexpected (O)
27.9
33.6
5.7
8.9
10.7
1.8
19.0
22.9
3.9
3.00
3.0
(KABC)
(PDO)
Potential for
Improvement
Potential for
Improvement
Potential for
Improvement
Special N
ote: W
hen
the project element is not included
in the analysis the results will all be zeros. In addition if only the analysis only includes determining the predicted average crash frequency (i.e. EB analysis is not carried out), the results will show zero values where
EB results are usually displayed.
Property dam
age only (PDO)
19.0
3.00
6.3
PROJ
ECT
ELEM
ENT
RESU
LTS
SUMM
ARY
Summary for the
project elemen
t
Total Crashes/yr
Fatal and In
jury Crashes/yr
Property Dam
age Only Crashes/yr
(KABCO)
Total
27.9
3.00
9.3
Fatal and injury (FI)
8.9
Wo
rksh
eet:
Seg
men
t 1
4
APPENDIX A: EXAMPLE OF OUTPUT FROM EXTENDED SPREADSHEETS
EXTENDED HSM SPREADSHEETS V.3 - Data, analyses, studies, or training associated with, or findings and documents produced by, this software are based on information compiled or collected pursuant to 23 U.S.C. §§130 and 148 and other federal safety programs and are exempt from discovery or admission under 23 U.S.C. §§ 402 and 409.
Intersection 1
APPENDIX A: EXAMPLE OF OUTPUT FROM EXTENDED SPREADSHEETS
EXTENDED HSM SPREADSHEETS V.3 - Data, analyses, studies, or training associated with, or findings and documents produced by this software are based on information compiled
or collected pursuant to 23 U.S.C. §§130 and 148 and other federal safety programs and are exempt from discovery or admission under 23 U.S.C. §§ 402 and 409.
AADT (veh
/day)
is within range
AADT M
AX =
32,900
(veh
/day)
General Inform
ation
Location In
form
ation
Analyst
John Smith
Roadway
ROUTE
A
Agency or Company
ABC Company
Roadway Section
North Town
Date Perform
ed11/14/11
Jurisdiction
City, State
WOR
KSHE
ET 1A
-- G
ENER
AL IN
FORM
ATIO
N AN
D IN
PUT
DATA
FOR
URB
AN A
ND S
UBUR
BAN
ROAD
WAY
SEG
MENT
S
Roadway type (2U, 3T, 4U, 4D, 5T)
3T
‐‐
Length of segm
ent, L (mi)
3‐‐
Segm
ent for Analysis
Segm
ent 1
Analysis Year
2011
Input Data
Site Conditions
Base Conditions
Med
ian width (ft) ‐ for divided
only
Not Present
15
Lighting (present / not present)
Present
Not Present
30,000
‐‐
Type of on‐street parking (none/parallel/angle)
None
None
Proportion of curb length with on‐street parking
0‐‐
Minor commercial driveways (number)
3‐‐
Major industrial / institutional driveways (number)
2‐‐
Auto speed enforcem
ent (present / not present)
Not Present
Not Present
Major commercial driveways (number)
2‐‐
Minor residen
tial driveways (number)
4‐‐
Other driveways (number)
3‐‐
Minor industrial / institutional driveways (number)
3‐‐
Major residen
tial driveways (number)
1‐‐
Offset to roadside fixed objects (ft) [If greater than
30 or Not Present, input 30]
30
30
Calibration Factor, Cr
1.00
1.00
Speed Category
Posted
Speed Greater than
30 m
ph
‐‐
Roadside fixed object den
sity (fixed objects / mi)
30
Average
Annual Crash History (3 or 5‐yr average)
KABC
PDO
KABC
PDO
KABC
PDO
NOTES: * AADT: It is im
portant to rem
ember that the AADT(major) = AADT(major approach1) + AADT(minor approach2) (refer to p.12‐8 in
Part C of the HSM
)
M
ultiple veh
icle driveway crashes
Fatal and Injury Only
8.0
Property Dam
age Only
12.0
M
ultiple veh
icle nondriveway crashes
Fatal and Injury Only
6.0
WOR
KSHE
ET 1B
-- C
RASH
MOD
IFIC
ATIO
N FA
CTOR
S FO
R UR
BAN
AND
SUBU
RBAN
ROA
DWAY
SEG
MENT
S
(1)
(2)
(3)
(4)
(5)
(6)
Property Dam
age Only
9.0
Single‐vehicle crashes
Fatal and Injury Only
1.0
Property Dam
age Only
5.0
CMF 1r
CMF 2r
CMF 3r
CMF 4r
CMF 5r
CMF comb
CMF for On‐Street Parking
CMF for Roadside Fixed Objects
CMF for Med
ian W
idth
CMF for Lighting
CMF for Automated
Speed Enforcem
ent
Combined
CMF
1.00
1.00
1.00
0.93
1.00
0.93
from Equation 12‐32
from Equation 12‐33
from Table 12‐22
from Equation 12‐34
from Section 12.7.1
(1)*(2)*(3)*(4)*(5)
Wo
rksh
eet:
Seg
men
t 1
1
(6)
(7)
(8)
(9)
ab
‐12.40
1.41
25.387
0.93
1.00
23.711
(6)
(7)
(8)
(9)
Crash Severity Level
SPF Coefficients
Overdispersion Param
eter, k
Initial N
brm
v
Proportion of To
tal Crashes
Adjusted N
brm
v
WOR
KSHE
ET 1C
-- M
ULTI
PLE-
VEHI
CLE
NOND
RIVE
WAY
COL
LISI
ONS
BY S
EVER
ITY
LEVE
L FO
R UR
BAN
AND
SUBU
RBAN
ROA
DWAY
SEG
MENT
S
(1)
(2)
(3)
(4)
(5)
Combined CMFs
Calibration
Factor, Cr
Predicted
Nbrm
v
from Table 12‐3
from Table 12‐3
from Equation 12‐10
(4) TOTA
L*(5)
(6) from
Worksheet 1B
(6)*(7)*(8)
Total
0.66
25.387
1.000
Fatal and Injury (FI)
‐16.45
1.69
0.59
7.931
(4) FI/((4) FI+(4) PDO)
7.932
0.93
1.00
7.408
0.312
Property Dam
age Only (PDO)
‐11.95
1.33
0.59
17.453
WOR
KSHE
ET 1D
-- M
ULTI
PLE-
VEHI
CLE
NOND
RIVE
WAY
COL
LISI
ONS
BY C
OLLI
SION
TYP
E FO
R UR
BAN
AND
SUBU
RBAN
ROA
DWAY
SEG
MENT
S
(1)
(2)
(3)
(4)
(5)
(6)
(5) TOTA
L‐(5) FI
17.455
0.93
1.00
16.303
0.688
(2)*(3) FI
(4)*(5) PDO
(3)+(5)
(9)TOTAL from W
orksheet 1C
Total
1.000
7.408
1.000
16.303
23.711
Collision Type
Proportion of Collision Type(FI)
Predicted N brm
v (FI) (crashes/year)
Proportion of Collision Type (P
DO)
Predicted N brm
v (PDO) (crashes/year)
Predicted N brm
v (TO
TAL) (crashes/year)
from Table 12‐4
(9)FI from W
orksheet 1C
from Table 12‐4
(9)P
DO from W
orksheet 1C
Head‐on collision
0.034
0.252
0.020
0.326
0.578
Rear‐en
d collision
0.845
6.260
0.842
13.727
19.987
Sideswipe, sam
e direction
0.001
0.007
0.078
1.272
1.279
Angle collision
0.069
0.511
0.020
0.326
0.837
Other m
ultiple‐veh
icle collision
0.034
0.252
0.020
0.326
0.578
Sideswipe, opposite direction
0.017
0.126
0.020
0.326
0.452
WOR
KSHE
ET 1E
-- S
INGL
E-VE
HICL
E CO
LLIS
IONS
BY
SEVE
RITY
LEV
EL F
OR U
RBAN
AND
SUB
URBA
N RO
ADW
AY S
EGME
NTS
(1)
(2)
(3)
(4)
(5)
(6)
(7)
(8)
(9)
ab
‐5.74
0.54
2.523
0.93
1.00
2.356
Crash Severity Level
SPF Coefficients
Overdispersion Param
eter, k
Initial N
brsv
Proportion of To
tal Crashes
Adjusted N
brsv
(1)
(2)
(3)
(4)
(5)
Combined CMFs
Calibration
Factor, Cr
Predicted
Nbrsv
from Table 12‐5
from Table 12‐5
from Equation 12‐13
(4) TOTA
L*(5)
(6) from
Worksheet 1B
(6)*(7)*(8)
Total
1.37
2.523
1.000
Fatal and Injury (FI)
‐6.37
0.47
1.06
0.653
(4) FI/((4) FI+(4) PDO)
0.675
0.93
1.00
0.630
0.267
Property Dam
age Only (PDO)
‐6.29
0.56
1.93
1.789
WOR
KSHE
ET 1F
-- S
INGL
E-VE
HICL
E CO
LLIS
IONS
BY
COLL
ISIO
N TY
PE F
OR U
RBAN
AND
SUB
URBA
N RO
ADW
AY S
EGME
NTS
(1)
(2)
(3)
(4)
(5)
(6)
(5) TOTA
L‐(5) FI
1.848
0.93
1.00
1.726
0.733
(2)*(3) FI
(4)*(5) PDO
(3)+(5)
(9)TOTAL from W
orksheet 1E
Total
1.000
0.630
1.000
1.726
2.356
Collision Type
Proportion of Collision Type(FI)
Predicted N brsv (FI) (crashes/year)
Proportion of Collision Type (P
DO)
Predicted N brsv (PDO) (crashes/year)
Predicted N brsv (TO
TAL) (crashes/year)
from Table 12‐6
(9)FI from W
orksheet 1E
from Table 12‐6
(9)P
DO from W
orksheet 1E
Collision with fixed
object
0.688
0.434
0.963
1.662
2.096
Collision with anim
al0.001
0.001
0.001
0.002
0.002
Other single‐vehicle collision
0.310
0.195
0.035
0.060
0.256
Collision with other object
0.001
0.001
0.001
0.002
0.002
Wo
rksh
eet:
Seg
men
t 1
2
(4)
1.412
0.343
1.069
(6)
(7)
fd
Overdispersion param
eter, k
from Table 12‐7
from Table 12‐7
Equation 12‐16
from Table 12‐7
WOR
KSHE
ET 1G
-- M
ULTI
PLE-
VEHI
CLE
DRIV
EWAY
-REL
ATED
COL
LISI
ONS
BY D
RIVE
WAY
TYP
E FO
R UR
BAN
AND
SUBU
RBAN
ROA
DWAY
SEG
MENT
S
(1)
(2)
(3)
(4)
(5)
(6)
nj * N
j * (AADT/15,000)t
Major commercial
20.102
1.000
0.408
Driveway Type
Number of driveways, nj
Crashes per driveway per year, N
jCoefficient for traffic ad
justment, t
Initial N
brdwy
0.440
Minor industrial/institutional
30.015
1.000
0.090
‐‐
Minor commercial
30.032
1.000
0.192
Major industrial/institutional
20.110
1.000
Major residen
tial
10.053
1.000
0.106
Minor residen
tial
40.010
1.000
0.080
1.10
WOR
KSHE
ET 1H
-- M
ULTI
PLE-
VEHI
CLE
DRIV
EWAY
-REL
ATED
COL
LISI
ONS
BY S
EVER
ITY
LEVE
L FO
R UR
BAN
AND
SUBU
RBAN
ROA
DWAY
SEG
MENT
S
(1)
(2)
(3)
(5)
(6)
(7)
Other
30.016
1.000
0.096
Total
‐‐‐‐
‐‐1.412
Predicted N
brdwy
(5) TOTA
L from W
orksheet 1G
from Table 12‐7
(2) TOTA
L * (3)
(6) from W
orksheet 1B
(4)*(5)*(6)
Crash Severity Level
Initial N
brdwy
Proportion of total crashes (fdwy)
Adjusted N
brdwy
Combined CMFs
Calibration factor, C
r
Fatal and injury (FI)
‐‐0.243
0.93
1.00
0.320
Total
1.412
1.000
0.93
1.00
1.319
WOR
KSHE
ET 1I
-- V
EHIC
LE-P
EDES
TRIA
N CO
LLIS
IONS
FOR
URB
AN A
ND S
UBUR
BAN
ROAD
WAY
SEG
MENT
S
(1)
(2)
(3)
(4)
(5)
(8)
Property dam
age only (PDO)
‐‐0.757
0.93
1.00
0.998
PredictedNpedr
PredictedNbrm
vPredictedNbrsv
PredictedNbrdwy
PredictedNbr
f pedr
0.013
1.00
‐‐1.00
(6)
(7)
f biker
0.007
1.00
‐‐1.00
Total
23.711
2.356
1.319
27.386
0.356
Predicted N
pedr
(9) from W
orksheet 1C
(9) from W
orksheet 1E
(7) from W
orksheet 1H
(2)+(3)+(4)
from Table 12‐8
(5)*(6)*(7)
Crash Severity Level
Predicted N
brm
vPredicted N
brsv
Predicted N
brdwy
Predicted N
br
Calibration
factor, C
r
WOR
KSHE
ET 1J
-- V
EHIC
LE-B
ICYC
LE C
OLLI
SION
S FO
R UR
BAN
AND
SUBU
RBAN
ROA
DWAY
SEG
MENT
S
(1)
(2)
(3)
(4)
(5)
(8)
Fatal and injury (FI)
‐‐‐‐
‐‐‐‐
0.356
Predicted N
biker
(9) from W
orksheet 1C
(9) from W
orksheet 1E
(7) from W
orksheet 1H
(2)+(3)+(4)
from Table 12‐9
(5)*(6)*(7)
Crash Severity Level
Predicted N
brm
vPredicted N
brsv
Predicted N
brdwy
Predicted N
br
Calibration
factor, C
r
Fatal and injury (FI)
‐‐‐‐
‐‐‐‐
0.192
Total
23.711
2.356
1.319
27.386
0.192
Wo
rksh
eet:
Seg
men
t 1
3
(5) from W
orksheet 1D and 1F; and
(6) from W
orksheet 1D and 1F;
(7) from W
orksheet 1H; and
(7) from W
orksheet 1H
(7) from W
orksheet 1H; and
(8) from W
orksheet 1I and 1J
(8) from W
orksheet 1I and 1J
WOR
KSHE
ET 1K
-- C
RASH
SEV
ERIT
Y DI
STRI
BUTI
ON F
OR U
RBAN
AND
SUB
URBA
N RO
ADW
AY S
EGME
NTS
(1)
(2)
(3)
(4)
Collision type
Fatal and injury (FI)
Property dam
age only (PDO)
Total
(3) from W
orksheet 1D and 1F;
Angle collisions (from W
orksheet 1D)
0.511
0.326
0.837
Sideswipe, sam
e direction (from W
orksheet 1D)
0.007
1.272
1.279
MULTIPLE‐VEH
ICLE
Rear‐en
d collisions (from W
orksheet 1D)
6.260
13.727
19.987
Head‐on collisions (from W
orksheet 1D)
0.252
0.326
0.578
Other m
ultiple‐veh
icle collision (from W
orksheet 1D)
0.252
0.326
0.578
Subtotal
7.728
17.301
25.030
Sideswipe, opposite direction (from W
orksheet 1D)
0.126
0.326
0.452
Driveway‐related
collisions (from W
orksheet 1H)
0.320
0.998
1.319
Collision with other object (from W
orksheet 1F)
0.001
0.002
0.002
Other single‐vehicle collision (from W
orksheet 1F)
0.195
0.060
0.256
SINGLE‐VEH
ICLE
Collision with anim
al (from W
orksheet 1F)
0.001
0.002
0.002
Collision with fixed
object (from W
orksheet 1F)
0.434
1.662
2.096
Subtotal
1.178
1.726
2.904
Total
8.906
19.027
27.934
Collision with ped
estrian (from W
orksheet 1I)
0.356
0.000
0.356
Collision with bicycle (from W
orksheet 1J)
0.192
0.000
0.192
WOR
KSHE
ET 1L
-- S
UMMA
RY R
ESUL
TS F
OR U
RBAN
AND
SUB
URBA
N RO
ADW
AY S
EGME
NTS
(1)
(2)
(3)
(4)
Crash Severity Level
Predicted average
crash frequency,
N predicted rs (crashes/year)
Road
way segm
ent length, L (mi)
Crash rate (crashes/mi/year)
(Total) from W
orksheet 1K
(2) / (3)
Total
279
300
93
Predicted
average
crash
frequency
Expected
average
crash
frequency
Predicted
average
crash
frequency
Expected average
crash frequency
Predicted
average
crash
frequency
Expected
average
crash
frequency
Npredicted (KABCO)
Nexpected (KABCO)
Npredicted (KABC)
Nexpected (KABC)
Npredicted (O)
Nexpected (O)
27.9
33.6
5.7
8.9
10.7
1.8
19.0
22.9
3.9
3.00
3.0
(KABC)
(PDO)
Potential for
Improvement
Potential for
Improvement
Potential for
Improvement
Special N
ote: W
hen
the project element is not included
in the analysis the results will all be zeros. In addition if only the analysis only includes determining the predicted average crash frequency (i.e. EB analysis is not carried out), the results will show zero values where
EB results are usually displayed.
Property dam
age only (PDO)
19.0
3.00
6.3
PROJ
ECT
ELEM
ENT
RESU
LTS
SUMM
ARY
Summary for the
project elemen
t
Total Crashes/yr
Fatal and In
jury Crashes/yr
Property Dam
age Only Crashes/yr
(KABCO)
Total
27.9
3.00
9.3
Fatal and injury (FI)
8.9
Wo
rksh
eet:
Seg
men
t 1
4
APPENDIX A: EXAMPLE OF OUTPUT FROM EXTENDED SPREADSHEETS
EXTENDED HSM SPREADSHEETS V.3 - Data, analyses, studies, or training associated with, or findings and documents produced by, this software are based on information compiled or collected pursuant to 23 U.S.C. §§130 and 148 and other federal safety programs and are exempt from discovery or admission under 23 U.S.C. §§ 402 and 409.
Site Total (EB Analysis)
APPENDIX A: EXAMPLE OF OUTPUT FROM EXTENDED SPREADSHEETS
EXTENDED HSM SPREADSHEETS V.3 - Data, analyses, studies, or training associated with, or findings and documents produced by this software are based on information compiled
or collected pursuant to 23 U.S.C. §§130 and 148 and other federal safety programs and are exempt from discovery or admission under 23 U.S.C. §§ 402 and 409.
(2)
(3)
(4)
(5)
(5a)
(5b)
(6)
(7)
(8)
ROADWAY SEG
MEN
TS
Multiple‐vehicle nondriveway
Segm
ent 1
23.711
7.408
16.303
15.0
6.0
9.0
0.660
0.060
15.523
Single‐vehicle (Seg)
Segm
ent 1
2.356
0.630
1.726
6.0
1.0
5.0
1.370
0.237
5.138
Multiple‐vehicle driveway‐related
Segm
ent 1
1.319
0.320
0.998
20.0
8.0
12.0
1.100
0.408
12.377
INTERSECTIONS
Multiple‐vehicle (Intx)
Intersection 1
5.027
1.485
3.542
12.0
5.0
7.0
0.800
0.199
10.611
Intersection 2
5.931
2.037
3.894
10.0
2.0
8.0
0.390
0.302
8.772
Single‐vehicle (Intx)
Intersection 1
0.468
0.136
0.333
6.0
2.0
4.0
1.140
0.652
2.393
Intersection 2
0.330
0.078
0.251
7.0
1.0
6.0
0.360
0.894
1.037
39.142
12.094
27.047
76.000
25.000
51
5.820
2.751
55.852
(2)
(3)
Nped
Nbicycle
ROADWAY SEG
MEN
TS
Segm
ent 1
0.356
0.192
INTERSECTIONS
Intersection 1
‐‐0.088
Intersection 2
0.142
0.094
COMBINED
(sum of column)
0.498
0.374
12.1
N predicted(ped)
Worksheet 3A ‐‐ Predicted Crashes by Severity and Site Type and Observed Crashes Using the Site‐Specific EB
Method for Urban
and Suburban
Arterials
KABCO
Total Crashes
Observed crashes, Nobserved (crashes/year)
Overdispersion
Param
eter, k
Equation A‐5
from Part C
Appen
dix
KABC
PDO
Equation A‐4
from Part C
Appen
dix
Expected
average
crash
frequency,
Nexpected
Weighted
adjustment, w
(1)
COMBINED
(sum of column)
Predicted average
crash frequency (crashes/year)
Property dam
age only (PDO)
(3)
Crash severity level
(4) COMB from W
orksheet 3A
39.1
27.0
0.5
0.0
(2) COMB from W
orksheet 3B
‐‐0.5
(2) COMB from W
orksheet 3B
Fatal and injury (FI)
Total
(2) COMB from W
orksheet 3A
(3) COMB from W
orksheet 3A
N predicted (TOTA
L) N
predicted (PDO)
N predicted (FI)
Collision type / Site type
38.3
N predicted(bicycle)
(4)
(5)
0.4
(2)+(3)+(4)
13.0
(2)+(3)+(4)
27.0
(6)
N predicted(PROJECT)
(2)+(3)+(4)
40.0
(8) COMB W
orksheet 3A + (3) + (4)
0.4
0.0
(3) COMB from W
orksheet 3B
‐‐(5) TOTA
L * (2) PDO / (2) TO
TAL
(5) TOTA
L * (2) FI / (2) TO
TAL
56.7
18.4
Worksheet 3B ‐‐ Predicted Pedestrian
and Bicycle Crashes for Urban
and
Suburban
Arterials
(1)
Site Type
N expected (PROJECT)
(3) COMB from W
orksheet 3B
(1)
(2)
N predicted(SV+M
V)
Worksheet 3C ‐‐ Site‐Specific EB
Method Summary Results for Urban
and Suburban
Arterials
Wor
kshe
et:
Urb
an S
ite T
otal
APPENDIX A: EXAMPLE OF OUTPUT FROM EXTENDED SPREADSHEETS
EXTENDED HSM SPREADSHEETS V.3 - Data, analyses, studies, or training associated with, or findings and documents produced by this software are based on information compiled
or collected pursuant to 23 U.S.C. §§130 and 148 and other federal safety programs and are exempt from discovery or admission under 23 U.S.C. §§ 402 and 409.
APPENDIX A: EXAMPLE OF OUTPUT FROM EXTENDED SPREADSHEETS
EXTENDED HSM SPREADSHEETS V.3 - Data, analyses, studies, or training associated with, or findings and documents produced by, this software are based on information compiled or collected pursuant to 23 U.S.C. §§130 and 148 and other federal safety programs and are exempt from discovery or admission under 23 U.S.C. §§ 402 and 409.
Report
APPENDIX A: EXAMPLE OF OUTPUT FROM EXTENDED SPREADSHEETS
EXTENDED HSM SPREADSHEETS V.3 - Data, analyses, studies, or training associated with, or findings and documents produced by this software are based on information compiled
or collected pursuant to 23 U.S.C. §§130 and 148 and other federal safety programs and are exempt from discovery or admission under 23 U.S.C. §§ 402 and 409.
PROJECT SUMMARY Sit S ifi EB M th d S R lt f U b d S b b A t i l P j t
Project Element
General Information
Project Reference
(PDO)(KABC)
John Smith
Potential for
Improvement
Potential for
Improvement
Potential for
Improvement
13.1
27.0
40.1
18.6
38.2
56.8
5.5
11.2
16.7
0.0
10.0
20.0
30.0
40.0
50.0
60.0
Fatal and injury (KABC) Property damage only (PDO) Total (KABCO)
Summary of Anticipated Safety Performance of the Project (average crashes/yr)
Predicted average crash frequency ‐ Average safety performance of projects consisting of similar elements (anticipated average crashes/yr)
Expected average crash frequency ‐ Actual long‐term safety performance of the project (anticipated average crashes/yr)
Potential for Safety Improvement (anticipated average crashes/yr)
Discussion of ResultsGiven the potential effects of project characteristics on safety performance, results indicate that:
16.7
11.2Property damage only (PDO) 27.0 38.2
N expected (PROJECT)Predicted average crash
frequency ‐ Average safety
performance of projects
consisting of similar elements
(anticipated average crashes/yr)
Expected average crash frequency
‐ Actual long‐term safety
performance of the project
(anticipated average crashes/yr)
Total (KABCO)
Fatal and injury (KABC)
Crash severity level
56.8
3. It is anticipated the project has, on average, a potential for safety improvement of 16.7 crashes per year (5.5 fatal and injury crashes per year; and 11.2 property damage only crashes per year).
PROJECT SUMMARY ‐‐ Site‐Specific EB Method Summary Results for Urban and Suburban Arterial Project
40.1
1. It is anticipated that the project will, on average, experience 56.8 crashes per year (18.6 fatal and injury crashes per year; and 38.2 property damage only crashes per year).
2. A similar project is anticipated, on average, to experience 40.1 crashes per year (13.1 fatal and injury crashes per year; and 27 property damage only crashes per year).
18.6 5.5
N predicted(PROJECT)
13.1
N potential for improvement (PROJECT)
Potential for Safety Improvement
(anticipated average crashes/yr)
Worksheet: Report
APPENDIX A: EXAMPLE OF OUTPUT FROM EXTENDED SPREADSHEETS
EXTENDED HSM SPREADSHEETS V.3 - Data, analyses, studies, or training associated with, or findings and documents produced by this software are based on information compiled
or collected pursuant to 23 U.S.C. §§130 and 148 and other federal safety programs and are exempt from discovery or admission under 23 U.S.C. §§ 402 and 409.
APPENDIX A: EXAMPLE OF OUTPUT FROM EXTENDED SPREADSHEETS
EXTENDED HSM SPREADSHEETS V.3 - Data, analyses, studies, or training associated with, or findings and documents produced by, this software are based on information compiled or collected pursuant to 23 U.S.C. §§130 and 148 and other federal safety programs and are exempt from discovery or admission under 23 U.S.C. §§ 402 and 409.
Multi-Year Analysis Results Report
APPENDIX A: EXAMPLE OF OUTPUT FROM EXTENDED SPREADSHEETS
EXTENDED HSM SPREADSHEETS V.3 - Data, analyses, studies, or training associated with, or findings and documents produced by this software are based on information compiled
or collected pursuant to 23 U.S.C. §§130 and 148 and other federal safety programs and are exempt from discovery or admission under 23 U.S.C. §§ 402 and 409.
Project Nam
e
Project Description
Referen
ce Number
Analyst
Agency/Company
Contact Email
Contact Phone
Date Completed
Base Year
Analysis Period (Years)
Linear Traffic Growth Rate (annual %)
10‐Year Analysis Summary Report
3%
PROJECT SU
MMARY
10
MULT
IPLE
YEA
R PR
OJEC
T SA
FETY
PER
FORM
ANCE
SUM
MARY
REP
ORT
FOR
URBA
N AN
D SU
BURB
AN A
RTER
IAL
General Inform
ation
Practical Case Study
Project Description
Project Referen
ce
John Smith
ABC Company
email@
email.com
(123) 456‐7891
11/14/11
2011
157.5
317.8
475.4
194.4
393.8
588.4
36.9
76.0
113.0
0.0
100.0
200.0
300.0
400.0
500.0
600.0
700.0
Fatal and injury crashes (KABC)
Property dam
age only crashes (PDO)
Total crashes (KABCO)
Summary of Anticipated
Safety Perform
ance of the Project (total over an
alysis period)
Predicted average crash frequen
cy ‐Average safety perform
ance of projects consisting
of similar elem
ents (anticipated
total number of crashes over 10 years)
Expected average crash frequen
cy ‐Average long‐term
safety perform
ance of the
project (anticipated
total number of crashes over 10 years)
Potential safety perform
ance ‐Average project perform
ance compared
to threshold
set by typical other sim
ilar projects (anticipated
total number of crashes over 10
years)
KABC
PDO
Total (KABCO)
KABC
PDO
Total (KABCO)
KABC
PDO
Total (KABCO)
2011
13.1
27.0
40.1
18.6
38.2
56.8
5.5
11.2
16.7
2012
13.6
28.1
41.6
18.8
38.7
57.3
5.2
10.6
15.7
2013
14.2
29.1
43.4
19.0
38.7
57.8
4.8
9.6
14.4
2014
14.8
30.1
45.0
19.1
38.9
58.2
4.3
8.8
13.2
2015
15.4
31.2
46.6
19.4
39.3
58.7
4.0
8.1
12.1
2016
16.0
32.3
48.4
19.5
39.5
59.2
3.5
7.2
10.8
2017
16.7
33.4
50.0
19.8
39.9
59.5
3.1
6.5
9.5
2018
17.2
34.4
51.7
19.8
39.9
59.9
2.6
5.5
8.2
2019
17.9
35.5
53.4
20.1
40.2
60.3
2.2
4.7
6.9
2020
18.6
36.7
55.2
20.3
40.5
60.7
1.7
3.8
5.5
Total
157.5
317.8
475.4
194.4
393.8
588.4
36.9
76.0
113.0
Analysis Year
Predicted Average Crash Frequen
cy
(Npredicted)
Expected Average Crash Frequen
cy
(Nexpected)
Potential for Safety Im
provemen
t
(crashes/yr)
Wor
kshe
et: M
ulti-
Yea
r A
naly
sis
Rep
ort
1
PROJECT SU
MMARY ‐‐ Site‐Specific EB
Method Summary Results for Urban
and Suburban
Arterial Project
Crash severity level
Discussion of Results
2. A
sim
ilar project is anticipated
, on average, to experience 475.4 crashes over a 10 year analysis period (157.5 fatal and injury crashes over 10 years; and 317.8 property dam
age only crashes over 10 years).
3. It is anticipated
the project will have an
average potential for safety im
provemen
t of 113 crashes over a 10 year analysis period (36.9 fatal and injury crashes over 10 years; and 76 property dam
age only crashes over 10 years).
Total crashes (KABCO)
475.4
588.4
113.0
Given the potential effects of project characteristics on safety perform
ance and assuming a 3 % growth in
AADT over a 10 year analysis period with 2011 as the base year, results indicate that:
1. The project is anticipated
, on average, to experience 588.4 crashes over a 10 year analysis period (194.4 fatal and injury crashes; and 393.8 property dam
age only crashes).
Fatal and injury crashes (KABC)
157.5
194.4
36.9
Property dam
age only crashes (PDO)
317.8
393.8
76.0
N predicted(PROJECT)
N expected (PROJECT)
N potential for im
provement (PROJECT)
Predicted average
crash frequency ‐
Average
safety perform
ance of projects
consisting of similar elements (an
ticipated
total number of crashes over 10 years)
Expected average
crash frequency ‐
Average
long‐term
safety perform
ance of
the project (an
ticipated total number of
crashes over 10 years)
Potential safety perform
ance ‐ Average
project perform
ance compared to
threshold set by typical other similar
projects (anticipated total number of
crashes over 10 years)
Wor
kshe
et: M
ulti-
Yea
r A
naly
sis
Rep
ort
2W
orks
heet
: Mul
ti-Y
ear
Ana
lysi
s R
epor
t2
B-1 EXTENDED HSM SPREADSHEETS V.3 - Data, analyses, studies, or training associated with, or findings and documents produced by this software are based on information compiled or collected pursuant to 23 U.S.C. §§130 and 148 and other federal safety programs and are exempt from discovery or admission under 23 U.S.C. §§ 402 and 409.
Appendix B: Modifications to Worksheet 3C in Chapter 12
APPENDIX B: MODIFICATIONS TO WORKSHEET 3C IN CHAPTER 12
B-2 EXTENDED HSM SPREADSHEETS V.3 - Data, analyses, studies, or training associated with, or findings and documents produced by this software are based on information compiled
or collected pursuant to 23 U.S.C. §§130 and 148 and other federal safety programs and are exempt from discovery or admission under 23 U.S.C. §§ 402 and 409.
APPENDIX B: MODIFICATIONS TO WORKSHEET 3C IN CHAPTER 12
B-3 EXTENDED HSM SPREADSHEETS V.3 - Data, analyses, studies, or training associated with, or findings and documents produced by, this software are based on information compiled or collected pursuant to 23 U.S.C. §§130 and 148 and other federal safety programs and are exempt from discovery or admission under 23 U.S.C. §§ 402 and 409.
Appendix B describes the changes made to Worksheet 3C of Chapter 12 (AASHTO HSM 2010). The purpose of the changes was to improve the understanding of headings of the results and assessment of the analysis results summarized in the HSM Worksheet 3C (p.12‐119). Appendix A provides Worksheet 3C as part of the analysis worksheet printouts. i. Updated title for column (2) to Npredicted (MV+SV). Column (2) in the extended Worksheet 3C represents the sum
of the predicted average crashes for single vehicle and multi vehicle collisions. Users often incorrectly assume that Npredicted, the original column (2) in HSM Worksheet 3C on p.12‐119), represents the value for the total number of predicted average crashes for the project when it merely represents the total predicted average crashes for single and multiple vehicle crashes (i.e. not including the predicted average crashes for vehicle‐pedestrian or vehicle‐bicycle crashes). The updated title clarifies the content of the column to users.
ii. Updated title for column (3) to Npredicted (ped). Column (3) in the expanded spreadsheet represents the predicted average crash frequency for vehicle‐pedestrian crashes. The original column (3) title, Nped, does not clarify whether the value is the predicted average vehicle‐pedestrian crash frequency for the project, or the expected average vehicle‐pedestrian crash frequency for the project. The updated title clarifies the content of the column to users.
iii. Updated title for column (4) to Npredicted (bicycle). Column (4) in Worksheet 3C represents the predicted average crash frequency for vehicle‐bicycle crashes. The original column (4) title, Nbike, does not indicate whether the value is the predicted average vehicle‐pedestrian crash frequency for the project, or the expected average vehicle‐pedestrian crash frequency for the project. In addition, frequently asked questions from first‐time HSM users indicated that the term “bike” does not necessarily mean “bicycle” to users. The updated title clarifies the content of the column to users.
iv. Changed title and contents for column (6) to Npredicted (project). The updated column (6), Npredicted (project), now
represents the sum of all predicted average crash frequencies for the project (columns (2), (3) and (4) for total crashes and so forth). The updated title and contents of the column support an improved understanding of the results. Column (6) in Worksheet 3C presents the sum of the expected average crash frequencies across all the collision types; however, the table itself does not provide a summary of values across the predicted average crash frequencies for the different collision types. The total average predicted crash frequency for the project is particularly helpful in that it presents the anticipated average performance of a similar project, aka a performance threshold. The updated column title and contents ensure that the analysis results summarizes the total predicted average crash frequency for the project across crash severities. The predicted average crash frequency for the project can be compared to the total expected average crash frequency (reflected in the extended worksheets as column (5)) to determine the potential for safety improvement. The potential for safety improvement is defined as (Nexpected (project)‐ Npredicted (project)) if the difference is a positive value.
v. Changed title and contents for column (5). The updated column (5) represents the total average expected crash frequency for the project, expressed as Nexpected (project). Column (5) in the original HSM Worksheet 3C presents the sum of the expected average crash frequencies for multiple vehicle and single vehicle crashes (column (8) from Worksheet 3A) with a title of Nexpected (vehicle). Frequently asked questions indicate that users often incorrectly presume that column (5) represented the total expected average crash frequency for the project rather than just the sum of the expected average crash frequency for multiple vehicle and single vehicle crashes for the project. The updated title and contents of the column support an improved understanding of the results, and an easy comparison of the total predicted average crash frequency and the total expected average crash frequency for the project.