Page 1
Uhrlandt D. et al.: Improved Methods of Emission Spectroscopy…
Plasma Physics and Technology
2015, 2, 3, 280-289
Extended Methods of Emission Spectroscopy for the Analysis of Arc
Dynamics and Arc Interaction with Walls
Uhrlandt D., Methling R., Franke St., Gorchakov S., Baeva M., Khakpour A., Brüser V.
Leibniz Institute for Plasma Science and Technology (INP Greifswald), Felix-Hausdorff-Str. 2, 17489
Greifswald, Germany, [email protected]
Recently, a number of improved methods of optical emission spectroscopy have been proposed for the
study of high-current arcs with special emphasis on the treatment of optical thick arc radiation and analy-
sis of the arc dynamics. The paper gives a short review on these methods focusing on the determination
of plasma properties by means of comparison of measured and simulated emission spectra and the use of
high-speed video spectroscopy. The application of these methods is demonstrated for a specific exam-
ple; the study of the interaction of arcs with side walls and the impact of ceramic coatings on the wall’s
protection. For that purpose, a free burning arc experiment with CuW electrodes is used. The strong elec-
trode erosion causes the arc operation in copper vapour with high stability and reproducibility. The arc
temperature profile is obtained from measurements of copper line radiation complemented with radiation
transport simulations. The impact of the arc radiation on the evaporation of different ceramic coatings of
side walls is studied by video spectroscopy. The resulting impact on the heat load of the walls is derived
from thermographic measurements.
Keywords: optical emission spectroscopy, plasma temperature, arc wall interaction
1 INTRODUCTION
Optical emission spectroscopy (OES) has been
established as a main diagnostic method for
the study of thermal plasmas and the determi-
nation of plasma properties like plasma tem-
perature and densities of emitting species as
long as the plasma is optically accessible.
These measurements are preferentially used
for the validation of plasma models. The in-
tense radiation of arcs in the visible range al-
lows measurements with low acquisition time
and in small spectral ranges. This would make
possible, in general, the study of arcs with
high temporal dynamics and high accuracy.
However, most of the established methods are
limited by a number of required assumptions
and other boundary conditions for the radia-
tion analysis.
On the one hand, recording techniques with
high temporal resolution (use of photomulti-
plier or fibre spectrometer) have typically no
or low spatial resolution (see e.g. [1]) whereas
spatial imaging spectroscopy with intensified
charge coupled device (ICCD) cameras are
very limited in the repetition time (see e.g. [2].
Imaging spectroscopy coupled with a high
speed camera (HSC) (here and later called
video spectroscopy) offers an answer to this
problem but is not well proven up to now.
One the other hand, most of the established
methods are based on the analysis of line radi-
ation and require an adequate knowledge of
specific properties of the radiating species and
their atomic transitions in the considered
plasma. Methods like single-line or multiple-
line analysis and analysis of the line profile
width (see e.g. [3]) are limited to line radiation
of low optical thickness and plasma tempera-
tures below the normal maximum of the lines.
The latter describes the point of maximum in-
tensity before the intensity decreases with in-
creasing temperature due to a significant de-
crease of the radiator density according to the
change of the plasma composition.
The most methods are based on the assump-
tion of local thermodynamic equilibrium
(LTE) of the plasma. Furthermore, rotational
symmetry of the arc is assumed for the re-
quired spatial reconstruction of the local emis-
sion coefficient from side-on measurements
from only one viewing angle. An exception is
the Bartel’s method for the evaluation of line
radiation showing self-reversal [4]. Here, the
plasma temperature can be obtained from the
intensity of the side-on measured radiance in
the maximum of the line profile with self-
reversal. However, the method can fail in the
temperature range above the normal maxi-
mum.
An alternative to the methods mentioned
Page 2
Uhrlandt D. et al.: Extended Methods of Emission Spectroscopy…
281
above is to start with an assumption of spatial
profiles of plasma temperature and radiator
densities and applying simulations of side-on
spectra by radiation transport calculations (see
e.g. [5]). The comparison with calibrated
measurements allows the successive im-
provement of the initial assumptions. This
method will be discussed in more detail in sec-
tion 2.
In view of the recently increased interest on
studies of arc interaction with surfaces (elec-
trodes and side walls), in sections 3 to 5 both
methods, the temperature determination by
radiation transport calculations and side-on
measured spectra and the video spectroscopy,
will be demonstrated on the example of a free
burning arc experiment considering the evapo-
ration of protective layers of side walls. A
specific setup with WCu and W electrodes, as
described in section 3, provides arcs dominat-
ed by the copper evaporation at the cathode
which show high stability and reproducibility.
Studies of the electrode erosion in arc applica-
tions have a long history because this process
is a key issue for lifetime and reliability. The
same holds for the study of nozzle ablation in
high-voltage circuit-breakers focussing mainly
on polytetrafluoroethylene (PTFE) [6]. More
recently, the replacement of PTFE by other
gas-producing polymeric materials has been
studied [7-11]. Some of these studies concern
also the unintentional and often crucial evapo-
ration of side walls, e.g. in low-voltage circuit-
breakers. The possible protection of side walls
against heat load and erosion by means of ap-
propriate coatings represents an additional as-
pect. For example, ceramic coatings offer ad-
ditional advantages because there are cheap,
easy coating techniques are available, and the
coating can be partially regenerated from the
evaporation products. First studies of the arc
interaction with ceramic coatings have been
presented in a preceding paper [12]. In this
paper, more robust coatings as well as im-
proved diagnostic methods for the analysis of
the arc and the evaporation of the coatings are
considered.
2 OES AND RADIATION
TRANSPORT
OES of line radiation from metal vapours (Fe,
Cu, Mg) can be well used for temperature de-
termination in arcs in different gases. The
large variety of metal lines in the visible spec-
trum makes it easy to find lines of atoms and
ions or lines corresponding to optical transi-
tions from quite different energy levels in
small wavelength ranges which can be record-
ed simultaneously with high resolution.
Boltzmann-plot of line intensities or the ratio
of atomic and ionic lines is well applicable as
long as the vapour concentration and conse-
quently the optical thickness of the lines are
sufficiently low. In contrast to that, lines of
broad profiles with large overlapping and of-
ten self-reversal can be found in arcs which
are dominated by metal vapour [13]. The line
emission is accompanied by a significant ab-
sorption of the emitted radiation in the near
and far surrounding of every emission point.
The radiation transport affects the radiation
intensity observed from outside as well as the
power balance of the arc considerably.
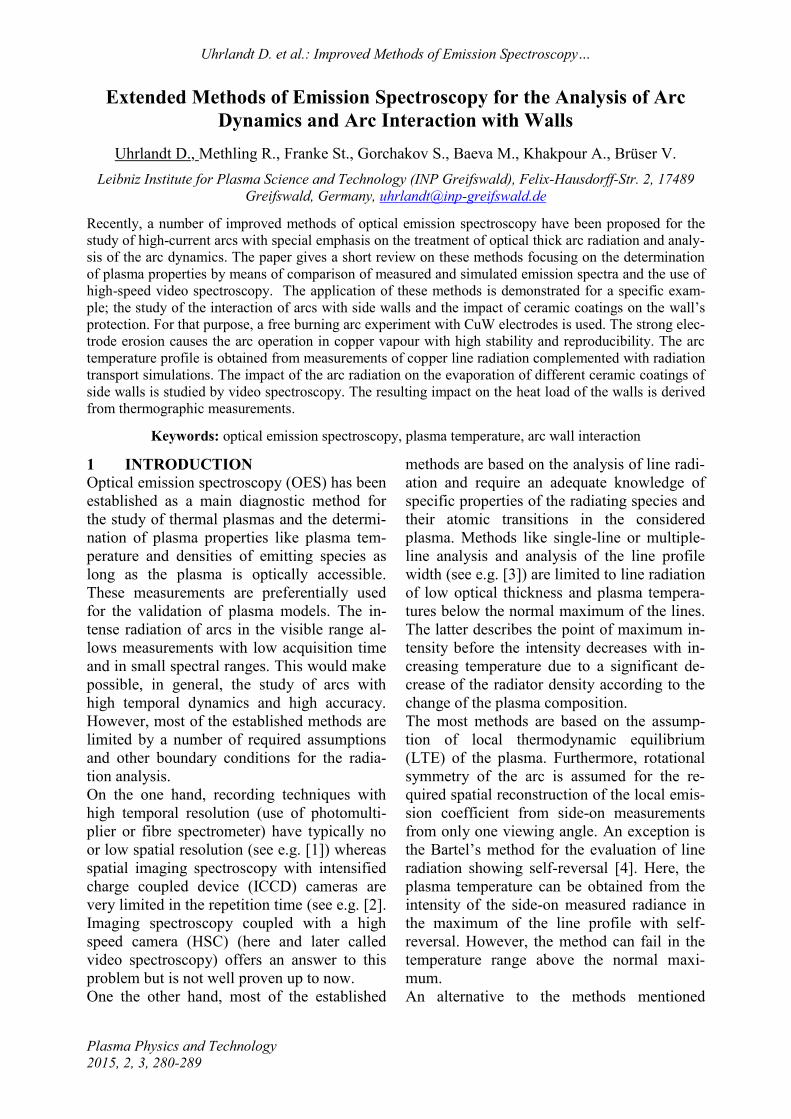
Fig. 1: Scheme of the line of sight (blue) through a
plasma cross section (black circle) at the side-on
position y
The solution of the radiation transport equa-
tion along a line of sight through the arc plas-
ma enables a strict treatment of emission and
absorption (see e.g. [5,14]). Let us consider a
line of sight along direction x through the
plasma at a side-on position y. This situation is
illustrated in Fig. 1 for the case of cylindrical
plasma which is observed from the side per-
pendicular to the cylinder axis. The position x
varies between –x0 and x0 at the borders of the
plasma. The spectral radiance L resulting from
this line at the wavelength is determined by
Page 3
Uhrlandt D. et al.: Extended Methods of Emission Spectroscopy…
282
𝐿(, 𝑦) =
∫ 𝜀𝑥0
−𝑥0(, 𝑥, 𝑦)exp[−∫ 𝜅
𝑥0
𝑥′(, 𝑥′, 𝑦)d𝑥′]d𝑥
(1).
ε(, 𝑥, 𝑦) and 𝜅(, 𝑥, 𝑦) are the local spectral
emission and absorption coefficients, respec-
tively. In what follows the x- and y-
dependence in 𝜀- and 𝜅-notations is dropped
for the sake of simplicity. In both coefficients
contributions from spectral lines (bound-
bound transitions) and from continuum radia-
tion have to be included. The emission coeffi-
cient of a line corresponding to the transition
between atomic (ionic) levels k and i reads
𝜀𝑘𝑖0 (𝑇) =
ℎ𝑐
4𝜋𝑘𝑖𝐴𝑘𝑖𝑛𝑘(𝑇) (2)
with the central wavelength ki, the transition
probability Aki , the speed of light c, the
Planck constant h, and the density nk of the
upper excited level. Assuming LTE this densi-
ty can be expressed by the Boltzmann distri-
bution
𝑛𝑘(𝑇) = 𝑛0(𝑇)𝑔𝑘
𝑍(𝑇)exp (−
𝐸𝑘
𝑘𝑇) (3)
where n0 is the total species density (atom or
ion density for example), gk is the statistical
weight and Ek the excitation energy of the lev-
el, k - the Boltzmann constant, T - the temper-
ature and Z(T) - the partition function. The
corresponding contribution to the spectral
emission coefficient is calculated assuming,
e.g., a Lorentz line profile with a half half-
width 𝑤𝑘𝑖
and line shift 𝑘𝑖 according to
𝜀𝑘𝑖(𝜆, 𝑥)=𝜀𝑘𝑖0 𝑤
𝑘𝑖
𝜋
1
(𝜆−𝜆𝑘𝑖−𝜆𝑘𝑖)2+(𝑤
𝑘𝑖)2 (4)
where the values of T, Z(T) and n0(T) are taken
at the position x. The species densities result
from plasma composition calculations for the
respective local temperature and gas pressure
applying the Gibbs-free energy minimization
method. The corresponding absorption coeffi-
cient is calculated applying the Kirchhoff’s
law
𝜅𝑘𝑖(𝜆, 𝑥) = 𝜀𝑘𝑖(𝜆, 𝑥)𝐵𝜆𝑘𝑖 (5)
with the Planck function 𝐵𝜆𝑘𝑖.
In the example which will be presented in sec-
tion 4, the radiation of the arc plasma in a
copper-air mixture is considered in a spectral
range from 490 to 530 nm for temperatures
from 1 up to 20 kK. Here, 13 lines of Cu I
(copper atoms), 108 lines of Cu II (singly ion-
ized copper) and in addition a number of lines
of oxygen and nitrogen (atoms and ions) are
included with atomic data from the Kurucz
and NIST Atomic Spectra Database each
characterized with a Lorentz line profile. Each
line width comprises a base part 𝑤𝑚𝑖𝑛
and a
part from Stark broadening 𝑤𝑆
estimated ac-
cording to [14-16]. The bremsstrahlung con-
tinuum (free-free transitions) and the recom-
bination continuum (free-bound transitions)
have been calculated as given in [14] using
photoionization cross sections from [17, 18]
and momentum transfer cross sections from
[19].
As a first assumption for the considered ex-
ample, a rotational symmetric temperature
profile is constructed on the base of radial pro-
files of measured line intensities. Because the
line intensities show mainly a box like profile
with a quite flat central region, a temperature
profile with a flat centre and a larger slope at
outer positions is assumed. Then, the maxi-
mum temperature is adjusted by comparing
with the measured intensities of Cu I lines at
the central side-on position.
Fig. 2: Examples of considered radial arc temper-
ature profiles (in green and black): temperature
along the line of sight for the central side-on posi-
tion (solid lines) and for side-on positions y=3 mm
(dashed lines) and y=4 mm (dotted lines) from the
arc axis
Examples of considered temperature profiles
are shown in Fig. 1 considering a maximum
temperature of 10 kK. Results of simulations
of the side-on radiance L at the central side-on
Page 4
Uhrlandt D. et al.: Extended Methods of Emission Spectroscopy…
283
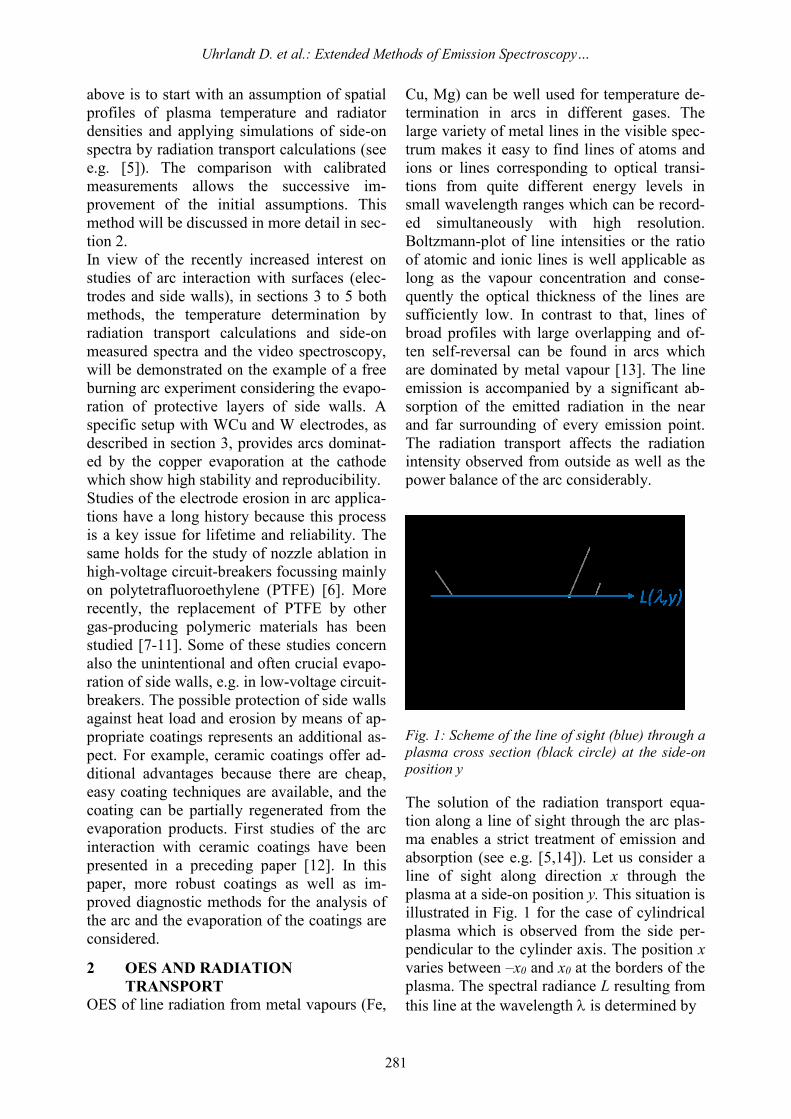
position (y=0) for different maximum temper-
atures (12 and 15 kK) considering a copper
vapour pressure of 1 bar (without contribu-
tions of air) and a radial temperature profile
corresponding to the black profile in Fig. 2 are
shown in Fig. 3. The spectral radiance is dom-
inated by Cu I lines at 0=507.6, 510.6 and
515.3 nm where the last two show strong self-
reversal. Cu II lines at 0=506.5 and 508.8 nm
become visible at 15 kK maximum tempera-
ture.
Fig. 3: Examples of radiance simulations for the
radial temperature profile similar to the black
curve in Fig. 1 but maximum temperatures 12 kK
(red solid line) and 15 kK (blue dashed line) for
the central side-on position
In the next step, the copper vapour pressure is
adjusted mainly by comparing the line profile
width of leading lines. Finally, the width of
the temperature profile and in addition a radial
profile of the copper vapour density is adjust-
ed to find best agreement between simulation
and measurements including several side-on
positions. The results are presented in sec-
tion 4.
3 EXPERIMENTAL STUDY OF ARC
INTERACTION WITH
PROTECTIVE COATINGS
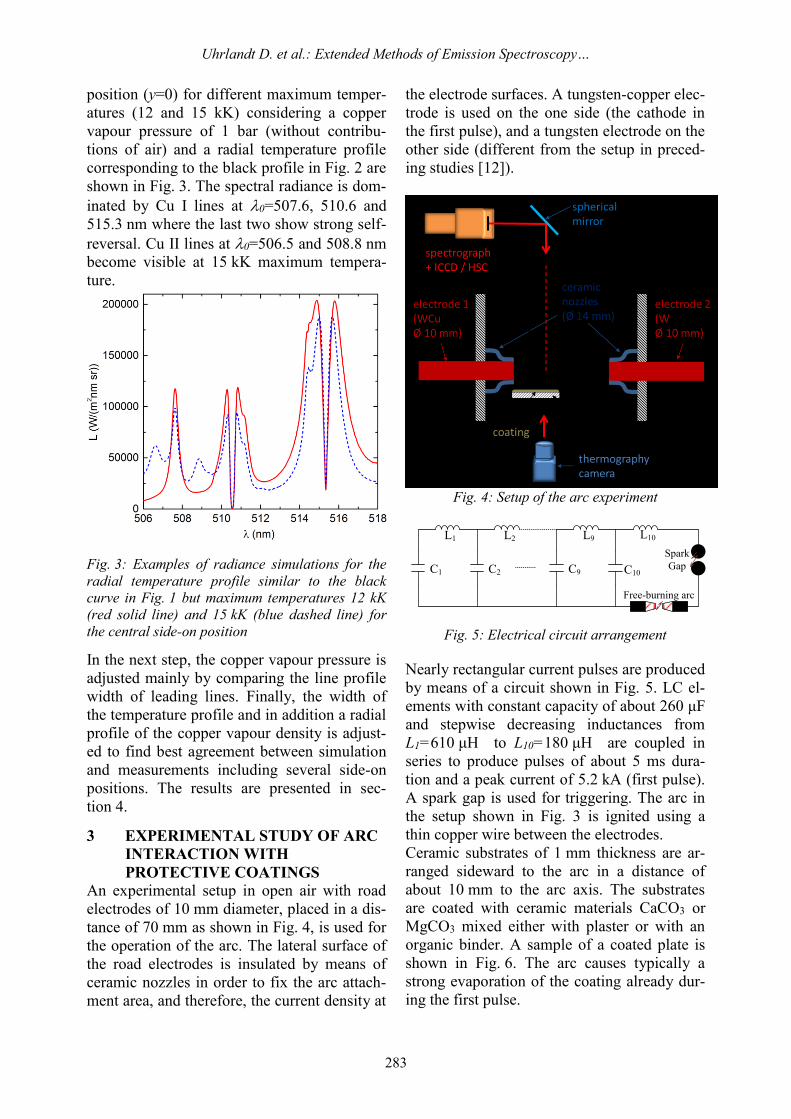
An experimental setup in open air with road
electrodes of 10 mm diameter, placed in a dis-
tance of 70 mm as shown in Fig. 4, is used for
the operation of the arc. The lateral surface of
the road electrodes is insulated by means of
ceramic nozzles in order to fix the arc attach-
ment area, and therefore, the current density at
the electrode surfaces. A tungsten-copper elec-
trode is used on the one side (the cathode in
the first pulse), and a tungsten electrode on the
other side (different from the setup in preced-
ing studies [12]).
Fig. 4: Setup of the arc experiment
L1
C1 C2
L2 L9
C9 C10
L10
Spark
Gap
Free-burning arc
Fig. 5: Electrical circuit arrangement
Nearly rectangular current pulses are produced
by means of a circuit shown in Fig. 5. LC el-
ements with constant capacity of about 260 μF
and stepwise decreasing inductances from
L1=610 μH to L10=180 μH are coupled in
series to produce pulses of about 5 ms dura-
tion and a peak current of 5.2 kA (first pulse).
A spark gap is used for triggering. The arc in
the setup shown in Fig. 3 is ignited using a
thin copper wire between the electrodes.
Ceramic substrates of 1 mm thickness are ar-
ranged sideward to the arc in a distance of
about 10 mm to the arc axis. The substrates
are coated with ceramic materials CaCO3 or
MgCO3 mixed either with plaster or with an
organic binder. A sample of a coated plate is
shown in Fig. 6. The arc causes typically a
strong evaporation of the coating already dur-
ing the first pulse.
Page 5
Uhrlandt D. et al.: Extended Methods of Emission Spectroscopy…
284
Fig. 6: Example of a ceramic substrate coated
with CaCO3 and plaster
Examples of the measured courses of arc cur-
rent, voltage and power are shown in Fig. 7.
Only the first pulse with the maximum power
is considered in the arc analysis. The impacts
of the later pulses on the substrates are ex-
pected to be much lower. The voltage is a
slightly higher in the case with MgCO3 coating
because of the vapour impact on the arc con-
ductivity. However, the variation is compara-
ble with the deviations between experiments
with the same substrate and coating. Hence, a
systematic change of the voltage could not be
determined from the experiments.
Fig. 7: Examples of arc current I, voltage U and
power P for experiments with a ceramic substrate
without coating (green dotted lines) and with
MgCO3 + plaster coating (black solid lines)
The arc radiation is recorded by a spectroscopic
system consisting of a 0.5 m spectrograph either
coupled with an ICCD (for one 2D image in one
experiment) or a HSC (for video spectroscopy). A
spherical mirror is used to image the cross section
of the arc at a distance of 15 mm far from the
electrode (cathode in the first pulse) on the slit of
the spectrograph (see Fig. 3). A 1800 mm-1 grating
is applied to record spectral ranges of 12 nm width
around different wavelength positions (425, 512,
656 and 744 nm). The ICCD is typically triggered
at 4 ms after arc ignition with exposure times
between 1 and 5 μs. The HSC at the spectrograph
is operated typically with a repetition rate of
4000 frames/s.
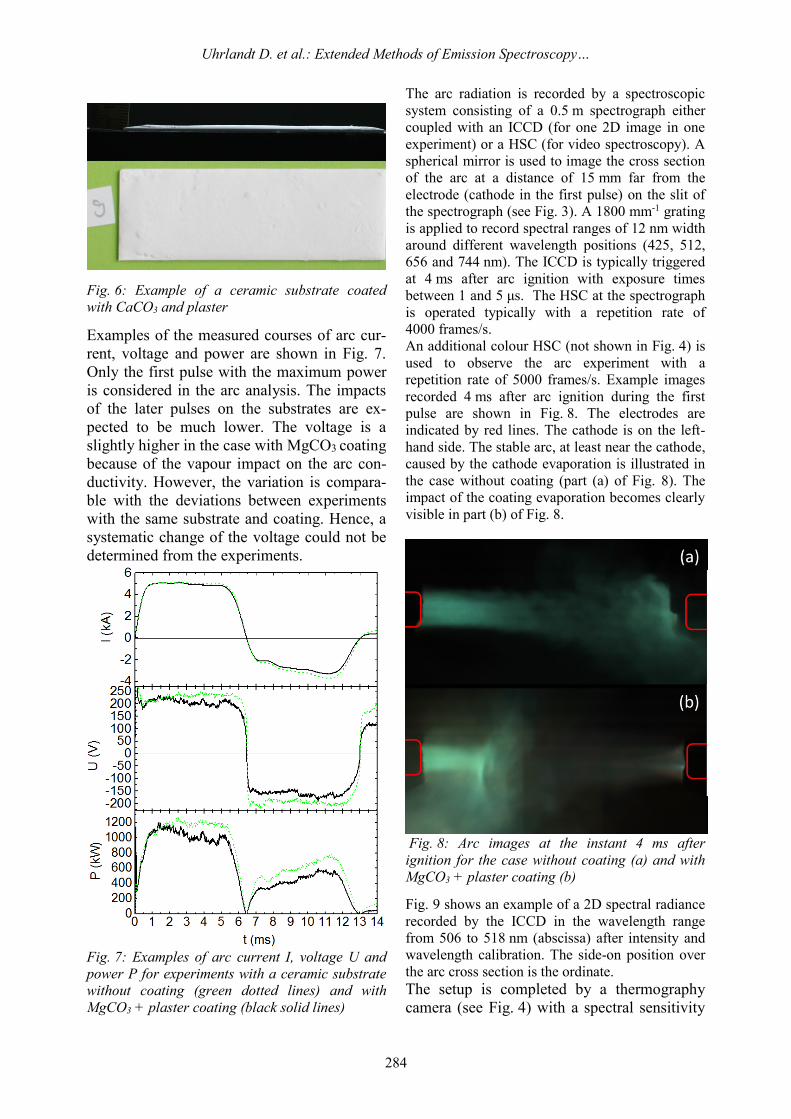
An additional colour HSC (not shown in Fig. 4) is
used to observe the arc experiment with a
repetition rate of 5000 frames/s. Example images
recorded 4 ms after arc ignition during the first
pulse are shown in Fig. 8. The electrodes are
indicated by red lines. The cathode is on the left-
hand side. The stable arc, at least near the cathode,
caused by the cathode evaporation is illustrated in
the case without coating (part (a) of Fig. 8). The
impact of the coating evaporation becomes clearly
visible in part (b) of Fig. 8.
Fig. 8: Arc images at the instant 4 ms after
ignition for the case without coating (a) and with
MgCO3 + plaster coating (b)
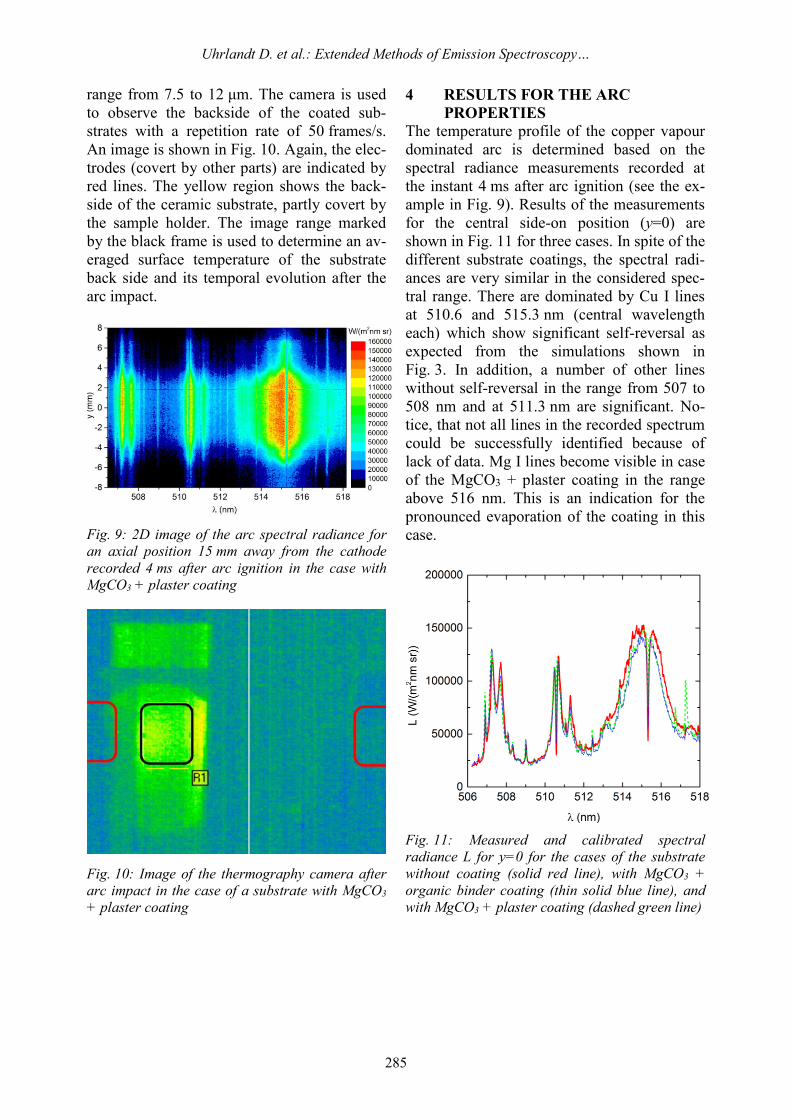
Fig. 9 shows an example of a 2D spectral radiance
recorded by the ICCD in the wavelength range
from 506 to 518 nm (abscissa) after intensity and
wavelength calibration. The side-on position over
the arc cross section is the ordinate.
The setup is completed by a thermography
camera (see Fig. 4) with a spectral sensitivity
Page 6
Uhrlandt D. et al.: Extended Methods of Emission Spectroscopy…
285
range from 7.5 to 12 μm. The camera is used
to observe the backside of the coated sub-
strates with a repetition rate of 50 frames/s.
An image is shown in Fig. 10. Again, the elec-
trodes (covert by other parts) are indicated by
red lines. The yellow region shows the back-
side of the ceramic substrate, partly covert by
the sample holder. The image range marked
by the black frame is used to determine an av-
eraged surface temperature of the substrate
back side and its temporal evolution after the
arc impact.
Fig. 9: 2D image of the arc spectral radiance for
an axial position 15 mm away from the cathode
recorded 4 ms after arc ignition in the case with
MgCO3 + plaster coating
Fig. 10: Image of the thermography camera after
arc impact in the case of a substrate with MgCO3
+ plaster coating
4 RESULTS FOR THE ARC
PROPERTIES
The temperature profile of the copper vapour
dominated arc is determined based on the
spectral radiance measurements recorded at
the instant 4 ms after arc ignition (see the ex-
ample in Fig. 9). Results of the measurements
for the central side-on position (y=0) are
shown in Fig. 11 for three cases. In spite of the
different substrate coatings, the spectral radi-
ances are very similar in the considered spec-
tral range. There are dominated by Cu I lines
at 510.6 and 515.3 nm (central wavelength
each) which show significant self-reversal as
expected from the simulations shown in
Fig. 3. In addition, a number of other lines
without self-reversal in the range from 507 to
508 nm and at 511.3 nm are significant. No-
tice, that not all lines in the recorded spectrum
could be successfully identified because of
lack of data. Mg I lines become visible in case
of the MgCO3 + plaster coating in the range
above 516 nm. This is an indication for the
pronounced evaporation of the coating in this
case.
Fig. 11: Measured and calibrated spectral
radiance L for y=0 for the cases of the substrate
without coating (solid red line), with MgCO3 +
organic binder coating (thin solid blue line), and
with MgCO3 + plaster coating (dashed green line)
Page 7
Uhrlandt D. et al.: Extended Methods of Emission Spectroscopy…
286
Only small deviations in the arc temperature
profiles in the three cases are expected because of
the similarities of the measured radiances.
Therefore, radiation transport calculations as
explained in section 2 are used to determine a
typical arc temperature profile and a typical profile
of the Cu density of the established arc during the
first current pulse. Rotational symmetry is
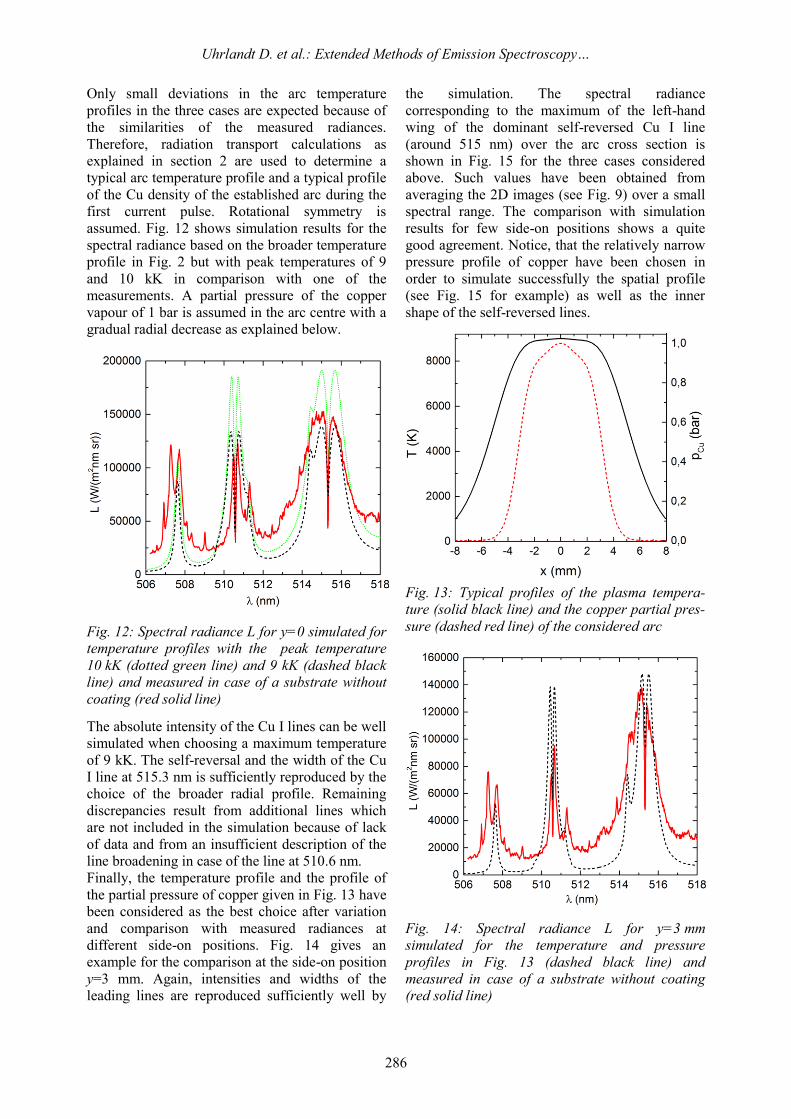
assumed. Fig. 12 shows simulation results for the
spectral radiance based on the broader temperature
profile in Fig. 2 but with peak temperatures of 9
and 10 kK in comparison with one of the
measurements. A partial pressure of the copper
vapour of 1 bar is assumed in the arc centre with a
gradual radial decrease as explained below.
Fig. 12: Spectral radiance L for y=0 simulated for
temperature profiles with the peak temperature
10 kK (dotted green line) and 9 kK (dashed black
line) and measured in case of a substrate without
coating (red solid line)
The absolute intensity of the Cu I lines can be well
simulated when choosing a maximum temperature
of 9 kK. The self-reversal and the width of the Cu
I line at 515.3 nm is sufficiently reproduced by the
choice of the broader radial profile. Remaining
discrepancies result from additional lines which
are not included in the simulation because of lack
of data and from an insufficient description of the
line broadening in case of the line at 510.6 nm.
Finally, the temperature profile and the profile of
the partial pressure of copper given in Fig. 13 have
been considered as the best choice after variation
and comparison with measured radiances at
different side-on positions. Fig. 14 gives an
example for the comparison at the side-on position
y=3 mm. Again, intensities and widths of the
leading lines are reproduced sufficiently well by
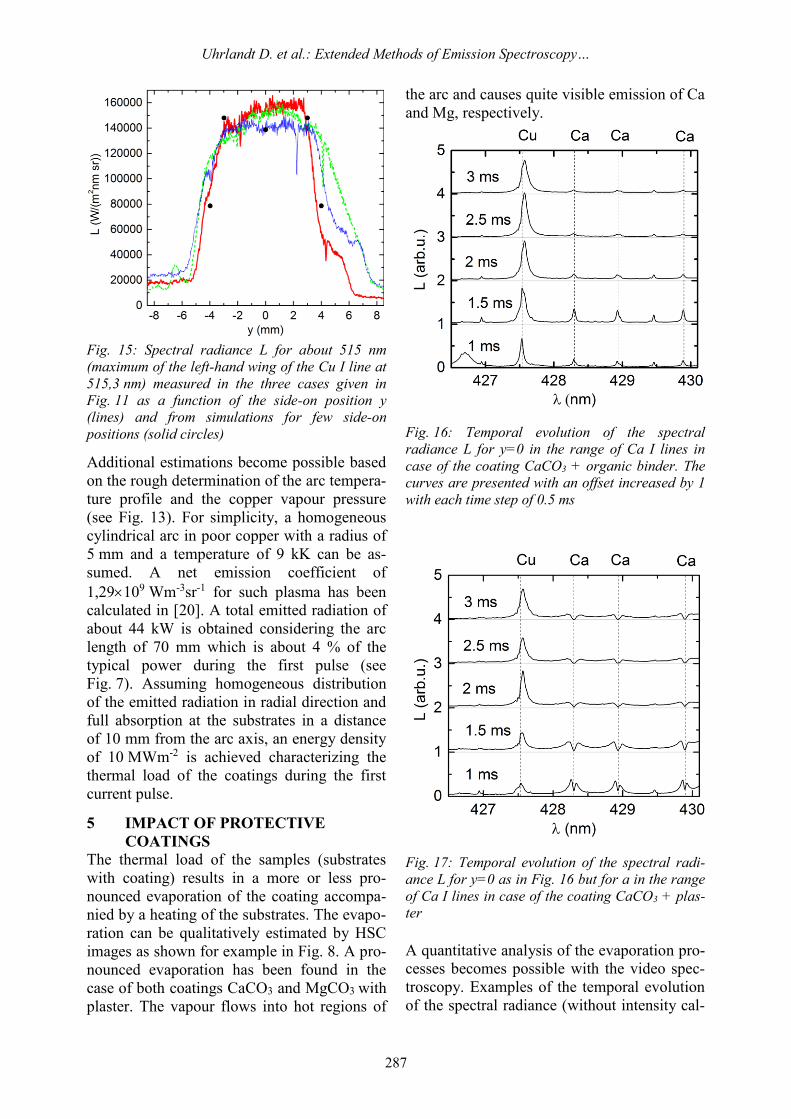
the simulation. The spectral radiance
corresponding to the maximum of the left-hand
wing of the dominant self-reversed Cu I line
(around 515 nm) over the arc cross section is
shown in Fig. 15 for the three cases considered
above. Such values have been obtained from
averaging the 2D images (see Fig. 9) over a small
spectral range. The comparison with simulation
results for few side-on positions shows a quite
good agreement. Notice, that the relatively narrow
pressure profile of copper have been chosen in
order to simulate successfully the spatial profile
(see Fig. 15 for example) as well as the inner
shape of the self-reversed lines.
Fig. 13: Typical profiles of the plasma tempera-
ture (solid black line) and the copper partial pres-
sure (dashed red line) of the considered arc
Fig. 14: Spectral radiance L for y=3 mm
simulated for the temperature and pressure
profiles in Fig. 13 (dashed black line) and
measured in case of a substrate without coating
(red solid line)
Page 8
Uhrlandt D. et al.: Extended Methods of Emission Spectroscopy…
287
Fig. 15: Spectral radiance L for about 515 nm
(maximum of the left-hand wing of the Cu I line at
515,3 nm) measured in the three cases given in
Fig. 11 as a function of the side-on position y
(lines) and from simulations for few side-on
positions (solid circles)
Additional estimations become possible based
on the rough determination of the arc tempera-
ture profile and the copper vapour pressure
(see Fig. 13). For simplicity, a homogeneous
cylindrical arc in poor copper with a radius of
5 mm and a temperature of 9 kK can be as-
sumed. A net emission coefficient of
1,29109 Wm-3sr-1 for such plasma has been
calculated in [20]. A total emitted radiation of
about 44 kW is obtained considering the arc
length of 70 mm which is about 4 % of the
typical power during the first pulse (see
Fig. 7). Assuming homogeneous distribution
of the emitted radiation in radial direction and
full absorption at the substrates in a distance
of 10 mm from the arc axis, an energy density
of 10 MWm-2 is achieved characterizing the
thermal load of the coatings during the first
current pulse.
5 IMPACT OF PROTECTIVE
COATINGS
The thermal load of the samples (substrates
with coating) results in a more or less pro-
nounced evaporation of the coating accompa-
nied by a heating of the substrates. The evapo-
ration can be qualitatively estimated by HSC
images as shown for example in Fig. 8. A pro-
nounced evaporation has been found in the
case of both coatings CaCO3 and MgCO3 with
plaster. The vapour flows into hot regions of
the arc and causes quite visible emission of Ca
and Mg, respectively.
Fig. 16: Temporal evolution of the spectral
radiance L for y=0 in the range of Ca I lines in
case of the coating CaCO3 + organic binder. The
curves are presented with an offset increased by 1
with each time step of 0.5 ms
Fig. 17: Temporal evolution of the spectral radi-
ance L for y=0 as in Fig. 16 but for a in the range
of Ca I lines in case of the coating CaCO3 + plas-
ter
A quantitative analysis of the evaporation pro-
cesses becomes possible with the video spec-
troscopy. Examples of the temporal evolution
of the spectral radiance (without intensity cal-
Page 9
Uhrlandt D. et al.: Extended Methods of Emission Spectroscopy…
288
ibration) in the range of Ca I lines are given in
Figs. 16 and 17 for two kinds of coatings. No-
tice, that the evolution can be followed with a
time step of 0.25 ms, and only few time in-
stants are presented in the Figures. The evolu-
tion of the Cu I line at 42.5 nm can be used to
roughly estimate the intensity of the copper
dominated arc – a small increase during first
microseconds is followed by an almost con-
stant intensity of the Cu I line.
A considerable emission of the Ca I lines is
observed in both cases starting already in the
first microsecond. The decrease of the lines
during next microseconds can be explained
with effects of the gas flow; a further estab-
lishment of the copper vapour flow from the
cathode which displaces the Ca vapour but
also other effects in the Ca vapour flow itself.
Ca lines of increased profile width and some-
times with self-reversal can be seen in the ex-
ample in Fig. 17. This promotes the conclu-
sion that the Ca vapour pressure is much larg-
er in the case of the coating with plaster.
The analysis of the Ca line radiation even in
the case of higher optical thickness can lead to
a quantitative determination of the Ca vapour
and, hence, an estimation of the vapour flow.
Here, the arc temperature profile estimated by
spectrum simulations in the copper-air mixture
can be used as a first step. However, composi-
tion calculations for the full gas mixture re-
sulting from electrode and ceramic coating
evaporation are required for more accurate
determination. The final step would be radia-
tion transport calculations for the Ca lines and
a comparison with the video spectroscopy re-
sults following the approach given above. The
application of such a procedure is scheduled
for further research.
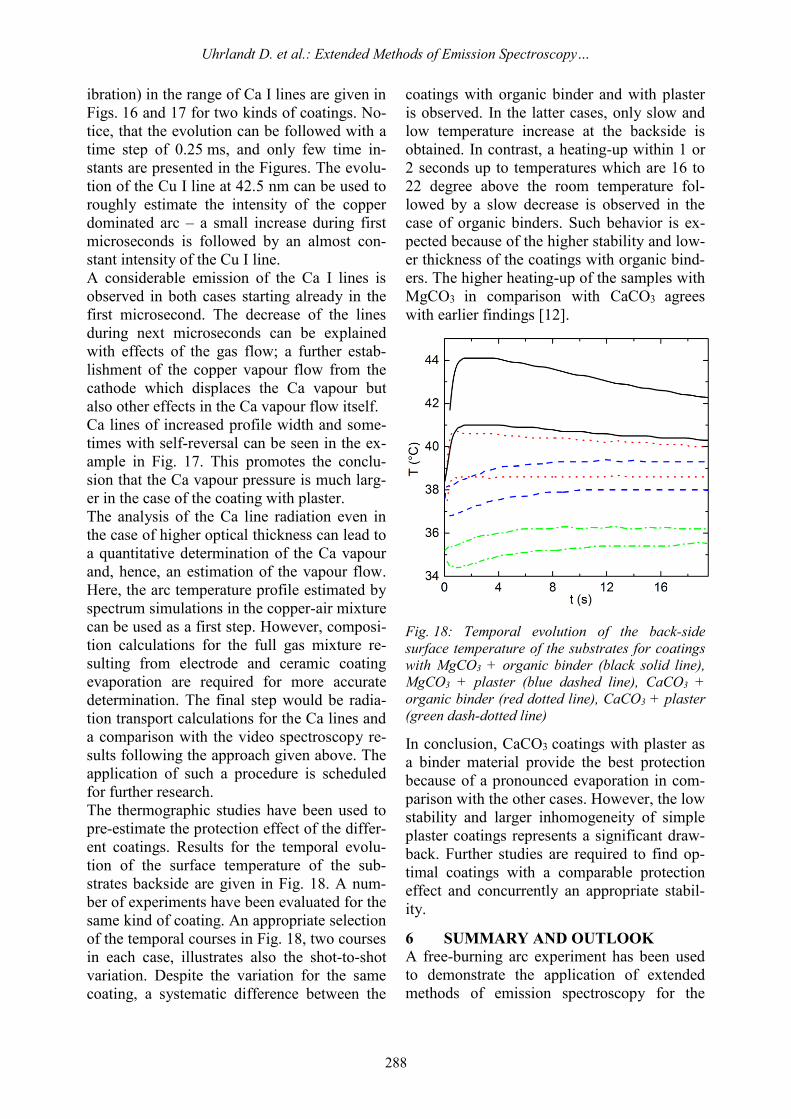
The thermographic studies have been used to
pre-estimate the protection effect of the differ-
ent coatings. Results for the temporal evolu-
tion of the surface temperature of the sub-
strates backside are given in Fig. 18. A num-
ber of experiments have been evaluated for the
same kind of coating. An appropriate selection
of the temporal courses in Fig. 18, two courses
in each case, illustrates also the shot-to-shot
variation. Despite the variation for the same
coating, a systematic difference between the
coatings with organic binder and with plaster
is observed. In the latter cases, only slow and
low temperature increase at the backside is
obtained. In contrast, a heating-up within 1 or
2 seconds up to temperatures which are 16 to
22 degree above the room temperature fol-
lowed by a slow decrease is observed in the
case of organic binders. Such behavior is ex-
pected because of the higher stability and low-
er thickness of the coatings with organic bind-
ers. The higher heating-up of the samples with
MgCO3 in comparison with CaCO3 agrees
with earlier findings [12].
Fig. 18: Temporal evolution of the back-side
surface temperature of the substrates for coatings
with MgCO3 + organic binder (black solid line),
MgCO3 + plaster (blue dashed line), CaCO3 +
organic binder (red dotted line), CaCO3 + plaster
(green dash-dotted line)
In conclusion, CaCO3 coatings with plaster as
a binder material provide the best protection
because of a pronounced evaporation in com-
parison with the other cases. However, the low
stability and larger inhomogeneity of simple
plaster coatings represents a significant draw-
back. Further studies are required to find op-
timal coatings with a comparable protection
effect and concurrently an appropriate stabil-
ity.
6 SUMMARY AND OUTLOOK
A free-burning arc experiment has been used
to demonstrate the application of extended
methods of emission spectroscopy for the
Page 10
Uhrlandt D. et al.: Extended Methods of Emission Spectroscopy…
289
study of arc-wall interactions. Radiation
transport and plasma composition calculations
are used to simulate the spectral radiance of
the arc. The comparison with imaging OES
represents an interesting way to estimate spa-
tial profiles of the arc temperature and species
densities including vapour densities of eroded
material.
Exemplary results have been presented for the
radial arc temperature profile and the profile
of the copper vapour pressure caused by sig-
nificant electrode erosion. The power loss by
the emitted radiation and finally the expected
heat load of sidewalls have been estimated
from these results. The additional analysis of
vapour pressures of eroded wall material, re-
sulting from ceramic layers for example, need
more complex composition and radiation
transport calculations. This will be subject of
future work. The complementary use of video
spectroscopy has been illustrated in the paper.
This enables an interesting way to study the
dynamics of arc temperature and vapour dis-
tributions which allows conclusions on the
evaporation processes.
Simple ceramic coatings represent a specific
option for the heat protection of sidewalls in
switch gear because of the strong evaporation
under impact of arc radiation. A future use
requires additional improvement of coating
techniques and the use of binders.
REFERENCES
[1] Tanaka Y, Yokomizu Y, Ishikawa M, Matru-
mura T, Kito Y, Phys. D: Appl. Phys. 30 (1997)
407-416.
[2] Kozakov R, Kettlitz K, Weltmann KD, Stef-
fens A, Franck CM, J. Phys. D: Appl. Phys. 40
(2007) 2499-2506.
[3] Wiese W L, Spectrochimica Acta 46B (1991)
831-841.
[4] Schneidenbach H, Franke St, J. Phys. D: Appl.
Phys. 41 (2008) 144016.
[5] Wendt M, Franke St, J. Phys. D: Appl. Phys.
41 (2008) 144018.
[6] Seeger M, Tepper J, Christen T, Abrahamson
J, J. Phys. D: Appl. Phys. 39 (2006) 5016-5024.
[7] Lee A, Heberlein J V R, Meyer T N, IEEE
Trans. Components, Hybrids, and Manufacturing
Technol. 8 (1985) 129-134.
[8] Rodriguez P, Didier J, Bernard G, Rowe S,
IEEE Trans. Power Delivery 13 (1998) 480-488.
[9] Tanaka Y, Shinsei N, Amitani K, Uesugi Y,
Wada J, Okabe Sh, IEEE Trans. Plasma Sci. 39
(2011) 2776-2777.
[10] Jonsson E, Runde M, Dominguez G, Friberg
A, Johansson E, IEEE Trans. Power Delivery 28
(2013) 2065-2070.
[11] Onchi T, Yanase H, Yamazaki M, Kuroda M,
Isozaka M, Sugiyama Sh, Hata J, Yonemitsu K,
IEEJ Trans. PE 127 (2007) 692-698.
[12] Uhrlandt D, Gorchakov S, Brüser V, Franke
St, Khakpour A, Lisnyak M, Methling R,
Schoenemann Th, J. Phys.: Conf.Series 550 (2014)
012010.
[13] Franke St, Methling R, Uhrlandt D, Bianchet-
ti R, Gati R, Schwinne M, J. Phys. D: Appl. Phys.
47 (2013) 015202.
[14] Lochte-Holtgreven W, Plasma Diagnostics,
North-Holland Publishing Company, Amsterdam,
1968.
[15] Peytremann E, A&A 17 (1972) 76.
[16] Sahal-Brechot S, Segre ERA, A&A 13 (1971)
161.
[17] Verner D A, Yakovlev D G, A&AS 109
(1995) 125.
[18] Verner D A, Ferland G J, Korista K T,
Yakovlev D G, Astrophys. J. 465 (1996) 487.
[19] Kasyanow W, Starosting A, Sov. Phys. –
JETP 21 (1965) 193.
[20] Cressault Y, Gleizes A, J. Phys. D: Appl.
Phys. 46 (2013) 415206.


![EMISSION SPECTROSCOPY OF DIPOLAR PLASMA SOURCE IN … Yuri Lebedev.pdf · 3.1 0.1 5.4 1010 Emission spectroscopy 410±50 2400±100 Hollow cathode [11] 3.1 10-3 1010 Emission spectroscopy](https://static.documents.pub/doc/80x56/5ec1b7f132d3dc23da50bc71/emission-spectroscopy-of-dipolar-plasma-source-in-yuri-31-01-54-1010-emission.jpg)


