1Eawag, Swiss Federal Institute of Aquatic Science and Technology, DepartmentWater Resources and Drinking Water, 8600 Dübendorf, Switzerland. 2PublicHealth and Environment Division, Department of Biosciences, COMSATS Instituteof Information Technology, Islamabad, Pakistan. 3CAS Key Laboratory of UrbanEnvironment and Health, Institute of Urban Environment, Chinese Academy ofSciences, Xiamen, China. 4Department of Zoology, Mirpur University of Scienceand Technology, Azad Jammu and Kashmir, Pakistan.*Corresponding author. Email: [email protected] (J.E.P.); [email protected] (M.B.)
Podgorski et al., Sci. Adv. 2017;3 : e1700935 23 August 2017
Extensive arsenic contamination in high-pH unconfinedaquifers in the Indus ValleyJoel E. Podgorski,1* Syed Ali Musstjab Akber Shah Eqani,2,3 Tasawar Khanam,2 Rizwan Ullah,4
Heqing Shen,3 Michael Berg1*
Arsenic-contaminated aquifers are currently estimated to affect ~150million people around theworld. However, thefull extent of the problem remains elusive. This is also the case in Pakistan, where previous studies focused onisolated areas. Using anewdata set of nearly 1200groundwater quality samples throughout Pakistan,wehave createdstate-of-the-art hazard and risk maps of arsenic-contaminated groundwater for thresholds of 10 and 50 mg/liter.Logistic regression analysis was used with 1000 iterations, where surface slope, geology, and soil parameters weremajor predictor variables. The hazard model indicates that much of the Indus Plain is likely to have elevated arsenicconcentrations, although the rest of the country is mostly safe. Unlike other arsenic-contaminated areas of Asia, thearsenic release process in the arid Indus Plain appears to be dominated by elevated-pH dissolution, resulting fromalkaline topsoil and extensive irrigation of unconfined aquifers, although pockets of reductive dissolution are alsopresent. We estimate that approximately 50 million to 60 million people use groundwater within the area at risk,with hot spots around Lahore andHyderabad. This number is alarmingly high and demonstrates the urgent need forverification and testing of all drinking water wells in the Indus Plain, followed by appropriate mitigation measures.
ded
on June 8, 2018
http://advances.sciencemag.org/
from
INTRODUCTIONThe trace element arsenic (As) is found throughout Earth’s crust andhydrosphere (1). In particular, arsenic can strongly affect groundwaterquality through natural geogenic leaching processes from host rocksand sediments (2–5). The general geochemical conditions that lead tomobilization of arsenic into groundwater are characterized by one ormore of the following features: reducing (6–8) environments, arid oxi-dizing environments with elevated pH (1, 9, 10), geothermal activity(11, 12) and/or oxidative weathering of sulfideminerals (13, 14). Aquiferswithin Holocene sediments are particularly susceptible to arsenic enrich-ment due to the sediments’ limited time of exposure to groundwaterflushing such that the sediments continue to hold a relative abundanceof mobilizable arsenic within its grains (15, 16). Arsenic concentrationscan also increase due to a lowhydrological gradient, resulting in sluggishgroundwater flow (1), as well as a strongly arid environment that leadsto evaporative concentration (11, 17).
Regular consumption of water containing high concentrations ofarsenic can have adverse health effects, including skin disorders, lungcancer, and cardiovascular diseases (18, 19). In actuality, arsenic-contaminatedwater is one of themost serious global health threats, withcurrently estimated 150million people relying on arsenic-contaminatedgroundwater (5). The permissible concentration of arsenic in drinkingwater set by the World Health Organization (WHO) is 10 mg/liter,whereas the guideline in Pakistan is 50 mg/liter (20).
To determine where best to apply the limited resources for ground-water testing, geostatistical modeling can identify areas likely to beaffected by arsenic contamination by finding statistically significant re-lationshipsmeasured arsenic concentrations and environmental predic-tors (21–25). As opposed to indicator kriging, such an approach takes
into account the relevant physical processes of contaminant release andaccumulation. This also has the advantage of being able to use spatiallycontinuous predictor data sets to identify areas of high arsenic hazard,where groundwater quality data are lacking. Although this method canefficiently predict the occurrence of contamination on a large scale, it isgenerally ineffective at the scale of individual wells due to small-scaleaquifer heterogeneities that are undetectable at the surface. Winkel et al.(25) explored the use of three-dimensional (3D) geological information inmodeling, which, although more accurate, showed that models based on2D geological information can effectively predict elevated concentrationsof arsenic in groundwater.
Here,we investigate andmodel the distributionof arsenic inPakistan,which faces critical water quality challenges. Although microbial con-tamination presents the most immediate health threat and causes one-third of all deaths in the country (20, 26), arsenic and other toxic metalspose a significant health hazard through chronic exposure (27–30).While the full health effects of arsenic in Pakistan are not yet known,various studies over the past decade have uncovered arsenic-related skindisorders (29, 31) and high levels of arsenic in blood and hair samples(32, 33) from people living in predominantly rural areas with high ex-posure to arsenic in groundwater. Food crops in the Sindh (34, 35) andPunjab (ownmeasurements) provinces also indicate a potentially severehealth threat due to plant uptake of arsenic via irrigationwater extractedfrom shallow Holocene aquifers.
Numerous small-scale local studies, generally at the village level,have reportedhigh arsenic concentrations in groundwater up tohundredsof micrograms per liter, primarily in the provinces of Punjab and Sindh(20, 30, 36–41). However, a lack of resources in the country has preventedthe comprehensive evaluation of arsenic in groundwater (30). Consider-able arsenic contamination has also been reported in other South andEast Asian countries, for example, India, Bangladesh, Cambodia, andVietnam (42–46). Shallow small-scale and family-based hand andmo-torized pumps have long been a major source of drinking water in theIndus Plain and are as widespread in Pakistan as in those other arsenic-affected regions of Asia. Higher-volume pumping with tube wellsbecame popular throughout Pakistan in the 1960s and is used primarilynot only for irrigation but also for municipal water supplies (47).
Pakistan is characterized by the flat-lying Indus Plain in the east; theHimalaya, Karakoram, and Hindu Kush mountain ranges in the north;hill regions in the northwest; and the Baluchistan plateau in the west.With the exception of the temperate northwest, the climate is semiaridto arid. The most significant aquifers of the country are found in theIndus Plain, which is composed of up to 300 m of Quaternary alluvialdeposits and permeable soils low in organic content (48), with ground-water yields in the range of 100 to 300 m3/hour to 150-m depth (49).Windblown sands generally dominate in the neighboring desert regions(groundwater yields of 10 to 50 m3/hour), and permeable gravels oflimited extent can be found in the northwest (49). Because of its abun-dant water resources and fertile soils, the Indus Plain of Pakistan hostsextensive agricultural production and a population of over 100 millionpeople, including the major cities of Karachi, Islamabad, Lahore, andHyderabad (Fig. 1). On account of a highly arid climate in the IndusPlain, extensive irrigation uses groundwater resources and awidespreadcanal system that distributes water from the Indus River and its maintributaries across the adjacent plains.
The morphology and age of flat-lying, Holocene fluvial sedimentsalong the Indus River and tributaries are similar to those of the well-known arsenic-affected areas of the Ganges/Brahmaputra Rivers inIndia and Bangladesh (5), the Red River in Vietnam (45), and theMekong River in Cambodia and Vietnam (46). A chemically reducingenvironment generally dominates in the aquifers along these rivers,which is generally due to an abundance of organic material along witha limited supply of oxygen, and results in the desorption of arsenic fromiron oxy(hydr)oxides. Depleted oxygen levels can come about, forexample, due to an impermeable near-surface silt and/or clay layer thatprevents contact of the aquifer with the atmosphere.
Podgorski et al., Sci. Adv. 2017;3 : e1700935 23 August 2017
The aquifers of the Indus Plain, however, are generally unconfinedandhave hydraulic connectivitywith the surface (48, 50). This results, forexample, in a strong connection between surfacewater of the Indus BasinIrrigation System and the underlying aquifer (37, 51). Since the intro-duction of widespread irrigation, the water table has risen significantlywith accompanying waterlogging and groundwater salinization (37).
Rather than being a detailed geochemical investigation, this studyfocuses on risk determination based on our new groundwater qualitydata set and has produced the first-ever statistically based arsenic hazardmodel and health risk map for Pakistan. Furthermore, the main geo-chemical conditions of arsenic releasewere assessed in conjunctionwithvarious environmental variables.
RESULTSGroundwater quality measurementsOur data set of measured arsenic concentrations is displayed in Fig. 1,and 11 othermeasured species are also shown in figs. S1 and S2. Table S1summarizes all of these measurements and well depth. The averagepH is 7.67 ± 0.45, and the average total dissolved solids (TDS) is 556 ±557 mg/liter.
High arsenic concentrations (>10 mg/liter) exist mainly along theIndus River and its tributaries. Very high arsenic concentrations(>200 mg/liter) were measured primarily in the southern half of theIndus Plain. Overall iron concentrations are low, averaging 0.05 ±0.13mg/liter and not exceeding 1.9mg/liter. The highest concentrationof ironmeasured in a water sample with arsenic greater than 10 mg/literis only 0.86mg/liter (table S1). Furthermore, low nitrate levels (average,2.7 mg/liter; median, 1.3 mg/liter) in the wells with arsenic >10 mg/liter
on June 8, 2018sciencem
ag.org/
N
200 km
24°N
26°N
28°N
30°N
32°N
34°N
36°N
62°E 64°E 66°E 68°E 70°E 72°E 76°E
Afghanistan
India
Iran
Lahore
China
Arabian Sea
Chenab
Sutlej
Ravi
Indus
Jhelum
4000
0
2000
Elevation (m)
Islamabad
KarachiHyderabad
Pakistan
Indus
Arsenic ( g/liter)
6–1011–5051–200
≤5
201–500
Fig. 1. Arsenic concentrations measured in Pakistan groundwater. Arsenic exceeds the WHO guideline of 10 mg/liter in large parts of the Indus plain. The green tobrown coloring illustrates the topography. The Indus River and its major tributaries as well as the major cities are indicated. The samples were collected for this study(n = 1184) between 2013 and 2015.
generally imply ongoing nitrate reduction but limited iron-reducingaquifer conditions. Outside of the Indus Plain where arsenic is mostlybelow 10 mg/liter, nitrate concentrations are considerably higher (seefig. S2) and indicative of less reducing aquifer conditions.
Depthwas recorded for ~30%of themeasurements and ranges from3 to 70m (mean, 17m;median, 12m). However, there is no statisticallysignificant correlation between depth and arsenic concentration. Withregard to the other sampling sites, it is generally assumed from localknowledge that depths of family-based wells are in the range of 9 to30 m and thus access the uppermost, unconfined aquifer (37, 48). Forty-one other deeper (>120 m) water samples (not included in the mod-eling) collected fromLahoremunicipal water supply tube wells rangedin arsenic concentration from <1 to 85 mg/liter (average, 23 mg/liter;median, 25 mg/liter), despite the use of arsenic filters with these watersources.
Hazard probability modelIn total, 232 of the 1000 logistic regression runs did not pass theHosmer-Lemeshowgoodness-of-fit test (52), leaving 768 runs fromwhich a singleset of coefficients was calculated. Of the nine variables used in the logisticregressions, the following were retained by stepwise selection: fluvisols,Holocene fluvial sediments, slope, soil organic carbon, and soil pH. Theaverageweighted coefficients based onnormalized variables are listed intable S2. Steeper slopes (>0.1°) and soil organic carbon were negativeindicators (inverse correlation) of high arsenic levels in groundwater,whereas fluvisols, soil pH, and Holocene fluvial sediments were posi-tive indicators (positive correlation). With the exception of soil or-ganic carbon, the number of variables that passed the goodness-of-fittest is nearly equal.
The plots in Fig. 2 summarize the classification strength of themodelat different cutoff values, which helps in finding the best cutoff to opti-mize the rates of correct positive and negative classification. Figure 2Ashows the receiver operating characteristic (ROC) curve (53) using theentire data set of 743 aggregated points (original measurements aver-aged into 1-km × 1-km pixels). The area under the ROC curve (AUC)(possible values between 0.5 and 1) is 0.80, which shows that the logisticregression does a good job of correctly classifying high and low arsenicconcentrations (TheROCandAUC indicate amodel’s classification ratesof high and low values at different probability cutoff values). Figure 2Bplots accuracy, sensitivity (true-positive rate), and specificity (true-negative
Podgorski et al., Sci. Adv. 2017;3 : e1700935 23 August 2017
rate) against cutoff, the latter two being equal at a cutoff of 0.60. Themodeled arsenic probability map is shown in Fig. 3A, with the binarydata points of measured arsenic concentrations used in the analysisbeing plotted. Table 1 compares the AUC and Akaike informationcriterion (AIC) (see Materials and Methods) (54) of the final modelwith other logistic regression analyses using manually selected, fixedpredictor variables.
Health risk modelCombining the area of high hazard (≥60% probability) in Fig. 3A withpopulation figures for 2016 indicates that approximately 88millionpeoplelive within the modeled hazard area. The population figures were cal-culated using census data from 2010 (55) multiplied by subsequent an-nual population growth rates (56). Using the assumption that about 60to 70% of the population throughout Pakistan relies on groundwaterfor its drinking water (57, 58), this number reduces to ~50 million to60 million people potentially affected (Fig. 3B). Furthermore, arsenicremediation is minimal in rural areas (20, 30), and our study showedthat remediation in the municipal water supply system of the urbancenter of Lahore is onlymoderately effective inmeeting the local arsenicconcentration standard (57%of samples below50 mg/liter) and does notattain the WHO standard (1% of samples below 10 mg/liter).
The above analysiswas also carried out using a threshold of 50mg/liter(fig. S3B and table S3), which is Pakistan’s official health guideline forarsenic in drinking water. Although the probabilities of exceeding thisguideline are lower, the cutoff where sensitivity and specificity are equalis also lower (fig. S5). Since less than 10% of the measured data pointshave concentrations between 10 and 50 mg/liter, the physical area en-compassing this range of concentrations is small and the number ofpeople potentially affected by arsenic-contaminatedwater ultimately re-mains approximately 50 million to 60 million (fig. S6).
DISCUSSIONpH-induced arsenic release and accumulation inunconfined aquifersAnalysis of data points with As > 10 mg/liter suggests that reducingconditions are generally not dominant in the Indus Plain, with nitrateaveraging 2.7 mg/liter and ranging up to about 28mg/liter (figs. S1 andS2 and table S1). The average dissolved concentration of iron (Fig. 4A
Fig. 2. Statistics of the classification strength of the logistic regression analysis results using the threshold of 10 mg/liter (WHO As guideline) applied to the entireset of 743 aggregated data points. (A) ROC curve with an AUC of 0.80, which indicates the discriminative power of the logistic equation. (B) Sensitivity (true-positiverate), accuracy, and specificity (true-negative rate) versus cutoff value.
Fig. 3. Arsenic prediction and risk models. (A) Probability (hazard) map of the occurrence of arsenic concentrations in groundwater exceeding the WHO As guidelineof 10 mg/liter along with the aggregated arsenic data points used in modeling (n = 743) (see fig. S3B for the hazard map using 50 mg/liter). (B) Density of population atrisk of high levels of arsenic in groundwater using the WHO As guideline of 10 mg/liter. Figure was based on 2016 population figures and a 60 to 70% groundwaterutilization rate (see text). The estimated number of people potentially affected is ~50 million to 60 million, with hot spots around Lahore and Hyderabad.
Podgorski et al., Sci. Adv. 2017;3 : e1700935 23 August 2017 4 of 10
and table S1) in high-arsenic samples is low at 0.09 mg/liter, and higharsenic concentrations are negatively correlated (R = −0.778; Table 2)with soil organic carbon (Fig. 4B). However, some areas do locallyshow a high correlation between high arsenic and iron, suggesting areducing environment.
Podgorski et al., Sci. Adv. 2017;3 : e1700935 23 August 2017
http://advancD
ownloaded from
Thepercentage of high values of arsenic (>10mg/liter) correlates verystrongly with soil pH (R = 0.977; Fig. 4C), which is consistently elevatedthroughout the Indus Plain (Fig. 4D). This implies pH-induced de-sorption and corroborates the findings of Farooqi et al. (51) for a sitenear Lahore, Punjab. Although soil pH throughout the Indus Plain isgenerally between 8.0 and 8.5, the average pH of groundwater sampleswith arsenic concentrations greater than 10 mg/liter is only 7.6, with nosignificant correlation. This indicates that arsenic release due to high-pHdesorption may be occurring predominantly in the uppermost sedi-ments before being transported downward via infiltration to the aquifer.Depth is not correlated with arsenic concentration over the range ofavailable depthmeasurements (3 to 70m)of the unfilteredwater samplesused in modeling, and, as previously mentioned, deeper (>120 m)municipal tube wells from Lahore, which are filtered for arsenic, alsoexhibit elevated arsenic concentrations.
Aridity (precipitation/PET) is also well correlated with high arsenicvalues (R = −0.779; Table 2), which is consistent with the process ofevaporative concentration as suggested by Rasool et al. (59) for Mailsi,Punjab and by Brahman et al. (40) for the Tharparkar District, Sindh.The latter study also found a predominance of theAs(V) species relativeto the reduced As(III) species. The very strong correlation of irrigatedarea with arsenic contamination (R = 0.967; Table 2) could be a conse-quence of the role of irrigation in evaporative concentration and/or soilalkalization with associated arsenic desorption. Although these findingare consistent with arsenic release caused by oxidizing and/or elevated-pH dissolution, the process of reductive dissolution may be responsi-ble locally, particularly as a result of industrial or human/animal organicwaste in urban areas (37) or intensive agricultural activity.
on June 8, 2018es.sciencem
ag.org/
1.0
3.02.52.01.5
g/kg
Soil org. C
N200 km
34˚N
24˚N
62˚E 70˚E
<0.20.2–0.50.5–1.01.0–1.88
Fe
mg/liter
N200 km
34˚N
24˚N
62˚E 70˚E
6.5
8.58.07.57.0
Soil pH
N200 km
34˚ N
24˚ N
62˚E 70˚E
7.5 8.0 8.5 9.0
0.0
0.2
0.4
0.6
0.8
1.0
% A
s m
easu
rem
ents
> 1
0 g/
liter
soil pH
R = 0.977P = 2.41 × 10⁻⁷
7.5 8.58.0 9.0
020
4060
8010
0
A
C D
B
As measurements10 µg/liter
>10 µg/liter
Fig. 4. Indicators of geochemical environment. (A) Measured iron concentrations (n = 458). (B) Soil organic carbon (70) used as a predictor variable. (C) Correlation ofgroundwater samples exceeding the WHO As guideline of 10 mg/liter against soil pH (in 11 bins; see Materials and Methods). (D) Soil pH (70) used as a predictorvariable, shown with the arsenic measurements above and below 10 mg/liter.
Table 1. Comparison of AUC and AIC results of logistic regressionanalyses of models with fixed variables (models A to E) along withthe final model (model F) shown in Fig. 3A, which was achievedby stepwise variable selection. A higher AUC shows better modelprediction performance, whereas a lower AIC is indicative of a simpler,more effective model. The associated hazard maps are provided infig. S4.
Podgorski et al., Sci. Adv. 2017;3 : e1700935 23 August 2017
ohttp://advances.sciencem
ag.org/D
ownloaded from
n June 8, 2018
Model proxiesThe relationships between the predictor variables and the process ofarsenic enrichment in groundwater are generally straightforward. Aflat surface topography, such as in the Indus Plain, implies a low hydrau-lic gradient resulting in sluggish groundwater flow, thereby allowingarsenic concentrations to gradually increase in the groundwater. Highsoil pH can drive arsenic desorption and is indicative of an evaporativeenvironment, which further raises arsenic concentrations.
The data set of predicted fluvisols (young alluvial sediments) indicatesan environment similar to that of Holocene sediments but specifically in-dicates an alluvial setting. As such, it could be an effective predictor var-iable where geological maps do not specify the Holocene epoch. Highlevels of soil organic carbon are a common driver of reducing conditionsresulting in arsenic release (5). The inverse relationship in our modelappears to be a consequence of the presence of an arid climate result-ing in minimal natural growth of vegetation and accumulation of organiccarbon in the soil of the Indus Plain, which leaves the other factorsmentioned to be responsible for the enrichment of arsenic. This furtherimplies that reducing conditions are not predominant in the Indus Plain.
By design, the stepwise method of variable selection produces themodel with the best combination of model simplicity and likelihood,as measured by the AIC. After our initial identification of potentialpredictor variables (see Materials and Methods), the stepwisemethod was allowed to automatically identify the final set of predic-
tors. To test the efficacy of this approach, we ran other logistic analy-ses using fixed combinations of variables that would be expected toeffectively predict elevated arsenic concentrations based on theirknown relationships or associations with arsenic enrichment ingroundwater. These results (Table 1) confirm that the stepwisemethod of variable selection in this case produces a statistically supe-riormodel to that whichmay be achieved bymanually selecting varia-bles based only on expert knowledge. In any case, the hazard mapsproduced using these fixed selections of variables are largely similarin that they place the highest probability of high arsenic enrichmentin the Indus Plain (fig. S4).
These results highlight the fact that the variables used generally havetheir highest absolute values, and therefore greatest effect on resultantmodels, in the Indus Plain. However, independence and causality arenot clear, particularly with regard to irrigation. For example, the strongpositive correlation of high arsenic concentrations and irrigated area(R = 0.967; Table 2), as well as the relatively good performance of thelogistic regression using only irrigated area (Table 1, model B), couldsimply be a coincidence of extensive irrigation being carried out on flatfluvial sediments, where there is a regular supply of water and nutri-ents from the rivers, as well as a high demand for irrigation due to veryarid conditions. However, it appears reasonable that the increasedevapotranspiration from irrigation water as well as its slow infiltrationthrough the alkaline topsoil and young alluvial sediments may con-tribute to an increase in groundwater arsenic concentration.
Implications of hazard and risk modelsThe riskmapof Fig. 3B showcases the severity of the problemof ground-water arsenic contamination in Pakistan. Regardless of using a modelbased on a guideline of 10 or 50 mg/liter (fig. S3), the area of high prob-ability of arsenic contamination encompasses most of the Indus Plainin the province of Sindh and around the Indus tributaries in the provinceof Punjab (Jhelum, Chenab, Ravi, and Sutlej rivers), where populationdensities are particularly high. Although the estimate of 60 to 70%groundwater utilization is only a rough estimate based on availablepublished figures and subject to potentially large regional variations,it remains clear that a great number of people are potentially exposed todangerously high levels of arsenic. Our estimate of ~50 million to60 million people potentially affected in the Indus Plain is as high asthat for the Ganges-Brahmaputra Delta in Bangladesh and India(~50 million) (3, 42, 60) and exceeds that for China (~20 million) (24)and the Red River Delta in Vietnam (~7 million) (25). Furthermore,our estimate is about four times higher than that of Rabbani et al. (36)for the Indus River, which did not consider its tributaries in denselypopulated Punjab province and was made on the basis of distancefrom the river in a ~120-km × 40-km area in Sindh province. In addi-tion, there are pockets of high measured arsenic concentrations withinthe Indus Plain that fall just below the statistically determined 60%probability cutoff used to calculate high-risk areas, which, if anything,wouldmake our estimate somewhat conservative and only further high-lights the severity of the problem.
First and foremost, the risk map indicates the need for widespreadtesting of drinking water wells in the Indus Plain to help safeguard thelong-term health of its population. Because of an inherent high degree ofsmall-scale spatial variability of geogenic arsenic contamination (61–63),wells should be tested individually so thatmeasures can be implementedfor those most severely affected.
Mitigation requires action at several levels, including awareness rais-ing, emergency solutions, coordination of government and financial
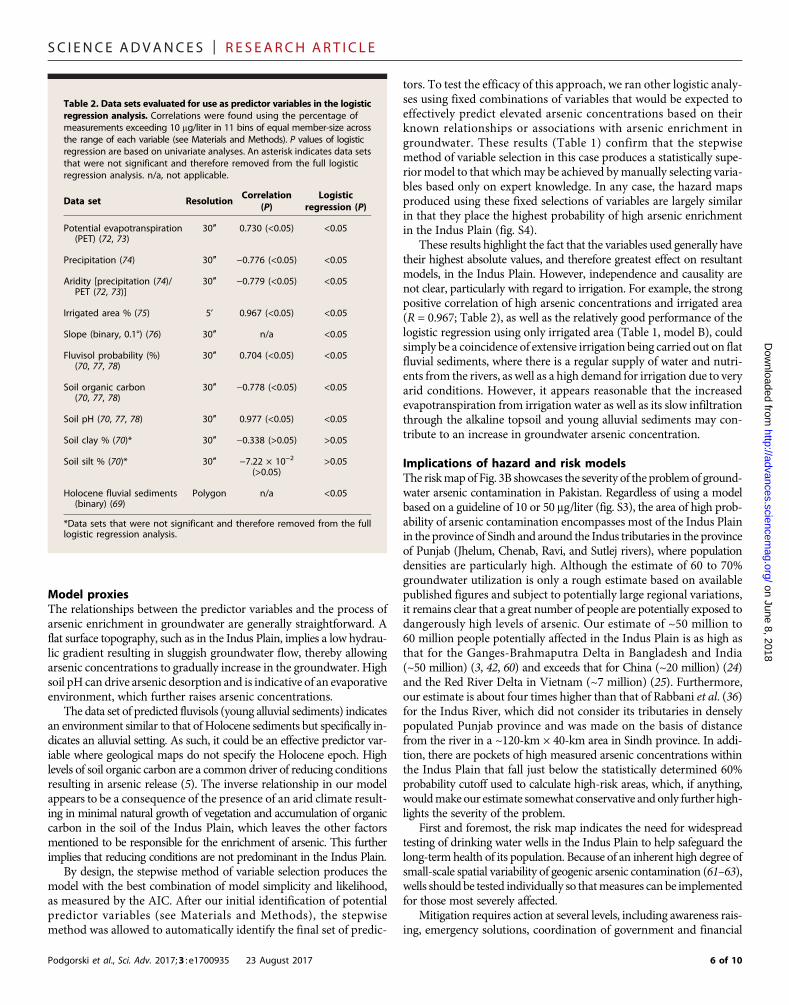
Table 2. Data sets evaluated for use as predictor variables in the logisticregression analysis. Correlations were found using the percentage ofmeasurements exceeding 10 mg/liter in 11 bins of equal member-size acrossthe range of each variable (see Materials and Methods). P values of logisticregression are based on univariate analyses. An asterisk indicates data setsthat were not significant and therefore removed from the full logisticregression analysis. n/a, not applicable.
Data set R
esolution Correlation
(P)
Logistic
regression (P)
Potential evapotranspiration(PET) (72, 73)
30″
0.730 (<0.05) <0.05
Precipitation (74)
30″ − 0.776 (<0.05) <0.05
Aridity [precipitation (74)/PET (72, 73)]
30″ −
0.779 (<0.05) <0.05
Irrigated area % (75)
5’ 0.967 (<0.05) <0.05
Slope (binary, 0.1°) (76)
30″ n/a <0.05
Fluvisol probability (%)(70, 77, 78)
30″
0.704 (<0.05) <0.05
Soil organic carbon(70, 77, 78)
30″ −
0.778 (<0.05) <0.05
Soil pH (70, 77, 78)
30″ 0.977 (<0.05) <0.05
Soil clay % (70)*
30″ − 0.338 (>0.05) >0.05
Soil silt % (70)*
30″ −7.22 × 10⁻²
(>0.05)
>0.05
Holocene fluvial sediments(binary) (69)
Polygon
n/a <0.05
*Data sets that were not significant and therefore removed from the fulllogistic regression analysis.
support, health intervention programs, alternative resources of drink-ingwater (for example, deepwells) (41, 64), and arsenic removal options(41, 65, 66). Ultimately, any treatment optionsmust be socially accept-able and tailored to the local groundwater composition (67).
on June 8, 2018http://advances.sciencem
ag.org/D
ownloaded from
MATERIALS AND METHODSGroundwater samplingBetween 2013 and 2015, groundwater sampleswere collected from1184sites throughout the country, mainly from hand and motor pumps aswell as municipal and agricultural water supply tube wells. The siteselection of sampling was designed to be evenly spatially distributedand was based on individual union council/tehsil (sub-administrativegovernmental units), for which topographical district maps obtainedfrom the Survey of Pakistan were used.
To obtain representative samples of groundwater, we purged handpumps with one stroke for every 30 cm of depth and ran electric pumpsfor 10 min before sampling. Groundwater samples were then immedi-ately filtered on-site using 0.45-mm cellulose acetate filters contained inMillipore Sterivex syringe capsules. During fieldwork, representativesamples were carefully handled to help ensure high quality of subse-quent analyses and reduce cross contamination during sampling. Pre-cleaned 1-liter polyethylene bottles were used for sample collection. Allbottles were first rinsed with deionized water before sampling, and twoaliquots of each sample (acidified and non-acidified) were taken on site.For acidified samples used for the analysis of arsenic (As) and othertracemetals, a fewdrops of concentrated nitric acid (HNO3)were addedto reduce the pHof water samples to <2. The basic water quality param-eters of pH, electrical conductivity (EC), bicarbonate (HCO3
−), TDS,sulfate (SO4
−), nitrate (NO3−), chloride (Cl−), and fluoride (F−), as well
as the elements calcium (Ca), magnesium (Mg), and iron (Fe) were alsomeasured (figs. S1 and S2). pH, temperature, dissolved oxygen (DO),and EC were measured at the time of sample collection, as were thegeographical coordinates, usingGPS (Global Positioning System). pH,EC, DO, and TDS of all water samples were measured using a W2015pH/EC meter and a DO meter (Sinowell). The sealed samples werestored at 4°C in portable coolers before transportation to the laboratoryfor further analysis.
Groundwater samples were analyzed for calcium (Ca2+) andmagnesium (Mg2+) by volumetric titration with EDTA (0.05 mol/liter)and alkalinity (measured as HCO3) by volumetric titration with0.1 HCl. NO3
− was determined spectrophotometrically using anultraviolet-visible (UV-Vis) spectrophotometer (Shimadzu, modelUV 1601) at a wavelength of 220 nm. SO4
2− values were determinedby gravimetric analysis as BaSO4. Chloride (Cl
−) was determined bytitration (American Public Health Association 1998). Fluoride wasmeasured using an ion chromatograph (ICS-3000, Thermo Fisher).
Arsenic and other elements were analyzed in the acidified sampleswith an Agilent 7500cx inductively coupled plasma mass spectrometer.Calibration solutions were prepared using multi-element stock solu-tions of 100 ppm (parts per million). The operating conditions wereas follows: radio frequency power at 1510 W, carrier gas at 1.1 liter/min,makeup gas at 0.10 liter/min, heliumgas flow at 3.5ml/min, andnebulizerpump at 0.1 rps. The standard stock solutions mixed with elements(100 mg/ml; GSB 04-1767-2004) were obtained from theNational Centerof Analysis and Testing for Nonferrous Metals and Electronic Materials.
A quality control (QC) sample was prepared and injected after every15th sample to check instrument stability. TheQC samplewas preparedby mixing aliquots of each sample and was therefore representative of
Podgorski et al., Sci. Adv. 2017;3 : e1700935 23 August 2017
the entire sample set. There was less than 15% variation in the metalconcentrations of the QC samples. Spiked samples were also preparedin the same manner as the water samples. Some samples were spikedwith As and other elements before analysis at the final two levels of 10and20ng/ml.Moreover, to confirmanalytical performance andadequateprecision, we used standard reference solutions of analytical-gradechemicals with 99.9% spectroscopic purity (Merck). Twice-distilledwater was used throughout the analyses. By means of blank and dupli-cate samples, reproducibility of the analytical data was found to bewithin 5% and the analytical errorwas estimated to be <10%.Workingsolutions were prepared on a daily basis by appropriate dilution ofa standard stock solution with a mixture of 65% HNO3 and H2O[1:3 (v/v)]. The order in which all samples were run was randomizedso as to reduce the error from any injection of artifacts or changes ininstrument sensitivity during the analysis sequence.
Statistical modelingBecause it is of primary importance whether or not the arsenic concen-tration in groundwater poses a health hazard,we used logistic regressionanalysis to model arsenic concentration in groundwater being above orbelow the WHO guideline of 10 and 50 mg/liter. We used our owngroundwater quality data (n= 1184) as well as those from the previouslymentioned studies (20, 30, 37–41, 51, 59), which constitute 69 additionalsamples in total.
The data were first aggregated into 1-km squares by taking thegeometric mean of measurements falling within each square, whichresulted in 743 data points. The 1-km × 1-km dimensions correspondto the finest resolution (30″) of data set used in the logistic regressionanalysis (Table 2). Because the measured arsenic concentrations ingroundwater were used as the dependent variable in the logistic regres-sions, they were assigned the value of 1 if the concentration is greaterthan theWHO guideline of 10 mg/liter (49.8% of data points) or 0 if theconcentration is less than or equal to 10 mg/liter (50.2% of data points).
Logistic regression uses a logistic function, which takes on inde-pendent variables that can range between negative infinity and positiveinfinity and produces an outcome between 0 and 1 (52)
P ¼ 11þ e�t
ð1Þ
where 0 ≤ P ≤ 1, and
t ¼ b0 þ b1x1 þ b2x2 þ…þ bnxn ð2Þ
where x1 … xn are the independent variables and b1 … bn are thecorresponding regression coefficients. P is interpreted as the prob-ability of the dependent variable being 0 or 1. Logistic regressionanalyses were conducted using the generalized linear model functionof R (68).
To aid comparison of different analyses, the AIC (54) provides a rel-ative comparison in terms of the trade-off between complexity andgoodness of fit
AIC ¼ 2k� 2 lnðLÞ ð3Þ
where k is the number of parameters and L is the likelihood. For a givensuite of analyses, the one with the lowest AIC provides the best combi-nation of modeling performance and simplicity.
Variable selectionEleven predictor variables were considered for use in the logistic regres-sions (Table 2). These includedPET, precipitation, aridity (precipitation/PET), temperature, irrigated land area, surface slope, the probability offluvisols, soil organic carbon, soil pH, clay content, silt content, andHolocene fluvial sediments. All variables were continuous except forslope (binary above or below 0.1°) and the existence of Holocene fluvialsediments. The latter was taken from the Geological Map of Pakistan(69) and divided into two sections: (i) Holocene streambed, floodplain,and fluvial terrace sediments and (ii) all otherQuaternary andolder units(fig. S7E). This differentiation was based on the prevalence of elevatedarsenic concentrations in Holocene fluvial sediments (1, 23, 24, 45). Theother variables were chosen for their direct or indirect relationship to theprocess of arsenic enrichment in groundwater. For example, surfacetopography may be related to the groundwater flow rate, and the soilparameters, estimated at 1.5-mdepth (70), are assumed to have an effectat least on shallow aquifers (51).
To help identify effective predictor variables for logistic regression,we calculated linear (Pearson) correlations between each of the contin-uous variables and the occurrence of high arsenic concentrations(Table 2 and fig. S8). These were made using the percentage of arsenicmeasurements greater than 10 mg/liter for 11 bins across the range ofeach independent variable. The number of bins was determined usingSturges’ formula (71), and thebinwidthwasvaried tohaveeachbincontainthe samenumber ofmembers. The datawere consolidated as such to focuson the fundamental criterion of whether or not the concentration of ar-senic poses a health hazard. In addition, a univariate logistic regressionwas run with each variable, and the significance of the coefficient wasassessed through its P value (Table 2). On the basis of the evaluation ofP values from both analyses at the 95% confidence level (P= 0.05), claycontent and silt content were removed from further consideration.
Logistic regression analysisThe data set was randomly divided into subsets of 80% for training and20% for testing. Logistic regression analysis was then run on the trainingsubset using a stepwise selection of variables (both directions), whichremoves or adds variables based on their improvement to the AIC.The result was then applied to the testing subset, and the Hosmer-Lemeshow goodness-of-fit test (52) was used to indicate the accuracy ofpredictions against the testing subset at the 95% confidence level. Toavoid introducing bias due to the particular selection of training andtesting subsets, we repeated this process 1000 times. Analyses wereretained if they passed the Hosmer-Lemeshow goodness-of-fit test,and these results were used as a weighting in averaging the variablecoefficients. If an analysis did not contain a certain variable, a zerowas used instead. This technique provided stability to the final modeland emphasized parameters that more strongly predict the occurrenceof high arsenic concentrations.
The performance of the final set of averaged coefficients was eval-uated on the entire data set by plotting sensitivity (rate of true positives,or success rate of predicting high concentrations) against specificity(rate of true negatives, or success rate of predicting low concentrations)for all possible cutoff levels in an ROC curve (53). The AUC was thencalculated to evaluate the performance of the logistic regression (Fig.2A). The AUC indicates the ability of a model to correctly classify pos-itive and negative cases and generally ranges from 0.5 to 1, where 0.5corresponds to an analysis that predicts the data no better than woulda random selection and 1 corresponds to an analysis that perfectly pre-dicts the observations.
Podgorski et al., Sci. Adv. 2017;3 : e1700935 23 August 2017
For comparison, other logistic regression analyses (using a thresholdof 10 mg/liter)were runusing fixed combinations of variables thatwouldbe expected to effectively predict elevated arsenic accumulation. Thesewere also run 1000 times, and the coefficients of the analyses passing theHosmer-Lemeshow goodness-of-fit test were combined in a weightedaverage using the test results.
Generation of hazard and risk modelsThe coefficients of the final logistic regression were used to generate ahazard probability map of groundwater arsenic concentrations exceed-ing either 10 or 50 mg/liter. The cutoff to distinguish between areas ofhigh and low hazard was selected where the sensitivity and specificity ofthe analysis are equal (Fig. 2B).
SUPPLEMENTARY MATERIALSSupplementary material for this article is available at http://advances.sciencemag.org/cgi/content/full/3/8/e1700935/DC1fig. S1. Maps of spatial distribution and values of all chemical parameters.fig. S2. Grids of all measured chemical parameters.fig. S3. Hazard maps of logistic regression models using thresholds of 10 and 50 mg/liter.fig. S4. Maps of other well-fitting logistic regression models.fig. S5. Statistics of logistic regression model using threshold of 50 mg/liter.fig. S6. Density of population at risk using logistic regression models with thresholds of 10 and50 mg/liter.fig. S7. Predictor data sets used in the final model.fig. S8. Graphs of correlation between predictor variables and percentage of As measurements>10 mg/liter.table S1. Summary statistics of all measured parameters.table S2. Coefficients, SDs, and frequencies of predictor variables in logistic regressions with athreshold of 10 mg/liter.table S3. Coefficients, SDs, and frequencies of predictor variables in logistic regressions with athreshold of 50 mg/liter.
REFERENCES AND NOTES1. P. L. Smedley, D. G. Kinniburgh, A review of the source, behaviour and distribution of
arsenic in natural waters. Appl. Geochem. 17, 517–568 (2002).2. P. Bhattacharya, D. Chatterjee, G. Jacks, Occurrence of arsenic-contaminated
groundwater in alluvial aquifers from delta plains, Eastern India: Options for safedrinking water supply. Int. J. Water Resour. Dev. 13, 79–92 (1997).
3. R. Nickson, J. McArthur, W. Burgess, K. Matin Ahmed, P. Ravenscroft, M. Rahman, Arsenicpoisoning of Bangladesh groundwater. Nature 395, 338 (1998).
4. J. M. McArthur, D. M. Banerjee, K. A. Hudson-Edwards, R. Mishra, R. Purohit, P. Ravenscroft,A. Cronin, R. J. Howarth, A. Chatterjee, T. Talukder, D. Lowry, S. Houghton, D. K. Chadha,Natural organic matter in sedimentary basins and its relation to arsenic in anoxic groundwater: The example of West Bengal and its worldwide implications. Appl. Geochem.19, 1255–1293 (2004).
5. P. Ravenscroft, H. Brammer, K. Richards, Arsenic Pollution: A Global Synthesis (John Wiley &Sons, 2009), vol. 28.
6. R. T. Nickson, J. M. McArthur, P. Ravenscroft, W. G. Burgess, K. M. Ahmed, Mechanism ofarsenic release to groundwater, Bangladesh and West Bengal. Appl. Geochem. 15,403–413 (2000).
7. C. B. Dowling, R. J. Poreda, A. R. Basu, S. L. Peters, P. K. Aggarwal, Geochemical study ofarsenic release mechanisms in the Bengal Basin groundwater. Water Resour. Res. 38,12-1–12-18 (2002).
8. M. Berg, P. T. K. Trang, C. Stengel, J. Buschmann, P. H. Viet, N. Van Dan, W. Giger,D. Stüben, Hydrological and sedimentary controls leading to arsenic contamination ofgroundwater in the Hanoi area, Vietnam: The impact of iron-arsenic ratios, peat, riverbank deposits, and excessive groundwater abstraction. Chem. Geol. 249, 91–112 (2008).
9. L. M. Del Razo, M. A. Arellano, M. E. Cebrián, The oxidation states of arsenic in well-waterfrom a chronic arsenicism area of northern Mexico. Environ. Pollut. 64, 143–153 (1990).
10. J. D. Ayotte, D. L. Montgomery, S. M. Flanagan, K. W. Robinson, Arsenic in groundwater ineastern New England: Occurrence, controls, and human health implications. Environ. Sci.Technol. 37, 2075–2083 (2003).
11. A. H. Welch, D. Westjohn, D. R. Helsel, R. B. Wanty, Arsenic in ground water of the UnitedStates: Occurrence and geochemistry. Ground Water 38, 589–604 (2000).
12. J. G. Webster, D. K. Nordstrom, in Arsenic in Groundwater: Geochemistry and Occurrence,A. H. Welch, K. G. Stollenwerk, Eds. (Springer-Verlag, 2003), pp. 101–126.
13. D. Langmuir, Aqueous Environmental Geochemistry (Prentice-Hall, 1997).14. M. E. Schreiber, J. A. Simo, P. G. Freiberg, Stratigraphic and geochemical controls on
naturally occurring arsenic in groundwater, eastern Wisconsin, USA. Hydrogeol. J.8, 161–176 (2000).
15. J. M. McArthur, P. Ravenscroft, S. Safiulla, M. F. Thirlwall, Arsenic in groundwater: Testingpollution mechanisms for sedimentary aquifers in Bangladesh. Water Resour. Res. 37,109–117 (2001).
16. D. Postma, F. Larsen, N. T. Thai, P. T. K. Trang, R. Jakobsen, P. Q. Nhan, T. V. Long, P. H. Viet,A. S. Murray, Groundwater arsenic concentrations in Vietnam controlled by sedimentage. Nat. Geosci. 5, 656–661 (2012).
17. S. Gao, J. Ryu, K. K. Tanji, M. J. Herbel, Arsenic speciation and accumulation inevapoconcentrating waters of agricultural evaporation basins. Chemosphere 67, 862–871(2007).
18. C. O. Abernathy, Y.-P. Liu, D. Longfellow, H. V. Aposhian, B. Beck, B. Fowler, R. Goyer,R. Menzer, T. Rossman, C. Thompson, M. Waalkes, Arsenic: Health effects, mechanisms ofactions, and research issues. Environ. Health Perspect. 107, 593–597 (1999).
19. A. H. Milton, Z. Hasan, S. M. Shahidullah, S. Sharmin, M. D. Jakariya, M. Rahman, K. Dear,W. Smith, Association between nutritional status and arsenicosis due to chronicarsenic exposure in Bangladesh. Int. J. Environ. Health Res. 14, 99–108 (2004).
20. A. Azizullah, M. N. K. Khattak, P. Richter, D.-P. Häder, Water pollution in Pakistan and itsimpact on public health—A review. Environ. Int. 37, 479–497 (2011).
21. J. D. Ayotte, B. T. Nolan, J. R. Nuckols, K. P. Cantor, G. R. Robinson Jr., D. Baris, L. Hayes,M. Karagas, W. Bress, D. T. Silverman, J. H. Lubin, Modeling the probability of arsenic ingroundwater in New England as a tool for exposure assessment. Environ. Sci. Technol.40, 3578–3585 (2006).
22. M. Amini, K. C. Abbaspour, M. Berg, L. Winkel, S. J. Hug, E. Hoehn, H. Yang,C. A. Johnson, Statistical modeling of global geogenic arsenic contamination ingroundwater. Environ. Sci. Technol. 42, 3669–3675 (2008).
23. L. Winkel, M. Berg, M. Amini, S. J. Hug, C. A. Johnson, Predicting groundwater arseniccontamination in Southeast Asia from surface parameters. Nat. Geosci. 1, 536–542 (2008).
24. L. Rodríguez-Lado, G. Sun, M. Berg, Q. Zhang, H. Xue, Q. Zheng, C. A. Johnson,Groundwater arsenic contamination throughout China. Science 341, 866–868 (2013).
25. L. H. E. Winkel, P. T. K. Trang, V. M. Lan, C. Stengel, M. Amini, N. T. Ha, P. H. Viet, M. Berg,Arsenic pollution of groundwater in Vietnam exacerbated by deep aquifer exploitationfor more than a century. Proc. Natl. Acad. Sci. U.S.A. 108, 1246–1251 (2011).
26. World Bank–Strategic Country Environmental Assessment, Pakistan Strategic CountryEnvironmental Assessment: Main Report (World Bank–Strategic Country EnvironmentalAssessment, 2006).
27. H. V. Aposhian, M. M. Aposhian, Arsenic toxicology: Five questions. Chem. Res. Toxicol. 19,1–15 (2006).
28. M. F. Hughes, Biomarkers of exposure: A case study with inorganic arsenic. Environ. HealthPerspect. 114, 1790–1796 (2006).
29. Z. Fatmi, I. Azam, F. Ahmed, A. Kazi, A. B. Gill, M. M. Kadir, M. Ahmed, N. Ara, N. Z. Janjua;Core Group for Arsenic Mitigation in Pakistan, Health burden of skin lesions at lowarsenic exposure through groundwater in Pakistan. Is river the source? Environ. Res. 109,575–581 (2009).
30. A. K. Bhowmik, A. Alamdar, I. Katsoyiannis, H. Shen, N. Ali, S. M. Ali, H. Bokhari, R. B. Schäfer,S. A. Eqani, Mapping human health risks from exposure to trace metal contaminationof drinking water sources in Pakistan. Sci. Total Environ. 538, 306–316 (2015).
31. T. G. Kazi, M. B. Arain, J. A. Baig, M. K. Jamali, H. I. Afridi, N. Jalbani, R. A. Sarfraz, A. Q. Shah,A. Niaz, The correlation of arsenic levels in drinking water with the biological samplesof skin disorders. Sci. Total Environ. 407, 1019–1026 (2009).
32. K. D. Brahman, T. G. Kazi, H. I. Afridi, J. A. Baig, S. S. Arain, F. N. Talpur, A. G. Kazi, J. Ali,A. H. Panhwar, M. B. Arain, Exposure of children to arsenic in drinking water in theTharparkar region of Sindh, Pakistan. Sci. Total Environ. 544, 653–660 (2016).
33. M. Bibi, M. Z. Hashmi, R. N. Malik, Human exposure to arsenic in groundwater fromLahore district, Pakistan. Environ. Toxicol. Pharmacol. 39, 42–52 (2015).
34. K. D. Brahman, T. G. Kazi, J. A. Baig, H. I. Afridi, A. Khan, S. S. Arain, M. B. Arain, Fluoride andarsenic exposure through water and grain crops in Nagarparkar, Pakistan. Chemosphere100, 182–189 (2014).
35. M. Arain, T. G. Kazi, J. A. Baig, M. K. Jamali, H. I. Afridi, A. Q. Shah, N. Jalbani, R. A. Sarfraz,Determination of arsenic levels in lake water, sediment, and foodstuff from selectedarea of Sindh, Pakistan: Estimation of daily dietary intake. Food Chem. Toxicol. 47,242–248 (2009).
36. U. Rabbani, G. Mahar, A. Siddique, Z. Fatmi, Risk assessment for arsenic-contaminatedgroundwater along River Indus in Pakistan. Environ. Geochem. Health 39, 179–190(2017).
37. R. T. Nickson, J. M. McArthur, B. Shrestha, T. O. Kyaw-Myint, D. Lowry, Arsenic andother drinking water quality issues, Muzaffargarh District, Pakistan. Appl. Geochem. 20,55–68 (2005).
Podgorski et al., Sci. Adv. 2017;3 : e1700935 23 August 2017
38. A. Farooqi, H. Masuda, N. Firdous, Toxic fluoride and arsenic contaminated groundwaterin the Lahore and Kasur districts, Punjab, Pakistan and possible contaminant sources.Environ. Pollut. 145, 839–849 (2007).
39. J. A. Baig, T. G. Kazi, A. Q. Shah, G. A. Kandhro, H. I. Afridi, M. B. Arain, M. K. Jamali,N. Jalbani, Speciation and evaluation of Arsenic in surface water and groundwatersamples: A multivariate case study. Ecotoxicol. Environ. Saf. 73, 914–923 (2010).
40. K. D. Brahman, T. G. Kazi, H. I. Afridi, S. Naseem, S. S. Arain, N. Ullah, Evaluation ofhigh levels of fluoride, arsenic species and other physicochemical parameters inunderground water of two sub districts of Tharparkar, Pakistan: A multivariate study.Water Res. 47, 1005–1020 (2013).
41. T. Ahmad, M. A. Kahlown, A. Tahir, H. Rashid, Arsenic an emerging issue: Experiencesfrom Pakistan, in Proceedings of the 30th WEDC International Conference (2004),pp. 459–466.
42. U. K. Chowdhury, B. K. Biswas, T. R. Chowdhury, G. Samanta, B. K. Mandal, G. C. Basu,C. R. Chanda, D. Lodh, K. C. Saha, S. K. Mukherjee, S. Roy, S. Kabir, Q. Quamruzzaman,D. Chakraborti, Groundwater arsenic contamination in Bangladesh and West Bengal, India.Environ. Health Perspect. 108, 393 (2000).
43. L. Charlet, D. A. Polya, Arsenic in shallow, reducing groundwaters in southern Asia: Anenvironmental health disaster. Elements 2, 91–96 (2006).
44. H. Guo, D. Wen, Z. Liu, Y. Jia, Q. Guo, A review of high arsenic groundwater inMainland and Taiwan, China: Distribution, characteristics and geochemical processes.Appl. Geochem. 41, 196–217 (2014).
45. M. Berg, H. C. Tran, T. C. Nguyen, H. V. Pham, R. Schertenleib, W. Giger, Arseniccontamination of groundwater and drinking water in Vietnam: A human health threat.Environ. Sci. Technol. 35, 2621–2626 (2001).
46. J. Buschmann, M. Berg, C. Stengel, L. Winkel, M. L. Sampson, P. T. Trang, P. H. Viet,Contamination of drinking water resources in the Mekong delta floodplains: Arsenic andother trace metals pose serious health risks to population. Environ. Int. 34, 756–764(2008).
47. A. S. Qureshi, P. G. McCornick, A. Sarwar, B. R. Sharma, Challenges and prospects ofsustainable groundwater management in the Indus Basin, Pakistan. Water Resour. Manag.24, 1551–1569 (2010).
48. D. W. Greenman, W. V. Swarzenski, G. D. Bennett, Ground-Water Hydrology of the Punjab,West Pakistan, with Emphasis on Problems Caused by Canal Irrigation (GovernmentPrinting Office, 1967).
49. P. Smedley, Groundwater Quality: Pakistan (British Geological Survey, 2001), 6 pp.50. F. Bender, H. Raza, D. Bannert, Geology of Pakistan: Gebruder Borntraeger
(1995).51. A. Farooqi, H. Masuda, R. Siddiqui, M. Naseem, Sources of arsenic and fluoride in highly
52. D. W. Hosmer Jr., S. Lemeshow, Applied Logistic Regression (John Wiley & Sons, ed. 2,2004).
53. T. Fawcett, An introduction to ROC analysis. Pattern Recognit. Lett. 27, 861–874(2006).
54. H. Akaike, A new look at the statistical model identification. IEEE Trans. Autom. Control.19, 716–723 (1974).
55. Pakistan Bureau of Statistics, Population Census (Government of Pakistan, 2010).56. World Bank, Population growth (annual %) (World Bank Open Data, 2016);
http://data.worldbank.org/indicator/SP.POP.GROW?locations=PK [accessed12 October 2016].
57. B. A. Chandio, M. Abdullah, M. A. Tahir, in Proceedings of the National Workshop onQuality of Drinking Water (Pakistan Council of Research in Water Resources, 1998),pp. 14–18.
58. N. Iqbal, F. Hossain, H. Lee, G. Akhter, Satellite gravimetric estimation of groundwaterstorage variations over Indus Basin in Pakistan. IEEE J. Sel. Topics Appl. Earth Observ. RemoteSens. 9, 3524–3534 (2016).
59. A. Rasool, A. Farooqi, S. Masood, K. Hussain, Arsenic in groundwater and its health riskassessment in drinking water of Mailsi, Punjab, Pakistan. Hum. Ecol. Risk Assess. Int. J.22, 187–202 (2016).
60. A. H. Smith, E. O. Lingas, M. Rahman, Contamination of drinking-water by arsenic inBangladesh: A public health emergency. Bull. World Health Organ. 78, 1093–1103(2000).
61. Arsenic Contamination of Groundwater in Bangladesh, D. G. Kinniburgh, P. L. Smedley, Eds.(British Geological Survey, 2001).
62. A. van Geen, Y. Zheng, R. Versteeg, M. Stute, A. Horneman, R. Dhar, M. Steckler,A. Gelman, C. Small, H. Ahsan, J. H. Graziano, I. Hussain, K. M. Ahmed, Spatialvariability of arsenic in 6000 tube wells in a 25 km2 area of Bangladesh. Water Resour.Res. 39, 1140 (2003).
63. M. Berg, C. Stengel, T. K. Pham, H. V. Pham, M. L. Sampson, M. Leng, S. Samreth,D. Fredericks, Magnitude of arsenic pollution in the Mekong and Red River Deltas—Cambodia and Vietnam. Sci. Total Environ. 372, 413–425 (2007).
64. M. F. Ahmed, S. Ahuja, M. Alauddin, S. J. Hug, J. R. Lloyd, A. Pfaff, T. Pichler, C. Saltikov,M. Stute, A. van Geen, Ensuring safe drinking water in Bangladesh. Science 314,1687–1688 (2006).
65. C. K. Jain, R. D. Singh, Technological options for the removal of arsenic with specialreference to South East Asia. J. Environ. Manage. 107, 1–18 (2012).
66. J. G. Hering, I. A. Katsoyiannis, G. A. Theoduloz, M. Berg, S. J. Hug, Arsenic removal fromdrinking water: Experiences with technologies and constraints in practice. J. Environ. Eng.143, 03117002 (2017).
67. S. J. Hug, O. X. Leupin, M. Berg, Bangladesh and Vietnam: Different groundwatercompositions require different approaches to arsenic mitigation. Environ. Sci. Technol. 42,6318–6323 (2008).
68. R Development Core Team, R: A Language and Environment for Statistical Computing(R Foundation for Statistical Computing, 2014).
69. M. Abu, M. S. Bakr, R. O. Jackson, Geological Map of Pakistan, Scale: 1:2,000,000 (GeologicalSurvey of Pakistan, 1964).
70. International Soil Reference and Information Centre, World Soil Information (InternationalSoil Reference and Information Centre, 2013).
71. H. A. Sturges, The choice of a class interval. J. Am. Stat. Assoc. 21, 65–66 (1926).72. R. J. Zomer, D. A. Bossio, A. Trabucco, L. Yuanjie, D. C. Gupta, V. P. Singh, Trees and Water:
Smallholder Agroforestry on Irrigated Lands in Northern India (Research Report 122,Internation Water Management Institute, 2007).
73. R. J. Zomer, A. Trabucco, D. A. Bossio, L. V. Verchot, Climate change mitigation: A spatialanalysis of global land suitability for clean development mechanism afforestation andreforestation. Agr. Ecosyst. Environ. 126, 67–80 (2008).
74. R. J. Hijmans, S. E. Cameron, J. L. Parra, P. G. Jones, A. Jarvis, Very high resolutioninterpolated climate surfaces for global land areas. Int. J. Climatol. 25, 1965–1978 (2005).
75. Food and Agriculture Organization (FAO), FAOSTAT Database Collections (FAO of theUnited Nations, 2013).
76. U.S. Geological Survey, 30sec GRID: Conditioned DEM (U.S. Geological Survey, 2013).77. Food and Agriculture Organization of the United Nations and the International Institute
for Applied Systems Analysis, Harmonized World Soil Database (Food and Agriculture
Podgorski et al., Sci. Adv. 2017;3 : e1700935 23 August 2017
Organization of the United Nations and the International Institute for Applied SystemsAnalysis, 2012).
78. International Geosphere-Biosphere Programme–Data Information System, A Programfor Creating Global Soil-Property Databases (International Geosphere-BiosphereProgramme–Data Information System, 1998).
Acknowledgments: We acknowledge our colleague A. Johnson who initiatedthis collaboration but passed away in 2015. Funding: We thank the Swiss Agency forDevelopment and Cooperation (7F-09010.01), the Swiss Federal Institute of Aquatic Scienceand Technology (Eawag), the Higher Education Commission of Pakistan (project no. PM-IPFP/HRD/HEC/2012/3599), the National Natural Science Foundation of China (Research Fellowshipfor International Young Scientists, no. 21450110419), and the Institute of Urban Environment ofthe Chinese Academy of Sciences (CAS President’s International Fellowship for PostdoctoralResearchers, no. 2016PB009) for their support in carrying out this project. Author contributions:S.A.M.A.S.E. and H.S. designed the groundwater sampling campaigns. S.A.M.A.S.E., T.K., andR.U. conducted the groundwater sampling and performed the laboratory analyses. J.E.P.designed and carried out the statistical analyses. J.E.P. and M.B. formulated the geochemicalinterpretations and designed the figures. J.E.P. wrote the paper with contributions from M.B.,S.A.M.A.S.E., and H.S. Competing interests: The authors declare that they have no competinginterests. Data and materials availability: All data needed to evaluate the conclusions in thepaper are present in the paper and/or the Supplementary Materials. Additional data relatedto this paper may be requested from the authors.
Submitted 20 March 2017Accepted 28 July 2017Published 23 August 201710.1126/sciadv.1700935
Citation: J. E. Podgorski, S. A. M. A. S. Eqani, T. Khanam, R. Ullah, H. Shen, M. Berg, Extensivearsenic contamination in high-pH unconfined aquifers in the Indus Valley. Sci. Adv. 3, e1700935(2017).
Extensive arsenic contamination in high-pH unconfined aquifers in the Indus ValleyJoel E. Podgorski, Syed Ali Musstjab Akber Shah Eqani, Tasawar Khanam, Rizwan Ullah, Heqing Shen and Michael Berg