Page 1
Environ. Eng. Res. 2016
Research Article http://dx.doi.org/10.4491/eer.2016.028 pISSN 1226-1025 eISSN 2005-968X In Press, Uncorrected Proof
Extent and persistence of dissolved oxygen enhancement using nanobubbles
Andinet Tekile1, Ilho Kim1,2,†, Jai-Yeop Lee2
1Construction Environment Engineering Department, University of Science and Technology, Daejeon 305-350, Korea. 2Korea Institute of Civil Engineering and Building Technology, Gyeonggi-Do 411-712, Korea.
Abstract In this study, change in water-dissolved oxygen (DO) was analyzed under various synthetic water qualities and nano-bubbles application conditions, such as gas type, initial DO as well as water dissolved, suspended and organic matters contents. When oxygen, rather than air, was introduced into nitrogen-desorbed ultra-pure water, the stagnation time was significantly increased. It took ten days for DO concentration to drop back to saturation. The higher the initial DO concentration, the longer particles were observed above saturation due to particle stability improvement. The oxygen mass transfer rate of 0.0482 mg/L/min was found to reach a maximum at an electrolytic concentration of 0.75 g/L, beyond which the transfer rate decreased due to adsorption of negative ions of the electrolyte at the interface. High levels of turbidity caused by suspended solids have become a barrier to dissolution of nanobubbles oxygen into the water solution, and thus affected the transfer performance. On the other hand, by applying nano-bubbles for just an hour, up to 7.2% degradation of glucose as representative organic matter was achieved. Thus, nano-bubbles technology would maintain a high DO extent for an extended duration, and thus can improve water quality provided that water chemistry is closely monitored during its application. Keywords: Application conditions, Dissolved oxygen, Nano-bubbles, Water quality
This is an Open Access article distributed under the terms of the Creative Commons Attribution Non-Commercial Li- cense (http://creativecommons.org/licenses/by-nc/3.0/)
which permits unrestricted non-commercial use, distribution, and repro- duction in any medium, provided the original work is properly cited.
Received February 18, 2016 Accepted September 06, 2016 † Corresponding Author E-mail: [email protected] Tel: +82-31-910-0649 Fax: +82-31-910-0291
Copyright © 2016 Korean Society of Environmental Engineers http://eeer.org
Page 2
1. Introduction
Bubbles are gas bodies surrounded by water, and when macro size bubbles rapidly rise and burst
at the surface of a water body, they empty a significant amount of the gas content into the
atmosphere. However, applications in the areas of surface water remediation and wastewater
treatment have shown that smaller bubbles have achieved huge mass transfer effects.
Michioku et al. [1] conducted an in-situ experiment by using a very simple micro-bubble
aeration, and the system was a powerful tool for minimizing reservoir eutrophication in an
economical way. Srithongouthai et al. [2] improved dissolved oxygen (DO) levels in the net pen
water to a level suitable for fish farming using microscopic bubbles during the warm seasons. Li
et al. [3] suggested that microbubble-collapse process was valuable as a pre-treatment before the
traditional biological processes are carried out to increase the effectiveness and economic
feasibility of the overall treatment. Kim et al. [4] also carried out a field investigation on water
purification technique in a brackish water lake in an effort to test the performance of
microbubble system to increase DO at the lower layer. In addition, the use of microbubbles in
various environmental and industrial processes for solid-liquid separations and in mass transfer is
well-established [5].
Recently, lab experiments with a liquid particle counter enabled recognition of the existence
of stabilized invisible bubbles finer than the common size range of microbubbles [6]. These
submicron bubbles are called nanobubbles (NBs). Due to the many potential applications of NBs
in fields such as medicine and the food industry, the methods of generating and measuring
bubbles have advanced. However, limited research has been carried out on NBs in water with
inert electrolytes, or in the presence of surfactants [7]. Applied research in the area of water
treatment has not been growing along with our understanding of the NB generation kinetics,
1
Page 3
bubble physicochemical properties, bubble dynamics and evaluation techniques [8-13]. The
opportunity to conduct deeper studies that will provide additional insights into the practical
application of NBs is wide open.
Since NBs cannot be thermodynamically stable, their persistence in solutions has been
debated for decades [9, 14-15]. The difference between the internal pressure of bubbles and the
atmospheric pressure governs the dissolution of gas into solutions. In this respect, NBs have such
a huge internal pressure that they are supposed to dissolve instantly [12, 16]. But despite this,
studies have shown that it is possible to produce NBs that have a stability lasting from several
minutes to days, and even months in aqueous solutions [12, 14]. Thus, in order to practically
extend the application of NBs in environmental management areas, it is important to reveal
additional fundamental properties of the bubbles through the study of design parameters and
physico-chemical factors.
In this study, bubbles of 800 to 900 nm in size having a life span of several hours to a few
days were generated using a hydrodynamic cavitation method. The effects of operating
parameters such as gas type and the water chemistry on the DO improvement extent and
persistence of the NBs were investigated. More specifically, the effect of varying the initial
oxygen content of the water and gas type on oxygen supersaturation in water was examined. In
addition, the impact of dissolved and suspended solids on NBs DO enhancement extent was
studied. To accomplish this, separate experiments using synthetic water in which sodium
chloride and kaolin were dissolved were conducted.
Before assessing the effect, the correlation of sodium chloride as dissolved solid and the
corresponding electrical conductivity, as well as kaolin amount, representing the suspended
solids and the resulting turbidity were established. The aim of the correlation was to mimic the
2
Page 4
recent EC and turbidity of the rivers of Korea, collected from the ‘Real time water quality
information.’ The study also assessed the performance of NBs aeration in reducing the chemical
oxygen demand (COD) level of synthetic wastewater made by dissolving glucose in ultra-pure
water. The efficiency of the digestion process was analyzed based on the percentage of chemical
oxygen demand removal and of COD reduction.
2. Materials and Methods
2.1. Effect of Gas Type and Initial DO Concentration
The NBs were generated using ultrapure water, which passed through ion exchange, activated
carbon and membrane filtration particle removal processes. The ultrapure water used had
conductivity 4.5 µS/cm, salinity of 0.0 mg/L and surface tension of 0.0725 N/m, all at 250C. The
gas used for the bubbles generation was natural air or oxygen. The air supply was provided using
Hi-POWER master air pump (DAE Kwang, Korea) while pure oxygen was supplied to the NBs
generator from an oxygen cylinder (99.99% purity) at 0.025 L/min flow rate. Oxygen was nano-
bubbled into nitrogen-desorbed ultra-pure water, which itself was prepared by introducing
nitrogen (99.99% purity) NBs into the water to adjust the initial DO concentration.
The NBs were discharged into the bottom center of a cylindrical Pyrex glass reactor (120 mm
dia. and holding 6 L of water) at a rate of 0.25 L/min. The water was allowed to circulate
between the NB generator and the reactor, while the DO concentration of ultra-pure water kept in
the reactor was continuously measured until it became stable. The DO concentration
measurement was taken using an A223 RDO portable meter (Thermo Scientific, USA), which
automatically compensates variation of temperature from 200C. The DO meter had measuring
3
Page 5
range from 0 to 50 mg/L with accuracy of ± 1% (0 to 20 mg/L) and ± 10% (20 to 50 mg/L).
Water samples were collected for daily measurement after the generation, until the DO value
reached saturation equilibrium concentration.
The temperature of the liquid in the reactor was kept constant by allowing a continuous flow
of cooling water in the jacket around the reactor. Initial DO of 3, 4, 5, 7, 8 and 9 mg/L at 200C
temperature were considered. The widely-applied ASCE standard guideline assumption to
determine mass transfer has reduced design variability and allowed a better evaluation of the
operation of existing treatment plants [17]. However, Muroyama et al. [18] and Sadatomi et al.
[19] considered initial DO concentration of 2 mg/L and 4 mg/L, respectively, which also
deviated from the standard value of zero. The effect of the ratio of the gas-water exchange area
to water volume on the time to reach equilibrium DO concentration was also examined.
2.2. Effect of Electrolyte Concentration and Turbidity on DO Nature
The experimental set-up of this section is shown in Fig. 1. The actual electrical conductivity (EC)
and turbidity data of the four major river systems of Korea from Jul. 2012 - Jan. 2015 were
assessed to keep the EC and turbidity of the synthetic water reasonable.
99.0% extra pure Sodium chloride (NaCl) and extra pure kaolin (H2Al2Si2O8.H2O), both
sourced from SAMCHUN Pure Chemical, Korea, were used to prepare the synthetic electrolytic
and the synthetic turbid water, respectively. Several trial experimental data were collected to
determine what turbidity would be produced from a given suspension of kaolin clay, as well as to
relate the amount of NaCl added to the EC measured. YSI professional series product family
(USA), pro 1030 conductivity meter and the Hach Model 2100AN IS Turbidimeter were used for
EC and turbidity measurement, respectively.
4
Page 6
In an effort to determine the relationship between concentration of the solute and EC, 0,
0.025, 0.05, 0.15, 0.25, 0.5, 0.75, 1, 1.25 and 1.5 g/L NaCl were considered. The turbidity
experiment was carried out by adding 0, 25, 50, 100, 200, 400, 600, 800, 1000 and 1200 mg/L of
kaolin clay to the 20 L ultra-pure water in the reactor, after establishing the correlation between
turbidity and the kaolin amount causing it. The agitator was set to run continuously to avoid
sedimentation, while pH and DO measurements in sample water from the reactor were made at 3
min intervals. The data collection continued until the reading stabilized to a constant value with
± 0.2. The dependence of NBs oxygen transfer efficiency on turbidity and electrolyte
concentration was demonstrated through a comparison of mass transfer data collected by adding
the known amounts of kaolin and NaCl, respectively. The extent of DO enhancement was
analyzed from the DO peak value and the oxygen transfer rate.
2.3. Effect of Glucose and Its Amount on DO Increasing Pattern
The actual COD data of the four major river systems of Korea were assessed to keep the COD of
the synthetic water reasonable. COD value of wastewater influent was also taken into account.
Extra pure anhydrous glucose from SAMCHUN Pure Chemical Co., Ltd was used to prepare the
synthetic wastewater as carbon source. The COD measurement was made using a DR/4000
spectrophotometer (Hach Company, USA). Based on the theoretical concept that a solution with
1 g/L of glucose has a COD of 1,067 mg/L, the main experiment was conducted by adding 0, 0.1,
0.25, 0.5, 1, 2, 3, 4 and 5 g of glucose to the 10 L ultra-pure water in the reactor. The DO
measurements in sample water from the reactor were made at 5 min intervals. The NBs were
continuously supplied to the glucose solution for 1 h, samples were collected at 0, 30 and 60 min,
and then the COD content was analyzed for organic matter degradation.
5
Page 7
2.4. Parameters Used for Comparison of the Factors
To analyze the collected DO data, a non-steady mass transfer model (Eq. (1)), by which the
volumetric oxygen mass transfer rate (VOTR) is determined [17], was employed.
𝑑𝐶𝑑𝑡
= 𝐾𝐿𝑎 ∗ (𝐶∞ − 𝐶𝑡) (1)
where:
dc/dt - transfer rate per unit volume;
KLa - volumetric oxygen transfer rate (1/time);
C∞ - near saturation DO concentration at infinite time (mg/L) and
Ct - DO at time t (mg/L).
This standard model assumes that the equilibrium DO concentrations are the same
everywhere in the tank, which is reasonable in this work as the reactor is small in size. To
visualize the DO-vs-time experimental data, linear regression is used by transforming Eq. (2) to
the following form:
ln �𝐶∞−𝐶𝑡𝐶∞−𝐶0
� = 𝐾𝐿𝑎 ∗ 𝑡 (2)
Here, C0 is initial concentration at time t = 0, Ct and KLa are as defined above. The slope of
Ln((Cs-Ct)/Cs-C0)) vs time plot gives the KLa value.
The standard method for oxygen transfer measurements assumes overall oxygen transfer to
be only from air bubbles, and it considers oxygen transfer from the water’s surface to be
negligible. In support of this assumption, field oxygen transfer measurement conducted by He
[20] concluded that the liquid-side mass transfer value was only 2% of the bubble side transfer.
The surface area of the cylindrical water tank to which the NBs were supplied in this work was
small in size. In addition, a large amount of oxygen was transferred to the water across the
interfaces as the very slow terminal rising velocity of the tiny bubbles from the bottom to the
6
Page 8
water’s surface gave time for more dissolution. Actually, the liquid-side mass transfer coefficient
(kL) decreases with a decrease in the bubble size [21]. Hence, kL and interfacial area (a) were
not considered here.
To show the extent and persistence of dissolved oxygen enhancement, three parameters -
namely, dissolved oxygen peak value (DOPV), average initial dissolved oxygen increasing rate
(AIDOIR) and stagnation time (ST) - were used [22]. DOPV is the peak to which the DO
concentration rises, or is above the stable saturation value. The AIDOIR is the mean of the DO
increase from its initial value to the peak per unit time. It describes the quantity and the speed at
which the generator produces NBs, which in turn determine the oxygen mass transfer rate. In
addition, the ST is the time taken by the DO to return to the stable saturation value (100%) from
its corresponding peak.
3. Results and Discussion
3.1. Variation of DO over Time Due to NBs
DO concentration of the water before nitrogen desorption ranged from 9.10 to 9.64 at 200C. At
the outset, the already dissolved oxygen content was reduced to about 4 mg/L using nitrogen gas,
because the tap water showed high DO value and it required a significant amount of time to
reduce further, close to zero [19]. After the air NBs supply stopped, the DO concentration
stabilized to an average concentration of 13.5 mg/L, for all initial DO values. The concentration
was almost unchanged for 24 h after the generator stopped. It has taken two more days for the
DO concentration to decrease to the saturated value of about 9.3 mg/L. After an additional day,
the concentration reached the saturation equilibrium at 9.1 mg/L.
7
Page 9
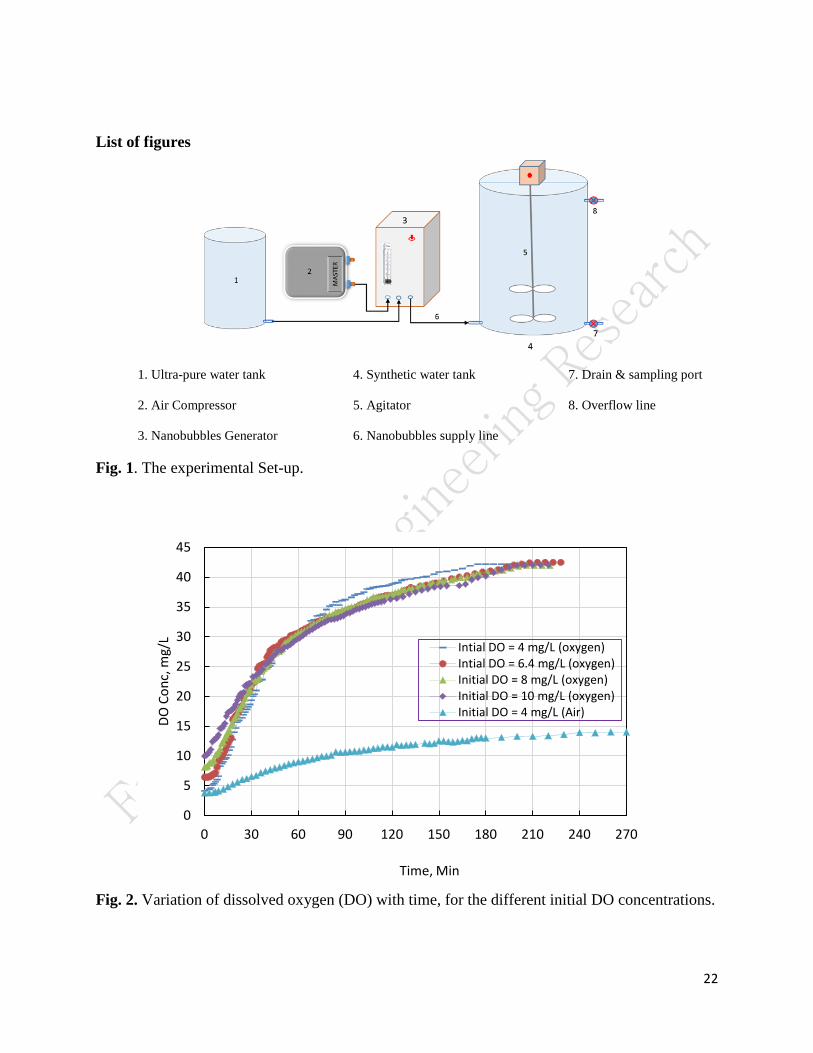
Looking at the variation in oxygen gas NBs DO concentration over time (Fig. 2), it can
be seen that the value reached peak supersaturated level of 42.0 mg/L. It was again almost
unchanged after 1 day, and then slowly decreased to the saturation equilibrium of 9.1 mg/L at
200C. The DO concentration approached saturation condition (9.3 mg/L) on the 9th day, and after
one more day it reached the saturation equilibrium of 9.1 mg/L. In this study, immediately after
the NBs generation started, the DO increased relatively rapidly, until it reached 30 mg/L after
about an hour. However, the rate of increase was reduced afterwards, and oscillated slightly
around the peak value of 42.0 mg/L.
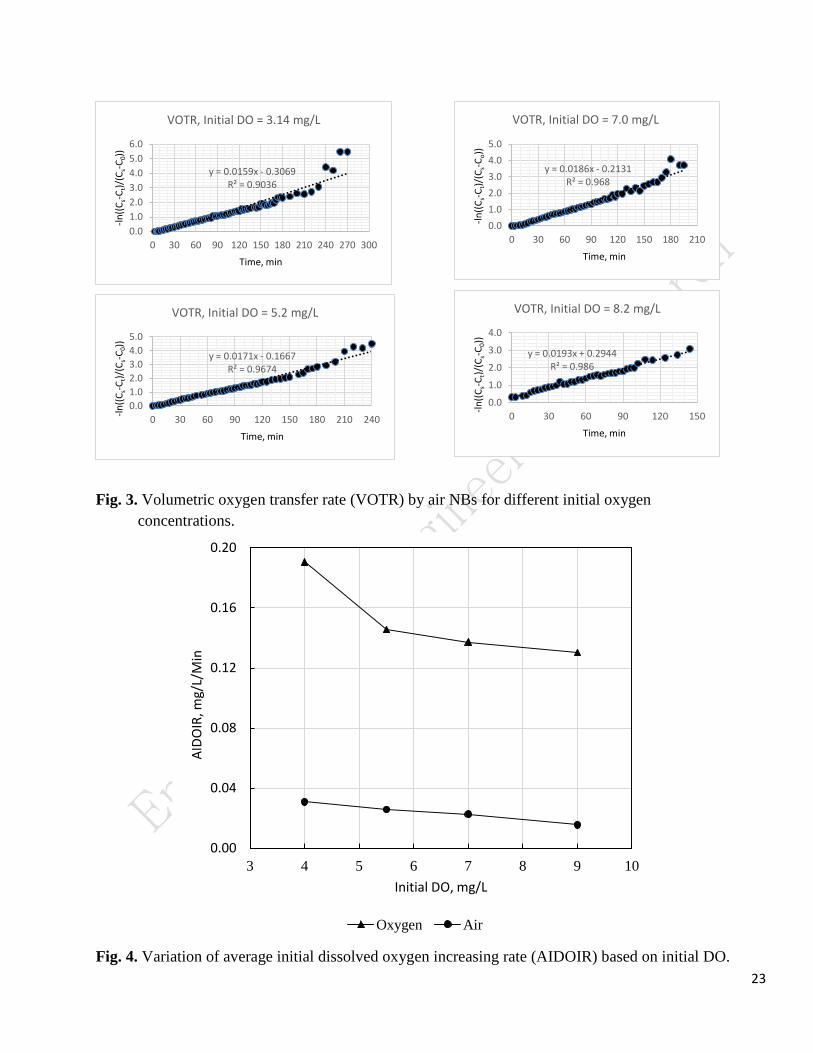
Fig. 3 shows that the higher the initial air DO, the higher the kLa value, although the trend is
one of a gradual increase. Generally, the kLa value for nano-bubbling was not very high (0.0159
– 0.0193 min-1 for air) because the NB generator had limited capacity. When oxygen was used
instead of air, the kLa value decreased slightly with the increase in initial DO, but still had a
magnitude as high as 3 times that of air. Thus, the dissolution of oxygen from NBs to the water
depends on the gas type and the initial concentration of oxygen. Oxygen dissolution in water
follows Henry’s law, with the dissolved amount proportional to the partial pressure of oxygen in
air.
The average initial DO increase rate (AIDOIR) indicates the mass transfer rate of the NBs
(Fig. 4). It is related to the generator capacity, and gives the number, the rate and the size of
bubbles generated. Li et al. [22] explained that mass transfer rate will be increased by ten
thousand if one 1 mm-diameter air bubble is divided into eight hundred thousand 10 μm-
diameter air bubbles, to determine why AIDOIR of micro-nano bubbles was much higher than
the macro bubbles. Different time duration was taken to reach the peak saturation concentration
8
Page 10
that AIDOIR was not just difference between the DO concentration values. DO peak value was
the basic result of AIDOIR over time.
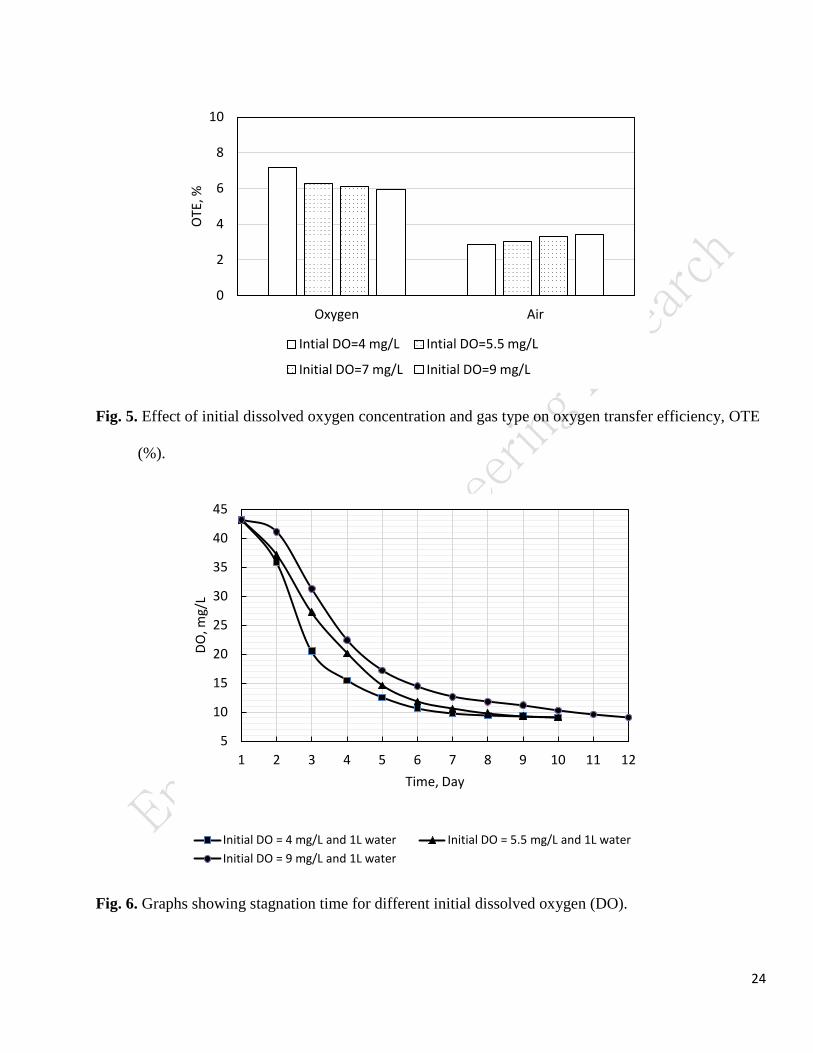
Fig. 5 shows the effect of initial oxygen concentration in terms of oxygen transfer efficiency
(OTE), just to compare the AIDOIR result with another universal parameter. OTE is the ratio of
mass rate of oxygen transferred to mass rate of oxygen supplied. Thus, the bar graphs show the
apparent effect of gas type and initial DO.
3.2. Stagnation Time of NBs
The life span of the NBs staying dissolved in water is given by stagnation time (ST). ST is
associated with bubble size, the initial DO, gas type and ratio of gas-water exchange area to the
water volume. Thus, ST is a parameter that roughly shows the durability of DO caused by the
NBs. When the DO peak value was reached, the generation stopped; at this point, the DO
decreased due to the oxygen in the bubbles having been dissolved into the water and finally
diffused to the atmosphere. Fig. 5 presents the stagnation duration for different initial DOs. The
higher the initial DO, the longer the DO stayed beyond the equilibrium saturation value, provided
that the samples considered were of the same size.
Recently, it has been considered that the internal pressure of NBs should be much lower than
predicted by the Young-Laplace equation, and thus the equation should no longer hold for NBs.
Instead, the liquid-gas interface may play the central role in the stabilization of NBs. Ushikubo et
al. [12] explained the stability of nano-sized bubbles according to the high dissolved gas
concentration in water and the electrically charged interface of the bubbles. At a higher initial
DO concentration, particles were observed for a longer period of time. Thus, high DO
concentration could extend the particle stability. This verifies the possibility of the existence of
9
Page 11
NBs, since at a higher DO concentration, the oxygen diffusion would take more time. The high
gas concentration in the liquid explains the extension of NB stability.
The magnitudes of zeta potential of oxygen nano-bubbled water were possibly higher than
those of air nano-bubbled water. At a high magnitude zeta potential value, the electrically
charged particles tend to repel each other, avoiding aggregation. For bubble dispersion, the high
zeta potential could create repulsion forces that would avoid the coalescence of bubbles, thus
contributing to the stabilization of the bubbles. Therefore, the oxygen NBs could be stabilized in
water by the electrically charged surfaces, while the nano-bubbled air would be below the limit
of the stabilization by repulsion forces.
Furthermore, the big difference between the periods in which bubbles could be observed as
stable in the oxygen nano-bubbled water (10-15 days) and in that of air nano-bubbled (3-5 days)
is likely related to the lower dissolution of the air in water in relation to the dissolution of oxygen.
At a lower concentration of dissolved gas, the concentration gradient across the gas-liquid
interface of the bubble was likely higher, leading to a more efficient gas transfer to the liquid
phase.
The dependence of the ST on the ratio of gas-water exchange area to the water volume
(A/V) was observed by storing nanobubbled water, immediately after its generation, in beakers
of different sizes. Three surface areas of 127, 183, and 183 cm2 with corresponding volumes of 1,
1.5 and 2L, respectively, were used. The DO in the holder of A/V ratio 0.091 per cm took two
more days to reach the equilibrium condition than the one kept in A/V ratio of 0.130 per cm, both
having the same surface area but different volumes. As such, because of the increased ratio, the
DO stagnation time was affected in such a way that it approached the equilibrium faster. The
10
Page 12
persistence decreased from the 1 to 2L volume, showing the effect of the interface rather than
water volume. This was also suggested by Ushikubo et al. [12].
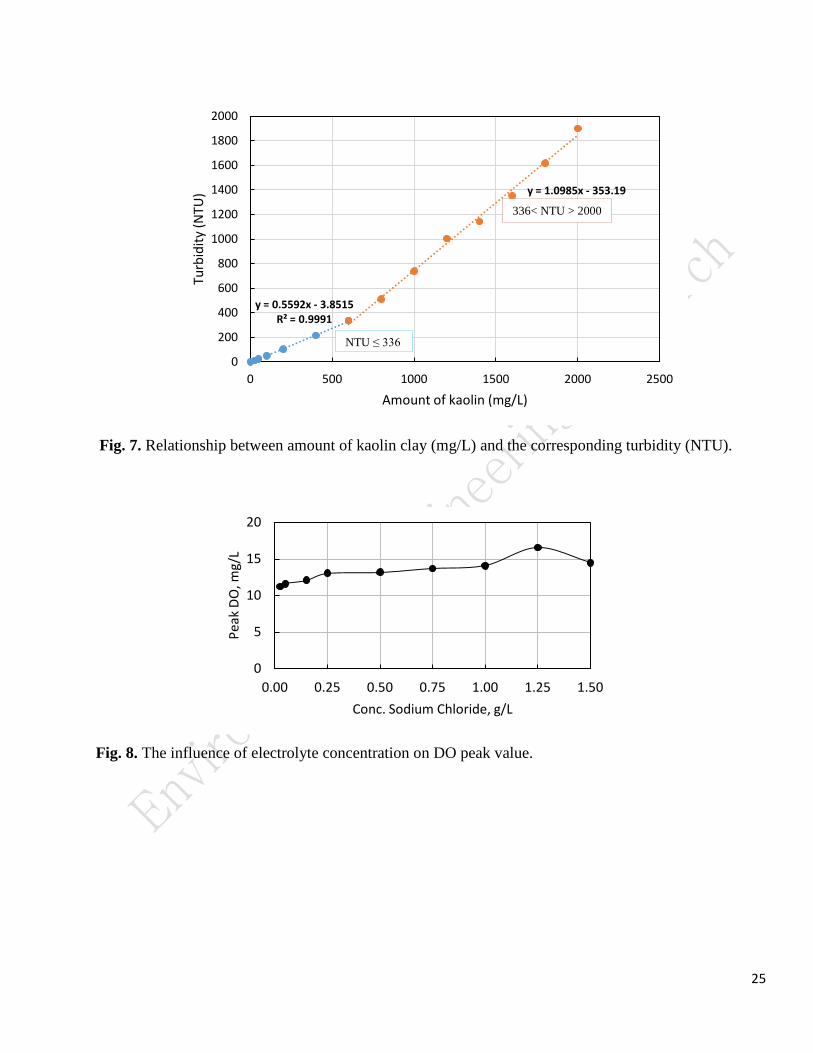
3.3. Influence of Turbidity and Its Amount on DO Increasing Pattern
Instead of adding arbitrary amounts of kaolin to attain a certain turbidity, an experiment was
carried out to determine the amount of kaolin clay per liter that should be added to achieve a
desired turbidity. Thus, the experiment was conducted so that the amount of kaolin suspension of
the synthetic water resulted in turbidity in the actual range of 0 NTU and 1,107 NTU. The actual
range was taken from the recently available daily minimum and maximum turbidities of all
stations of the four major basins of South Korea. Based on the experimental data collected, the
relationship between concentration of clay and turbidity was determined (Fig. 6). From the data
points, two separate linear regression relations were derived, one up to 336 NTU and the other
for greater values.
The effect of varying the amount of kaolin added while making the synthetic water and then
applying the NBs was then examined. The rate of DO increase was slightly affected by low
turbid water. However, highly turbid water, especially with turbidity above 336 NTU,
significantly affected the peak value of DO reached and the transfer rate. For water turbidity of
10 and 26 NTU, the calculated oxygen transfer rate was raised to 0.0473 and 0.0553 mg/L/min,
respectively, compared to 0.0405 mg/L/min of the turbidity free water. On the other hand, for
turbidity values equal to or greater than 336 NTU, the peak DO was limited to 11.0 mg/L.
However, it was able to reach a peak of 13.32 mg/L in limited turbidity cases.
Oxygen was more easily dissolved into water with low levels of suspended solids. The
dissolved and suspended particles which significantly contribute to turbidity depress the
11
Page 13
hydrodynamic activity and offer barriers to the passage of gas molecules at the gas-liquid
interface [23, 24]. When present in water, suspended and dissolved solids, which influence the
surface tension and viscosity, affect the size of air bubbles released from a generator and reduce
the transfer of oxygen into the solution. Solid particles collect on the bubble surface, forming a
wall that interferes with gas diffusion. The reduction in oxygen transfer varies with the extent of
surface tension change.
Thus, the interaction of the suspended particles and of NBs affects the dissolution of oxygen.
The data analyses of the stream stations recording turbidity showed that only five of the thirty-six
registered values were above 336 NTU. To increase the efficiency of oxygen supply using nano-
technology, it is important to consider suspension carried by the water to be aerated. By
decreasing the suspended solids or selecting proper timing related to the suspension amount, i.e.
turbidity, the oxygen dissolution by NBs can be improved.
3.4. Effect of NBs on Glucose Degradation
According to recent real-time water quality information, COD of Korea’s four major rivers is in
the range of 0 to 35 mg/L, with most of the streams showing values below 10 mg/L. To include
the application of NBs for wastewater treatment, COD values up to 500 mg/L were considered in
this study. Glucose decomposition by air NBs is depicted in table 1. Based on the results, percent
reductions of 2.76 to 7.16 in COD content were achieved during the 1 h NBs supply period. Li et
al. [3] achieved comparable results after the 1 h. mark by using a micro-bubbles collapse
technique on phenol degradation. However, in the present experiment, the increase in glucose
concentration did not show a significant trend, as the values in Table 1 show. Oxygen nano-
bubbling facilitates the chemical reaction at the gas-liquid interface and the formation of OH-
12
Page 14
radicals, which in turn aids organic decomposition [25, 26]. The bubbles react with the organic
matter contained in the liquid, whereby the organic matter is oxidized and degraded.
Takahashi and Li [25] coupled the application of NBs with the UV process, which
dramatically increased the efficiency of organic matter removal. In this study, hydrogen peroxide
is combined with the nano-bubbling, as it is often combined with other oxidizing processes, to
enhance the decomposition effect. In addition, hydrogen peroxide, H2O2, was selected because it
shows immediate and unselective reactivity with the majority of organic compounds [3]. It has
also been used as a dissolved oxygen supplement for BOD and COD [27]. Thus, to analyze the
combined effect of NBs and H2O2 on the degradation, 100 mg/L of glucose was used to form the
synthetic water. 10 mg/L of H2O2, which is equivalent to 0.089 mL (density of 1.12 g/mL) was
also spiked into the solution.
The H2O2 clearly affected the DO. The DO is improved simply by the H2O2 addition, or without
NBs application. In addition, the DO increased to a very high value of 14.7 mg/L, compared to
the 13.5 mg/L without H2O2. Furthermore, the glucose degradation was better when hydrogen
peroxide was used, even though the improvement was not significantly high. Hydrogen peroxide
decomposes to form water and oxygen, and thus can increase the DO concentration above the
steady state concentration [26]. In this way, it provides a source of reactive oxygen species, and
can be used as an oxygen supplement.
3.5. Effect of Electrolyte Concentration
The minimum and maximum values at each of the stations of the major rivers and their
tributaries for the duration of 31 mon were considered. 44 µS/cm and 2,801 µS/cm EC,
respectively, of the Han River were taken to represent the overall range. Based on the ‘rule of
13
Page 15
thumb’ for conductivity vs. concentration at 250C, the EC range corresponds to NaCl
concentration of 22 mg/L - 1,420 mg/L. However, rather than fixing the NaCl concentration
based on a general theoretical concept, a simple experiment was performed to determine what
amount of sodium chloride had to be added per liter to create a desired conductivity. The linear
regression equation representing this relationship between concentration, C (mg/L), of the solute
and EC (spc-µS/cm), (C = 0.0005EC – 0.0309) was used for the main experiment to achieve a
certain conductivity.
It can be recognized that, without the addition of sodium chloride, the DO ascended to a value
of 13.21 mg/L before stabilizing at 12.38 mg/L. When solute was added, the DO increased
continuously to a peak value and then dropped to a stable value, in a relatively short span of time.
This DO variation pattern was similar for all the different concentrations considered. The DO
increased to the peak value of 16.54 mg/L and then quickly stabilized at 11.20 mg/L, for a
concentration of 1.25 g/L.
Fig. 8 and Fig. 9 show the effects of the different amounts of sodium chloride considered on
the DO peak values and the oxygen mass transfer rate. The concentration of 1.25 g/L was the
turning point, with a peak value of 16.54 mg/L. The influence of the electrolytic solution
concentration was decreased thereafter. On the other hand, the oxygen transfer rate reached the
maximum value of 0.0482 mg/L/min for a concentration of 0.75 g/L. The transfer rate was
comparatively small with concentrations below 0.25 g/L. Besides, the rate showed a decreasing
trend when the concentration was increased beyond 0.75 g/L.
Hydration energy, which is energy released when ions come into contact with water
molecules, is the governing mechanism. The hydration energy of OH− is much lower than that of
H+, keeping a greater number of OH− at the gas-water interface. The interface charge is easily
14
Page 16
influenced by such parameters as electrolyte concentration. Thus, when water into which NaCl is
dissolved is nano-bubbled, Na+ is adsorbed as a counter ion for the excess OH− at the interface
[28]. In this study, at salinity of 1.5 g/L, an equilibrium state at the interface was likely achieved
with minimum zeta potential value. Increasing the salinity further, Cl− would replace adsorbing
at the interface in excess of Na+. Above 1.5 g/L, the zeta potential gradually increased, and this
in turn caused the release of oxygen to the atmosphere and thus lowered DO peak. This causes
the increase in zeta potential, and thus a decrease of DO peak value. Hence, the use of NBs for
bioremediation and other cases requiring massive oxygen transfer is greatly affected by the
salinity of the water.
The sodium chloride ions interfere with the performance of the NBs by exerting resistance to
the diffusion of the gases contained in the bubbles. The resistance increased with concentration
of the ions up to an equilibrium state of 0.75 g/L, after which it started to decline, and so was the
DO stagnation in the water. However, in the deionized or ultra-pure water, the increasing pattern
was different, as the DO became stabilized around the corresponding peak value. Generally, both
the DO peak value and the oxygen mass transfer rate showed a rising pattern up to a certain
concentration and then started to decrease. Therefore, electrolytic concentration affects the
interaction of nano-bubbles in oxygen mass transfer.
4. Conclusions
When applying microbubbles to water to supply oxygen, the bubbles last in water for only a few
minutes, but NBs can last in water for days. Thus, dissolved oxygen can be well-maintained for a
long time with NBs. The effectiveness of NBs depends directly on the number of NBs and on
their residence time. This study showed that the initial DO concentration affected the time taken
15
Page 17
to reach the saturation equilibrium, possibly because a high initial DO caused a greater number
of particles to nucleate. At low DO concentration, cavitation bubbles are harder to generate and
the distance between bubbles is too long to keep the size of bubbles small, as there is less
coalescence of bubbles. At higher DO concentration, coalescence between bubbles is repeated to
increase the number of bubbles. Thus, at higher DO concentration, a great number of bubbles
with good size distribution were likely generated following coalescence between the bubbles.
Gas type also plays a major role in mass transfer and stagnation time, as oxygen NBs have
higher oxygen transfer efficiency and more durable DO enhancement than air NBs. Therefore,
providing oxygen in the form of NBs is promising in terms of oxygen supply processes such as
for water body oxygenation, which can be used to control algal bloom and related water quality
problems. DO increased with electrolyte concentration as the tiny bubbles were stabilized, and in
this way, their life span in water was extended. On the other hand, the gas liquid interface charge
was affected by electrolyte concentration in such a way that when salinity was increased above
1.5 g/L, Cl− would replace, adsorbing at the interface in excess of Na+. This contributed to the
release of oxygen to the atmosphere and thus lowered DO peak.
A high concentration of particles, which contributes to turbidity, affects the NBs effect in
oxygen mass transfer to water by presenting a barrier to the passage of gas molecules at the gas-
liquid interface. Even though turbidity in the water column is mainly caused by suspended solids,
other constituents, such as organic matter and microorganisms, contribute to turbidity of water;
the latter is believed to consume DO. Therefore, the situation of actual water should be
considered in applications.
The application of NBs can also play a role in the mineralization of organic compounds so
that effectiveness and economic feasibility of biological processes involving aeration are
16
Page 18
optimized. NBs have been shown to be useful for improving the degradation of organic matter,
as the formation of OH radicals on NBs contributes to the removal of organic matter. Through
NBs application, up to 7.2% decomposition of glucose as representative organic matter was
achieved.
Thus, even if thermodynamics theory cannot describe the internal pressure of the NB, its stability
and its release of OH- radicals can contribute to a sustainable environmental treatment. In this
study, the persistence of nano-sized bubbles in water was examined in terms of dissolved oxygen
concentration and its prolonged existence beyond the saturation level. The quantitative
description of the physical properties of the NBs such as the zeta potential and particle size
provides a full explanation of the factors.
Acknowledgments
This work is supported by Korea Institute of Civil Engineering and Building Technology of
Korean Government number 2015-0152.
Common Symbols used
Symbol Unit Description
dc/dt - Oxygen transfer rate per unit volume
kLa 1/time Volumetric oxygen transfer rate (VOTR)
C∞ mg/L Near saturation dissolved oxygen (DO) conc. at infinite time
Ct mg/L DO at time t
C0 mg/L initial DO concentration at time t=0
EC spc-µS/cm Electrical conductivity
17
Page 19
BOD mg/L Biochemical oxygen demand
COD mg/L Chemical oxygen demand
References
1. Michioku K, Sakatani Y, Matsuo K, Oda T, Hara Y. Reservoir Purification by Using
Micro-Bubble Aerator. In: 7th International Conference on Hydroscience and Engineering
(ICHE); 2006 Sep 10- 13; Philadelphia, USA.
2. Srithongouthai S, Endo A, Inoue A, et al. Control of dissolved oxygen levels of water in
net pens for fish farming by a microscopic bubble generating system. Fisheries Sci.
2006;72:485-493.
3. Li P, Takahashi M, Chiba K. Degradation of phenol by the collapse of microbubbles.
Chemosphere 2009;75:1371-1375.
4. Kim KH, Lee KH, Adachi Y, Pyun CK. Field Investigation of Water Purification
Technique in the Lagoon. In: 6th International Conference on Offshore and Polar
Engineering; 2006 May 28-June 2; California, USA.
5. Burns SE, Yiacoumi S, Tsouris C. Microbubble generation for environmental and
industrial separations. Sep. Purif. Technol. 1997;11:221-232.
6. Takahashi M. Nanobubbles: An introduction. In: Tsuge H, eds. Micro- and nanobubbles:
Fundamentals and applications. Singapore: Pan Stanford Publishing; 2014. p. 307-315.
7. Calgaroto S, Wilberg KQ, Rubio J. On the nanobubbles interfacial properties and future
applications in flotation. Miner. Eng. 2014;60:33-40.
Agarwal A, Ng WJ, Liu Y. Principle and applications of microbubble and nanobubble
technology for water treatment. Chemosphere 2011;84:1175-1180.
18
Page 20
8. Cho SH, Kim JY, Chun JH, Kim JD. Ultrasonic formation of nanobubbles and their zeta-
potentials in aqueous electrolyte and surfactant solutions. Colloid. Surface. A. 2005;269:28-
34.
9. Kikuchi K, Ioka A, Oku T, Tanaka Y, Saihara Y, Ogumi Z. Concentration determination
of oxygen nanobubbles in electrolyzed water. J. Colloid Interf. Sci. 2009;329:306-309.
10. Uchida T, Oshita S, Ohmori M, et al. Transmission electron microscopic observations of
nanobubbles and their capture of impurities in wastewater. Nanoscale Res. Lett. 2011;6:295.
11. Ushikubo FY, Furukawa T, Nakagawa R, et al. Evidence of the existence and the stability
of nano-bubbles in water. Colloid Surfaces A. 2010;361:31-37.
12. Wu C, Nesset N, Masliyah J, Xu Z. Generation and characterization of submicron size
bubbles. Adv. Colloid Interfac. 2012;179-182:123-132.
13. Najafi AS, Drelich J, Yeung A, Xu Z, Masliyah J. A novel method of measuring
electrophoretic mobility of gas bubbles. J. Colloid Interf. Sci. 2007;308:344-350.
14. Yount, DE. On the elastic properties of the interfaces that stabilize gas cavitation nuclei.
J. Colloid Interf. Sci. 1997;193:50-59.
15. Hampton MA, Nguyen AV. Nanobubbles and the nanobubble bridging capillary force.
Adv. Colloid Interf. Sci. 2010;154:30-55.
16. Jiang P. Gas Transfer Parameter Estimation: Applications and Implications of Classical
Assumptions [dissertation]. USA: Univ. of California; 2010.
17. Muroyama K., Imai K, Oka Y, Hayashi J. Mass transfer properties in a bubble column
associated with micro-bubble dispersions. Chem. Eng. Sci. 2013;100:464-473.
19
Page 21
18. Sadatomi M, Kawahara A, Matsuura H, Shikatani S. Micro-bubble generation rate and
bubble dissolution rate into water by a simple multi-fluid mixer with orifice and porous tube.
Exp. Therm. Fluid Sci. 2012;41:23-30.
19. He Y. An Alternative Mathematical Model for Oxygen Transfer Evaluation in Clean
Water. Case Study. June 20, 2014. http://www.wateronline.com/doc/an-alternative-
mathematical-model-for-oxygen-transfer.
20. Kawahara A, Sadatomi M, Matsuyama F, Matsuura H, Tominaga M, Noguchi M.
Prediction of micro-bubble dissolution characteristics in water and seawater. Exp. Therm.
Fluid Sci. 2009;33:883-894.
21. Li H, Hu L, Song D, Al-Tabbaa A. Subsurface transport behavior of micro-nano bubbles
and potential applications for groundwater remediation. Int. J. Environ. Res. Public Health
2014;11:473-486.
22. Ljunggren S, Eriksson JC. The lifetime of a colloid-sized gas bubble in water and the
cause of hydrophobic attraction. Colloids and Surface A. 1997;129-130:151-155.
23. Leu HG, Lin SH, Shyu CC, Lin CM. Effects of surfactants and suspended solids on
oxygen transfer under various operating conditions. Environ. Technol. 1998;19:299-306.
24. Takahashi M, Li P. Base and technological application of micro-bubble and nanobubble.
J. Phys. Chem. 2009;22:2-19.
25. Ghadimkhani A, Zhang W, Marhaba T. Ceramic membrane defouling (cleaning) by air
nano bubbles. Chemosphere 2016;146:379-384.
26. Riser-Roberts E. Remediation of petroleum contaminated soils; biological, physical and
chemical processes. Lewis publishers: USA; 1998.
20
Page 22
27. Li H, Hu L, Xia Z. Impact of groundwater salinity on bioremediation enhanced by
micro-nano bubbles. Materials 2013;6:3676-3687.
Figure legends
Fig. 1. The experimental Set-up.
Fig. 2. Variation of DO with time, for the different initial DO concentrations.
Fig. 3. Volumetric oxygen transfer coefficient by air NBs for different initial
oxygen concentrations.
Fig. 4. Variation of average initial DO increasing rate based on initial DO.
Fig. 5. Effect of initial dissolved oxygen concentration and gas type on oxygen
transfer efficiency, OTE (%).
Fig. 6. Graphs showing stagnation time for different initial DO.
Fig. 7. Relationship between amount of kaolin clay (mg/L) and the corresponding
turbidity (NTU).
Fig. 8. The influence of electrolyte concentration on DO peak value.
Fig. 9. (a) The oxygen mass transfer rate for NaCl concentration of 0.75 g/L and
(b) The influence of electrolyte concentration volumetric oxygen transfer rate.
21
Page 23
List of figures
1. Ultra-pure water tank
2. Air Compressor
3. Nanobubbles Generator
4. Synthetic water tank
5. Agitator
6. Nanobubbles supply line
7. Drain & sampling port
8. Overflow line
Fig. 1. The experimental Set-up.
Fig. 2. Variation of dissolved oxygen (DO) with time, for the different initial DO concentrations.
0
5
10
15
20
25
30
35
40
45
0 30 60 90 120 150 180 210 240 270
DO C
onc,
mg/
L
Time, Min
Intial DO = 4 mg/L (oxygen) Intial DO = 6.4 mg/L (oxygen) Initial DO = 8 mg/L (oxygen) Initial DO = 10 mg/L (oxygen) Initial DO = 4 mg/L (Air)
22
Page 24
Fig. 3. Volumetric oxygen transfer rate (VOTR) by air NBs for different initial oxygen concentrations.
Fig. 4. Variation of average initial dissolved oxygen increasing rate (AIDOIR) based on initial DO.
y = 0.0159x - 0.3069 R² = 0.9036
0.0 1.0 2.0 3.0 4.0 5.0 6.0
0 30 60 90 120 150 180 210 240 270 300
-ln((C
s-Ct)/
(Cs-C
0))
Time, min
VOTR, Initial DO = 3.14 mg/L
y = 0.0171x - 0.1667 R² = 0.9674
0.0 1.0 2.0 3.0 4.0 5.0
0 30 60 90 120 150 180 210 240 -ln((C
s-Ct)/
(Cs-C
0))
Time, min
VOTR, Initial DO = 5.2 mg/L
y = 0.0186x - 0.2131 R² = 0.968
0.0 1.0 2.0 3.0 4.0 5.0
0 30 60 90 120 150 180 210
-ln((C
s-Ct)/
(Cs-C
o))
Time, min
VOTR, Initial DO = 7.0 mg/L
y = 0.0193x + 0.2944 R² = 0.986
0.0
1.0
2.0
3.0
4.0
0 30 60 90 120 150
-ln((C
s-Ct)/
(Cs-C
0))
Time, min
VOTR, Initial DO = 8.2 mg/L
0.00
0.04
0.08
0.12
0.16
0.20
3 4 5 6 7 8 9 10
AIDO
IR, m
g/L/
Min
Initial DO, mg/L
Oxygen Air
23
Page 25
Fig. 5. Effect of initial dissolved oxygen concentration and gas type on oxygen transfer efficiency, OTE
(%).
Fig. 6. Graphs showing stagnation time for different initial dissolved oxygen (DO).
0
2
4
6
8
10
Oxygen Air
OTE
, %
Intial DO=4 mg/L Intial DO=5.5 mg/L
Initial DO=7 mg/L Initial DO=9 mg/L
5
10
15
20
25
30
35
40
45
1 2 3 4 5 6 7 8 9 10 11 12
DO, m
g/L
Time, Day
Initial DO = 4 mg/L and 1L water Initial DO = 5.5 mg/L and 1L water Initial DO = 9 mg/L and 1L water
24
Page 26
Fig. 7. Relationship between amount of kaolin clay (mg/L) and the corresponding turbidity (NTU).
Fig. 8. The influence of electrolyte concentration on DO peak value.
y = 0.5592x - 3.8515 R² = 0.9991
y = 1.0985x - 353.19 R² = 0.9948
0
200
400
600
800
1000
1200
1400
1600
1800
2000
0 500 1000 1500 2000 2500
Turb
idity
(NTU
)
Amount of kaolin (mg/L)
0
5
10
15
20
0.00 0.25 0.50 0.75 1.00 1.25 1.50
Peak
DO
, mg/
L
Conc. Sodium Chloride, g/L
336< NTU > 2000
NTU ≤ 336
25
Page 27
y = -0.0482x + 1.8136 R² = 0.9656
0.0
0.4
0.8
1.2
1.6
0 5 10 15 20 25 30 35
ln (C
s-C)
, mg/
L
Time, min
0
0.01
0.02
0.03
0.04
0.05
0.06
0.00 0.25 0.50 0.75 1.00 1.25 1.50
OTR
, m
g/L/
min
Conc. of sodium chloride, g/L
(b)
(a)
26
Page 28
Fig. 9. (a) The oxygen mass transfer rate for NaCl concentration of 0.75 g/L and (b) The
influence of electrolyte concentration on oxygen transfer rate per unit volume (OTR).
List of tables
Table 1. Percent Reduction of Chemical Oxygen Demand (COD) after 30 Min and 1 H. of NBs
Application (with and without Hydrogen Peroxide, H2O2).
Time
(min)
Concentration of glucose, mg/L
10 50 100 150 200 300 400 500 100 + H2O2
30 1.00 1.94 2.87 4.35 2.41 4.05 2.22 1.30 5.52
60 3.23 5.52 3.59 4.61 5.36 7.16 2.76 3.47 8.12
27