Page 1
EXTRACTION OF ALUMINIUM FROM COAL FLY ASH
USING A TWO-STEP ACID LEACH PROCESS
Alan Shemi
A dissertation submitted to the faculty of Engineering and the Built Environment,
University of Witwatersrand, Johannesburg, in fulfillment of the requirements for
the degree of Master of Science in Engineering
Page 2
Extraction of Aluminium from CFA Alan Shemi
Page ii
DECLARATION
I declare that this dissertation is my own unaided work. It is being submitted to the degree of
Master of Science in Engineering to the University of the Witwatersrand, Johannesburg. It has
not been submitted before for any other degree or examination in any other University.
----------------------------------
Alan Shemi
14th
Day of May 2013
Page 3
Extraction of Aluminium from CFA Alan Shemi
Page iii
ABSTRACT
Hydrometallurgical extraction technologies provide a process route for resource recovery of
valuable metals from both primary as well as secondary resources. In this study, the possibility
of treating coal fly ash (CFA), a residue formed as a result of coal combustion in coal-fired
power plants, was investigated. Eskom CFA contains significant amounts of alumina typically,
26-31%, in two dissimilar phases, namely amorphous and crystalline mullite, which may be
processed separately. Due to its high silica content, however, CFA cannot be treated through the
Bayer process route. Therefore, a leach-sinter-leach process was formulated that employed a
two-step acid leach technique to extract alumina from CFA using sulphuric acid.
In the preliminary test work, the effect of parameters on CFA leaching characteristics was
investigated. From the experimental results, appropriate factor levels were found to be 6M acid
concentration, 6 hours leaching time, 75°C temperature and 1:4 solid to liquid ratio. Calcium
sulphate precipitate formation was found to inhibit aluminium extraction and activation energy-
based kinetic results showed that aluminium extraction from CFA was a product diffusion layer
controlled mechanism.
By leaching the CFA, and using design of experiments (DOE) and response surface methodology
strategy for screening and optimization of significant factors, it was found that temperature and
leaching time significantly influence the aluminium extraction process. The theoretical optimum
conditions established from the statistically based optimization model, for a maximum
aluminium extraction of 23.9%, was found to be a temperature of 82°C and a leaching time of
10.2 hrs.
Using the optimum conditions, the first stage leaching was done, followed by sintering at
1150°C for 180 minutes to liberate the mullite phase aluminium and then second stage leaching.
An aluminium extraction of 24.8%, representing 89.3% extraction from the CFA amorphous
phase, was obtained from first stage leaching. The second stage leaching yielded an aluminium
extraction of 84.3%. A combination of the two leaching stages gave a total aluminium extraction
of 88.2%.
This work has shown that by employing a leach-sinter-leach method based on a two-step acid
leach technique, CFA can be optimally leached.
Page 4
Extraction of Aluminium from CFA Alan Shemi
Page iv
PUBLICATIONS AND PRESENTATIONS
This work has produced some publications.
Journal Publications
1. Shemi, A., Mpana, R.N., Ndlovu, S., van Dyk, L.D., Sibanda, V., Seepe, L., 2012.
Alternative techniques for extracting alumina from coal fly ash. Minerals Engineering 34, pp.
30-37.
Conference Proceedings
1. Shemi, A., Ndlovu, S., Sibanda, V., van Dyk, L.D., 2012. Extraction of alumina from coal fly
ash: Identification and Optimization of Influential Factors: Anglo American
Hydrometallurgy Symposium, University of Cape Town, South Africa, 29th
July – 1st
August, 2012.
2. Shemi, A., Ndlovu, S., Sibanda, V., van Dyk, L.D., Mpana, R.N., Seepe, L., 2011. Coal fly
ash as an alternative source of smelter grade alumina: A comparison of aluminium extraction
techniques. The 6th
International Conference of the African Materials Research Society,
Victoria Falls, Zimbabwe, 11th
– 16th
December 2011.
3. Sibanda, V., Ndlovu, S., van Dyk, L.D., Shemi, A., Mpana, R.N., 2011. Alternative
techniques for extracting alumina from coal fly ash: Conference of metallurgists (COM)
2011, Montreal Canada, 2nd
– 5th
October 2011.
Page 5
Extraction of Aluminium from CFA Alan Shemi
Page v
DEDICATION
Dedicated to
my lovely wife, Alice and three children, Ettric, Lerato and Elvin for their
understanding and support
Page 6
Extraction of Aluminium from CFA Alan Shemi
Page vi
ACKNOWLEDGEMENTS
I wish to express my special gratitude to my supervisor Prof. S. Ndlovu, for the many
inspirational discussions, insight and technical guidance throughout this work. My sincere
gratitude goes to my co-supervisors Dr. V. Sibanda and Dr. L. VanDyk for their many helpful
suggestions and technical support.
Kendal Power Plant, a division of Eskom (RSA), is gratefully acknowledged for the coal fly ash
used in this study.
The National Research Foundation of South Africa and Carnegie are gratefully acknowledged
for their financial contribution to the research.
Birkenmayer (Pty) Ltd is gratefully acknowledged for helping with the pelletization of coal fly
ash.
While many other persons have contributed either directly or indirectly to this work, I should like
to mention some of them by name: Dr. M. Bwalya, Geoffrey Simate, Bruce Mothibedi and Steyn
Herman, many thanks for their continued interest and support.
Finally, special thanks to the Metals Extraction and Recovery Research Group (MERG) for team
work.
Page 7
Extraction of Aluminium from CFA Alan Shemi
Page vii
Table of Contents
DECLARATION........................................................................................................................... ii
ABSTRACT .................................................................................................................................. iii
PUBLICATIONS AND PRESENTATIONS ................................................................................ iii
DEDICATION............................................................................................................................... v
ACKNOWLEDGEMENTS ........................................................................................................... vi
LIST OF FIGURES ........................................................................................................................ x
LIST OF TABLES ......................................................................................................................... xi
CHAPTER ONE ............................................................................................................................. 1
INTRODUCTION ........................................................................................................................... 1
1.1 Introduction ...................................................................................................................... 1
1.2 Problem Statement ........................................................................................................... 7
1.3 Objectives ......................................................................................................................... 7
1.4 Research Methodology ..................................................................................................... 7
1.5 Dissertation Lay out ......................................................................................................... 7
1.6 Summary .......................................................................................................................... 8
CHAPTER TWO .......................................................................................................................... 10
LITERATURE REVIEW ................................................................................................................ 10
2.1 General Introduction ...................................................................................................... 10
2.1.1 Aluminium ............................................................................................................... 11
2.2 Coal Fly Ash Source and Mineralogy ............................................................................ 11
2.3 Currently Existing CFA Processing Methods ................................................................ 13
2.3.1 Bioleaching ............................................................................................................. 14
2.3.2 Alkaline Leaching ................................................................................................... 15
2.3.3 Acid Leaching of CFA ............................................................................................. 15
2.4 Sintering Process ............................................................................................................ 21
2.4.1 Pelletization ............................................................................................................ 21
2.4.2 Sintering .................................................................................................................. 21
2.4.3 Post-sinter Leaching ............................................................................................... 22
2.5 The Kinetics of Leaching Processes............................................................................... 24
2.6 Summary ........................................................................................................................ 28
CHAPTER THREE ...................................................................................................................... 29
MATERIALS AND METHODS ..................................................................................................... 29
3.1 Introduction .................................................................................................................... 29
Page 8
Extraction of Aluminium from CFA Alan Shemi
Page viii
3.2 Experimental .................................................................................................................. 29
3.2.1 Coal Fly Ash ........................................................................................................... 29
3.2.2 Reagents .................................................................................................................. 31
3.2.3 Coal ......................................................................................................................... 32
3.2.4 Design of Experiments ............................................................................................ 32
3.2.5 Acid Leaching of CFA ............................................................................................. 36
3.2.6 Pelletization ............................................................................................................ 39
3.2.7 Sintering of Pellets .................................................................................................. 39
3.2.8 Post-sinter Leaching of the Sintered Pellets ........................................................... 40
3.2.9 Experimental Design ............................................................................................... 40
3.3 Data Analysis ................................................................................................................. 41
CHAPTER FOUR ......................................................................................................................... 42
PRELIMINARY ACID LEACHING .............................................................................................. 42
4.1 Introduction .................................................................................................................... 42
4.2 Results and Discussion ................................................................................................... 43
4.2.1 Elemental Composition of CFA by Particle Size .................................................... 43
4.2.2 Effect of Temperature ............................................................................................. 43
4.2.3 Effect of Time .......................................................................................................... 44
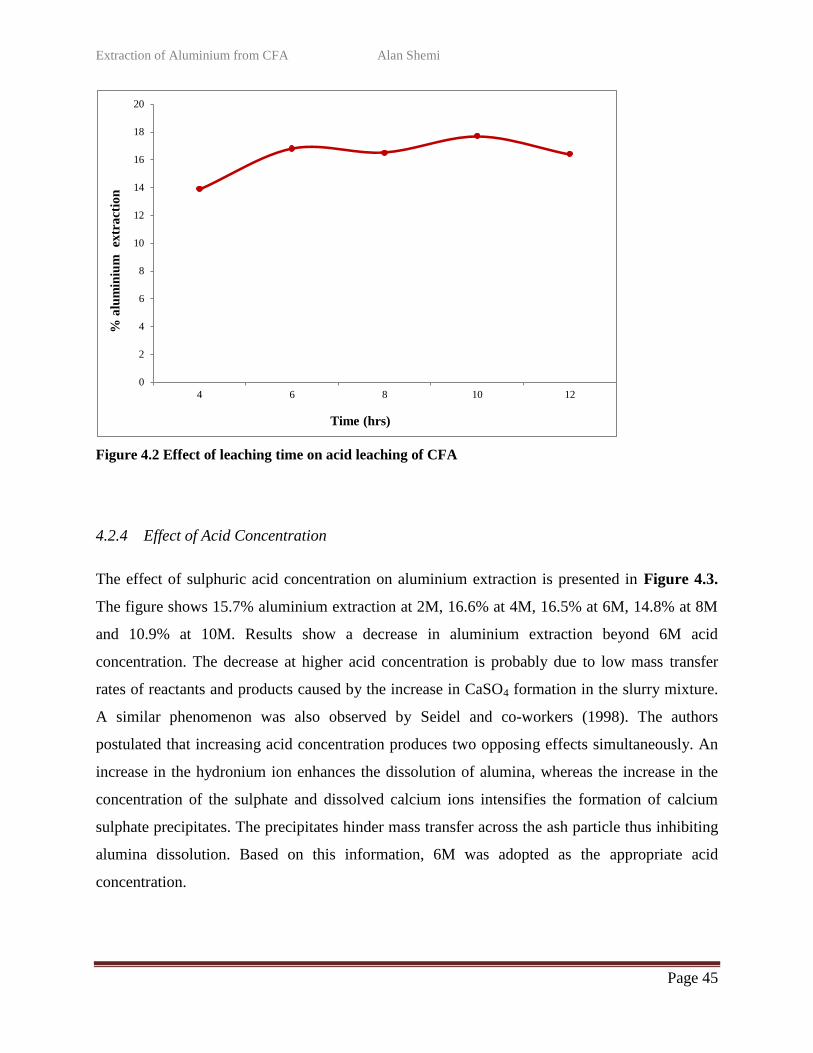
4.2.4 Effect of Acid Concentration ................................................................................... 45
4.2.5 Effect of Solid to Liquid ratio ................................................................................. 46
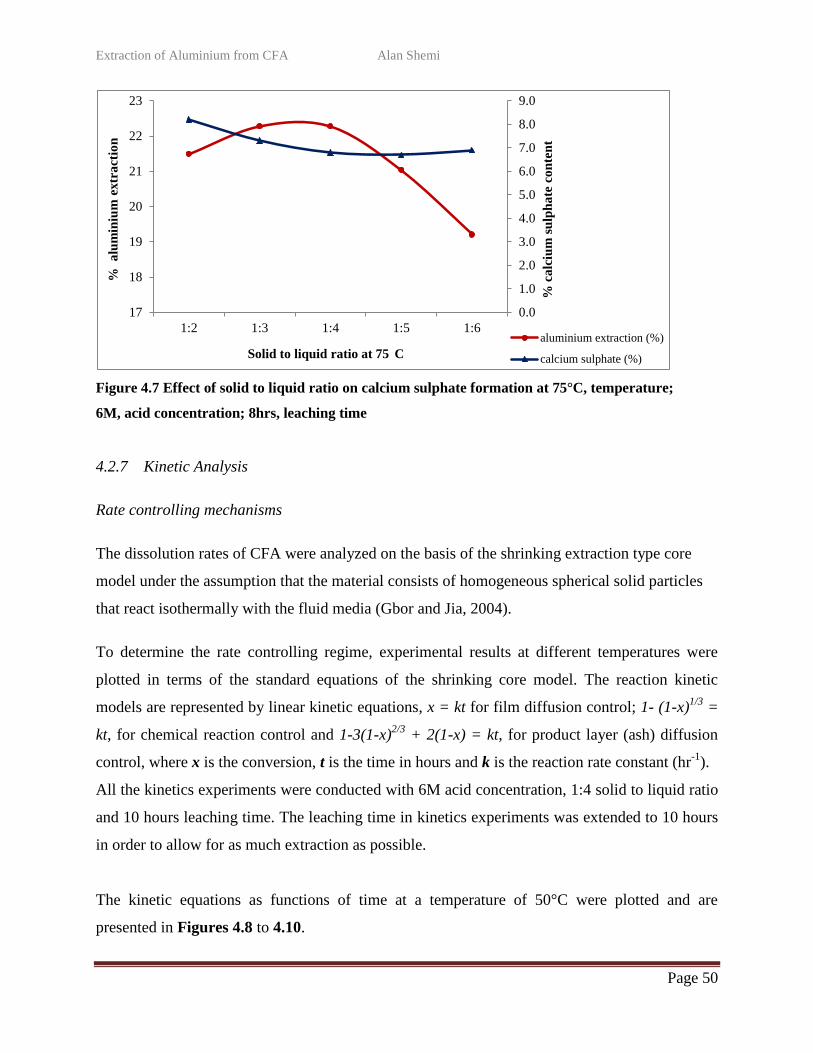
4.2.6 Role of Calcium Sulphate in the Dissolution Behaviour of CFA ............................ 47
4.2.7 Kinetic Analysis ...................................................................................................... 50
4.3 Summary and Conclusions ............................................................................................. 61
CHAPTER FIVE .......................................................................................................................... 63
IDENTIFICATION OF SIGNIFICANT FACTORS ...................................................................... 63
5.1 Introduction .................................................................................................................... 63
5.2 Experimental Plan for Statistical Design of Experiments (DOE) .................................. 64
5.2.1 Methodology for Data Analysis .............................................................................. 66
5.3 Results and Discussion ................................................................................................... 68
5.3.1 Significant factors ................................................................................................... 68
5.3.2 Influence of factors on extraction ........................................................................... 75
5.4 Summary and Conclusions ............................................................................................. 79
CHAPTER SIX ............................................................................................................................. 81
OPTIMIZATION OF SIGNIFICANT FACTORS .......................................................................... 81
Page 9
Extraction of Aluminium from CFA Alan Shemi
Page ix
6.1 Introduction .................................................................................................................... 81
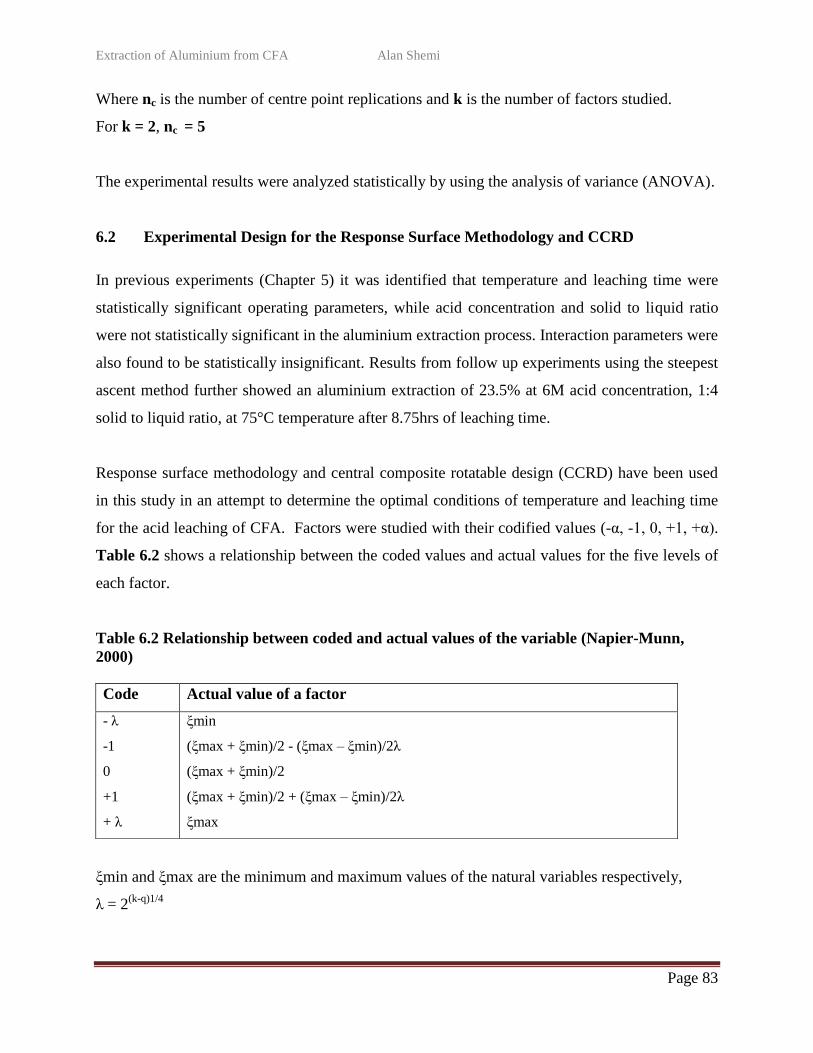
6.2 Experimental Design for the Response Surface Methodology and CCRD .................... 83
6.3 Results and Discussion ................................................................................................... 85
6.3.1 Derivation of the model .......................................................................................... 85
6.3.2 Checking the Adequacy of the Developed Model ................................................... 86
6.3.3 Determination of Optimum Conditions ................................................................... 89
6.3.4 Confirmatory Experiments ...................................................................................... 90
6.4 Summary and Conclusions ............................................................................................. 91
CHAPTER SEVEN ...................................................................................................................... 93
POST-SINTER (SECOND STAGE) LEACHING .......................................................................... 93
7.1 Introduction .................................................................................................................... 93
7.2 Results and Discussion ................................................................................................... 95
7.2.1 Effect of Sintering ................................................................................................... 95
7.2.2 Effect of Post-sinter (Second Stage) Leaching........................................................ 96
7.2.3 The Pre-sinter and Post-sinter Combined Aluminium Extraction ........................ 100
7.3 Summary and Conclusions ........................................................................................... 103
CHAPTER EIGHT ..................................................................................................................... 105
CONCLUSIONS AND RECOMMENDATIONS ......................................................................... 105
8.1 Conclusions .................................................................................................................. 105
8.1.1 Introduction........................................................................................................... 105
8.1.2 Preliminary Acid Leaching ................................................................................... 105
8.1.3 Identification of Significant Factors ..................................................................... 107
8.1.4 Optimization of Significant Factors ...................................................................... 108
8.1.5 Kinetic Analysis .................................................................................................... 108
8.1.6 Post-sinter Leaching ............................................................................................. 109
8.1.7 Specific Outcomes ................................................................................................. 110
8.2 Recommendations ........................................................................................................ 111
REFERENCES .......................................................................................................................... 113
APPENDICES ............................................................................................................................ 120
APPENDIX A ............................................................................................................................. 121
APPENDIX B ............................................................................................................................. 136
APPENDIX C ............................................................................................................................. 141
APPENDIX D ............................................................................................................................. 145
APPENDIX E ............................................................................................................................. 149
Page 10
Extraction of Aluminium from CFA Alan Shemi
Page x
LIST OF FIGURES
Figure 1.1 A flow diagram of the proposed two-step acid leach process for extracting
alumina from CFA…………. ……………………………………………………………......6
Figure 1.2 Dissertation layout………………………………………………………………...9
Figure 2.1 A flow diagram of the current lime-sinter process for extracting alumina
from CFA................................................................................................................................23
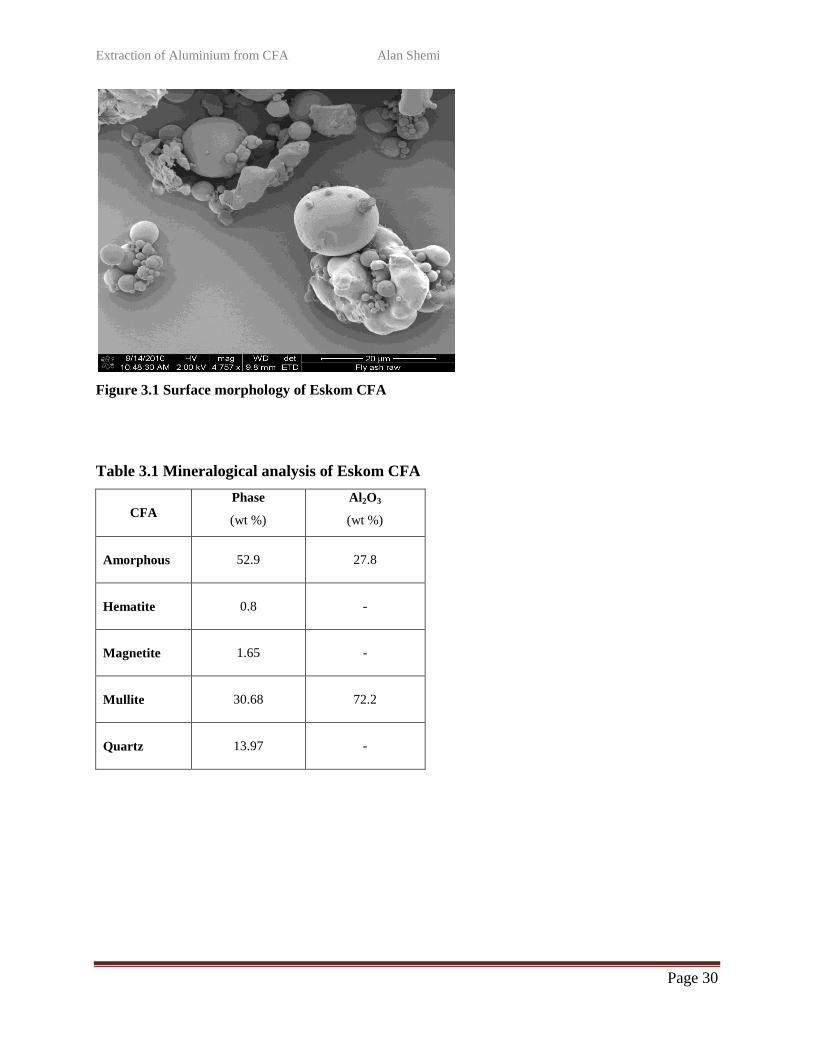
Figure 3.1 Surface morphology of Eskom CFA……………………………….....................30
Figure 3.2 Particle size distribution of Eskom CFA………………………………………...31
Figure 3.3 Agitation leaching equipment (reciprocal thermal shaking water bath)…………36
Figure 3.4 Sintering equipment; the 1300°C muffle chamber furnace ……………………..39
Figure 4.1 Effect of temperature on acid leaching of CFA…………………………….........44
Figure 4.2 Effect of leaching time on acid leaching of CFA...................................................45
Figure 4.3 Effect of acid concentration on acid leaching of CFA……………………….......46
Figure 4.4 Effect of solid to liquid ratio on acid leaching of CFA……………………..........47
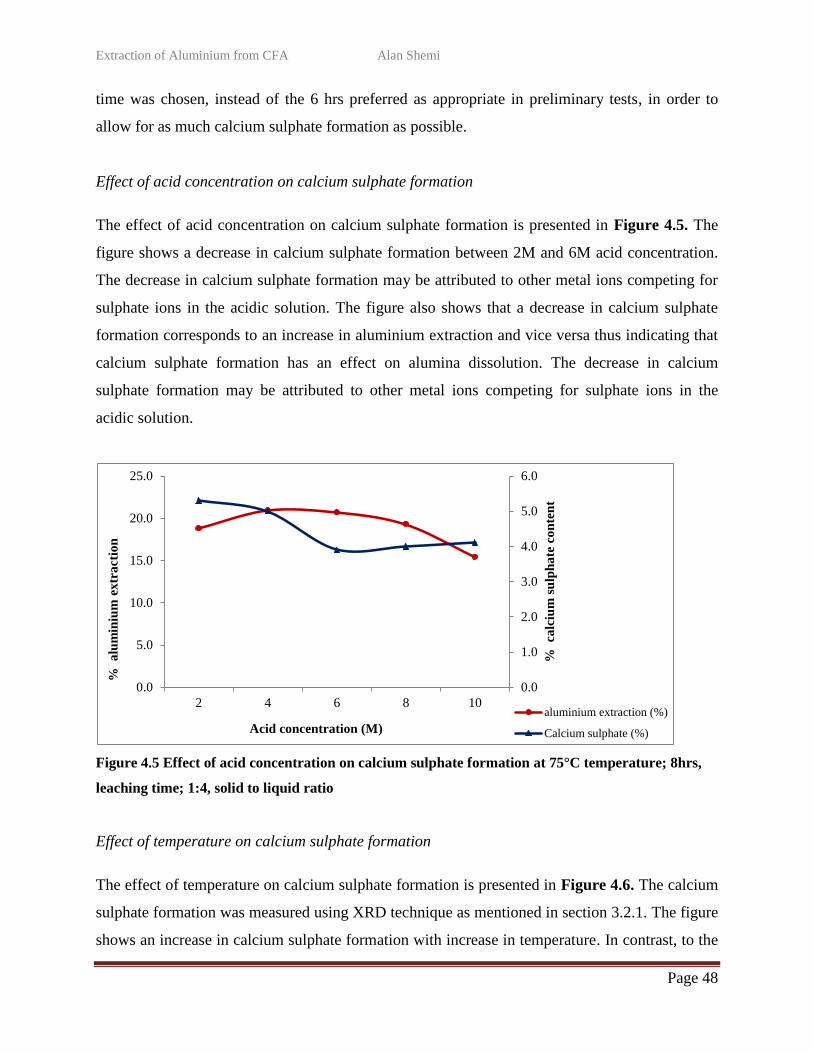
Figure 4.5 Effect of acid concentration on calcium sulphate formation at 75°C……….........48
Figure 4.6 Effect of temperature on calcium sulphate formation at different temperatures…49
Figure 4.7 Effect of solid to liquid ratio on calcium sulphate formation at 75°C……………50
Figure 4.8 Plot of x versus time for the acid leaching of CFA at 50°C………………………51
Figure 4.9 Plot of 1- (1-x)1/3
versus time for the acid leaching of CFA at 50°C……………..51
Figure 4.10 Plot of 1- 3(1-x)2/3
+ 2(1-x) versus time for the acid leaching of CFA at 50°C…52
Figure 4.11 Plot of x versus time for the acid leaching of CFA at 70°C……………………..53
Figure 4.12 Plot of 1- (1-x)1/3
versus time for the acid leaching of CFA at 70°C……………53
Figure 4.13 Plot of 1- 3(1-x)2/3
+ 2(1-x) versus time for the acid leaching of CFA at 70°C…54
Figure 4.14 Plot of x versus time for the acid leaching of CFA at 82°C……………………..55
Figure 4.15 Plot of 1- (1-x)1/3
versus time for the acid leaching of CFA at 82°C……………55
Figure 4.16 Plot of 1- 3(1-x)2/3
+ 2(1-x) versus time for the acid leaching of CFA at 82°C…56
Figure 4.17 Variation of aluminium sulphate concentration with time…………....................58
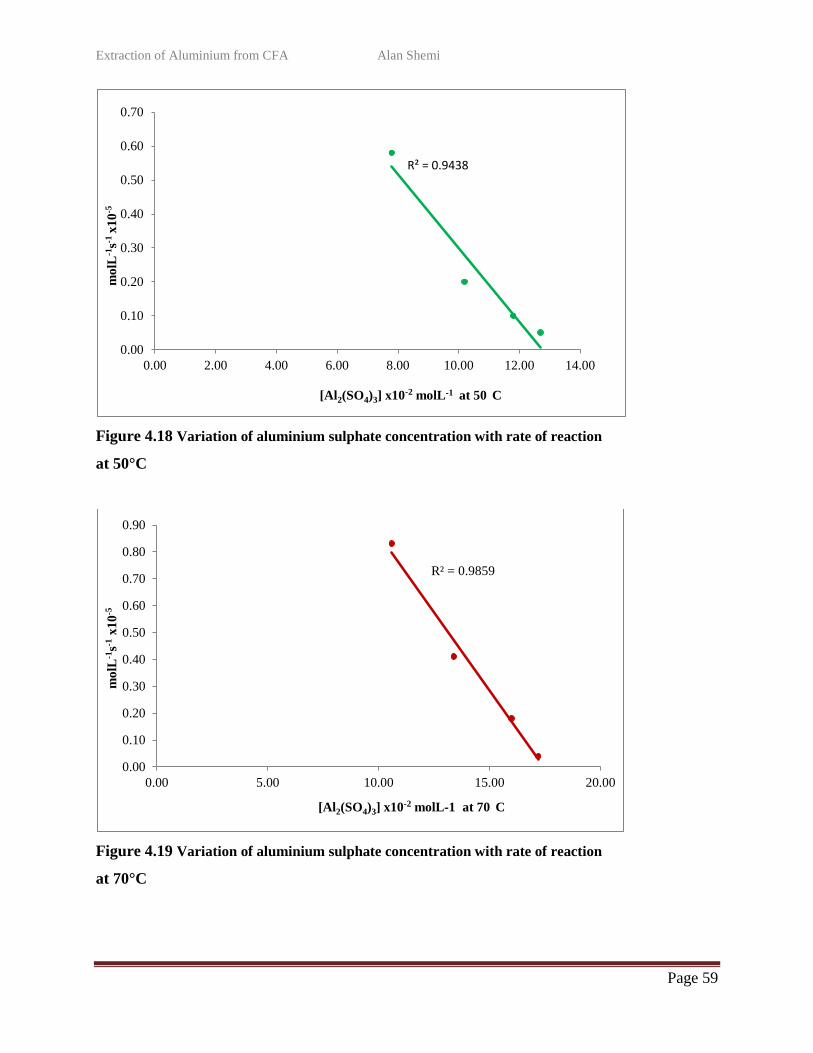
Figure 4.18 Variation of aluminium sulphate concentration with rate of reaction at 50°C…..59
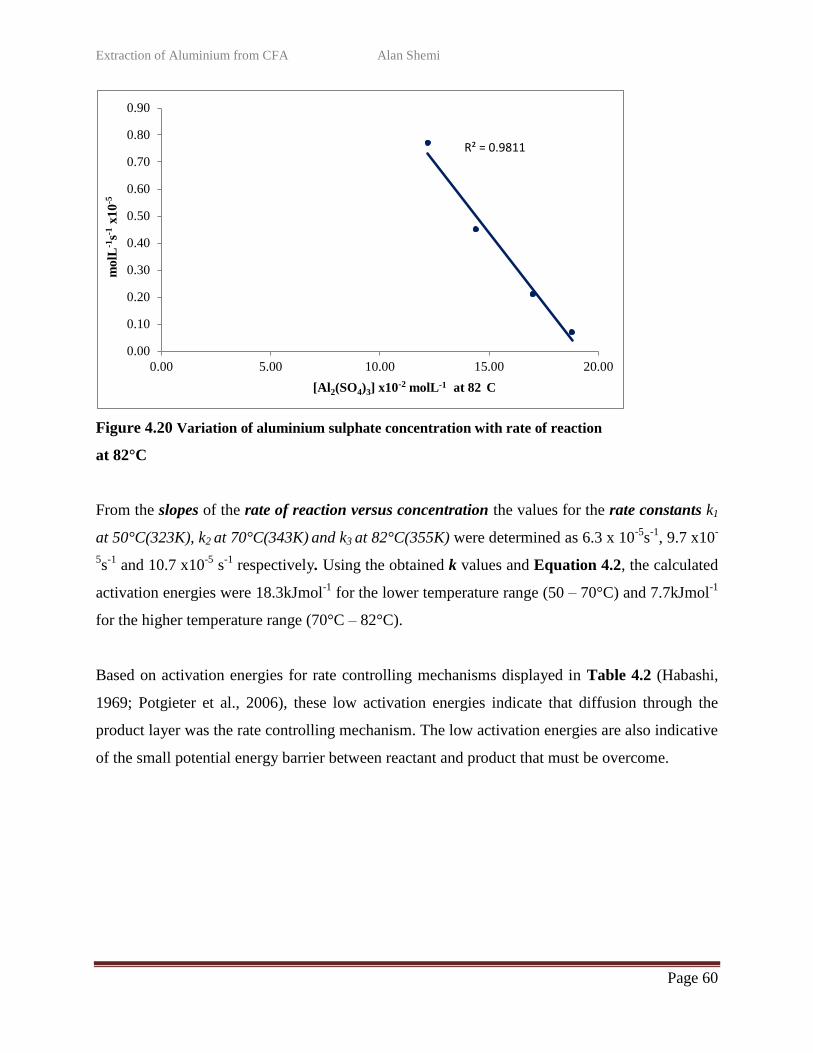
Figure 4.19 Variation of aluminium sulphate concentration with rate of reaction at 70°C…..59
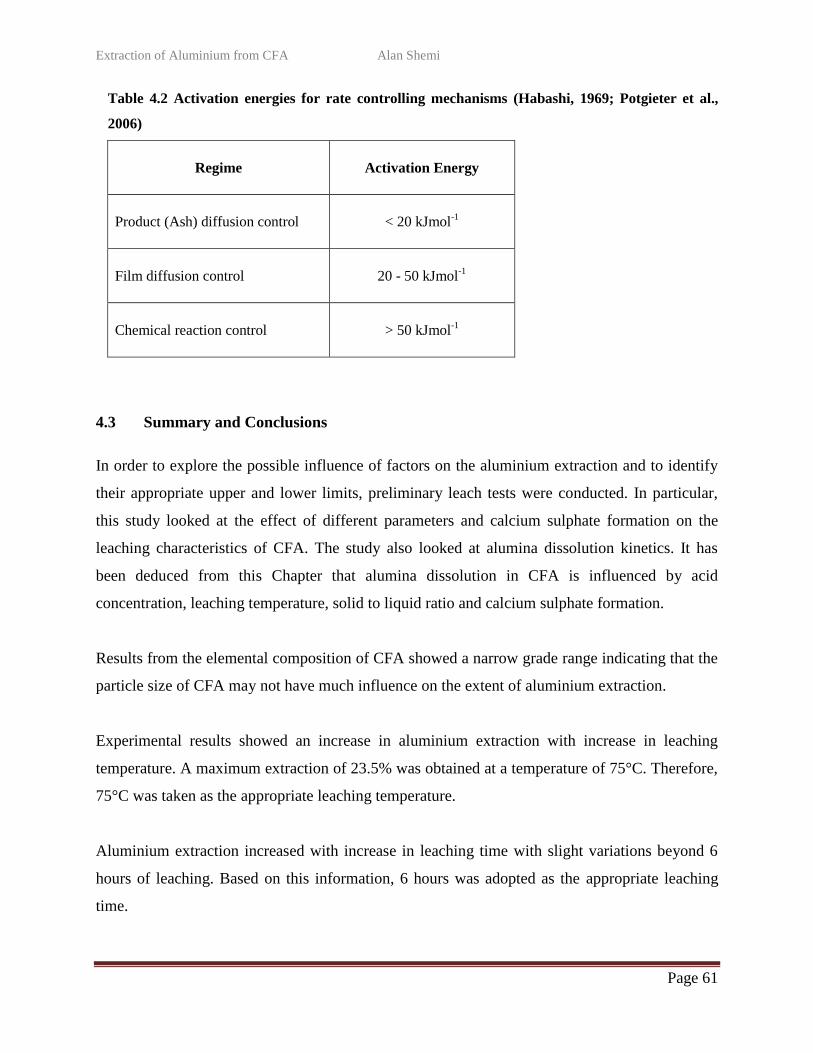
Figure 4.20 Variation of aluminium sulphate concentration with rate of reaction at 82°C…..60
Figure 5.1 Pareto chart showing significance of main and interactive effects of: acid
concentration, time, temperature and solid to liquid ratio……………………………………70
Page 11
Extraction of Aluminium from CFA Alan Shemi
Page xi
LIST OF FIGURES (CONTINUED)
Figure 5.2 Normal plot of effects of main factors and factor interactions from the 24
full
factorial design……………………………………………………………………………….71
Figure 5.3 Normal Plot of residuals.........................................................................................74
Figure 5.4 Plot of residuals versus predicted extractions........................................................75
Figure 5.5 Effect of acid concentration on acid leaching of CFA…………………………...76
Figure 5.6 Effect of leaching time on acid leaching of CFA………………………………...77
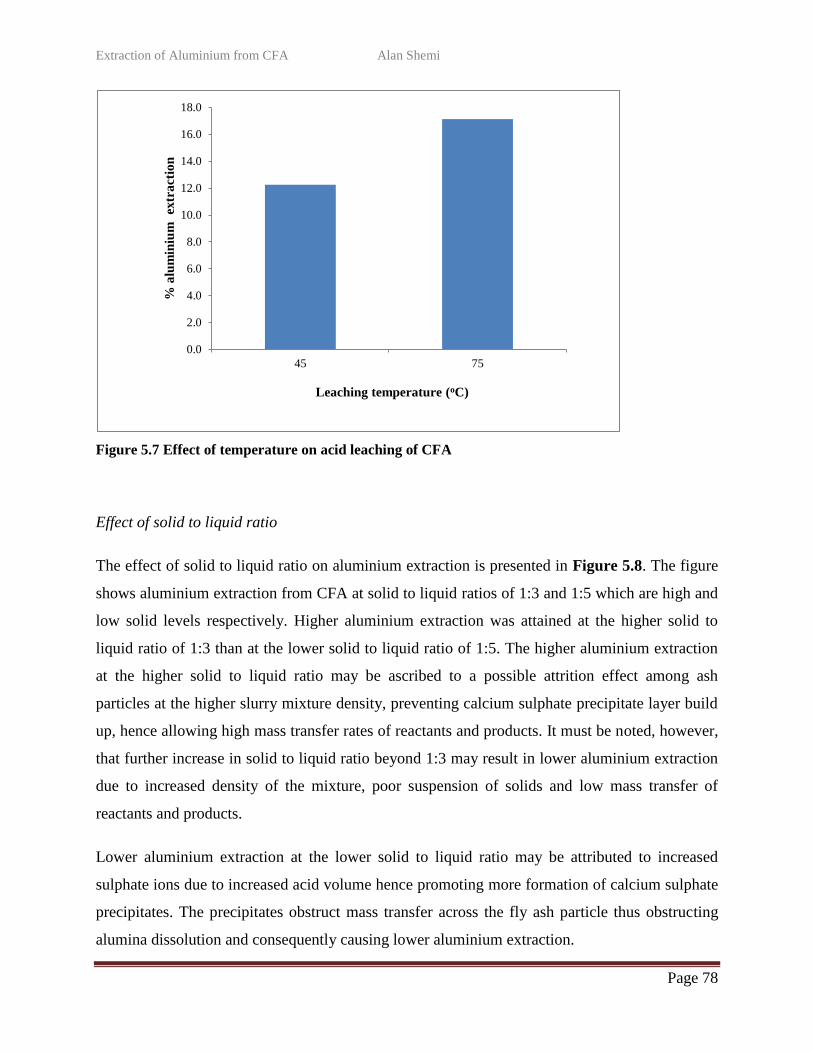
Figure 5.7 Effect of temperature on acid leaching of CFA………………………………….78
Figure 5.8 Effect of solid to liquid ratio on acid leaching of CFA…………………………..79
Figure 6.1 Relationship between experimental and predicted aluminium extraction………..88
Figure 7.1 Aluminium extraction from sintered residue-CFA in post-sinter leaching.............99
LIST OF TABLES
Table 1.1 Mineralogical Analysis of Eskom CFA………………………………………….....3
Table 2.1 Typical chemical compositions of Bauxite and CFA……………………………..13
Table 2.2 Shrinking core models……………………………………………………………..26
Table 2.3 Activation energies for rate controlling mechanisms……………………………...26
Table 3.1 Mineralogical analysis of Eskom CFA……………………………………………30
Table 3.2 Chemical composition of Eskom CFA (wt %)…………………………………….31
Table 3.3 Sulphuric acid leaching conditions for the preliminary leach tests………..………37
Table 3.4 Sulphuric acid leaching conditions for effect of CaSO4 on the dissolution
behaviour of CFA…………………………………………………………………………….38
Table 3.5 Sulphuric acid leaching conditions for the kinetics experiments…………………..38
Table 3.6 Experimental design……………………………………………………………….40
Table 4.1 Elemental composition of CFA by particle size……………………………...........43
Table 4.2 Activation energies for rate controlling mechanisms………………………………61
Table 5.1 Experimental factors and levels for controlled factors……………………….........65
Table 5.2 Aluminium extraction results from experimental runs for the 24 full
factorial design…………………………………………………………………………..........69
Page 12
Extraction of Aluminium from CFA Alan Shemi
Page xii
LIST OF TABLES (CONTINUED)
Table 5.3 Aluminium extraction results for the 24 full factorial design (center point
replicates)……………………………………………………………………………………..73
Table 6.1 Axial points…………………………………………………………………….......82
Table 6.2 Relationship between coded and actual values of the variable…………………….83
Table 6.3 Experimental layout and runs for the two factor central composite
rotatable design……………………………………………………………………………….84
Table 6.4 Observed values for the aluminium extraction…………………………………….85
Table 6.5 ANOVA for the fitted model………………………………………………………86
Table 6.6 ANOVA for the re-fitted model…………………………………………………....87
Table 6.7 Mean Summary Statistics…………………………………………………………..88
Table 6.8 Observed and predicted values for the aluminium extraction……………………...89
Table 6.9 Aluminium extraction at optimum conditions……………………………………..91
Table 7.1 Phase mineralogy of raw-CFA, residue-CFA before and after Sintering…….........95
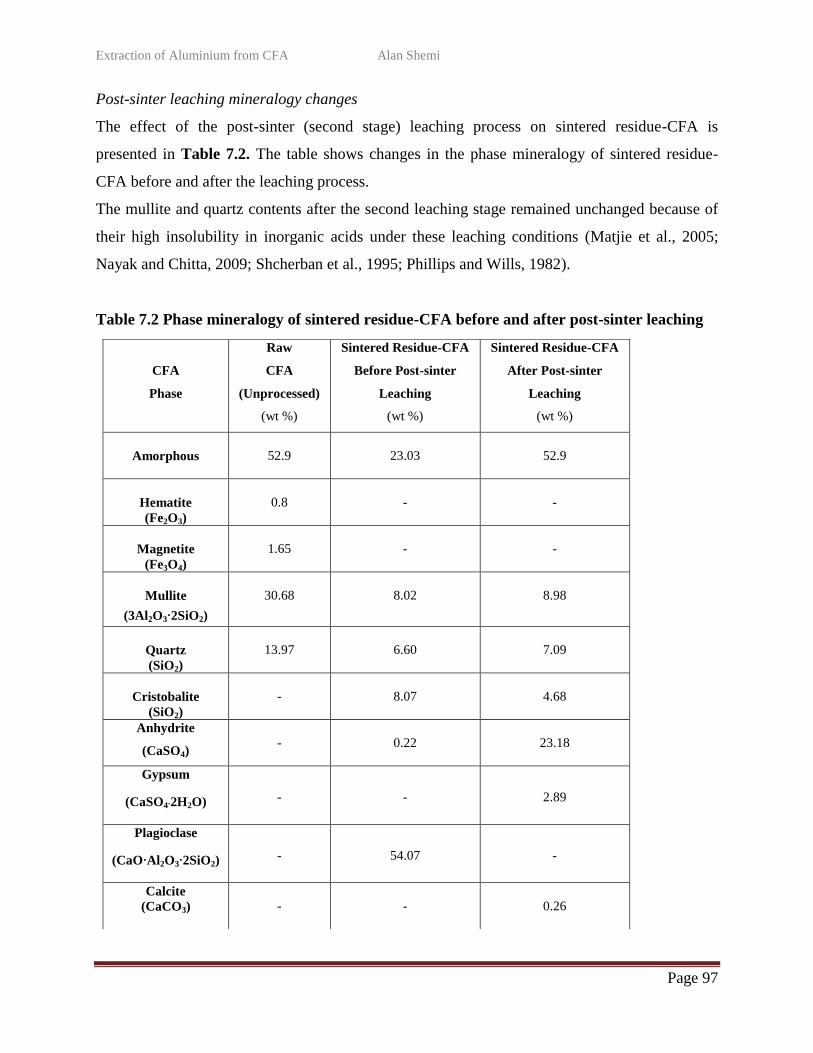
Table 7.2 Phase mineralogy of sintered residue-CFA before and after post-sinter
(second stage) Leaching…………..…………………………………………………………..97
Table 7.3 Aluminium extraction results from clinker-Leaching experiments………………..99
Table 7.4 Overall aluminium extraction from 100g of CFA containing 30.52% Al2O3…….101
Page 13
Page 1
CHAPTER ONE
INTRODUCTION
1.1 Introduction
Coal fly ash (CFA), formed as a result of coal combustion in coal-fired power plants, typically
contains about 26-31% alumina (Al2O3), possibly second only to bauxite in alumina content.
Bauxite, a naturally occurring alumina ore, contains about 30-60% (Authier-Martin et al., 2001)
alumina and is the chief source for aluminium in the world. Although South Africa has no
exploitable high grade bauxite ore deposits, it has readily available aluminium smelters and
feedstock is sourced from countries abroad like Australia. The potential of developing other
alternative sources of alumina such as CFA would provide a significant source of raw material
for the local smelters. This would cut down on alumina import costs and has the potential to
unlock large tonnage of previously unavailable raw material.
Coal-combustion-based electric power is the major source of electricity generation in South
Africa and Eskom is the main power utility and the chief producer of CFA (Maleka et al., 2010).
There are 15 coal-fired power stations in the country that generate about 89.1% of Eskom‟s
electric power capacity. In similar fashion, CFA is produced in millions of tonnes every year,
world-wide, from the burning of pulverized coal to heat boilers, which in turn drive generators to
produce electricity. In 2001(Landman, 2003), it was estimated that 27 million tonnes of CFA
was generated by Eskom alone and the trend is going upwards. Current available CFA stock is
estimated at not less than 500 million tonnes. As long as the main source of electric-power is
coal-combustion-based, South Africa‟s generation of CFA is inevitable and is bound to increase
with increase in demand for electricity.
CFA disposal has increasingly become an environmental concern. Most of the CFA produced
from the power plants is being disposed of in controlled landfills or waste containment facilities.
Only a small portion, about 20%, of CFA collected in South Africa is re-used for productive
purposes and this is primarily for construction-related applications (Landman, 2003). By
contrast, other industrialized countries have had much higher utilization rates in construction and
Page 14
Extraction of Aluminium from CFA Alan Shemi
Page 2
non-construction related applications: Germany, 80%; France, 65%; and the United Kingdom,
55%.
South African CFA contains metals as both major and minor constituents and is capable of
becoming an inexpensive secondary source of metals, thus serving as a national resource and
alleviating the waste-disposal problem. This, coupled with the increasing landfill costs, stricter
implementation and enforcement of environmental legislation, has caused the scientific
community to focus on finding innovative methods of CFA utilization. Processing the ash for
metals recovery would have the following benefits, (1) significantly reduce volume of ash for
disposal thus realizing savings on disposal and landfill costs, (2) lessen the potential for
environmental damage, (3) supplement alumina feedstock, therefore, generating revenue from
aluminium production and (4) stimulate entrepreneurial activity and boost economic growth.
CFA from Eskom power plants typically contains: SiO2 (56.1wt %), Al2O3 (30.52wt %), Fe2O3
(0.4wt %), FeO (3.25wt %), CaO (5.03wt %), TiO2 (1.67wt %). Alumina (Al2O3) is present as
the second major constituent after silica (SiO2) and is therefore amenable to metallurgical and
chemical processes of recovery such as acid or base leaching, precipitation, solvent extraction,
crystallization and calcination. The mineralogy of CFA (Table 1.1) consists of two alumina
phases; the non-crystalline amorphous phase and the crystalline mullite phase (Nayak and Chitta,
2009; Matjie et al., 2005). Mullite is a solid solution compound of alumina and silica with a
chemical formula as 3Al2O3∙2SiO2 (Duval et al., 2008) whereas the amorphous phase is not a
single compound defined by one chemical formula. The amorphous phase in CFA is a mixture of
metal oxides one of which is aluminium oxide (Loubser and Verryn, 2008).
Page 15
Extraction of Aluminium from CFA Alan Shemi
Page 3
Table 1.1 Mineralogical analysis of Eskom CFA
The crystalline mullite phase is acid-insoluble and aluminium in this phase cannot easily be
recovered whilst the non-crystalline amorphous phase is acid-soluble and aluminium can thus
easily be recovered by direct acid leaching (Nayak and Chitta, 2009; Kelmers et al., 1982). Acid
leaching routes for processing CFA or alumina bearing clays are generally preferred mainly
because they allow good solubilization of alumina and have an advantage that silica is
substantially insoluble in acid (Nayak and Chitta, 2009; Shcherban et al., 1995) unlike alkaline
routes. Both alumina phases, crystalline mullite and amorphous, are alkaline-soluble but the high
silica solubility in alkaline solutions is a major problem (Matjie et al., 2005) with high silica
materials like CFA.
Leaching of CFA using an inorganic acid like sulphuric acid is achieved by proton attack. The
hydronium ion displaces the metal cation from the ash particle matrix, thus inducing the
dissolution of metals according to the following reactions:
CaO + Al2O3(s) + 8H+
(aq) + SO42-
(aq) → 2Al3+
(aq) + CaSO4(s) + 4H2O (l) (1.1)
CaO∙Al2O3∙2SiO2(s) + 8H+
(aq) + SO42-
(aq) → 2Al3+
(aq) + CaSO4(s) + 2SiO2(s) + 4H2O(l) (1.2)
CFA
Phase
(wt %)
Al2O3
(wt %)
Amorphous
52.9
27.8
Hematite
0.8
-
Magnetite
1.65
-
Mullite
30.68
72.2
Quartz
13.97
-
Page 16
Extraction of Aluminium from CFA Alan Shemi
Page 4
The non-acid soluble phases of the ash plus calcium sulphate precipitate are retained as residue
and the resultant aluminium sulphate leach liquor is separated for purification and recovery of
alumina.
Leaching processes such as sulphuric acid leaching of CFA can be described in the framework of
heterogeneous non-catalytic reactions in conjunction with the shrinking core model. The model
assumes that the reaction products and/or inert matter that remain in the solid phase form a layer
of ash that encapsulates the unreacted core (Jinping et al., 2007). In their leaching kinetic model,
Seidel and Zimmels (1998) attribute low aluminium extraction to the formation of a calcium
sulphate barrier on the surface and within pores of CFA particles during metal dissolution. They
postulate that the precipitate causes resistance to the mass transfer of reactants and products thus
inhibiting alumina dissolution.
Recent developments on the acid leaching of CFA have focused on sinter-based processes to try
and optimize the extraction of the aluminium in the mullite phase. An example of such a process
is the lime-sinter process where a mixture of CFA, a lime source and carbon are sintered to form
a clinker containing soluble calcium aluminate (Matjie et al., 2005). The clinker is reduced to
coarse powder and the soluble compounds dissolved in a sulphuric acid solution.
The sintering process is based on the concept that the recovery of minerals from CFA requires
methods that will thermally attack and break the crystalline mullite phase (3Al2O3∙2SiO2) to
make leaching effective (Matjie et al., 2005; Murtha and Burnet, 1983). While this is true,
however, it is important to remember that not all the alumina is contained in the mullite phase.
CFA is partly mullite and partly amorphous phase with most of the alumina concentrated in the
mullite phase and the balance in the amorphous phase (Nayak and Chitta, 2009; Kelmers et al.,
1982; Matjie et al., 2005). The mullite phase, being insoluble in inorganic acids such as HNO3,
HCl and H2SO4, requires pre-treatment by sintering methods in order to make leaching more
effective (post-sinter leaching). The amorphous phase, being acid-soluble, however, requires no
pre-treatment before leaching (pre-sinter leaching). Pre-sinter acid leaching is known to extract
aluminium with yields of up to 24 - 30% (Matjie et al., 2005; Seidel and Zimmels, 1998) while
post-sinter leaching has shown that CFA could be leached under atmospheric conditions with
Page 17
Extraction of Aluminium from CFA Alan Shemi
Page 5
aluminium extractions of up to 85% (Matjie et al., 2005). This shows that pre-conditioning of
CFA is vital to the high extraction of aluminium.
It is important to note that there are two alumina phases in CFA that play a major role in alumina
dissolution kinetics, the amorphous and the crystalline mullite phases. Therefore, the total
recovery of alumina from CFA must be attributed to both phases (Nayak and Chitta, 2009).
However, heating both phases as practiced in the current lime-sinter process may not be
necessary as the amorphous phase in CFA is acid-soluble and does not need heat application to
achieve metal dissolution. The two phases may thus be processed separately. This may optimize
extraction as well as increase the efficiency of energy utilization as heating in the lime-sinter
process is energy intensive. A flow diagram of the proposed process for alumina extraction
using a pre-sinter and post-sinter (two-step acid leach) process is presented in Figure 1.1.
This research, therefore, is focused on using the two-step acid leach process namely the pre-
sinter and post-sinter leach method to establish the optimum extraction of aluminium from the
amorphous and crystalline mullite phases of CFA.
Page 18
Extraction of Aluminium from CFA Alan Shemi
Page 6
Figure1.1 A flow diagram of the proposed pre-sinter and post-sinter (two-step acid leach) process
for extracting alumina from CFA.
Lime
Coal
Pelletization
Sintering
Post-sinter Leaching
Filtration Lightweight aggregate Construction industry
H2O
Final Leach liquor
Filtration
Leach residue
Leach liquor②
Leach liquor①
Pre-sinter Leaching
CFA
H2SO4
H2SO4
Page 19
Extraction of Aluminium from CFA Alan Shemi
Page 7
1.2 Problem Statement
Although the acidic and alkaline single-step leaching of CFA and other alumina bearing
materials has been a subject of much study in recent years, information on the separate leaching
of the two CFA alumina phases is non-existent. It is theorized that the two dissimilar alumina
phases present in CFA, amorphous and mullite, when leached separately, using sulphuric acid in
a two-step acid leach process, will lead to optimum aluminium extraction from both phases. This
is the fundamental conceptual theory and value proposition upon which this research is based.
1.3 Objectives
The aim of this study is to develop a pre-sinter and post-sinter two-step acid leach process for the
extraction of aluminium from CFA using sulphuric acid. The two-step acid leach extraction
process makes use of an inorganic acid, a sinter step and two leaching stages.
The specific objectives are:
To investigate the extent of aluminium extraction from CFA using sulphuric acid.
To investigate parameters that promote alumina dissolution in CFA using pre-sinter and post-
sinter leaching processes.
To investigate the physical and chemical properties of CFA during leaching so as to
understand the response of the ash to the beneficiation process.
1.4 Research Methodology
The research methodology for this study involved the following major tasks: Literature review,
experimental design, laboratory testing, and laboratory test data analysis, drawing conclusions
from results, recommendations and documentation.
1.5 Dissertation Lay out
This section provides a snapshot of the chapters and sections that are covered in this dissertation.
This dissertation comprises eight chapters. Each chapter begins with a short introduction that
highlights the areas that will be covered in various sections of the chapter. A summary and
Page 20
Extraction of Aluminium from CFA Alan Shemi
Page 8
conclusion is provided at the end of each chapter to focus the reader on what has been covered
and also guide the reader to subsequent chapters. The schematic representation of the layout is
summarized in the flowchart in Figure 1.2.
Chapter 1 Introduction: This chapter provides the motivation for the research, the problem
statement, and the overall objectives of the study.
Chapter 2 Literature Review: This chapter sets out to review related literature on the extraction
of alumina from CFA. The chapter includes general knowledge on CFA mineralogy and source;
the current metallurgical and chemical extraction processes.
Chapter 3 Experimental Design: This chapter describes the materials and methods used in the
study.
Chapters 4-7: These chapters describe laboratory tests and discussion of the findings.
Chapter 8 Conclusions and Recommendations: This chapter concludes the dissertation with a
summary of the findings and recommendations.
References to all articles used in the study are provided at the end of the dissertation. An
appendix section provides relevant laboratory test results and other important data.
1.6 Summary
In this introductory chapter, the background, problem statement and study objectives were
discussed. This was followed by a short description of the research methodology and dissertation
layout. The next chapter discusses literature review.
Page 21
Extraction of Aluminium from CFA Alan Shemi
Page 9
Figure 1.2 Dissertation layout
Chapter One
INTRODUCTION
Background
Research Problem
Objectives
Research Methodology
Chapter Two
LITERATURE REVIEW
Chapter Three
EXPERIMENTAL DESIGN
Chapter Four
Pre-sinter
Acid Leach
Tests
Chapter Five
Identification
of Significant
Factors
Chapter Six
Optimization
of Significant
Factors
Chapter Seven
Post-sinter
Leaching
Chapter Eight
Conclusions and Recommendations
EXPERIMENTAL
RESULTS
ANALYSIS
Page 22
Extraction of Aluminium from CFA Alan Shemi
Page 10
CHAPTER TWO
LITERATURE REVIEW
2.1 General Introduction
Aluminium is the most abundant metallic element in the earth‟s crust (8.3% by weight) and the
third most abundant of all elements after oxygen and silicon (Earnshaw and Greenwood, 1997).
It occurs in nature in the form of aluminium oxide (Al2O3) and other combined forms such as
bauxite ore. Commercial processing of bauxite through the Bayer process involves conversion of
the hydrated aluminium oxide in the ore to smelter grade alumina. The process includes leaching
the ore with hot sodium hydroxide to form sodium aluminate solution (Na[Al(OH)4]) from which
aluminium trihydrate (Al[OH]3) is precipitated then calcinated to form aluminium oxide (Al2O3).
The alumina (Al2O3) is then smelted via the Hall-Heroult electrolytic process to produce pure
aluminium metal (Habashi, 2005). Aluminium is the most widely used non-ferrous metal in the
world (Aluminium, 2012).
Production of primary aluminium in South Africa thrives on alumina feedstock imported from
countries abroad such as Australia. Although South Africa does not have commercially
exploitable bauxite deposits it has pre-mined CFA reserves and readily available aluminium
smelters. These ashes contain significant amounts of alumina and present an alternative to
bauxite. The four types, or ranks, of coal from which fly ash may be generated include
anthracite, bituminous, sub-bituminous, and lignite (Maleka et al., 2010). These coals differ in
terms of calorific value, chemical composition and ash content because of their different
geological origins.
The aim of this literature review is to give a general overview of CFA mineralogy and its source
including past and present processing methods. The importance of selecting a route for
processing CFA based on its chemical characteristics and subsequent preference towards
sulphuric acid leaching by solubilizing alumina through proton attack (Nayak and Chitta, 2009;
Shcherban et al., 1995) is highlighted.
Page 23
Extraction of Aluminium from CFA Alan Shemi
Page 11
2.1.1 Aluminium
Aluminum (Al) is a silver-white metal with a face-centered cubic crystalline structure; electronic
configuration, 1s22s
22p
63s
23p
l; atomic number, 13; valence, +3; atomic mass, 26.9815g; specific
gravity, 2.6989 at 20°C; melting point, 660°C and boiling point, 2467°C. Aluminium is
amphoteric (having the characteristics of an acid and a base) and can react with mineral acids to
form soluble salts and hydrogen.
Due to its unique physical and chemical properties, aluminium has become the most widely used
metal after iron. Some of its metallurgical properties include high strength-to-weight ratio,
resistance to corrosion, non-toxicity, catalytic properties, good thermal and electrical
conductivity and strength retention under extreme cold without becoming brittle.
Among secondary resources, CFA is a potential alternative source of alumina for the production
of aluminium metal. The main markets for aluminium are non-ferrous and ferrous (less than 1%
iron) alloys which are used in applications such as building and construction, transportation,
consumer durables and electrical applications. Powdered aluminium is also used in paint, and in
pyrotechnics such as rocket fuels and thermite. Furthermore, aluminium is used to form
compounds such as aluminium sulphate used in the manufacture of paper, in water purification
and sewage treatment, in leather tanning and as a mordant in a fire extinguisher (Thompson,
1995; Van and Kent, 1967).
2.2 Coal Fly Ash Source and Mineralogy
CFA is produced from three types of coal-fired boiler furnaces used in the electric utility
industry – dry-bottom boiler furnaces, wet-bottom boiler furnaces and cyclone furnaces. The dry-
bottom boiler furnace is the most common type. The burning of pulverized coal in the
aforementioned furnaces generates two types of ash – bottom ash which collects at the bottom of
the boiler and fly ash which is carried off in flue gas and is collected by electrostatic
precipitators, bag houses or mechanical collection devices such as cyclones. Fly ash represents
about 80% of all the ash that leaves the furnace (Babcock and Wilcox, 2007).
Page 24
Extraction of Aluminium from CFA Alan Shemi
Page 12
CFA formation and its physical and chemical characteristics are controlled by the type of coal,
the boiler and its operating conditions, and post-combustion parameters (Kutchko and Kim,
2006). In a pulverized coal-fired boiler, the furnace combustion zone operating temperatures are
typically in excess of 1400°C. At these temperatures, the mineral matter entrained over years
within the coal, such as kaolinite, may oxidize, decompose, fuse, disintegrate or agglomerate
(Kutchko and Kim, 2006; Shcherban et al., 1995). Evolution of CO2 and H2O gases from trapped
volatile matter can cause the ash particles to expand to form hollow three-layer-structured
cenospheres with an outer layer, middle layer and inner layer (Sakamoto et al., 2003; Landman,
2003).
The cenospheric ash particles owe their spherical structure to vapour and atmospheric pressure,
surface tension and gravitational forces on the molten particle as it is forced up the furnace stack
against gravity (Landman, 2003). The molten particles cool down rapidly in the post-combustion
zone, maintaining their equilibrium shape. The rapid cooling in the post-combustion zone results
in the formation of spherical particles. Some of the vaporized low boiling elements, for example
alkali metal salts coalesce to form submicron particles. Vaporized compounds, most notably the
polynuclear aromatic hydrocarbons and polycyclic aromatic hydrocarbons, adsorb onto the outer
surface layer of the ash particle thus enriching it in carbon, potassium, sodium, calcium and
magnesium (Kutchko and Kim, 2006; Landman, 2003). The middle layer is predominantly rich
in sodium and the inner layer is rich in sodium, silicon and aluminium (Sakamoto et al., 2003).
Kaolinite decomposition in the furnace combustion zone results in the formation of mullite and
polymorphous conversion of quartz into high temperature modification of silica according to the
following reaction (Shcherban et al., 1995):
3[Al2Si2O5 (OH) 4] → 3Al2O3·2SiO2 + 4SiO2 + 6H2O (2.1)
Kaolinite mullite silica
As a result of this reaction, most of the aluminium is concentrated in the crystalline mullite phase
while the rest goes to the amorphous phase (Matjie et al., 2005). CFA is a heterogeneous
substance and its mineralogy is closely related to the minerals entrained in the coal. The main
Page 25
Extraction of Aluminium from CFA Alan Shemi
Page 13
phases found in the ash include amorphous, mullite, quartz, magnetite, haematite and anhydrite
(Loubser and Verryn, 2008). The non-amorphous phases make up the crystalline phase thus
making CFA generally a two-phased material, amorphous and crystalline. The amorphous and
crystalline phases contain approximately 28% and 72% alumina respectively. Recovery of
alumina from these phases is based on the application of metallurgical and chemical processes.
2.3 Currently Existing CFA Processing Methods
The chemical composition of CFA is similar to bauxite ore. A comparison of the typical
chemical composition of bauxite and Eskom CFA is presented in Table 2.1(Authier-Martin et
al., 2001). Worth noting is the silica, ferric oxide and alumina content. CFA has higher silica,
lower ferric oxide and within range alumina content compared to bauxite. Despite the high silica
content, metallurgical means of processing can be applied to extract the significant amounts of
alumina present in South African CFA.
Table 2.1 Typical chemical compositions of Bauxite and CFA (Authier-Martin et al., 2001)
Component
Bauxite
Eskom CFA
wt%
wt%
SiO2
< 0.5 – 10
46 – 60
Al2O3
30 – 60
26 – 31
Fe2O3
1 – 30
4 – 6
TiO2
< 0.5 - 10
1.3 – 1.7
CaO
0.1 - 2.0
3 – 11
P2O5
0.02 - 1.0
0.3 – 1.1
Page 26
Extraction of Aluminium from CFA Alan Shemi
Page 14
Alumina recovery processes by hydrometallurgical means are broadly divided into two types,
acidic and basic. The recovery of alumina from bauxite ore follows a basic route because of the
ore‟s low silica content and high Fe insolubility in alkaline solutions. However, the silica content
in South African CFA is high, typically 46 – 60%. If treated through the basic route, large
volumes of co-dissolved silica would have to be removed from the alkaline solutions at the
expense of aluminium. The difference in silica content is a major factor influencing the choice of
a treatment route; notably, CFA has different processing requirements compared to bauxite. The
high concentration of silica which is the primary gangue element in CFA, therefore, dictates the
treatment process to be followed.
Several leaching methods for CFA processing have been extensively researched using a variety
of routes that are acidic, alkaline or a combination of acidic and alkaline. The most important
ones are discussed in the subsequent sections.
2.3.1 Bioleaching
Bioleaching involves the use of bacterial microorganisms to recover metals from primary ores or
secondary sources. Thiobacilli species is the most common microorganism that is known to
facilitate metal bioleaching reactions. These microorganisms utilize insoluble metal sulphides or
sulphur as an energy source producing sulphuric acid - the main cell metabolite that indirectly
leaches CFA particles. Seidel and co-workers (2001) conducted a study on the process of
bioleaching of CFA by Thiobacillus thiooxidans. They investigated effects of CFA content in
suspension on the growth of Thiobacillus and the subsequent bioleaching of aluminium and iron.
In their work, calcium sulphate deposition in the bioleaching process was noticed to interfere
with cell attachment to sulphur particles thus resulting in suppressed cell growth rates and
adverse effect on cell performance (Seidel et al., 2001). They, however, overcame this hurdle by
removal of the alkaline component (CaO) from CFA with hydrochloric acid prior to bioleaching
(Seidel et al., 2001). Silica, which is usually present in high levels in CFA, was not noticed to
interfere with the bioleaching process in any way. The authors reported an aluminium extraction
close to 25% after 3 weeks of bioleaching time (Seidel et al., 2001). Bioleaching has advantages
of low cost, mild process conditions and low energy demand or landfill space. However, slow
Page 27
Extraction of Aluminium from CFA Alan Shemi
Page 15
kinetics and insufficient selectivity with respect to specific metals, particularly aluminium, offset
the advantages of the CFA bioleaching process (Seidel et al., 2001).
2.3.2 Alkaline Leaching
In basic leaching, solutions of NaOH or alkaline salts such as Na2CO3 are used, often under
pressure to permit the use of elevated temperatures (Murtha and Burnet, 1983). The traditional
Bayer process for the recovery of alumina from Bauxite involves the dissolution of alumina in
sodium hydroxide. The process includes leaching the ore with hot sodium hydroxide to form
sodium aluminate solution (Na[Al(OH)4]) from which aluminium trihydrate (Al[OH]3) is
precipitated then calcinated to form aluminium oxide (Habashi, 2005). It is noted that although
pressure leaching of CFA with alkaline solutions is quite selective for aluminium as Fe is almost
insoluble in alkaline solutions, the simultaneous dissolution of SiO2 is of concern and can only
be removed at the expense of extracted aluminium (Shcherban et al., 1995; Burnet et al., 1984;
Jackson, 1986). Removal of silicon species from aluminate solution prior to precipitation of
Al(OH)3 can become a major problem (Matjie et al., 2005) due to the formation of insoluble
sodium aluminate silicates.
2.3.3 Acid Leaching of CFA
Introduction
For the extraction of aluminium from high silica non-bauxitic resources such as CFA, acid
leaching processes are generally preferred because acid routes have the advantage that silica is
substantially insoluble in acid (Nayak and Chitta, 2009; Shcherban et al., 1995) unlike alkaline
routes. Processing of CFA using the acid route may be done directly or indirectly. Direct acid
leaching requires no intervention before the leaching process. However, indirect acid leaching
requires some material pre-conditioning prior to leaching. The pre-conditioning helps to achieve
a modification of some chemical characteristics of the CFA alumina species in order to make it
more responsive to the leaching process.
Page 28
Extraction of Aluminium from CFA Alan Shemi
Page 16
Lixiviants Used in Acid Leaching
A lixiviant is a liquid medium used to selectively extract the desired metal from the ore or
mineral. It assists in rapid and complete leaching. The lixiviants which are important in the
hydrometallurgical processes are either acidic or basic in nature. A brief review of the three
commonly used acidic lixiviants is given here as knowledge of their characteristics is necessary
for the selection of suitable conditions for acid leaching processes.
Hydrochloric Acid Hydrochloric acid, also known as muriatic acid, and spirit of salt, is a
clear, colourless aqueous solution of hydrogen chloride gas. It is a highly corrosive, strong
monoprotic mineral acid with many industrial uses (Lide, 2007). The boiling point of
hydrochloric acid decreases with increasing molarity; at 2.9M, the boiling point is 103°C whilst
at 12.4M, the boiling point is 48°C (Perry et al., 1984). Hydrochloric acid (20.2%) as a binary
mixture of hydrochloric acid and H2O has a constant-boiling azeotrope at 108.6°C (Lide, 2007;
Perry et al., 1984); it forms corrosive acid mists at higher concentrations. Concentrated
hydrochloric acid dissolves many metals, and forms oxidized metal chlorides and hydrogen gas,
and it reacts with basic compounds such as calcium carbonate or calcium sulphate to form
soluble chlorides. Hydrochloric acid is consumed in many mining operations for ore treatment,
metal extraction, separation, purification, and water treatment (Earnshaw and Greenwood, 1997).
The average cost of hydrochloric acid (36%) is $3,849/tonne (SD Fine-Chemicals, 2012).
Nitric Acid Nitric acid, also known as aqua fortis, and spirit of niter, is a highly corrosive,
monoprotic, toxic and strong mineral acid with strong oxidizing characteristics (Housecroft,
2008). The acid is normally colourless, but tends to acquire a yellow cast due to the
accumulation of oxides of nitrogen if long-stored. Nitric acid (68%) as a binary mixture of nitric
acid and H2O has a constant-boiling azeotrope at 121°C (Dean, 1992). Ordinary nitric acid has a
concentration of 68% and when the concentration contains more than 86% nitric acid, it forms
nitric acid fumes. Nitric acid is subject to thermal or light decomposition to form nitrous gas
according to the following reaction (Housecroft, 2008):
4HNO3 → 2H2O + 4NO2 + O2 (2.2)
Page 29
Extraction of Aluminium from CFA Alan Shemi
Page 17
The main important uses of nitric acid include the production of explosives, etching and
dissolution of metals, especially as a component of aqua regia for the purification and extraction
of gold, and in chemical synthesis (Thiemann, 2005). The average cost of nitric acid (60%) is
$4,669/tonne (SD Fine-Chemicals, 2012).
Sulphuric Acid Sulphuric acid, also known as oil of vitriol, is a highly corrosive, diprotic
and strong mineral acid; boiling point, 337°C. It is a colourless to slightly yellow viscous liquid
which is soluble in water at all concentrations (Lide, 2007). The 98% grade is more stable in
storage, and is the usual form of what is described as concentrated sulphuric acid. It has strong
dehydrating and oxidizing properties at high concentrations (Housecroft, 2008). Sulphuric acid
possesses different chemical properties and therefore has a wide range of applications some of
which include metal extraction, chemical synthesis and production of copper sulphate solution
used as electrolyte in copper electro-refining and electro-winning processes (Earnshaw and
Greenwood, 1997). The average cost of sulphuric acid (98%) is $2,239/tonne (SD Fine-
Chemicals, 2012).
Sulphuric acid was used in the acid leaching of CFA, because the acid is stable, easier to handle,
cheap and allows good solubilization of alumina.
Direct Acid Leaching of CFA
Direct acid leaching methods are amongst the earliest attempts at extracting alumina from
alumina bearing clays. These particular methods have, however, yielded low extraction rates,
typically less than 50% (Nayak and Chitta, 2009; Nehari et al., 1999). Alumina extraction by
direct acid leaching with sulphuric acid has been extensively researched by several workers
(Matjie et al., 2005; Nayak and Chitta, 2009; Nehari et al., 1999; Jinping et al., 2007; Seidel et
al., 1998; Gilliam et al., 1982; Phillips and Wills, 1982). The results reported show that direct
leaching of CFA with sulphuric acid solution at low acid concentration and ambient temperature
yielded poor alumina extraction.
Page 30
Extraction of Aluminium from CFA Alan Shemi
Page 18
Direct leaching work done by Seidel and Zimmels (1998) using sulphuric acid yielded an
aluminium extraction of 30%. In their investigations, the researchers leached a 1% CFA
suspension at a fixed pH of 0.8, for a period of 100 days under ambient temperature and
atmospheric pressure conditions. They attributed the low alumina extraction to the formation of
calcium sulphate. They postulated that the sulphate precipitate forms a barrier on the surface and
within pores of CFA particles during metal dissolution causing resistance to mass transfer. In
their attempt to overcome this problem, they pre-leached CFA with hydrochloric acid at a
constant pH of 4 for 24hours after which it was leached with 0.5M sulphuric acid (or fixed pH of
1.5) at room temperature and atmospheric pressure for 4 days. They found that approximately
28% of the aluminium could be leached from a 10% suspension of conditioned CFA, while
during the same period of time it was possible to leach only 20% from the unconditioned CFA
sample. Their results showed that despite dissolving about 65% of the calcium from CFA, there
was no significant improvement in alumina dissolution due to the pre-leaching process.
Therefore, they concluded that conditioning the CFA by a pre-leaching process with
hydrochloric acid only enhanced the leaching rates and shortened extraction time but the
maximum aluminium extraction level remained unchanged.
Leaching at higher acid concentrations has, however, shown better results. Work done by Nayak
and Chitta (2009) showed that alumina extractions of 2.66% to 84.17% could be achieved. The
conditions employed involved placing the CFA mixture in a one-liter flask, constant stirring and
boiling within the temperature range of 150 – 200°C at sulphuric acid concentrations ranging
from 1.5M to 18M, solid to liquid ratios of 1:1 to 1:4 and a leaching time of 4 hrs. However,
under these conditions, they had to contend with the evolution of acid fumes at higher levels of
acid concentration due to acid boiling. They also had to constantly add water to avoid
solidification of the mixture as well as maintain the desired solid to liquid ratio. Despite these
efforts, the mixture finally became slurry and solidified due to the high evaporative loss of water.
The solidified CFA mixture had to be extracted with hot distilled water and filtered using a
suction pump.
Other direct acid leaching work conducted under relatively moderate conditions, showed low
aluminium extraction efficiencies. Work done by Matjie and co-workers (2005) using a 6.12M
Page 31
Extraction of Aluminium from CFA Alan Shemi
Page 19
sulphuric acid solution at a solid to liquid ratio of 1:4 yielded alumina extraction efficiencies in
the range of 12 – 24% even after 6 hours of leaching under reflux. However, their results were
found to be in agreement with earlier work done by other researchers like Hansen and co-
workers (1966). The authors reported that 80% of the alumina originally present in Sasol CFA is
constituted in the mullite phase with the balance located in the amorphous glassy phase. They
concluded that 20% alumina extraction efficiency by direct acid leaching is the achievable limit
thus indicating that phase mineralogy has an effect on the leaching characteristics of CFA.
Indirect Acid Leaching of CFA
Although several processes have been proposed for the treatment of CFA by basic and acidic
routes, none of the processes have found commercial industrial application because of high
capital and operational costs, environmental concerns and technological outlay. However, acidic
routes such as sulphuric acid leaching are generally accepted as easier to handle, cheaper, and of
minimum environmental impact. The possibility to use indirect sulphuric acid leaching has long
been investigated by several workers (McDowell and Seeley, 1981a; McDowell and Seeley,
1981b; Padilla and Sohn, 1985; Murtha and Burnet, 1983; Matjie et al., 2005) and has been
found to have the potential of producing leachable phases from CFA. Indirect acid leaching
processes are based on intervention measures such as sintering prior to leaching.
In their work, McDowell and Seeley (1981a) describe a method which comprises sintering a
mixture of CFA and calcium sulphate prior to leaching. The mixture is sintered for a period of
time sufficient to quantitatively convert the alumina into an acid-leachable form. They sintered a
sample of CFA with 2 parts of CaSO4 at 1450°C then leached the sintered product with
concentrated sulphuric acid at a solid to liquid ratio of 1: 2.5 for 3 hours. The slurry was further
diluted to a solid to liquid ratio of 1: 5 then leached with a 2M sulphuric acid for an extra 3 hours
from which they achieved an aluminium extraction efficiency of 98%. However, while chemical
leachability of the desired aluminium and other metal values was high even at temperatures
greater than 1300°C, they reported that the sintered material was difficult to grind.
In a separate study, McDowell and Seeley (1981b) illustrate a method for recovering aluminium
values from CFA which consists of sintering the CFA with a mixture of NaCl and Na2CO3 for a
Page 32
Extraction of Aluminium from CFA Alan Shemi
Page 20
period of time sufficient to convert the aluminium content of the CFA into an acid-soluble phase.
They mixed three parts of a sinter medium consisting of 2 parts by weight NaCl, 1 part Na2CO3
and 1 part CFA. They heated the mixture under atmospheric conditions to a temperature of
400°C for 1 hour then raised and maintained the temperature at 900°C for 2 hours. The sintered
product was cooled, ground to powder and then washed with hot water to separate the aluminium
from the unreacted NaCl and Na2CO3 components followed by acid leaching with 1M nitric acid
at a leaching temperature in the range of 85°C - 100°C. They found that greater than 90% and up
to 99% of the aluminium could be recovered using their salt-soda-sinter method. However, in
spite of the high extraction efficiencies, the high reagent consumption at a rate of 3 parts reagents
(NaCl and Na2CO3) to 1 part CFA seems to outweigh the advantages of high alumina extraction.
The work by Phillips and Wills (1982) showed that alumina recoveries of 60-80% could be
achieved on pre-calcined micaceous china clay (25-35% alumina) leached with nitric acid at
atmospheric boiling point and pressure. Although the researchers did not specify or reveal any
additives used in the pre-calcining process, they calcined the clay at an optimum temperature of
800°C. The sintered product was then leached with 7M nitric acid, in a 1 litre round bottomed
flask fitted with a reflux condenser, a thermometer and a mechanical stirrer rotated at 250 rpm.
The authors found that calcining beyond 800°C resulted in reduced aluminium extraction
possibly due to either some structural collapse or solid state transition to silicon spinel, a mineral
form which was more resistant to leaching with nitric acid.
In a lime-sulphur-carbon-sinter study, Murtha (1983) shows a method in which an addition of a
small amount of sulphur and carbon to the lime-CFA sinter mixture was found to lower sintering
temperatures resulting in an alumina extraction of almost 90%. The author added about 1-2 wt%
sulphur and 1-2 wt% carbon to a mixture of about 1 part CFA and 2 parts CaCO3. The sinter was
then heated to about 1200°C to 1380°C for 1 hour to react the sulphur with calcium and alumina
forming a clinker containing a calcium sulpho-aluminate compound. The sinter product was
reduced to a coarse powder and then leached with a 3 wt% aqueous NaCO3 solution at a solid to
liquid ratio of 1:10, at 65°C for 10 minutes, thereby extracting alumina from CFA. However,
despite the fast leaching kinetics of the process at a relatively low temperature, the high reagent
consumption of sulphur, Na2CO3 and CaCO3 could outweigh these advantages.
Page 33
Extraction of Aluminium from CFA Alan Shemi
Page 21
2.4 Sintering Process
According to Murtha (1983), there are mainly three types of sintering methods, used for alumina
recovery, with several variations some of which include: lime-sinter, lime-soda sinter, lime-
CaSO4-sinter, lime-sulphur-carbon-sinter and salt-soda-sinter. Sinter processes involve high
temperature chemical methods of attacking the refractory glass matrix of the ash particles. The
conventional practice is to subject raw CFA, as a sinter feed, to high sintering temperatures,
usually in excess of 1000oC for a pre-determined period of time typically 30 - 180 minutes. The
full procedure involves pelletization, sintering and post-sinter leaching.
2.4.1 Pelletization
In the lime-sinter process (Kelmers et al., 1982; Matjie et al., 2005), CFA is mixed with a carbon
source such as coal and a lime source such as limestone or gypsum in the ratio of 5:4:1 then
made into pellets of 4.5-5.5 mm size. Pelletizing is the process of compressing or molding a
material into the shape of a pellet or ball. CFA is preferred in the form of pellets because the
configuration of CFA pellets as packed spheres in the muffle furnace allows air to flow between
the pellets. The spaces between the pellets decrease the resistance to the air that flows through
the layers of material during the sintering process.
2.4.2 Sintering
The pellets are sintered at typical temperatures of 1000 - 1150 o
C for 30 – 180 minutes (Murtha
and Burnet, 1983). The main objective of the sintering step is to provide strong materials with a
high crushing strength and also to transform the crystalline mullite phase rendering Al2O3 free
for leaching. Sintering relies on solid-phase or liquid-phase reactions at points of localized
melting between particles to break bonds and form new compounds without complete melting of
the reactants (Murtha and Burnet, 1983).
In the chemical reaction assumed to take place first, the sinter reagent (limestone) decomposes
according to the following reaction:
CaCO3 → CaO + CO2 (2.3)
Page 34
Extraction of Aluminium from CFA Alan Shemi
Page 22
This is followed by the reaction of CaO with mullite and other alumina-containing species in the
CFA to form anorthite and/ or gehlenite, as well as some combination with free silica to form
calcium silicate (Shcherban et al., 1995). The following are some of the possible reactions that
can occur:
3Al2O3∙2SiO2 + 3CaO + 4SiO2 → 3(CaO∙Al2O3∙2SiO2) (2.4)
(Mullite) (Anorthite)
3Al2O3∙2SiO2 + 6CaO + SiO2 → 3(2CaO∙Al2O3∙SiO2) (2.5)
(Mullite) (Gehlenite)
SiO2 + 2CaO → Ca2SiO4 (2.6)
3Al2O3∙2SiO2 + 5CaO → Ca2Si2O6 + 3(CaO∙Al2O3) (2.7)
2.4.3 Post-sinter Leaching
The products formed in the sintering process are subsequently dissociated in a post-sinter acid
leach step. Leaching conditions required in the post-sinter leaching step range from 3.06M to
6.12M H2SO4, 4 to 12 hours leaching time, 60 to 90°C leaching temperature and 1:3.5 to 1:5
solid to liquid ratio (Matjie et al., 2005). The following are possible reactions that take place:
CaO∙Al2O3∙2SiO2 + 4H2SO4 → Al2 (SO4)3 + CaSO4 + 2SiO2 + 4H2O (2.8)
2CaO∙Al2O3∙SiO2 + 5H2SO4 → Al2 (SO4)3 + 2CaSO4 + SiO2 + 5H2O (2.9)
CaO∙Al2O3 + 4H2SO4 → Al2 (SO4)3 + CaSO4 + 4H2O (2.10)
The dissolved metals such as Al, Fe, and Ti are then separated by solvent extraction or ion
exchange. The lime-sinter process is known to extract alumina with recoveries of about 85%
(Matjie et al., 2005). A solid product is then obtained by precipitation or crystallization often
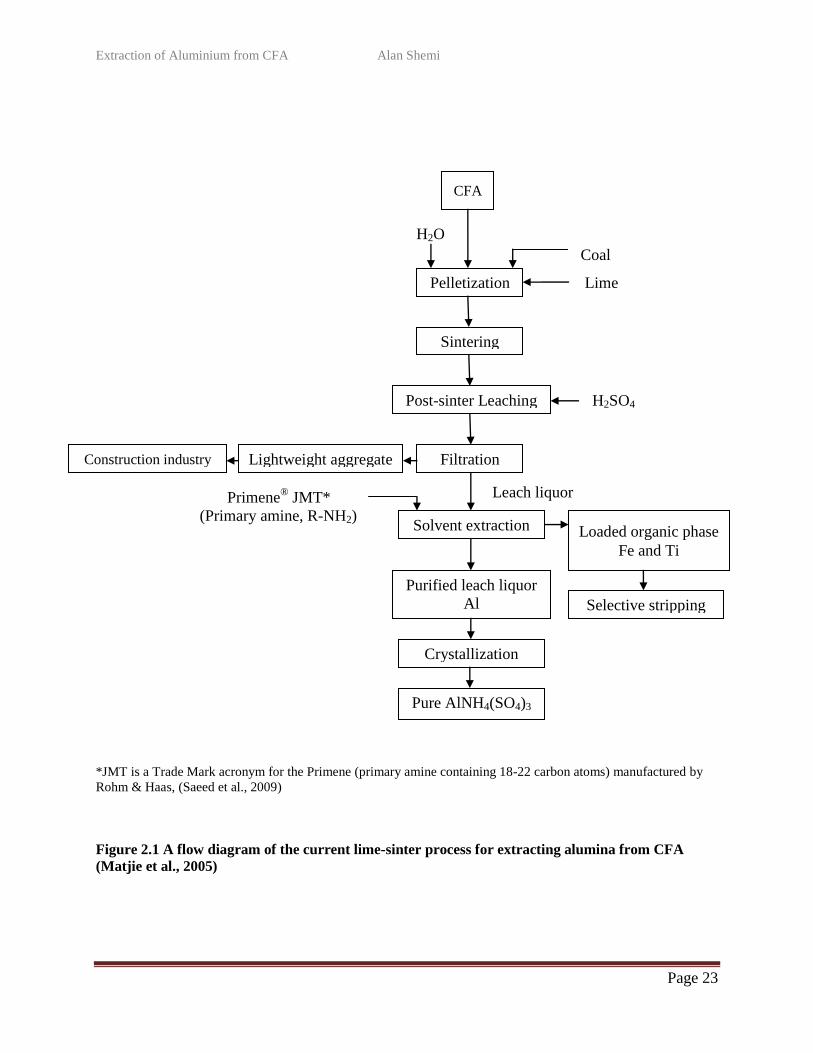
followed by calcination to yield metal oxides such as alumina (Al2O3). A flow diagram of the
current lime-sinter process for alumina extraction is presented in Figure 2.1.
Page 35
Extraction of Aluminium from CFA Alan Shemi
Page 23
*JMT is a Trade Mark acronym for the Primene (primary amine containing 18-22 carbon atoms) manufactured by
Rohm & Haas, (Saeed et al., 2009)
Figure 2.1 A flow diagram of the current lime-sinter process for extracting alumina from CFA
(Matjie et al., 2005)
Lime
Coal
CFA
Pelletization
Sintering
Post-sinter Leaching H2SO4
Filtration Lightweight aggregate Construction industry
Loaded organic phase
Fe and Ti
Purified leach liquor
Al
Selective stripping
Crystallization
Pure AlNH4(SO4)3
Solvent extraction
H2O
Primene® JMT*
(Primary amine, R-NH2)
Leach liquor
Page 36
Extraction of Aluminium from CFA Alan Shemi
Page 24
CFA pre-conditioning and post-sinter leaching conditions are important factors that affect the
extraction efficiency and leachability of alumina. However, none of the foregoing works on
alumina recovery deal with „pre-sinter and post-sinter leaching‟ where the sintering and leaching
response is expected to demonstrate different characteristics.
Noting that there are two alumina phases which have an effect on the leaching characteristics of
CFA (Matjie et al., 2005; Nayak and Chitta, 2009) it is postulated that the two dissimilar alumina
phases, amorphous and mullite, when leached separately, using sulphuric acid in a pre-sinter and
post-sinter (two-step acid leach) process, will lead to optimum aluminium extraction from both
phases. The acid-soluble amorphous phase can be leached out first, in a pre-sinter leaching step,
followed by the sintering and post-sinter leaching of the mullite phase thus optimizing
aluminium extraction.
In the pre-sinter and post-sinter (two-step acid leach) process, pre-sinter leaching has the
potential to reduce fly ash residue weight resulting in reduced sinter feed thus saving on energy.
Pre-sinter leaching can alter CFA morphology by exposing the mullite phase after the
elimination of the amorphous phase thus increasing the mullite surface area available for contact
and reaction in the subsequent sinter process. Furthermore, pre-sinter acid leaching reactions
produce CaSO4 as a by-product. The CaSO4 formed in these reactions can be utilized as part of
the pellet mixture. When used as an addition to limestone, CaSO4 is known to lower sintering
temperatures and also form a highly soluble calcium alumino sulphate phase, 4CaO∙3Al2O3∙SO4,
which improves alumina extraction (Murtha and Burnet, 1983). A flow diagram of the proposed
process for alumina extraction using a pre-sinter and post-sinter (two-step acid leach) process is
presented in section 1.1, Figure 1.1.
2.5 The Kinetics of Leaching Processes
Leaching is a unit operation where separation is achieved by preferential dissolution of a solute
in a solid base using a solvent (McCabe et al., 1993; Richardson et al., 2002). The leaching
reaction involves the extraction of specific metals from their ore or metal bearing material by
dissolving them in aqueous media. In other words, metals bound in minerals are transformed into
metal ions that are released into aqueous media thus making them mobile. The leaching reaction
Page 37
Extraction of Aluminium from CFA Alan Shemi
Page 25
takes place at the interface between a solid and liquid phase, and sometimes gaseous phase
(Gupta, 2003). Fluid-solid reactions are encountered in a variety of chemical processes (Wen,
1968). One such example is the extraction of metals from ores using acids (Levenspiel, 1972).
Mathematical modeling of fluid-solid systems is usually used to interpret experimental results
and to gain insight into these reaction mechanisms. The shrinking core model has been widely
used in the area of hydrometallurgy to model leaching systems (Gbor and Jia, 2004) like
sulphuric acid leaching of CFA. Leaching processes such as acid leaching of CFA can be
described in the framework of heterogeneous non-catalytic reactions in conjunction with the
shrinking core model where the initial radius of the leached particles gradually decreases leaving
a reacted layer around the unreacted core (Seidel and Zimmels, 1998; Wen, 1968).
The shrinking core model is based on the assumptions of pseudo-steady state diffusion and that
the solid particle is spherical and reacts with the fluid isothermally (Gbor and Jia, 2004). Based
on these assumptions the surface reaction of solid-fluid systems can be considered to consist of
the following steps (Wen, 1968): (1) diffusion of the fluid reactants across the fluid film
surrounding the solid, (2) diffusion of the fluid reactants through the porous solid layer (3)
adsorption of the fluid reactants at the solid reactant surface, (4) chemical reaction with the solid
surface, (5) desorption of the fluid products from the solid reaction surface, and (6) diffusion of
the product away from the reaction surface through the porous solid media and through the fluid
film surrounding the solid. Depending on which step is rate-controlling, three different types of
reaction mechanisms may be obtained; diffusion control, product layer control and chemical
reaction control. Since these steps take place consecutively, if any of the above steps is much
slower than all the others, that step becomes the rate-determining-step (Wen, 1968). Therefore,
identification of this step and the parameters that can influence it is very important. Equations
governing these rate controlling regimes to express the reaction rates in terms of particle
conversion or fractions reacted (Levenspiel, 1972) are presented in Table 2.2.
Page 38
Extraction of Aluminium from CFA Alan Shemi
Page 26
Table 2.2 Shrinking core models (Levenspiel, 1972)
Regime
Equation
Film diffusion control
Chemical reaction control
Ash diffusion control
x = fractional conversion; t = time (hours); k = rate constant (hr-1
)
Activation energies of the leaching process
Reaction kinetics and rate controlling mechanisms for leaching processes may also be described
in the framework of heterogeneous non-catalytic solid-liquid reactions in conjunction with
activation energies. The magnitude of the activation energy can provide positive evidence for the
rate controlling regimes (Habashi, 1968; Potgieter et al., 2006). Activation energies governing
these rate controlling mechanisms are shown in Table 2.3.
Table 2.3 Activation energies for rate controlling mechanisms (Habashi, 1968;
Potgieter et al., 2006)
Regime
Activation Energy
Product (Ash) diffusion control
< 20 kJmol
-1
Film diffusion control
20 - 50 kJmol
-1
Chemical reaction control
> 50 kJmol
-1
Page 39
Extraction of Aluminium from CFA Alan Shemi
Page 27
The method for calculating activation energies is the Arrhenius equation based reaction rate
constant, k.
The Arrhenius Equation 2.11 gives a quantitative relation between the rate constant (k) and
temperature (T):
(2.11)
Where, A is the frequency factor or pre-exponential constant, Ea is the activation energy, T is the
absolute temperature in Kelvin and R is the gas constant.
Taking natural logarithms on both sides, Equation 2.11 becomes:
(2.12)
For a reaction at two known temperatures and/or rate constants, Equation 2.12 takes the forms,
(2.13)
And
(2.14)
Subtracting Equation 2.13 from Equation 2.14, the final equation (Chang, 2005; Segal, 1975;
Laidler, 1984; Logan, 1982) is presented as:
(2.15)
The activation energy (Ea) can, therefore, be calculated using Equation 2.15. Alternatively,
using Equation 2.12, the activation energy (Ea) can be computed from the slope of the
Arrhenius plot of lnk versus T-1
.
Page 40
Extraction of Aluminium from CFA Alan Shemi
Page 28
It is clear, from Equation 2.12, that as the value of activation energy Ea decreases, the value of k
increases and, therefore the reaction rate increases. This shows that low activation energies are
indicative of fast reaction rates and vice versa.
2.6 Summary
Aluminium occurs in nature in the form of bauxite which is commercially used to extract
aluminium metal using the Bayer process (Habashi, 2005). It was highlighted in this review that
although South Africa does not have commercially exploitable bauxite deposits, it has pre-mined
CFA reserves and readily available aluminium smelters.
CFA contains significant amounts of alumina but, it cannot be treated using the Bayer process
route because it contains high amounts of silica, typically 46-60%. However, in the acidic route,
silica is substantially insoluble and alumina can be extracted by pre-conditioning the CFA in
order to form leachable alumina phases which are easily solubilized by sulphuric acid. This
requires pre-sinter leaching of the CFA to leach out the easily leachable alumina from the
amorphous phase first. The pre-sinter leaching step has advantages of exposing the acid-
insoluble mullite phase for effective sintering and phase transformation prior to post-sinter
leaching.
It was demonstrated that CFA contains two dissimilar alumina phases, amorphous and mullite,
one of which does not need heat application to achieve metal dissolution. Therefore, in this
review, the potential of using the pre-sinter and post-sinter (two-step acid leach) method was
investigated and postulated to be a possible alumina recovery process. The next chapter discusses
materials and analytical methods used in the study.
Page 41
Extraction of Aluminium from CFA Alan Shemi
Page 29
CHAPTER THREE
MATERIALS AND METHODS
3.1 Introduction
This chapter discusses the preparation of materials as well as the experimental and analytical
methods used in the study.
3.2 Experimental
3.2.1 Coal Fly Ash
The CFA material used throughout this study was provided by Kendal Power Plant, a division of
Eskom, South Africa. The CFA material was obtained in fine particle form and did not need
further grinding. Representative samples used in all experiments were prepared using a riffler
splitter (Model: 15A, Eriez Magnetics, South Africa).
The CFA was characterized by investigating the surface morphology, phase mineralogy, particle
size and chemical analysis. The typical CFA morphology, mineralogical phases, particle size
distribution (PSD) and chemical composition are presented in Figure 3.1, Table 3.1, Figure 3.2
and Table 3.2, respectively. The particle size analysis was done by physically screening the
samples using test sieves (Fritsch, Germany) of various screen sizes within the range of -38µm
and +212µm. The CFA surface morphology analysis was carried out using a Scanning Electron
Microscope (Model: Quanta-400F, FEI, USA). The CFA phase mineralogy analysis and the
quantification of calcium sulphate (CaSO4) in residue-CFA were carried out using an X-ray
diffractometer (Model: X‟Pert, PANalytical, Netherlands) operated with Co-Kα radiation
generated at 40kV and 50mA. The chemical composition analysis was carried out using
Wavelength Dispersive X-ray fluorescence (XRD) spectrometer (Model: Axios, PANalytical,
Netherlands) operated with a Rhodium tube excitation source. Filtrates were analyzed for
aluminium using Inductively Coupled Plasma-Optical Emission Spectrometry (ICP-OES)
analyzer (Model: SPECTRO GENESIS, Spectro Analytical Instruments, Germany).
Page 42
Extraction of Aluminium from CFA Alan Shemi
Page 30
Figure 3.1 Surface morphology of Eskom CFA
Table 3.1 Mineralogical analysis of Eskom CFA
CFA
Phase
(wt %)
Al2O3
(wt %)
Amorphous
52.9
27.8
Hematite
0.8
-
Magnetite
1.65
-
Mullite
30.68
72.2
Quartz
13.97
-
Page 43
Extraction of Aluminium from CFA Alan Shemi
Page 31
Figure 3.2 Particle size distribution (PSD) of Eskom CFA
Table 3.2 Chemical composition of Eskom CFA (wt %)
3.2.2 Reagents
All reagents used in this study were of analytical grade (AR). Analytical grade reagents are
chemical substances of sufficient purity fit for laboratory and general use according to
International standards (ASTM®, 2012; Grades of chemicals, 2008). The reagents used in this
study were all purchased from Merck and Sigma Aldrich and were used as received. Distilled
water, analytical grade sulphuric acid (98% w/w) and calcium carbonate were used in the
experiments.
According to ELGA®
LabWater (2009), distilled water is produced by a process that separates
water from contaminants by changing the state of water from a liquid phase to a gas phase and
0
20
40
60
80
100
120
38 45 53 75 106 150 212 220
Cu
mu
lati
ve
wt%
pa
ssin
g
Particle size (µm)
SiO2
Al2O3
Fe2O3
FeO
MnO
MgO
CaO
Na2O
K2O
TiO2
P2O5
Cr2O3
NiO
L.O.I
56.1
30.52
0.4
3.25
0.03
1.43
5.03
0.24
0.71
1.67
0.6
0.03
0.01
1.43
Page 44
Extraction of Aluminium from CFA Alan Shemi
Page 32
then back to a liquid phase. Each of these transitions provides an opportunity to separate water
from contaminants thus producing very pure water. Deionized water is produced by a chemical
process that uses ion-exchange resins which exchange hydrogen ions and hydroxide ions for
dissolved minerals which then recombine to form water. Because the majority of water
impurities are dissolved salts, deionization produces high purity water that is similar to distilled
water. However, deionization does not significantly remove uncharged organic molecules,
viruses or bacteria.
In this study, distilled water was found more suitable for laboratory use than deionized water.
3.2.3 Coal
Coal used in this study was obtained from Matla Collieries, South Africa. It was crushed and
finely ground to 100% passing 212 µm (similar grind as CFA). The Thermo-gravimetric analysis
(TGA) and chemical composition of the coal as obtained from the supplier stated that the
moisture content is 4.32%, volatiles are 20.25%, the fixed carbon is 68.20%, the ash content is
7.23% and the Al content is 1.05%.
3.2.4 Design of Experiments
The main focus of this study was the identification and optimization of factors that significantly
influence the aluminium extraction process. After identifying and optimizing these factors, they
were used in all the leaching experiments. Therefore, a statistical Design of Experiments (DOE)
method was employed as a research tool to accomplish the main objective of the study. The
advantage of using DOE is that it provides for a simultaneous study of several process
parameters which provide useful information (Czitrom, 1999; Barrentine, 1999). By using DOE,
the estimates of the effects of each factor are more precise and the interaction between factors
can be estimated systematically. Therefore, by using DOE there is experimental information in a
large factor space which improves prediction of the response.
Screening of factors (Chapter 5) was done at the beginning so as to explore the possible
influence of factors on the response (aluminium extraction) and to identify their appropriate
Page 45
Extraction of Aluminium from CFA Alan Shemi
Page 33
upper and lower limits. A full 24 factorial design was used in determining the influential factors.
A statistical analysis of the experimental results was employed to evaluate the significance of the
factors using the normal probability plot and Pareto analysis.
Normal probability plot of effects
The normal probability plot is a statistical method that is used to evaluate the significance of
factors. In the assessment of effects from unreplicated factorials, occassionally real and
meaningful higher-order interactions occur and therefore it is necessary to allow for selection
(Box et al., 1978). However, cited by Simate and Ndlovu (2008), Daniel (1959)‟s method by
which effects are plotted on a normal probability plot often provides an effective way of helping
with selection. This is the plot of the actual value of the effect estimates against their cumulative
normal probabilities. If the effects had occurred simply as the result of random variation about a
fixed mean, and the changes in levels of the independent variables had had no real effect at all on
the response, then all the main effects and interactions would be distributed about zero (normal
distribution). They would therefore plot on a normal probability plot as a straight line whereas
significant effects will have a non-zero means and will not lie along the straight line. To see
whether they do, the main effects are ordered in increasing order and plotted with an appropriate
scale. The scale is obtained by employing the generalized equation (Box et al., 1978):
(3.1)
Where, m = total number of effects, P = Probability points, i = Order number
Pareto chart
Plotting the effects on a Pareto chart provides an alternative and equally effective way of helping
with the selection of significant factors. The Pareto chart is based on an algorithm that produces
a statistically-based acceptance limit of significance (Tague, 2004; Wilkinson, 2006). The level
of significance is represented by horizontal bar graphs. The statistical technique, based on the
Pareto principle of the „vital few‟, is used for the selection of factors that produce a statistically
significant overall effect.
Page 46
Extraction of Aluminium from CFA Alan Shemi
Page 34
The procedure involves plotting the actual value of the effects against their cumulative
frequencies. Arranged in decreasing order, the values of effects on the x-axis are plotted against
cumulative percent frequencies on the y-axis to form a curve. On the same graph, bar graphs of
effects on the x-axis are arranged in decreasing order and plotted against percent frequencies on
the y-axis. A line is drawn at the 80% mark on the y-axis parallel to the x-axis then dropped to
the x-axis at the point of intersection with the curve. This point on the x-axis separates the
significant effects from the non-significant effects (Quality guide, 2012).
Optimization
Optimization of factors (Chapter 6) was carried out after screening so as to predict the response
values for all possible combinations of the significant factors within the experimental range and
to identify the optimum point. The response surface methodology (RSM) was used in the
optimization of significant factors. RSM is a collection of statistical and mathematical methods
that are useful for modeling and analyzing problems. In this technique, the main objective is to
optimize the response surface that is influenced by various process parameters. The RSM
quantifies the relationship between the controllable input parameters and the response surface
(Tripathy and Murthy, 2012). The design procedure for RSM (Simate et al., 2009; Tripathy and
Murthy, 2012) used in this study had three stages as follows: (1) Designing and conducting of
experiments (2) Deriving and developing a mathematical model (3) Finding the stationary points
or optimal set of experimental parameters.
The optimization experiments were designed using the central composite rotatable design
(CCRD) and the optimal set of parameters was determined mathematically. According to the
NIST/SEMATECH e-Handbook of Statistical Methods (2012), a CCRD contains an imbedded
factorial or fractional factorial design with centre points that is augmented with a group of „star
(axial)‟ points that allow estimation of curvature. If the distance from the centre of the design
space to a factorial point ±1 unit for each factor, the distance from the centre of the design space
to the star (axial) point is ±α with α>1. The precise value of α depends on certain properties
desired for the design and on the number of factors involved. A CCRD with k factors has 2k star
(axial) points. The star (axial) points establish new extreme values (low and high) for each factor
in the design. This design has circular, spherical or hyper-spherical symmetry hence rotatable. To
Page 47
Extraction of Aluminium from CFA Alan Shemi
Page 35
maintain rotatability, the value of α depends on the number of experimental runs in the factorial
portion of the CCRD.
For a full factorial, (3.2)
Where,
In the CCRD method the factorial designs were augmented with axial designs and a quadratic
response surface model of the form (Simate et al., 2009; Tripathy and Murthy, 2012):
was fitted and solved using the method of least squares.
In Equation 3.3, y is the predicted response, βo is the coefficient for intercept, βi is the
coefficient of linear effect, βii is the coefficient of quadratic effect, βij is the coefficient of
interaction effect, ε is a term that represents other sources of variability not accounted for by the
response function, k is the number of variables, xi and xj are coded predictor variables for the
independent factors.
After determination of the coefficients of the regression model, the adequacies of the model were
checked using the analysis of variance (ANOVA). To do the analysis, ANOVA uses the
following methods:
Fisher‟s variance ratio test (F-test), to test evidence of lack of fit and significance of the
regression model.
Standard errors of model coefficients (t-test), to determine significance of regression
coefficients of parameters; intercept term, linear terms, quadratic terms and interaction
terms.
The coefficient of determination (R2), to check model accuracy; comparison between
experimental results and predicted values obtained using the refitted model.
The absolute average deviation (AAD), to check model plausibility; if found plausible, then
the model can be used to predict response values at any regime in the interval of the
experimental design.
)3.3.(..................................................11
2
1 1
ji
k
ij
ij
k
i
i
k
i
k
i
iiiio xxxxy
Page 48
Extraction of Aluminium from CFA Alan Shemi
Page 36
The coefficients of the regression model were estimated by fitting experimental results using
Design Expert® 6 software. Design Expert
® is a registered trademark of Stat-Ease, Incorporation,
Minneapolis, USA (Design Expert® 6 manual, 2010).
3.2.5 Acid Leaching of CFA
The sulphuric acid leaching experiment consisted of a 500ml volumetric flask, a thermal
reciprocal shaking bath and a filter funnel fitted with filter paper. The filter funnel was mounted
on the 1000ml Erlenmeyer flask. Leaching experiments comprised of adding a weighted CFA
sample, typically 50g, to the volumetric flask containing sulphuric acid then agitating the
resulting slurry in a constant temperature reciprocal shaking bath shown in Figure 3.3. Separate
samples were used for each allotted leaching condition. The leaching variables were acid
concentration, time, temperature and solid to liquid ratio at a constant rate of 150 rpm. After
leaching, the leached residual CFA was separated from the solution by filtration. Distilled water
was used to remove all of the residual liquor that was absorbed by the leached ash. Subsequently,
the leach liquor and wash solution were combined to produce the final leach liquor. The total
volume of the final leach liquor was recorded. The dry residual CFA was analysed by X-ray
fluorescence (XRF), X-ray diffraction (XRD) and the corresponding leach liquor by Inductively
Coupled Plasma-Optical Emission Spectrometry (ICP-OES).
Figure 3.3 Agitation leaching test equipment (Reciprocal Shaking Bath, Model: 207,
supplied by MERCK, South Africa)
Page 49
Extraction of Aluminium from CFA Alan Shemi
Page 37
To determine the possible influence of factors on the response (aluminium extraction) and to
identify their appropriate upper and lower limits, preliminary leach tests were conducted.
Leaching variables investigated included acid concentration, leaching time, temperature and
solid to liquid ratio at a constant agitation rate of 150 rpm. The leaching conditions for the
preliminary leach tests are given in Table 3.3.
TABLE 3.3 Sulphuric acid leaching conditions for the preliminary leach tests
Experiment run
Leaching Condition
Leaching Temperature
(oC)
Leaching
Time
(hrs)
Acid
concentration
(M)
Solid to Liquid ratio
Agitation
Rate
(rpm)
At different
temperatures
30, 45, 60, 75, 80, 85
8
6
1:4
150
At different
leaching times
60
4, 6, 8, 10,12
6
1:4
150
At different acid
concentrations
60
8
2, 4, 6, 8, 10
1:4
150
At different solid
to liquid ratios
60
8
6
1:2, 1:3, 1:4, 1:5, 1:6
150
To determine the effect of calcium sulphate formation on aluminium extraction, residue CFA
was collected and analyzed for calcium sulphate content. Leaching variables investigated
included acid concentration, temperature and solid to liquid ratio. The leaching conditions for the
calcium sulphate experiment are given in Table 3.4.
Page 50
Extraction of Aluminium from CFA Alan Shemi
Page 38
TABLE 3.4 Sulphuric acid leaching conditions for effect of CaSO4 on the dissolution
behaviour of CFA
Experiment run
Leaching condition
Leaching Temperature
(oC)
Leaching
Time
(hrs)
Acid
concentration
(M)
Solid to Liquid ratio
Agitation
Rate
(rpm)
At different
temperatures
30,45, 60, 75, 85
8
6
1:4
150
At different acid
concentrations
75
8
2, 4, 6, 8, 10
1:4
150
At different solid to
liquid ratios
75
8
6
1:2, 1:3, 1:4, 1:5, 1:6
150
To determine the kinetics of dissolving alumina, the change in the rate of dissolution was
observed, at three different temperatures, by monitoring the variation of aluminium sulphate
[Al2(SO4)3] concentration with time. The experimental procedure consisted of collecting 7mL
aliquots at different times during the leaching reaction. The aliquot samples were filtered and the
leach liquor was submitted for the analysis of Al concentration. The leaching conditions for the
kinetics experiments are given in Table 3.5.
TABLE 3.5 Sulphuric acid leaching conditions for the kinetics experiments
Experiment Run
Leaching Condition
Leaching
Temperature
(oC)
Aliquot Sampling Times
(hrs)
Acid
concentration
(M)
Solid to Liquid ratio
Agitation
Rate
(rpm)
Run1
50
0.1, 0.3, 0.5, 1.5, 3, 8, 10
6
1:4
150
Run2
70
0.1, 0.3, 0.5, 1.5, 3, 8, 10
6
1:4
150
Run 3
82
0.1, 0.3, 0.5, 1.5, 3, 8, 10
6
1:4
150
Page 51
Extraction of Aluminium from CFA Alan Shemi
Page 39
3.2.6 Pelletization
The residue-CFA from the first leaching stage was pelletized with fine coal and calcium
carbonate in the mass ratio of 5:4:1 to produce pellets that were strong enough to withstand
sintering conditions in the muffle furnace. The residue-CFA, calcium carbonate and fine coal
(100% passing 212 µm size fraction) was mixed with 10-20% water and pelletized to form 4-
6mm spherical pellets for the sintering and leaching steps. The pellets were air-dried for 48 hrs
for easy handling. In order to compare the two-step acid leach extraction results with the lime-
sinter single-step acid leach, Raw-CFA was also pelletized and sintered using the same
pelletization and sintering conditions as for residue-CFA.
3.2.7 Sintering of Pellets
Sintering was carried out under atmospheric conditions by using a muffle chamber furnace
shown in Figure 3.4. Dry pellets were placed into an alumina crucible, mounted in a muffle
furnace and heated to a temperature of 1150°C for 180 minutes to produce sintered pellets for
stage two leaching.
Figure 3.4 Sintering equipment; the 1300°C muffle chamber furnace (Model: LLC 13/42-PA,
supplied by LENTON Furnaces, South Africa)
Page 52
Extraction of Aluminium from CFA Alan Shemi
Page 40
3.2.8 Post-sinter Leaching of the Sintered Pellets
Sintered pellets were crushed and ground to a course powder (100% passing 212µm) then
leached with a 6M sulphuric acid solution as per the previously described acid leaching
procedure. After leaching, the leached CFA and leach liquor mixture were filtered, residues were
washed with distilled water and the final volume of the filtrate was recorded. The dry residue-
CFA was analysed using X-ray fluorescence (XRF) and X-ray diffraction (XRD), and the
corresponding leach liquor was analysed using Inductively Coupled Plasma- Optical Emission
Spectrometry (ICP-OES).
3.2.9 Experimental Design
Table 3.6 shows the experimental design indicating test conditions, samples tested and the
number of replicates in each experimental test.
Table 3.6 Experimental design
Test Type
Test Conditions
Materials/Samples Tested
(Sulphuric acid was used in all
leaching tests)
Replicates
Preliminary Acid
Leaching Tests
Acid concentration
Leaching time
Leaching temperature
Solid to liquid ratio
Raw CFA
2
Identification of
influential parameters
Acid concentration
Leaching time
Leaching temperature
Solid to liquid ratio
Raw CFA
2
Optimization of
influential factors
Leaching time
Leaching temperature
Raw CFA
2
Post-sinter
(second stage) leaching
Acid concentration
Leaching time
Leaching temperature
Solid to liquid ratio
Residue sintered CFA
2
All the tests were done at a constant agitation rate of 150 rpm
Page 53
Extraction of Aluminium from CFA Alan Shemi
Page 41
3.3 Data Analysis
The data was obtained as described in the foregoing sections of this chapter. The data obtained
was used to determine relationships between aluminium extraction (the desired response) and the
parameters tested. The experimental results and the relationships are discussed in the subsequent
chapters of this dissertation. The aluminium extraction was calculated as a percentage of the
aluminium in the liquid phase to that in CFA.
Page 54
Extraction of Aluminium from CFA Alan Shemi
Page 42
CHAPTER FOUR
PRELIMINARY ACID LEACHING
4.1 Introduction
The global demand for metal resources is increasing rapidly (Halada et al., 2008), and this
increase in demand is closely linked to world economic growth. The development of major
nations and advances in technologies are fuelling ever more demand. This has motivated more
studies into resource recovery of valuable metals from primary as well as alternative secondary
resources. Recently, much attention from the scientific community has been paid to research
connected with the recovery of alumina from alternative alumina sources such as CFA using
acidic routes. This is so because an economic process for recovering alumina from readily
available CFA is needed.
The possibility of using an indirect acid leach method to process CFA has been discussed in
section 2.4.3. The indirect leach process employs a pre-sinter and post-sinter (two-step acid
leach) method to achieve optimum aluminium extraction from CFA.
In order to explore the possible influence of factors on the aluminium extraction and to identify
their appropriate upper and lower limits, preliminary leach tests were initially conducted
according to the procedure previously described in section 3.2.5. In addition, this study looks at
alumina dissolution kinetics and the role of CaSO4 in the dissolution behaviour of CFA by
investigating the effect of parameters such as acid concentration, leaching temperature, leaching
time and solid to liquid ratio at a constant agitation rate of 150 rpm. This understanding will be
used as a basis for the subsequent screening, optimization and indirect acid leaching studies that
follow from Chapter 5 to Chapter 7.
In order to describe the rate controlling mechanism for alumina dissolution, an attempt was made
to fit the experimental kinetic data into the shrinking core model. Furthermore, the physical and
chemical properties of CFA, such as the elemental composition of CFA by particle size, were
investigated in order to understand the response of CFA to the beneficiation process.
Page 55
Extraction of Aluminium from CFA Alan Shemi
Page 43
4.2 Results and Discussion
4.2.1 Elemental Composition of CFA by Particle Size
The elemental composition of CFA in the size range of -38µm and +212µm is presented in
Table 4.1. The results show a narrow CFA grade range. This indicates that the particle size of
CFA may not have much influence on the extent of aluminium extraction as seen from the
narrow grade range.
Table.4.1 Elemental composition of CFA by particle size
Size Fraction
(µm)
< 38 +38 +45 +53 +63 +75 +106 +150 +212
Mass retained
(wt)
174 39 72 7 386 148 186 71 34
Mass retained
(%)
16 3 6 1 35 13 17 6 3
Al2O3 (wt %) 31.59 30.13 30.83 29.27 30.60 29.95 29.47 29.16 30.02
4.2.2 Effect of Temperature
The effect of temperature on aluminium extraction from CFA by sulphuric acid leaching to form
Al2 (SO4)3 is presented in Figure 4.1. The figure shows an increase in aluminium extraction with
increase in temperature. An extraction of 10.0% was obtained at 30°C, 14.6% at 45°C, 16.5% at
60°C, 23.5% at 75°C, 22.9% at 80°C and 23.1% at 85°C. The figure illustrates that extraction
increased with temperature up to 75°C with slight fluctuations in extractions between 75°C and
85°C. For this reason, 75°C was adopted as the appropriate leaching temperature. Higher
aluminium extractions at higher temperatures were attributed to the fact that molecules at higher
temperatures have more thermal energy required for effective reaction.
Page 56
Extraction of Aluminium from CFA Alan Shemi
Page 44
Figure 4.1 Effect of temperature on acid leaching of CFA
4.2.3 Effect of Time
The effect of time on aluminium extraction from CFA by sulphuric acid leaching is presented in
Figure 4.2. The figure shows that extraction increased with increase in leaching time from 4hrs
to 6hrs. An aluminium extraction of 13.9% was obtained after 4hrs of reaction, 16.8% after 6hrs,
16.5% after 8hrs, 17.7% after 10 hrs and 16.4% after 12hrs. The figure illustrates that extraction
increased with increase in leaching time from 4hrs to 6 hrs with slight variations thereafter.
Leaching beyond 6 hrs did not improve extraction to any great extent. This may have been due to
the accumulation of calcium sulphate or any other product layer that covered the CFA and
prevented the acid attack over time (Seidel et al., 1998) as the leaching temperature was kept
constant at 60°C. Therefore, 6 hrs was adopted as the appropriate leaching time.
0
5
10
15
20
25
30
30 45 60 75 80 85
Al
Extr
act
ion
(%
)
Temperature (oC)
Page 57
Extraction of Aluminium from CFA Alan Shemi
Page 45
Figure 4.2 Effect of leaching time on acid leaching of CFA
4.2.4 Effect of Acid Concentration
The effect of sulphuric acid concentration on aluminium extraction is presented in Figure 4.3.
The figure shows 15.7% aluminium extraction at 2M, 16.6% at 4M, 16.5% at 6M, 14.8% at 8M
and 10.9% at 10M. Results show a decrease in aluminium extraction beyond 6M acid
concentration. The decrease at higher acid concentration is probably due to low mass transfer
rates of reactants and products caused by the increase in CaSO4 formation in the slurry mixture.
A similar phenomenon was also observed by Seidel and co-workers (1998). The authors
postulated that increasing acid concentration produces two opposing effects simultaneously. An
increase in the hydronium ion enhances the dissolution of alumina, whereas the increase in the
concentration of the sulphate and dissolved calcium ions intensifies the formation of calcium
sulphate precipitates. The precipitates hinder mass transfer across the ash particle thus inhibiting
alumina dissolution. Based on this information, 6M was adopted as the appropriate acid
concentration.
0
2
4
6
8
10
12
14
16
18
20
4 6 8 10 12
% a
lum
iniu
m
extr
act
ion
Time (hrs)
Page 58
Extraction of Aluminium from CFA Alan Shemi
Page 46
Figure 4.3 Effect of acid concentration on acid leaching of CFA
4.2.5 Effect of Solid to Liquid ratio
The effect of solid to liquid ratio is presented in Figure 4.4. The figure shows 15.0% aluminium
extraction at 1:2 solid to liquid ratio, 15.4% at 1:3, 16.5% at 1:4, 16.2% at 1:5 and 14.8% at 1:6.
Results show an optimum solid to liquid ratio of about 1:4 with much lower extractions on either
side. The solid to liquid ratio is a representation of the ratio of weight of solids to volume of acid.
A decrease in solid to liquid ratio therefore implies an increase in acid volume while the amount
of solids remains constant. Increased acid volume creates a less dense slurry mixture, frees up
ash particles creating additional surface area for contact between reactants. Larger surface areas
for contact, in particular solid ones in heterogeneous systems, lead to higher reaction rates. An
increase in both the ash particle surface contact and the hydronium ion enhances the dissolution
of aluminium; whereas the increase in the ash particle surface contact and the sulphate ions and
dissolved calcium ions intensifies the formation of calcium sulphate precipitates. The precipitates
obstruct mass transfer across the CFA particle thus slowing down the reaction, inhibiting
alumina dissolution and consequently causing lower aluminium extraction.
The decreased aluminium extraction for the solid to liquid ratio greater than 1:4 was probably
due to low mass transfer rates of reactants and products caused by the increased density of the
0.0
2.0
4.0
6.0
8.0
10.0
12.0
14.0
16.0
18.0
2 4 6 8 10
% a
lum
iniu
m
extr
act
ion
Acid concentration (M)
Page 59
Extraction of Aluminium from CFA Alan Shemi
Page 47
CFA reaction mixture. This may have caused the particles not to be suspended efficiently in the
solution as the stirring rate was kept constant. Based on this information, 1:4 was therefore
adopted as the appropriate solid to liquid ratio.
Figure 4.4 Effect of solid to liquid ratio on acid leaching of CFA
4.2.6 Role of Calcium Sulphate in the Dissolution Behaviour of CFA
CFA is formed under oxidizing conditions when coal is combusted at temperatures in excess of
1400°C to form metal oxides and other non-combustible ash residues. In these combustion
reactions, vaporized compounds adsorb onto the outer surface layer of the CFA ash particle thus
enriching it in carbon, potassium, sodium, calcium and magnesium (Landman, 2003). The ash
particle outer layer is rich in calcium, the middle layer is predominantly rich in sodium and the
inner layer is rich in sodium, silicon and aluminium (Sakamoto et al., 2003; Landman, 2003).
Calcium is present in these ashes, in form of CaO, as the third major constituent after silica and
alumina. When reacted with sulphuric acid solution and by virtue of its outer layer position,
calcium is predisposed to form a calcium sulphate precipitate layer which can encapsulate the
CFA ash particle. The precipitate layer may hinder the mass transfer of reactants and products to
and from the unreacted core of the ash particle thus adversely affecting alumina dissolution in
CFA. When investigating the effect of parameters on calcium sulphate formation, 8 hrs leaching
13.5
14.0
14.5
15.0
15.5
16.0
16.5
17.0
1:2 1:3 1:4 1:5 1:6
% a
lum
iniu
m
extr
act
ion
Solid:Liquid ratio
Page 60
Extraction of Aluminium from CFA Alan Shemi
Page 48
time was chosen, instead of the 6 hrs preferred as appropriate in preliminary tests, in order to
allow for as much calcium sulphate formation as possible.
Effect of acid concentration on calcium sulphate formation
The effect of acid concentration on calcium sulphate formation is presented in Figure 4.5. The
figure shows a decrease in calcium sulphate formation between 2M and 6M acid concentration.
The decrease in calcium sulphate formation may be attributed to other metal ions competing for
sulphate ions in the acidic solution. The figure also shows that a decrease in calcium sulphate
formation corresponds to an increase in aluminium extraction and vice versa thus indicating that
calcium sulphate formation has an effect on alumina dissolution. The decrease in calcium
sulphate formation may be attributed to other metal ions competing for sulphate ions in the
acidic solution.
Figure 4.5 Effect of acid concentration on calcium sulphate formation at 75°C temperature; 8hrs,
leaching time; 1:4, solid to liquid ratio
Effect of temperature on calcium sulphate formation
The effect of temperature on calcium sulphate formation is presented in Figure 4.6. The calcium
sulphate formation was measured using XRD technique as mentioned in section 3.2.1. The figure
shows an increase in calcium sulphate formation with increase in temperature. In contrast, to the
0.0
1.0
2.0
3.0
4.0
5.0
6.0
0.0
5.0
10.0
15.0
20.0
25.0
2 4 6 8 10
%
calc
ium
su
lph
ate
co
nte
nt
%
alu
min
ium
extr
act
ion
Acid concentration (M)
aluminium extraction (%)
Calcium sulphate (%)
Page 61
Extraction of Aluminium from CFA Alan Shemi
Page 49
formation of precipitates, there is no decrease in aluminium extraction. This shows that much as
the calcium sulphate precipitate formation was favoured at higher temperatures, the precipitate
layer allowed the reactants to reach the unreacted core of the ash particle hence promoting
alumina dissolution. This indicates that there could have been some permeability in the product
layer. It, therefore, seems possible that high temperatures may have been helpful in breaking
down the calcium sulphate precipitate layer obstruction hence causing the alumina dissolution
reaction to proceed at a faster rate.
Figure 4.6 Effect of temperature on calcium sulphate formation at 6M, acid concentration; 8hrs,
leaching time; 1:4, solid to liquid ratio
Effect of solid to liquid ratio on calcium sulphate formation
The effect of solid to liquid ratio on calcium sulphate formation is presented in Figure 4.7. The
figure shows a decrease in calcium sulphate formation between the solid to liquid ratio of 1:2 and
1:4. The decrease in calcium sulphate formation may be attributed to other metal ions competing
for sulphate ions in the acidic solution. However, further decrease in the solid to liquid ratio
below 1:4 made more sulphate ions available resulting in increased calcium sulphate formation
and a decrease in aluminium extraction.
0.0
1.0
2.0
3.0
4.0
5.0
6.0
7.0
8.0
0.0
5.0
10.0
15.0
20.0
25.0
30.0
30 45 60 75 85
%
ca
lciu
m s
ulp
ha
te c
on
ten
t
%
alu
min
ium
extr
act
ion
Temperature ( C)
aluminium extraction (%)
calcium sulphate (%)
Page 62
Extraction of Aluminium from CFA Alan Shemi
Page 50
Figure 4.7 Effect of solid to liquid ratio on calcium sulphate formation at 75°C, temperature;
6M, acid concentration; 8hrs, leaching time
4.2.7 Kinetic Analysis
Rate controlling mechanisms
The dissolution rates of CFA were analyzed on the basis of the shrinking extraction type core
model under the assumption that the material consists of homogeneous spherical solid particles
that react isothermally with the fluid media (Gbor and Jia, 2004).
To determine the rate controlling regime, experimental results at different temperatures were
plotted in terms of the standard equations of the shrinking core model. The reaction kinetic
models are represented by linear kinetic equations, x = kt for film diffusion control; 1- (1-x)1/3
=
kt, for chemical reaction control and 1-3(1-x)2/3
+ 2(1-x) = kt, for product layer (ash) diffusion
control, where x is the conversion, t is the time in hours and k is the reaction rate constant (hr-1
).
All the kinetics experiments were conducted with 6M acid concentration, 1:4 solid to liquid ratio
and 10 hours leaching time. The leaching time in kinetics experiments was extended to 10 hours
in order to allow for as much extraction as possible.
The kinetic equations as functions of time at a temperature of 50°C were plotted and are
presented in Figures 4.8 to 4.10.
0.0
1.0
2.0
3.0
4.0
5.0
6.0
7.0
8.0
9.0
17
18
19
20
21
22
23
1:2 1:3 1:4 1:5 1:6
% c
alc
ium
su
lph
ate
co
nte
nt
%
alu
min
ium
extr
acti
on
Solid to liquid ratio at 75
C
aluminium extraction (%)
calcium sulphate (%)
Page 63
Extraction of Aluminium from CFA Alan Shemi
Page 51
Figure 4.8 Plot of x versus time for the acid leaching of CFA at 50°C
Figure 4.9 Plot of 1- (1-x)1/3
versus time for the acid leaching of CFA at 50°C
R² = 0.5142
0.00
0.02
0.04
0.06
0.08
0.10
0.12
0.14
0.16
0.18
0.0 2.0 4.0 6.0 8.0 10.0 12.0
x
Leaching time (hrs)
Conversion at 50°C
Linear (Conversion at 50°C)
R² = 0.5294
0.00
0.01
0.02
0.03
0.04
0.05
0.06
0.0 2.0 4.0 6.0 8.0 10.0 12.0
1-(
1-x
)1/3
Leaching time (hrs)
Conversion at 50°C
Linear (Conversion at 50°C)
Page 64
Extraction of Aluminium from CFA Alan Shemi
Page 52
Figure 4.10 Plot of 1- 3(1-x)2/3
+ 2(1-x) versus time for the acid leaching of CFA at 50°C
Examination of the kinetic equation plots as functions of time at 50°C did not give perfectly
fitting straight lines. However, from the three kinetic equation plots, the plot with a linear
correlation coefficient of 84.17% (Figure 4.10) shows a better fitting straight line. This indicates
that the alumina dissolution rate at 50°C was better modelled by the reaction kinetic model
represented by kinetic equation 1-3(1-x)2/3
+ 2(1-x) = kt for product layer diffusion control.
The kinetic equations as functions of time at a temperature of 70°C were plotted and are
presented in Figures 4.11 to 4.13.
R² = 0.7614
0.000
0.001
0.002
0.003
0.004
0.005
0.006
0.007
0.008
0.009
0.0 2.0 4.0 6.0 8.0 10.0 12.0
1-3
(1-x
)2/3
+ 2
(1-x
)
Leaching time (hrs)
Conversion at 50°C
Linear (Conversion at 50°C)
Page 65
Extraction of Aluminium from CFA Alan Shemi
Page 53
Figure 4.11 Plot of x versus time for the acid leaching of CFA at 70°C
Figure 4.12 Plot of 1- (1-x)1/3
versus time for the acid leaching of CFA at 70°C
R² = 0.5861
0.000
0.050
0.100
0.150
0.200
0.250
0.0 2.0 4.0 6.0 8.0 10.0 12.0
x
Leaching time (hrs)
Conversion at 70°C
Linear (Conversion at 70°C)
R² = 0.6102
0.00
0.01
0.02
0.03
0.04
0.05
0.06
0.07
0.08
0.09
0.0 2.0 4.0 6.0 8.0 10.0 12.0
1-(
1-x
)1/3
Leaching time (hrs)
Conversion at 70°C
Linear (Conversion at 70°C)
Page 66
Extraction of Aluminium from CFA Alan Shemi
Page 54
Figure 4.13 Plot of 1- 3(1-x)2/3
+ 2(1-x) versus time for the acid leaching of CFA at 70°C
Analysis of the kinetic equation plots as functions of time at 70°C did not give perfectly fitting
straight lines either. However, from the three kinetic equation plots, the plot with a linear
correlation coefficient of 88.34% (Figure 4.12) shows a better fitting straight line. This indicates
that the alumina dissolution rate at 70°C was better modelled by the reaction kinetic model
represented by kinetic equation 1- (1-x)1/3
= kt, for chemical reaction control.
The kinetic equations as functions of time at a temperature of 82°C were plotted and are
presented in Figures 4.14 to 4.16.
R² = 0.8624
0.000
0.002
0.004
0.006
0.008
0.010
0.012
0.014
0.016
0.018
0.0 2.0 4.0 6.0 8.0 10.0 12.0
1-3
(1-x
)2/3
+ 2
(1-x
)
Leaching time (hrs)
Conversion at 70°C
Linear (Conversion at 70°C)
Page 67
Extraction of Aluminium from CFA Alan Shemi
Page 55
Figure 4.14 Plot of x versus time for the acid leaching of CFA at 82°C
Figure 4.15 Plot of 1- (1-x)1/3
versus time for the acid leaching of CFA at 82°C
R² = 0.5647
0.000
0.050
0.100
0.150
0.200
0.250
0.300
0.0 2.0 4.0 6.0 8.0 10.0 12.0
x
Leaching time (hrs)
Conversion at 82°C
Linear (Conversion at 82°C)
R² = 0.5905
0.00
0.01
0.02
0.03
0.04
0.05
0.06
0.07
0.08
0.09
0.10
0.0 2.0 4.0 6.0 8.0 10.0 12.0
1-(
1-x
)1/3
Leaching time (hrs)
Conversion at 82°C
Linear (Conversion at 82°C)
Page 68
Extraction of Aluminium from CFA Alan Shemi
Page 56
Figure 4.16 Plot of 1- 3(1-x)2/3
+ 2(1-x) versus time for the acid leaching of CFA at 82°C
Analysis of the kinetic equation plots as functions of time at 82°C did not give perfectly fitting
straight lines. However, from the three kinetic equation plots, the plot with a linear correlation
coefficient of 82.98% (Figure 4.16) shows a better fitting straight line. This shows that the
alumina dissolution rate at 82°C was better modelled by the reaction kinetic model represented
by kinetic equation 1-3(1-x)2/3
+ 2(1-x) = kt for product layer diffusion control.
From the analysis of the models, it was found that the dissolution rates at temperatures of 50°C,
and 82°C were better expressed by the reaction kinetic model represented by kinetic equation 1-
3(1-x)2/3
+ 2(1-x) = kt for product layer diffusion control. However, the dissolution rate at 70°C
was better expressed by the reaction kinetic model represented by kinetic equation 1- (1-x)1/3
=
kt, for chemical reaction control. This inconsistency may have been due to the effect of the non-
coupling of the PSD to the shrinking core model as postulated by Gbor and Jia (2004). The
coupling of PSD to the shrinking core model was not done in this study. Much as the CFA
particle size may not have had much influence on the extent of aluminium extraction, not
coupling the PSD with the shrinking core model may have caused erroneous shifts in the control
regime. Therefore, in order to accurately predict the control regime in the leaching of CFA, the
R² = 0.8298
0.000
0.005
0.010
0.015
0.020
0.025
0.0 2.0 4.0 6.0 8.0 10.0 12.0
1-3
(1-x
)2/3
+ 2
(1-x
)
Leaching time (hrs)
Conversion at 82°C
Linear (Conversion at 82°C)
Page 69
Extraction of Aluminium from CFA Alan Shemi
Page 57
use of a model that takes into account the coupling of PSD to the shrinking core model may be
required.
In the following section, the activation energy was used as an alternative method for examining
rate controlling mechanisms for the same aluminum extraction process.
Determination of Activation Energies
The Arrhenius equation gives a quantitative relation between the rate constant (k) and
temperature (T) according to Equation 4.1:
(4.1)
Where A is the frequency factor, Ea is the activation energy, R is the gas constant = 8.314 (J ·
mol -1
· K -1
) and T is the absolute temperature in Kelvin (K).
For a process run at two known temperatures and/or rate constants, Equation 4.2 (Laidler, 1984;
Logan, 1982; Chang, 2005; Segal, 1975), previously derived in section 2.4 may be used to
determine activation energy (Ea).
(4.2)
From the kinetics experiment, alumina dissolution in sulphuric acid solution was considered to
proceed according to the following reaction:
CaO + Al2O3 + 4H2SO4 → Al2 (SO4)3 + CaSO4 + 4H2O (4.3)
The changing rate in alumina dissolution was observed, at three different temperatures, by
monitoring the concentration of aluminium sulphate [Al2(SO4)3] with change in time as shown in
Figure 4.17.
Page 70
Extraction of Aluminium from CFA Alan Shemi
Page 58
Figure 4.17 Variation of aluminium sulphate [Al2(SO4)3] concentration with time
Using the graphs in Figure 4.17, the rate of reaction at any instant of time was determined by
measuring the slopes of each curve at that time. This also corresponds to the rate of reaction at
an instant of concentration. The rates of reaction were then plotted against concentration for
each curve as shown in Figures 4.18 to 4.20.
0
5
10
15
20
25
0 100 200 300 400 500 600 700
Al 2
(SO
4) 3
mo
lL-1
x1
0-2
Leaching time (minutes)
82°C
70°C
50°C
Page 71
Extraction of Aluminium from CFA Alan Shemi
Page 59
Figure 4.18 Variation of aluminium sulphate concentration with rate of reaction
at 50°C
Figure 4.19 Variation of aluminium sulphate concentration with rate of reaction
at 70°C
R² = 0.9438
0.00
0.10
0.20
0.30
0.40
0.50
0.60
0.70
0.00 2.00 4.00 6.00 8.00 10.00 12.00 14.00
mo
lL-1
s-1 x
10
-5
[Al2(SO4)3] x10-2 molL-1 at 50
C
R² = 0.9859
0.00
0.10
0.20
0.30
0.40
0.50
0.60
0.70
0.80
0.90
0.00 5.00 10.00 15.00 20.00
mo
lL-1
s-1 x
10
-5
[Al2(SO4)3] x10-2 molL-1 at 70
C
Page 72
Extraction of Aluminium from CFA Alan Shemi
Page 60
Figure 4.20 Variation of aluminium sulphate concentration with rate of reaction
at 82°C
From the slopes of the rate of reaction versus concentration the values for the rate constants k1
at 50°C(323K), k2 at 70°C(343K) and k3 at 82°C(355K) were determined as 6.3 x 10⁻⁵
s-1
, 9.7 x10-
5s
-1 and 10.7 x10
-5 s
-1 respectively. Using the obtained k values and Equation 4.2, the calculated
activation energies were 18.3kJmol-1
for the lower temperature range (50 – 70°C) and 7.7kJmol-1
for the higher temperature range (70°C – 82°C).
Based on activation energies for rate controlling mechanisms displayed in Table 4.2 (Habashi,
1969; Potgieter et al., 2006), these low activation energies indicate that diffusion through the
product layer was the rate controlling mechanism. The low activation energies are also indicative
of the small potential energy barrier between reactant and product that must be overcome.
R² = 0.9811
0.00
0.10
0.20
0.30
0.40
0.50
0.60
0.70
0.80
0.90
0.00 5.00 10.00 15.00 20.00
mo
lL-1
s-1 x
10
-5
[Al2(SO4)3] x10-2 molL-1 at 82
C
Page 73
Extraction of Aluminium from CFA Alan Shemi
Page 61
Table 4.2 Activation energies for rate controlling mechanisms (Habashi, 1969; Potgieter et al.,
2006)
Regime
Activation Energy
Product (Ash) diffusion control
< 20 kJmol
-1
Film diffusion control
20 - 50 kJmol
-1
Chemical reaction control
> 50 kJmol
-1
4.3 Summary and Conclusions
In order to explore the possible influence of factors on the aluminium extraction and to identify
their appropriate upper and lower limits, preliminary leach tests were conducted. In particular,
this study looked at the effect of different parameters and calcium sulphate formation on the
leaching characteristics of CFA. The study also looked at alumina dissolution kinetics. It has
been deduced from this Chapter that alumina dissolution in CFA is influenced by acid
concentration, leaching temperature, solid to liquid ratio and calcium sulphate formation.
Results from the elemental composition of CFA showed a narrow grade range indicating that the
particle size of CFA may not have much influence on the extent of aluminium extraction.
Experimental results showed an increase in aluminium extraction with increase in leaching
temperature. A maximum extraction of 23.5% was obtained at a temperature of 75°C. Therefore,
75°C was taken as the appropriate leaching temperature.
Aluminium extraction increased with increase in leaching time with slight variations beyond 6
hours of leaching. Based on this information, 6 hours was adopted as the appropriate leaching
time.
Page 74
Extraction of Aluminium from CFA Alan Shemi
Page 62
Experimental results also showed that aluminium extraction decreased with increase in acid
concentration beyond 6M. The decrease in extractions at higher acid concentration beyond 6M is
attributed to low mass transfer rates of reactants and products caused by the increase in CaSO4
formation in the slurry mixture. Therefore, 6M was adopted as the appropriate acid
concentration.
Experimental results further showed 1:4 to be the optimum solid to liquid ratio with much lower
extractions on either side. Decreased extractions at solid to liquid ratios higher than 1:4 were
attributed to low mass transfer rates of reactants and products caused by the increased density of
the CFA reaction mixture. Decreased extractions at solid to liquid ratios lower than 1:4 were
attributed to low mass transfer of reactants and products caused by more calcium sulphate
formation due to an increase in sulphate ions from increased acid volume. Based on this
information, 1:4 was adopted as the appropriate solid to liquid ratio.
A decrease in calcium sulphate formation resulted in a corresponding increase in aluminium
extraction and vice versa. This showed that other factors other than calcium sulphate formation
influenced the extraction process.
The effect of temperature on leaching reactions was modeled by the Arrhenius equation. The
calculated activation energies were found to be 18.3kJmol-1
for the lower temperature range
(50°C - 70°C) and 7.7kJmol-1
for the higher temperature range (70°C - 82°C). Both activation
energies were found to be characteristic of a product layer controlled mechanism. The shrinking
core model predicted similar results for the leaching reactions at 50°C and 82°C. However, at
70°C, the model predicted differently, showing chemical reaction control as the rate controlling
mechanism.
Page 75
Extraction of Aluminium from CFA Alan Shemi
Page 63
CHAPTER FIVE
IDENTIFICATION OF SIGNIFICANT FACTORS
5.1 Introduction
Engineers and scientists often perform one-factor-at-a-time (OFAT) experiments, which vary
only one factor or variable at a time while keeping others constant. However, statistically
designed experiments that vary several factors simultaneously are more efficient when studying
two or more factors (Czitrom, 1999). A description of one-factor-at-a-time experiments and
designed experiments is available in existing literature (Box et al., 1978; Montgomery, 1997;
Mason et al., 1989). A comparison between the two shows a designed experiment to have a more
effective way to determine the impact of two or more factors on a response than an OFAT
experiment because a designed experiment makes use of a multivariate design. Some specific
advantages that designed experiments have over OFAT experiments include the following
(Czitrom, 1999):
Designed experiments require fewer resources (experiments, time material, etc) for the
amount of information obtained. This can be of major importance in industry, where
experiments can be very expensive, time consuming and disruptive to operations.
The estimates of the effects of each factor are more precise. Using more observations to
estimate an effect results in higher precision or reduced variability. In designed experiments,
all the observations are used to estimate the effect of each factor and each interaction, while
typically two of the observations in an OFAT experiment are used to estimate the effect of
each factor.
The interaction between factors can be estimated systematically. An interaction of factors is a
relationship where, the effect that a factor has on the product or process is altered due to the
presence of one or more factors. Interactions are not estimable from OFAT experiments.
There is experimental information in a larger region of the factor space. This improves the
prediction of the response in the factor space. It also makes process optimization more
efficient because the optimal solution is searched for over the entire factor space.
The purpose of this study was to investigate and identify factors that significantly influence the
direct leaching of CFA. The study employed a statistical Design of Experiments (DOE) method
Page 76
Extraction of Aluminium from CFA Alan Shemi
Page 64
as a research tool to develop an experimentation plan for determining the significant factors
affecting CFA leachability with sulphuric acid. The significance of each factor and associated
interactive effects were evaluated using a two-level four-factor full factorial statistical design of
experiments (24) and dissolved aluminium was taken as the measured response. Identification of
influential factors is absolutely vital for process optimization and cost control.
The materials and reagents used in the experiment were as previously described in sections 3.2.1
and 3.2.2.
5.2 Experimental Plan for Statistical Design of Experiments (DOE)
Statistical Design of Experiments (DOE) was used in this work to study the leaching behaviour
of CFA. This is the simultaneous study of several process variables which when combined
results in better understanding of the process (Barrentine, 1999). An experimental design matrix
was used in order to change several factors in a systematic way so as to ensure a reliable and
independent study of main factors and their interactions. At this identification stage, the study
looked at the influence of the main factors on the acid leaching of CFA. The main intention was
to identify the key factors (independent variables) that affect the response (desired goal) and the
interactions among themselves (two factor, three factor or four factor interactions). The major
objective was to find the maximum and not necessarily the optimum solubilization of aluminium
using sulphuric acid. The desired response was therefore aluminium extracted into solution.
Leaching experiments were carried out at low and high factor levels represented by codified
values of -1 and +1. For the quantitative variables (factors), -1 represents the low level and +1
the high level. The Factors investigated included: acid concentration, leaching time, leaching
temperature and solid to liquid ratio.
Factors and Levels in Experimental Runs
Some factors that influence the dissolution of CFA have been studied and identified by previous
researchers using various leaching methods (Seidel et al., 2001; Murtha and Burnet, 1983; Nayak
and Chitta, 2009; Matjie et al., 2005, Kelmers et al., 1982; McDowell and Seeley, 1981a;
McDowell and Seeley, 1981b). Therefore, the choice of factors and levels was based on past
experience of CFA leaching. This study was designed to determine the influence of some of
Page 77
Extraction of Aluminium from CFA Alan Shemi
Page 65
these factors in the leaching of CFA using sulphuric acid and quantify them to make sure that the
influence is both measurable and predictable. In this work, design factors were categorized as
controlled factors and held constant factors. The controlled factors, presented in Table 5.1, were
the factors selected for investigation. The held constant factor such as agitation rate is a factor
that may have an influence on the response but is of no particular interest in the current study so
it was held constant at 150 rpm.
Table 5.1 Experimental factors and levels for controlled factors
At this diagnostic stage, the use of two levels for each factor allows for simplification of the
analysis and provides substantial reduction in the number of runs required.
To simplify calculations and for uniform comparison, controlled factors were studied with their
codified values of +1 or -1. The levels of controlled variables in coded units (Box et al., 1978)
were obtained using the following formula:
(5.1)
Where,
Controlled Factors
Level 1
Centre Point
Level 2
Acid concentration (M)
4
6
8
Leaching time (hrs)
6
8
10
Leaching temp (oC)
45
60
75
Solid to Liquid ratio
1:3
1:4
1:5
Page 78
Extraction of Aluminium from CFA Alan Shemi
Page 66
5.2.1 Methodology for Data Analysis
Normal probability plot of effects
The normal probability plot of effects was carried out according to the procedure described in
section 3.2.4. If the effects had occurred simply as the result of random variation about a fixed
mean, and the changes in levels of the independent variables had had no real effect at all on the
aluminium extraction, then all the 15 main effects and interactions would be distributed about
zero (normal distribution). They would therefore plot on a normal probability plot as a straight
line. To see whether they do, the 15 main effects are ordered in increasing order and plotted with
an appropriate scale. The scale was obtained by employing the generalized equation (Box et al.,
1978):
(5.2)
Where,
m = total number of effects, P = Probability points, i = Order number
An effect is the difference in response averages that are applicable to the levels of the factor. The
effect of factor A on the response can be obtained by taking the difference between the average
response when A is high and the average response when A is low (Barrentine, 1999; Box et al.,
1978).
Effect of factor A = Average response at A high – Average response at A low
For example,
Table C2 Replicate 1(Appendix C)
Average response at A high, is given by averaging the results obtained by running experiments 2,
4, 6, 8, 10, 12, 14 and 16, and average response at A low by averaging the results obtained from
running experiments 1, 3, 5, 7, 9, 11, 13 and 15.
Page 79
Extraction of Aluminium from CFA Alan Shemi
Page 67
Average extractions at A high =
14.45
Average extractions at A low =
Difference =
∴ Effect of factor A =
Effect of factor A is also referred to as a main effect. The negative effect implies that increasing
the factor level from low to high lowers the response.
Pareto chart
The Pareto chart (Tague, 2004; Wilkinson, 2006) was plotted according to the procedure
described in section 3.2.4.
Graphical residual analysis
Normal plotting of residuals provides a diagnostic check for any tentatively entertained model
(Box et al., 1978). The normal probability plots of the residuals for the data tests the theory that
the residuals have a normal distribution. This should be a straight line if the residuals have a
normal distribution.
A plot of residuals versus the predicted values (fitted model values) is a test of the theory that the
variations are the same in each group. Studentized „deleted‟ residuals were calculated for each
run in order to remove undue influence from outliers. A Studentized residual, therefore, is
evaluated based on the predicted value when the value itself is excluded from the analysis. The
residuals were calculated using Equation 5.3 (Simate and Ndlovu, 2008):
(5.3)
Page 80
Extraction of Aluminium from CFA Alan Shemi
Page 68
Where, is the ith observation (extraction) in the experimental data, is the
predicted value of the response from the fitted model, is the standard deviation of all
residuals from the regression analysis that deleted the ith observation.
Test for curvature check using centre points
The check for local planarity is supplied by comparing Yf, the average of the factorial points,
with Yc, the average at the centre of the design. By thinking of the design as sitting on a saucer
like surface, it is seen that Yf - Yc is a measure of overall curvature of the surface (Box et al.,
1978). If Yc is the average aluminium extraction of total runs at the centre and Yf the average
aluminium extraction of the total runs at the factorial points under study, then, if the two
averages are very similar (for example, difference of 0.1%) then the centre points lie on or near
the plane passing through the factorial points and hence there‟s no quadratic curve and no
curvature. However, if Yf - Yc is large, then quadratic curvature is present (Montgomery, 2005).
All experiments were randomly run in order to “average out” the effects of extraneous factors
that may have been present (Montgomery, D. C., 1976).
The experimental procedure was as previously described in section 3.2.5.
5.3 Results and Discussion
5.3.1 Significant factors
Aluminium extraction results from experimental runs for the 24 full factorial design with
codified and actual values are given in Table 5.2.
The aluminium extraction in the sulphuric acid leaching of CFA presented in Table 5.2 was
calculated as a percentage of aluminium in leach liquor to that in the unprocessed CFA (a sample
calculation is given in Appendix A).
Page 81
Extraction of Aluminium from CFA Alan Shemi
Page 69
Table 5.2 Aluminium extraction results for the 24 full factorial design
The actual factor levels coded as values of (-1) and (+1) in the table are as follows:
A (Acid concentration): 4M (-1) and 8M (+1); B (Leaching time): 6hrs (-1) and 10hrs (+1);
C (Leaching temp): 45oC (-1) and 75
oC (+1); D (Solid: Liquid ratio): 1:3(-1) and 1:5(+1)
The experimental data given in Table 5.2 was used to estimate the main and interaction effects
presented in Figure 5.1.
Standard
Run
Order
Random
Run
Order
Control Factors
% Al
Extraction
(average)
A B C D
1 1 -1 -1 -1 -1 11.7
2 4 +1 -1 -1 -1 10.3
3 14 -1 +1 -1 -1 13.5
4 18 +1 +1 -1 -1 14.0
5 6 -1 -1 +1 -1 16.4
6 19 +1 -1 +1 -1 16.2
7 25 -1 +1 +1 -1 18.0
8 15 +1 +1 +1 -1 20.3
9 24 -1 -1 -1 +1 11.4
10 5 +1 -1 -1 +1 12.0
11 7 -1 +1 -1 +1 13.4
12 27 +1 +1 -1 +1 11.7
13 10 -1 -1 +1 +1 17.8
14 26 +1 -1 +1 +1 13.0
15 17 -1 +1 +1 +1 17.3
16 9 +1 +1 +1 +1 18.1
Page 82
Extraction of Aluminium from CFA Alan Shemi
Page 70
Figure 5.1 Pareto chart showing significance of main and interactive effects of acid concentration,
leaching time, temperature and solid to liquid ratio
A – acid concentration
B – leaching time
C – temperature
D – solid : liquid ratio
AB, AD, BD, CD and BC: interactive effects
Vertical line across the bar graphs = Critical Value
Bar graph to the left of the Critical Value line = Non-significant Value
Bar graph beyond the Critical Value line = Significant Value
0 2 4 6 8 10
BC
CD
Acid Conc
BD
Solid : Liquid Ratio
AD
AB
Leaching Time
Temperature
Legend
Standardized Effect Value
Pareto Chart
Critical Value
Page 83
Extraction of Aluminium from CFA Alan Shemi
Page 71
Analysis of the individual factors on the Pareto chart showed that leaching time and leaching
temperature were statistically significant since they overshot the critical value line. Acid
concentration and solid to liquid ratio were not statistically significant because they fell short of
the critical value line. There was no significant interaction among the factors because all the
interactions fell short of the critical value line. The experimental data given in Table 5.2 was
also used to estimate the main and interaction effects presented in Figure 5.2.
Figure 5.2 Normal plot of effects of main factors and factor interactions from the 24 full factorial
design A, B, C and D are main factors: A-acid concentration, B-time, C-temperature, D-solid:liquid
ratioAB, AC, BC, AD, BD, CD, ABC, ABD, ACD, BCD and ABCD are factor interactions.
The normal probability plot of effects presented in Figure 5.2 was used to determine the
significant effects. Analysis of the individual factors on the probability plots showed that
leaching time (B) and leaching temperature (C) were statistically significant since they were not
distributed about a fixed zero mean. They are far from the zero mean (normal distribution). Acid
concentration (A) and solid to liquid ratio (D) are not statistically significant because they do not
differ much from normal distribution. They are very close to zero mean. There was no significant
AD
ACD
D
BD
A
CD
ABD
AC
BC
BCD
ABCD
AB
ABC
B
C
0
20
40
60
80
100
120
-2.00 -1.00 0.00 1.00 2.00 3.00 4.00 5.00 6.00
No
rm
al
% P
ro
ba
bil
ity
Effects on aluminium extraction
Page 84
Extraction of Aluminium from CFA Alan Shemi
Page 72
interaction among the factors because all the interactions do not differ much from normal
distribution.
The significance of leaching time and temperature compared factors refers to the plausibility of
the effect in light of the statistical data. In other words, there is reason to believe that the effect of
the two factors is relevant to the extraction process. This also means that the other factors may be
statistically insignificant but they are scientifically important (Simate et al., 2009).
A first order polynomial model (fitted model) between significant factors and the response was
developed to illustrate the dependence of the response on the significant factors. The model is
expressed below as:
(5.4)
Where R is the aluminium extraction, XB and XC are predictor variables which take the value of -
1 or +1 (low or high) according to the columns of signs in the design matrix in Table 5.2 for
factors B (time) and C (temperature) respectively.
In equation 5.4, the positive signs in the prediction model indicate that in order to maximize the
acid leaching of CFA, these factors must be kept at high levels.
The aluminium extraction results for centre points for the full factorial design (24) are presented
in Table 5.3.
Page 85
Extraction of Aluminium from CFA Alan Shemi
Page 73
Table 5.3 Aluminium extraction results for center point replicates for
the 24 full factorial design
The actual factor levels coded as values of (0) in the table are centre point values and are as follows:
A (Acid concentration): 6M (0); B (Leaching time): 8hrs (0); C (Leaching temp): 60oC (0);
D (Solid: Liquid ratio): 1:4(0)
The observed aluminium extractions at the six centre points were: 14.0%, 15.3%, 14.3%, 15.1%,
13.8% and 14.9%. The average of these points is 14.6%. The average of the 16 factorial points of
the 24 factorial design in Table 5.2 is 14.7%. Since the two averages are very similar (difference
of 0.1%), it is clear that the planar model is adequate. In other words, curvature is absent. The
absence of cross products (significant interaction effects) in the fitted model, in Equation 5.4,
further suggests the absence of curvature.
Run
Control Factors
% Al
Extraction
(average)
A B C D
1 0 0 0 0 14.0
2 0 0 0 0 15.3
3 0 0 0 0 14.3
4 0 0 0 0 15.1
5 0 0 0 0 13.8
6 0 0 0 0 14.9
Page 86
Extraction of Aluminium from CFA Alan Shemi
Page 74
Figure 5.3 Normal plot of residuals
Figure 5.3 is a normal plot of residuals. As illustrated in the figure, all residues lie close to the
straight line with a linear correlation coefficient of 94.86%, which shows that the residuals were
distributed normally.
A plot of residuals versus predicted extraction (fitted model values) is a test of the assumption
that the variations are the same in each group (Figure 5.4). This implies that the random errors
are distributed with mean zero and constant variance (Simate and Ndlovu, 2008). All residuals
were distributed between -2 and +1.5 without any systematic structure. Since the residuals were
distributed normally with constant variance, mean zero and independently as illustrated in
Figure 5.3 and Figure 5.4, it can be concluded that Equation 5.4 fitted the experimental data
well.
R² = 0.9486
0
20
40
60
80
100
120
-1 -0.5 0 0.5 1 1.5
No
rma
l %
pro
ba
bil
ity
Studentised residuals
Page 87
Extraction of Aluminium from CFA Alan Shemi
Page 75
Figure 5.4 Plot of residuals versus predicted extractions
5.3.2 Influence of factors on extraction
It is standard procedure that the main effect of a variable should be individually interpreted only
if there‟s no evidence that the variable interacts with other variables. When there‟s evidence of
one or more such interaction effects, the interacting variables should be considered jointly (Box
et al., 1978). In this study the interaction amongst variables was found to be insignificant. The
variables were therefore interpreted individually.
Effect of acid concentration
The effect of acid concentration on aluminium extraction is presented in Figure 5.5. The figure
shows aluminium extraction from CFA at 4M and 8M which are low and high acid concentration
levels respectively. Higher aluminium extraction was obtained at lower acid concentration
whereas higher acid concentration gave low extraction. As previously mentioned in Chapter 4,
this may be attributed to more calcium sulphate precipitate formation at higher acid
concentrations due to increased sulphate ions. The precipitate forms around and in the pores of
the ash particle thus causing resistance to mass transfer of reactants and products (Seidel et al.,
1998) hence inhibiting aluminium extraction.
-2
-1.5
-1
-0.5
0
0.5
1
1.5
2
0.0 5.0 10.0 15.0 20.0
Stu
den
tise
d r
esi
du
als
Predicted extractions (%)
Page 88
Extraction of Aluminium from CFA Alan Shemi
Page 76
Figure 5.5 Effect of acid concentration on acid leaching of CFA
Effect of leaching time
The effect of leaching time on aluminium extraction is shown in Figure 5.6. The figure
illustrates extractions from CFA for 6hrs and 10hrs of leaching time. Higher aluminium
extraction was achieved with longer leaching time. The increased extraction with longer leaching
time signifies the fact that adequate leaching time is necessary to overcome resistance to mass
transfer of reactants and products caused by precipitate formations such as calcium sulphate. A
similar phenomenon was also observed by Seidel and co-workers (1998) when they compared
the leachability of conditioned and unconditioned CFA. The conditioned CFA was leached with
hydrochloric acid to remove calcium sulphate prior to leaching with sulphuric acid. Their results
showed that, for the same maximum aluminium extraction, the conditioned CFA leached within
a shorter period of time compared to the unconditioned one. This led them to conclude that
calcium sulphate precipitates slow down the aluminium leaching rate in CFA and hence the
reason why longer leaching times yield higher extractions.
14.2
14.3
14.4
14.5
14.6
14.7
14.8
14.9
15.0
4 8
% a
lum
iniu
m
extr
act
ion
Acid concentration (M)
Page 89
Extraction of Aluminium from CFA Alan Shemi
Page 77
Figure 5.6 Effect of leaching time on acid leaching of CFA
Effect of temperature
The effect of leaching temperature on aluminium extraction is presented in Figure 5.7. The
figure shows aluminium extraction from CFA at leaching temperatures of 45oC and 75
oC. Higher
aluminium extraction was obtained at higher temperature. This is because molecules at higher
temperature have more thermal energy required for effective reaction. Although collision
frequency is greater at higher temperatures, this alone contributes only a very small proportion to
the increase in the rate of reaction. Much more important is the fact that, at higher temperature,
the proportion of reactant molecules with sufficient energy to react is significantly higher. In this
case, however, higher extractions at higher temperature could be explained with reference to
activation energy experimental results obtained in section 4.2.7. The calculated activation
energies were found to be 18.3kJmol-1
for the lower temperature range (50°C - 70°C) and
7.7kJmol-1
for the higher temperature range (70°C - 82°C). The lower activation energy at higher
temperatures is an indication of increase in reaction rate with increase in temperature.
12.5
13.0
13.5
14.0
14.5
15.0
15.5
16.0
6 10
% a
lum
iniu
m
extr
act
ion
Leaching time (hrs)
Page 90
Extraction of Aluminium from CFA Alan Shemi
Page 78
Figure 5.7 Effect of temperature on acid leaching of CFA
Effect of solid to liquid ratio
The effect of solid to liquid ratio on aluminium extraction is presented in Figure 5.8. The figure
shows aluminium extraction from CFA at solid to liquid ratios of 1:3 and 1:5 which are high and
low solid levels respectively. Higher aluminium extraction was attained at the higher solid to
liquid ratio of 1:3 than at the lower solid to liquid ratio of 1:5. The higher aluminium extraction
at the higher solid to liquid ratio may be ascribed to a possible attrition effect among ash
particles at the higher slurry mixture density, preventing calcium sulphate precipitate layer build
up, hence allowing high mass transfer rates of reactants and products. It must be noted, however,
that further increase in solid to liquid ratio beyond 1:3 may result in lower aluminium extraction
due to increased density of the mixture, poor suspension of solids and low mass transfer of
reactants and products.
Lower aluminium extraction at the lower solid to liquid ratio may be attributed to increased
sulphate ions due to increased acid volume hence promoting more formation of calcium sulphate
precipitates. The precipitates obstruct mass transfer across the fly ash particle thus obstructing
alumina dissolution and consequently causing lower aluminium extraction.
0.0
2.0
4.0
6.0
8.0
10.0
12.0
14.0
16.0
18.0
45 75
% a
lum
iniu
m
extr
act
ion
Leaching temperature (oC)
Page 91
Extraction of Aluminium from CFA Alan Shemi
Page 79
Figure 5.8 Effect of solid to liquid ratio on acid leaching of CFA
Factor interaction
Factor interaction among the various variables, in the ranges studied, was found to be
insignificant. All the interaction effects were normally distributed about the zero mean and fitted
reasonably well on a straight line as illustrated in Figure 5.2.
5.4 Summary and Conclusions
In this chapter, the main objective was to identify significant factors that influence the
aluminium extraction process. To achieve this, screening experiments were used to obtain
experimental data using a two-level full factorial design. In order to determine the significance of
each factor, the experimental data was statistically analysed using the normal probability plots
and the Pareto chart. The factors investigated included acid concentration, leaching time, solid to
liquid ratio and temperature. All experiments were run at a constant agitation rate of 150 rpm.
The experimental results obtained in this chapter served as an input to the optimization study
presented in the next chapter (Chapter 6).
13.8
14.0
14.2
14.4
14.6
14.8
15.0
15.2
1:3 1:5
% a
lum
iniu
m
extr
act
ion
Solid:Liquid ratio
Page 92
Extraction of Aluminium from CFA Alan Shemi
Page 80
From the analysis of the experimental data, temperature and leaching time were found to be
statistically significant factors while acid concentration and solid to liquid ratio were statistically
insignificant. This means that temperature and leaching time have a significant influence on
alumina dissolution in CFA.
A comparison of the two significant factors, temperature and leaching time, shows that
temperature was more significant than leaching time in influencing aluminium extraction. This
indicates that aluminium dissolution in CFA is a temperature driven process.
A further analysis of the experimental data also showed that interaction among factors was
statistically insignificant. This implies that the effect that each factor has on the aluminium
extraction process is not significantly altered due to the presence of the other factors.
The next chapter focuses on the optimization of the two variables that have been identified, in
this chapter, as significant factors, namely, temperature and leaching time.
Page 93
Extraction of Aluminium from CFA Alan Shemi
Page 81
CHAPTER SIX
OPTIMIZATION OF SIGNIFICANT FACTORS
6.1 Introduction
While designing systems and products requires a deep understanding of influences that achieve a
desirable performance, the need for an efficient and systematic decision-making approach drives
the need for optimization strategies (Biegler, 2010).
Optimization may be defined as finding an alternative with the most cost effective or highest
achievable performance under the given constraints, by maximizing desired factors and
minimizing undesired ones. The main objective in process optimization is maximization of yield,
minimization of variability and overall process improvement.
Fundamentally, there are three aspects of optimization; the first termed operating-procedure-
optimization, is concerned with instructions detailing relevant steps to accomplishing tasks or
activities of a process in the best way possible. Cited by Simate and co-workers (2009), Edgar
and Himmelblau (1988) term the second type of optimization as topological and the third type as
parametric or control optimization. Topological optimization is concerned with using equipment
to its fullest advantage whereas parametric optimization is concerned with operating variables
such as temperature, pressure, pH, solid to liquid ratio and agitation rate for a given process.
For any given scope of optimization problem for a system or process such as a metallurgical or
chemical process, the task is to find the best solution for this process within constraints. This task
requires the following elements (Biegler, 2010):
An objective function that provides a scalar quantitative performance measure that needs to
be minimized or maximized. This can be a system‟s cost, yield or profit.
A predictive model that describes the behaviour of the system. For the optimization problem
this translates into a set of equations and inequalities termed constraints. These constraints
comprise a feasible region that defines limits of performance for the system.
Page 94
Extraction of Aluminium from CFA Alan Shemi
Page 82
Variables that appear in the predictive model. These variables must be adjusted to satisfy the
constraints. This can usually be accomplished with multiple instances of variable values
leading to a feasible region that is determined by a subspace of these variables.
In this study, parametric optimization was deemed fit using a statistically-based optimization
approach called response surface methodology (RSM) to determine the optimum conditions of
temperature and time for the acid leaching of CFA. RSM is a famous technique used to find
optimal conditions by using a quadratic polynomial regression model and is applied after
diagnostic or screening experiments (Box et al., 1978).
The data for fitting the second order response was collected by using the central composite
rotatable design (CCRD). A CCRD consists of 2k factorial points, coded±1, augmented by 2k
axial points, coded ±α (Table 6.1) and nc replicate points at the centre {(0,0,0…..,0)}, where k is
the number of factors studied, α is the distance of an axial point from the centre (Khuri and
Cornell, 1987). This augmentation of the full factorial design with axial points and centre runs
makes the CCRD complete with five factor levels (-α, -1, 0, +1, +α).
Table 6.1 Axial points (Khuri and Cornell, 1987)
To ensure a constant variance of the predicted response at all points equidistant from the design
centre, the number of centre point replications, nc, for the two factors studied was calculated
using the following equation (Khuri and Cornell, 1987).
nc ~ 0.8385 (2k/2
+ 2)2 – 2
k-2k (6.1)
1 2 …k
-α 0 0
+α 0 0
0 -α 0
0 +α 0
0 0 -α
0 0 +α
Page 95
Extraction of Aluminium from CFA Alan Shemi
Page 83
Where nc is the number of centre point replications and k is the number of factors studied.
For k = 2, nc = 5
The experimental results were analyzed statistically by using the analysis of variance (ANOVA).
6.2 Experimental Design for the Response Surface Methodology and CCRD
In previous experiments (Chapter 5) it was identified that temperature and leaching time were
statistically significant operating parameters, while acid concentration and solid to liquid ratio
were not statistically significant in the aluminium extraction process. Interaction parameters were
also found to be statistically insignificant. Results from follow up experiments using the steepest
ascent method further showed an aluminium extraction of 23.5% at 6M acid concentration, 1:4
solid to liquid ratio, at 75°C temperature after 8.75hrs of leaching time.
Response surface methodology and central composite rotatable design (CCRD) have been used
in this study in an attempt to determine the optimal conditions of temperature and leaching time
for the acid leaching of CFA. Factors were studied with their codified values (-α, -1, 0, +1, +α).
Table 6.2 shows a relationship between the coded values and actual values for the five levels of
each factor.
Table 6.2 Relationship between coded and actual values of the variable (Napier-Munn,
2000)
ξmin and ξmax are the minimum and maximum values of the natural variables respectively,
λ = 2(k-q)1/4
Code Actual value of a factor
- λ
-1
0
+1
+ λ
ξmin
(ξmax + ξmin)/2 - (ξmax – ξmin)/2λ
(ξmax + ξmin)/2
(ξmax + ξmin)/2 + (ξmax – ξmin)/2λ
ξmax
Page 96
Extraction of Aluminium from CFA Alan Shemi
Page 84
Where,
λ is the distance of an axial point from the centre
k is the number of factors studied, for this study k = 2 (temperature and time)
q is a fraction of number of factors. For a full factorial design, q = 0
∴ λ = 1.414
The five levels of each factor shown in actual and coded values calculated using the relationships
in Table 6.2 are shown in Table 6.3.
Table 6.3 Experimental layout and runs for the
two factor central composite rotatable design
In Table 6.3, the experimental lay out and standard runs for the central composite rotatable
design is outlined. Five centre points were worked out from Equation 6.1.
For the two variables under consideration, a second order polynomial regression model was
proposed as follows (Simate et al., 2009; Tripathy and Murthy, 2012):
Factor Levels
Standard
Run
Coded Actual
A
(Temp)
B
(Time)
A
Temp( o
C)
B
Time(hrs)
-1 -1 70 7.75 1
+1 -1 80 7.75 2
-1 +1 70 9.75 3
+1 +1 80 9.75 4
-1.414 0 68 8.75 5
+1.414 0 82 8.75 6
0 -1.414 75 7.34 7
0 +1.414 75 10.16 8
0 0 75 8.75 9
0 0 75 8.75 10
0 0 75 8.75 11
0 0 75 8.75 12
0 0 75 8.75 13
)2.6.........(........................................2
1
2
1
22
1
2
1
ji
ij
ij
i
i
i i
iiiio xxxxy
Page 97
Extraction of Aluminium from CFA Alan Shemi
Page 85
Where,
y is the predicted response, βo is the coefficient for intercept, βi is the coefficient of linear effect,
βii is the coefficient of quadratic effect, βij is the coefficient of interaction effect, ε is a term that
represents other sources of variability not accounted for by the response function, xi and xj are
predictor variables for independent factors.
The experimental procedure was as previously described in section 3.2.5.
6.3 Results and Discussion
6.3.1 Derivation of the model
The experimental results for the aluminium extraction are presented in Table 6.4. The
coefficients of the regression model were estimated by fitting the experimental (observed) values
using Design Expert® 6 software.
Table 6.4 Observed values for the aluminium extraction
Factor Levels
%Al
Extraction
[Observed]
Standard
Run
Coded Actual
A
(Temp)
B
(Time)
A
Temp( o
C)
B
Time(hrs)
-1 -1 70 7.75 20.2 1
+1 -1 80 7.75 22.7 2
-1 +1 70 9.75 20.8 3
+1 +1 80 9.75 23.4 4
-1.414 0 68 8.75 20.3 5
+1.414 0 82 8.75 23.3 6
0 -1.414 75 7.34 21.4 7
0 +1.414 75 10.16 22.1 8
0 0 75 8.75 21.8 9
0 0 75 8.75 21.8 10
0 0 75 8.75 22.1 11
0 0 75 8.75 21.6 12
0 0 75 8.75 21.7 13
Page 98
Extraction of Aluminium from CFA Alan Shemi
Page 86
The fitted second order model was obtained as:
+ (6.3)
Where, x1 = temperature, and x2 = time, within predictor variable limits:
Where xi are coded predictor variables and λ = 2(k-q)1/4
= 1.414 (for k = 2, -q = 0) is the distance
of the axial points from the centre of the CCRD that gives the limits of the valid region under
experimentation.
6.3.2 Checking the Adequacy of the Developed Model
The adequacy of the fitted model was carried out using the analysis of variance (ANOVA) given
in Table 6.5.
Table 6.5 ANOVA for the fitted model
Source Terms Sum of
Squares
Degrees of
Freedom
Mean
Square
F-Value Prob>F
Model 11.570 5 2.31 66.43 <0.0001
x1 10.910 1 10.91 313.14 <0.0001
x2 0.660 1 0.66 18.81 0.0034
x12 0.000 1 0.000 0.000 1.000
x22 0.0004 1 0.0004 0.12 0.7343
x1x2 0.0003 1 0.0003 0.072 0.7965
Residual 0.24 7 0.035
Lack of fit 0.10 3 0.035 0.99 0.4826
Pure error 0.14 4 0.035
Total 11.82 12 -
For each source of terms, the probability (Prob>F) is examined to see if it falls below the chosen
statistical significance level. For a statistical significance with a confidence level limit of 95%,
2,1;ixi
Page 99
Extraction of Aluminium from CFA Alan Shemi
Page 87
the probability (Prob>F) is examined against a factor of 0.05 (5%). A probability (Prob>F) value
which is less than 0.05 shows significance.
A close examination of the ANOVA table shows that the regression model has a value of
<0.0001. Since this value is less than 0.05, the model is therefore significant. Both the quadratic
terms (x12 and x2
2), and the interactive term (x1x2) are insignificant since they have values greater
than 0.05. Furthermore, the model does not show significant lack of fit. To obtain a simple and
yet realistic model, the fitted model was re-fitted using only the variable terms that are
significant at greater or equal to 95% confidence level and eliminating all insignificant terms.
The re-fitted model is:
(6.4)
The lack of fit for the re-fitted model was examined using the probability (Prob>F) value for lack
of fit given as 0.7693. This is greater than 0.05, implying that the model does not present any
evidence of lack of fit. The significance of the re-fitted regression model was examined using the
probability (Prob>F) value for regression model significance. The obtained value of <0.0001 is
less than 0.05, implying that the regression model is significant at a confidence level limit of
95%. The ANOVA for the re-fitted model is given in Table 6.6.
Table 6.6 ANOVA for the re-fitted model
Source Terms Sum of
Squares
Degrees of
Freedom
Mean
Square
F-Value Prob>F
Model 11.570 2 5.78 230.56 <0.0001
x1 10.910 1 10.91 434.99 <0.0001
x2 0.660 1 0.66 26.13 0.0005
Residual 0.24 10 0.025
Lack of fit 0.11 6 0.018 0.53 0.7693
Pure error 0.14 4 0.035
Total 11.82 12 -
Page 100
Extraction of Aluminium from CFA Alan Shemi
Page 88
The mean summary statistics are presented in Table 6.7. The standard deviation value of 0.16
was flagged as low by the Design Expert® 6 program and the R-squared value of 97.9% as high.
An exhibition of low standard deviation and high R-squared values is an indicator of a well-
fitting model. Based on this, the model was found to be statistically plausible to define the true
behaviour of the experimental system. This means that the aluminium extraction values at any
regime in the interval of the experiment design can be calculated from Equation 6.4.
Table 6.7 Mean Summary Statistics
Source Std. Dev. R-Squared Adjusted
R-Squared
Predicted
R-Squared
Linear 0.16 0.9788 0.9745 0.9655
Experimental results and predicted values obtained using the re-fitted models are given in Table
6.8. The relationship between experimental and predicted aluminium extraction is presented in
Figure 6.1. The figure shows that the predicted values are reasonably comparable to the
experimental values with the linear correlation coefficient (R2) of 0.978. Statistically, this means
that 97.8 % of the sample variation can be explained by the independent variables.
Figure 6.1 Relationship between experimental and predicted aluminium extraction
R² = 0.978
19.5
20
20.5
21
21.5
22
22.5
23
23.5
24
20.0 21.0 22.0 23.0 24.0
% a
lum
iniu
m e
xtr
act
ion
(p
red
icte
d)
% aluminium extraction (observed)
Page 101
Extraction of Aluminium from CFA Alan Shemi
Page 89
Table 6.8 Observed and predicted values for the aluminium extraction
6.3.3 Determination of Optimum Conditions
As earlier stated, the major objective of the study described in this chapter is to determine the
conditions that maximize aluminium extraction from CFA. Consequently, after the model was
checked for adequacy of fit in the region defined by the coordinates of the design and was found
to be adequate, the model can be used to locate the point of maximum response.
For quadratic regression models, the point for which the response is optimized is the point at
which the partial derivatives …. , are all equal to zero. This point is called the
stationary point. The stationary point may be a point of maximum response, minimum response
or a saddle point. These conditions are easy to identify in the case of two factor experiments, by
the inspection of contour plots. When more than two factors exist in an experiment, then the
Factor Levels
Aluminium Extraction
(%)
Standard
Run
Observed
Predicted Coded Actual
A
(Temp)
B
(Time)
A
Temp( o
C)
B
Time(hrs)
-1 -1 70 7.75 20.2 20.3 1
+1 -1 80 7.75 22.7 22.7 2
-1 +1 70 9.75 20.8 20.9 3
+1 +1 80 9.75 23.4 23.2 4
-1.414 0 68 8.75 20.3 20.1 5
+1.414 0 82 8.75 23.3 23.4 6
0 -1.414 75 7.34 21.4 21.4 7
0 +1.414 75 10.16 22.1 22.2 8
0 0 75 8.75 21.8 21.8 9
0 0 75 8.75 21.8 21.8 10
0 0 75 8.75 22.1 21.8 11
0 0 75 8.75 21.6 21.8 12
0 0 75 8.75 21.7 21.8 13
Page 102
Extraction of Aluminium from CFA Alan Shemi
Page 90
general mathematical solution for the location of the stationary point has to be used. However,
since the re-fitted model in Equation 6.4 is linear, the maximum response coincides with the
distance of the axial points from the centre of the CCRD that gives the limits of the valid region
under experimentation. This means that the optimum aluminium extraction values can be
calculated using Equation 6.4.
Using coded values of x1 = 1.414 for optimum temperature and x2 = 1.414 for optimum time in
Equation 6.4,
Predicted aluminium extraction, = 23.9%.
The re-fitted model with actual values is expressed as:
- 8.75) ……………… (6.5)
Using actual values, of Temp = 82°C for optimum temperature and Time = 10.16hrs for
optimum time, in Equation 6.5,
Predicted aluminium extraction, = 23.9%.
6.3.4 Confirmatory Experiments
In order to test the validity of the optimized conditions given by the model, replicated
experiments were carried out with parameters suggested by the model. The conditions used in
the confirmatory experiments were as follows: temperature (82°C) and time (10.2hrs).
The aluminium extraction after leaching at 6M and solid to liquid ratio of 1:4 was found to be
24.8% (Table 6.9), which is consistent with the model. With an error margin of 3.4% between
the predicted value and the confirmatory test value, the model fits the experimental data very
well, and can therefore be considered to be acceptably valid.
Page 103
Extraction of Aluminium from CFA Alan Shemi
Page 91
Table 6.9 Aluminium extraction at optimum conditions
Parameter
Temperature (°C)
Time (hrs)
% Aluminium
extraction
Model
82
10.16
23.9
Confirmatory tests
82
10.16
24.8
6.4 Summary and Conclusions
The necessity to develop and propose an efficient and economically viable process for
recovering alumina from large quantities of unexploited CFA drives the need for optimization
strategies. This entails finding an alternative with the most cost effective or highest achievable
performance under the given constraints, by maximizing desired factors and minimizing
undesired ones.
In this chapter the objective was to optimize the two variables that were identified as significant
factors in Chapter 5, namely, temperature and leaching time. To achieve this, optimization
experiments were designed using the central composite rotatable design (CCRD) and response
surface methodology (RSM) in order to determine the optimal set of the two significant factors.
A second order quadratic regression model for factor optimization was derived using computer
simulation software (Design Expert®
6) by applying least squares method based on the
experimental design. The data for fitting the model was collected by using the central composite
rotatable design (CCRD) and a fitted predictive model was developed as a mathematical
expression of aluminium extraction from CFA. To study the effects of the individual variables as
well as their joint interactive effects on aluminium extraction, a statistical analysis of variance
(ANOVA) tool was used to analyse the experimental data.
Page 104
Extraction of Aluminium from CFA Alan Shemi
Page 92
From the prediction model, an optimal aluminium extraction efficiency of 23.95% was obtained
at optimal values of 82°C temperature and 10.2 hrs leaching time.
A confirmatory test showed an extraction efficiency of 24.8%, giving an error margin of 3.4%,
with a linear correlation coefficient of 97.8%, hence verifying the good fitting of experimental
data and the fitness of the model.
The work undertaken in this chapter is a culmination of the first stage leaching process as well as
a precursor to the second leaching stage. This means that, the residue-CFA produced from the
optimized first leaching stage, becomes the feed material to the second leaching stage.
The next chapter (Chapter 7) looks at the second and final leaching stage for the extraction of
aluminium from residue-CFA.
Page 105
Extraction of Aluminium from CFA Alan Shemi
Page 93
CHAPTER SEVEN
POST-SINTER (SECOND STAGE) LEACHING
7.1 Introduction
The possibility of using an indirect acid leach process based on a post-sinter (two-step acid
leach) method has been discussed in section 2.4.3. The process makes use of the difference in the
response characteristics of the two alumina phases found in CFA. The two alumina phases,
amorphous and mullite play a major role in alumina dissolution kinetics. The amorphous phase is
amenable to inorganic acids such as sulphuric acid whereas the mullite phase is insoluble due to
its refractory nature. For this reason, the mullite phase is unable to participate in the pre-sinter
(first stage) direct acid leaching process. The mullite phase requires phase transformation to
make it leachable.
In the pre-sinter (first stage) leaching, CFA is directly contacted with sulphuric acid. Direct acid
leaching of CFA using an inorganic acid such as sulphuric acid is achieved by proton attack. The
hydronium ion displaces the metal cation from the ash particle matrix, thus inducing the
dissolution of metals according to the following reaction:
CaO + Al2O3(s) + 8H+
(aq) + SO42-
(aq) → 2Al3+
(aq) + CaSO4(s) + 4H2O (l) (7.1)
The resultant aluminium sulphate leach liquor is separated and the non-acid soluble phases of the
ash, such as mullite, and calcium sulphate precipitate are retained as residue-CFA. The residue is
used as feed for further alumina extraction in the post-sinter (second stage) leaching.
The residue-CFA is first sintered before post-sinter (second stage) leaching in order to transform
the mullite in the residue into a phase that is acid-leachable. The leaching of sintered residue-
CFA using sulphuric acid is also achieved by proton attack. The following is the possible
reaction (based on the mineralogical phase transformations after post sinter-leaching, Table 7.2):
CaO∙Al2O3∙2SiO2(s) + 8H+
(aq) + SO42-
(aq) → 2Al3+
(aq) + CaSO4(s) + 2SiO2(s) + 4H2O(l) (7.2)
Page 106
Extraction of Aluminium from CFA Alan Shemi
Page 94
The non-acid soluble phases from the post-sinter leaching are retained as post-sinter leaching
residue and could be considered as a co-product in this process and could possibly be suitable for
use as a lightweight aggregate in masonry concrete applications or cement production (Matjie et
al., 2005). The resultant aluminium sulphate leach liquor is combined with the pre-sinter (first
stage) leach liquor and separated for purification and recovery of alumina by processes such as
solvent extraction, precipitation, crystallization and calcination.
The aim of the work contained in this chapter was to:
Extract aluminium contained in residue-CFA from the pre-sinter (first stage) leaching.
Investigate the response of the mullite phase to the sintering process.
Investigate the response of pre-sinter phases to post-sinter (second stage) leaching.
Determine the extent of aluminium extraction from the sinter product.
In order to achieve the above objectives, experiments were conducted according to the procedure
previously described in sections 3.2.6 to 3.2.8.
In addition, the study investigated the leachability of sintered residue-CFA and sintered raw-
CFA under the same leaching conditions in order to compare the aluminium extraction results of
the two-step acid leach method to the current lime-sinter process.
The study also investigated the effect of recycling leach liquor from the pre-sinter (first stage)
leaching process on the post-sinter leaching of sintered residue-CFA. This was done in order to
establish whether it would be possible to use the recycled leach liquor (filtered leach solution)
from the first leaching stage during the second leaching step. Recycling the leach liquor has the
advantage of using less fresh sulphuric acid thus minimizing reagent consumption.
Optimized leaching conditions were used in all experiments.
Page 107
Extraction of Aluminium from CFA Alan Shemi
Page 95
7.2 Results and Discussion
7.2.1 Effect of Sintering
The effect of the sintering process on residue-CFA is presented in Table7.1. The table illustrates
changes in the phase mineralogy of residue-CFA before and after sintering.
Table 7.1 Phase mineralogy of residue-CFA before and after sintering
CFA
Phase
Raw-CFA
(Unprocessed)
(wt %)
Residue-CFA
After 1st Stage Leaching
(Before Sintering)
(wt %)
Residue-CFA
(After Sintering)
(wt %)
Amorphous
52.9
45.79
23.03
Hematite
(Fe2O3)
0.8
-
-
Magnetite
(Fe3O4)
1.65
-
-
Mullite
(3Al2O3·2SiO2)
30.68
32.53
8.02
Quartz
(SiO2)
13.97
14.31
6.60
Cristobalite
(SiO2)
-
-
8.07
Anhydrite
(CaSO4)
-
2.21
0.22
Gypsum
(CaSO4·2H2O)
-
5.17
-
Plagioclase
(CaO·Al2O3·2SiO2)
-
-
54.07
Page 108
Extraction of Aluminium from CFA Alan Shemi
Page 96
The presence of plagioclase, a calcium aluminosilicate solid solution, after the sintering process,
indicates a possible reaction that may have occurred between mullite and calcium oxide. This
may have effected mullite phase transformation according to the following possible reactions:
CaCO3 → CaO + CO2 (7.3)
3Al2O3∙2SiO2 + 3CaO + 4SiO2 → 3(CaO∙Al2O3∙2SiO2) (7.4)
The transformation of the mullite phase to the plagioclase phase is not only vital to the
subsequent post-sinter (second stage) leaching process but also an indication of the positive
mullite response to the sintering process.
The results in Table 7.1 show the presence of cristobalite after the sintering process. This
indicates that the high sintering temperatures, typically, 1150°C, may have favoured the
formation of the cristobalite, a high temperature polymorph of silica, which has a different
crystal structure but the same chemical formula, SiO2.
Table 7.1 also shows the absence of hydrous calcium sulphate (gypsum) after sintering. The
absence of this substance indicates that it may have decomposed to the anhydrous form at high
sintering temperatures. Following the decomposition, the anhydrous calcium sulphate may have
undergone thermal decomposition under furnace oxidizing conditions to form calcium oxide
according to the following possible reactions (Kuusik, 1985):
C + 1/2O2 → CO (7.5)
CaSO4 + CO → CaO + SO2 + CO2 (7.6)
The calcium oxide formed in Equation 7.6 may have reacted with mullite (3Al2O3∙2SiO2) to
form plagioclase (CaO·Al2O3·2SiO2) according to Equation 7.4.
7.2.2 Effect of Post-sinter (Second Stage) Leaching
The effect of leaching on post-sinter CFA material was analysed by examining the mineralogy
changes and extraction profile.
Page 109
Extraction of Aluminium from CFA Alan Shemi
Page 97
Post-sinter leaching mineralogy changes
The effect of the post-sinter (second stage) leaching process on sintered residue-CFA is
presented in Table 7.2. The table shows changes in the phase mineralogy of sintered residue-
CFA before and after the leaching process.
The mullite and quartz contents after the second leaching stage remained unchanged because of
their high insolubility in inorganic acids under these leaching conditions (Matjie et al., 2005;
Nayak and Chitta, 2009; Shcherban et al., 1995; Phillips and Wills, 1982).
Table 7.2 Phase mineralogy of sintered residue-CFA before and after post-sinter leaching
CFA
Phase
Raw
CFA
(Unprocessed)
(wt %)
Sintered Residue-CFA
Before Post-sinter
Leaching
(wt %)
Sintered Residue-CFA
After Post-sinter
Leaching
(wt %)
Amorphous
52.9
23.03
52.9
Hematite
(Fe2O3)
0.8
-
-
Magnetite
(Fe3O4)
1.65
-
-
Mullite
(3Al2O3·2SiO2)
30.68
8.02
8.98
Quartz
(SiO2)
13.97
6.60
7.09
Cristobalite
(SiO2)
-
8.07
4.68
Anhydrite
(CaSO4)
-
0.22
23.18
Gypsum
(CaSO4·2H2O)
-
-
2.89
Plagioclase
(CaO·Al2O3·2SiO2)
-
54.07
-
Calcite
(CaCO3)
-
-
0.26
Page 110
Extraction of Aluminium from CFA Alan Shemi
Page 98
The re-appearance of the hydrated calcium sulphate (gypsum) after post-sinter (second stage)
leaching may have resulted from the formation and hydration of calcium sulphate arising from
the dissolution of the calcium aluminosulphate phase.
The complete dissolution and disappearance of the plagioclase phase (CaO·Al2O3·2SiO2) after
post-sinter (second stage) leaching, may be attributed to the good solubilization of this phase in
sulphuric acid solution. This clearly demonstrates that the formation and presence of plagioclase
is a key driving factor in the post-sinter aluminium extraction process.
The increase in amorphous phase after post-sinter leaching may have come from the reactions of
the amorphous and plagioclase phases with sulphuric acid.
The presence of small amounts of calcite may have arisen from traces of unreacted calcium
carbonate from the pelletization step.
Extraction profile
The post-sinter (second stage) aluminium extraction profile is presented in Figure 7.1. The
figure shows an increase in aluminium extraction with increase in leaching time. An extraction
of 71.0% was obtained after 5 minutes; 82.0% after 15 minutes; 84.3% after 30 minutes and
84.1% after 45 minutes. Leaching beyond 30 minutes did not result in any increment in
aluminium extraction. Analysis of the graph shows that alumina dissolution in sintered residue-
CFA is a relatively rapid process. The rapid alumina dissolution is indicative of a high rate of
reaction possibly due to the low activation energy that must be overcome between reactants and
products as well as low energy bonds in the calcium aluminosilicate structure
(CaO·Al2O3·2SiO2).
Page 111
Extraction of Aluminium from CFA Alan Shemi
Page 99
Figure 7.1 Aluminium extraction from sintered residue-CFA in post-sinter leaching
Table 7.3 shows experimental results from the leaching of sintered residue-CFA and sintered
raw-CFA with fresh H2SO4 and leaching of sintered residue-CFA with recycled leach liquor
from pre-sinter leaching. The table shows 84.3% and 85.2% aluminium extraction efficiencies
obtained from the leaching of sintered residue-CFA and sintered raw-CFA respectively. The
leaching of sintered residue-CFA with recycled leach liquor yielded an aluminium extraction
efficiency of 3.5%.
Table 7.3 Aluminium extraction results from clinker-leaching experiments
0
10
20
30
40
50
60
70
80
90
0 10 20 30 40 50
% a
lum
iniu
m e
xtr
act
ion
Leaching time (minutes) at 82
C, temp; 6M acid conc.; 1:4 solid to liquid ratio
Lixiviant
Material
Leaching Process
Al extraction
(%)
A
Fresh H2SO4
(6M)
Residue-CFA (Clinker)
Sintered at 1150°C
Post-sinter leaching using fresh
H2SO4
84.3
B
Fresh H2SO4
(6M)
Raw-CFA (Clinker)
Sintered at 1150°C
Post-sinter leaching using fresh
H2SO4
85.2
C
Recycled
leach liquor
Residue-CFA (Clinker)
Sintered at 1150°C
Post-sinter leaching using
recycled leach liquor from
pre-sinter leaching
3.5
Page 112
Extraction of Aluminium from CFA Alan Shemi
Page 100
The 85.2% extraction obtained from the leaching of sintered raw-CFA is in agreement with
extractions obtained in previous works such as the lime-sinter process conducted by Matjie and
co-workers (2005) in which they achieved an aluminium extraction efficiency of 85.0%.
The 84.3% extraction achieved from the leaching of sintered residue-CFA compared well with
that of the sintered raw-CFA despite the sintered residue-CFA being less alumina-loaded
compared to the sintered raw-CFA. This indicates possibility of higher aluminium extractions
from sintered residue-CFA if sintering reaction conditions are probably varied in favour of more
mullite to plagioclase transformation.
The 3.5% aluminium extraction obtained from the leaching of sintered residue-CFA with
recycled leach liquor shows that the leach liquor was not effective in leaching. It can be seen that
leaching with fresh sulphuric acid compared with the recycled leach liquor from the first leach
stage has a distinct advantage. This shows that recycled leach liquor has no advantage over fresh
sulphuric acid solution.
7.2.3 The Pre-sinter and Post-sinter Combined Aluminium Extraction
The combined aluminium extraction from the pre-sinter and post-sinter leaching processes was
found to be 88.2% (calculations are shown in Appendix A). Table 7.4 illustrates a metallurgical
accounting for the aluminium extraction process. Calculations are based on a CFA sample
weight of 100g.
Page 113
Extraction of Aluminium from CFA Alan Shemi
Page 101
Table 7.4 Overall aluminium extraction from 100g of CFA containing 30.52% Al2O3
CFA Phase
Al2O3
(wt %)
Al
(g)
Extraction
Pre-sinter
(g)
Post-sinter
(g)
Total (%)
Amorphous
Hematite(Fe2O3)
Magnetite(Fe3O4)
Mullite(3Al2O3·2SiO2)
Quartz(SiO2)
27.8
-
-
72.2
-
4.49
-
-
11.67
-
4.01
-
-
-
-
-
-
-
10.24
-
88.2
Unextracted
16.16
12.15
1.91
Table 7.4 shows a total aluminium input of 16.16g from 100g of CFA, a pre-sinter extraction of
4.01g, a post-sinter extraction of 10.24g and a discard of 1.91g in post-sinter residue.
The 4.01g pre-sinter extraction is equivalent to 24.8% pre-sinter aluminium extraction from
16.16g of aluminium in CFA. The 24.8% extraction represents 89.3% aluminium extraction from
the amorphous phase.
The 10.24g post-sinter extraction is equivalent to 84.3% post-sinter aluminium extraction from
12.15g of aluminium in sintered residue-CFA. The combined extraction of 4.01g from the pre-
sinter and 10.24g from the post-sinter leaching processes gave a total of 14.25g of aluminium
representing an overall aluminium extraction of 88.2%.
The 88.2% aluminium extraction achieved from the two-step acid leach process was higher than
the 85.2% extraction obtained from the conventional lime-sinter method. The high extraction
was attributed to the two-step acid leach design. Pre-sinter leaching alters the CFA surface
morphology, phase mineralogy and chemical composition. The leaching eliminates most of the
amorphous phase that surrounds the insoluble crystals of mullite. Hence by dissolution of the
Page 114
Extraction of Aluminium from CFA Alan Shemi
Page 102
amorphous phase, high surface area crystalline phases are exposed (Nayak and Panda, 2010)
leading to optimized reaction and transformation of the mullite phase during sintering.
Sinter performance
The performance of a sintering process can be seen through the results obtained from post-sinter
leaching. This is because sintering conditions have an effect on the leachability of the sinter
product. It follows, therefore, that post-sinter extraction is an indicator of sinter performance
which may be used to compare two sintering processes such as the two-step acid leach method
and the lime-sinter process. However, it must be stated here that in the two-step acid leach
process, feedstock to the sinter process is pre-leached CFA after 89.3% extraction of aluminium
from the amorphous phase (section 7.2.3) whereas in the lime-sinter process, the sinter feed is
raw „unprocessed‟ CFA. Further, it must also be mentioned that the main objective of sintering is
to transform mullite. Therefore, for uniform comparison, sinter performance calculations were
based on the mullite phase.
Using Tables 7.3 and 7.4, post-sinter extractions from sintered residue-CFA and sintered raw-
CFA were calculated and compared (calculations are shown in Appendix A). The post-sinter
aluminium extraction was calculated as a percentage of the aluminium in the liquid phase to the
aluminium in the sintered CFA material. The sintered residue-CFA representing the two-step
acid leach method yielded a sinter performance of 83.6% whereas the sintered raw-CFA
representing the lime-sinter process was 79.5%.
The higher sinter performance by the two-step acid leach method could be attributed to more
mullite transformation to plagioclase compared to the lime-sinter process. The higher mullite
transformation may have been due to the better mullite crystalline surface exposure after the
dissolution of the amorphous phase during pre-sinter leaching.
Page 115
Extraction of Aluminium from CFA Alan Shemi
Page 103
7.3 Summary and Conclusions
The overall purpose of employing the post-sinter (second stage) leaching step was to extract the
alumina from the residue-CFA mullite phase. The results obtained revealed the following:
Sintering of residue-CFA successfully transformed most of the mullite phase into a leachable
plagioclase phase all of which underwent dissolution during second stage leaching. This
shows that the sintering of residue-CFA is vital to mullite transformation and subsequent
alumina extraction.
An aluminium extraction of 3.5% was obtained from the leaching of sintered residue-CFA
with recycled leach liquor. The low extraction was attributed to acid weakness.
Pre-sinter leaching alters the CFA surface morphology, phase mineralogy and chemical
composition. The leaching eliminates most of the amorphous phase that surrounds the
insoluble crystals of mullite. Hence, by dissolution of the amorphous phase, high surface area
crystalline mullite phases are exposed.
Pre-sinter leaching reactions produce calcium sulphate (CaSO4) as a by-product which can be
utilized as part of the pellet mixture for sintering. Calcium sulphate acts as a sinter
temperature modifier and also forms easily leachable alumina phases such as calcium
aluminosulphate (4CaO∙3Al2O3∙SO4) hence saving on energy as well as optimizing alumina
extraction in post-sinter leaching. Alternatively, under furnace oxidizing conditions, CaSO4
may undergo thermal decomposition to form calcium oxide which then reacts with the
mullite phase to form plagioclase.
In the pre-sinter and post-sinter (two-step acid leach) method, feedstock to the sinter process
is pre-leached CFA whereas in the lime-sinter process, the sinter feed is raw CFA. These two
types of sinter feed respond differently to the sinter process and post-sinter leaching. The
sinter performance from the two-step acid leaching method was 83.6% compared to 79.5%
for the lime-sinter process. The higher sinter performance by the two-step acid leach method
is an indication of better mullite response to the sinter process.
Page 116
Extraction of Aluminium from CFA Alan Shemi
Page 104
Due to the co-leaching of several metal oxide species such as Fe, Ti, K, Na and Mg, pre-
sinter leaching has the potential to reduce CFA residue weight resulting in reduced load on
downstream processes such as the sinter process thus saving on energy.
The pre-sinter and post-sinter (two-step acid leach) method is able to extract up to a total of
88.2% aluminium at 82°C, 6M acid concentration and 1:4 solid to liquid ratio whereas the
lime-sinter process can extract up to 85.2% under the same leaching conditions. The overall
extraction of the two-step process is therefore higher than that of a one-step process where
the CFA is pre-treated by sintering. This illustrates that not only will it be possible to save
energy using a two-step leach process, but the extraction can also be improved upon.
The post-sinter leaching for the two-step acid leach method was found to be relatively rapid,
lasting about 30 minutes to completion compared to 4-12hrs required for the lime–sinter
process. The rapid alumina dissolution was indicative of a high rate of reaction possibly due
to the low activation energy required and little resistance to the mass transfer of reactants and
products.
Despite the high silica content in CFA, typically 46-60 wt%, filtration was conducted under
atmospheric conditions with no requirement for a suction pump or dilution of the slurry.
Leachate viscosity was normal and caused no filtration problems in all experiments.
The sintered residue-CFA pellets required little crushing effort. The pellets were crushed to
course powder (100% passing 212µm).
The next chapter (Chapter 8) draws conclusions and recommendations from the overall work in
previous chapters.
Page 117
Extraction of Aluminium from CFA Alan Shemi
Page 105
CHAPTER EIGHT
CONCLUSIONS AND RECOMMENDATIONS
8.1 Conclusions
8.1.1 Introduction
Based on its amphoteric properties, alumina is capable of dissolution in either acidic or alkaline
media and therefore amenable to hydrometallurgical methods of extraction. Minerals acids are
able to leach metallic species from CFA which is predominantly made up of metallic oxides. The
main objective of this work was to extend this concept in order to investigate the possibility of
using sulphuric acid in the acid leaching of CFA. CFA contains significant amounts of alumina
(Al2O3), but it is incapable of fully responding to mineral (inorganic) acids because the alumina
in the ash is in two dissimilar phases which have different response characteristics. The
amorphous phase is reactive and is acid soluble whereas the mullite phase is refractory and
insoluble in inorganic acids. A review of literature suggested a possibility that the alumina can
be extracted by first leaching one phase directly then transforming the other to make it leachable
in sulphuric acid.
In order to investigate this possibility, the aims of the study were defined as to:
Investigate the extent of aluminium extraction from CFA using sulphuric acid.
Investigate parameters that promote alumina dissolution in CFA using pre-sinter and post-
sinter leaching processes.
Investigate the physical and chemical properties of CFA during leaching so as to understand
the response of the ash to the beneficiation process.
8.1.2 Preliminary Acid Leaching
The direct leaching of CFA with sulphuric acid at different parameter levels of acid
concentration, leaching time, temperature and solid to liquid ratio provided a better
Page 118
Extraction of Aluminium from CFA Alan Shemi
Page 106
understanding of the CFA acid leaching process and reaction conditions. The results presented in
this study have shown that alumina dissolution in CFA is influenced by various parameters.
The elemental composition of CFA by particle size showed a narrow grade range. The highest
CFA alumina grade was found to be 31.59 % and the lowest was 29.16% showing a variance of
2.43% within a size range of -38 µm and +212 µm. Therefore, particle size of CFA was found
not to have much influence on the extent of aluminium extraction.
Preliminary leaching results showed a maximum aluminium extraction at 6M acid concentration.
Aluminium extraction efficiencies of 14.8% and 10.9% obtained above 6M acid concentration
were attributed to low mass transfer of reactants and products due to more calcium sulphate
formation on CFA particles due to an increase in sulphate ions from sulphuric acid in the
presence of calcium ions from CFA. Therefore, 6M was considered as the appropriate acid
concentration.
Experimental results showed that aluminium extraction increased with increase in leaching time.
An aluminium extraction efficiency of 16.8% was achieved after 6 hours of leaching. Leaching
beyond 6 hours showed slight increase in extraction. However, increased extraction with longer
leaching times signifies that adequate leaching time is necessary to overcome resistance to the
mass transfer of reactants and products caused by precipitate formation such as calcium sulphate.
Based on this information, 6 hours was adopted as the appropriate leaching time.
An aluminium extraction of 23.5% showed an increase with increase in temperature up to 75°C
with slight fluctuations in extractions between 75°C and 85°C. Aluminium extractions at higher
temperatures were attributed to the fact that molecules at higher temperatures have more thermal
energy required for effective reaction. In addition, higher temperatures may have been helpful in
breaking down the calcium sulphate precipitate layer in and around the CFA particles thus
increasing the rate of reaction. Based on this information, 75°C was adopted as the appropriate
leaching temperature.
An aluminium extraction of 16.5% was obtained at a solid to liquid ratio of 1:4. A 14.8%
extraction obtained at a solid to liquid ratio of 1:6 was attributed to low mass transfer rates of
Page 119
Extraction of Aluminium from CFA Alan Shemi
Page 107
reactants and products caused by increased calcium sulphate precipitate formation on CFA
particles due to increased acid volume. However, a 15.4% extraction obtained at a solid to liquid
ratio of 1:3 may have been caused by increased slurry mixture density causing inefficient
suspension of CFA particles. The ratio of 1:4 was therefore adopted as the appropriate solid to
liquid ratio.
Calcium sulphate precipitates were found to have an adverse effect on aluminium extractions.
Increase in calcium sulphate formation resulted in decreased extractions and vice versa. An
inverse relationship was observed and established between calcium sulphate formation and
aluminium extraction.
8.1.3 Identification of Significant Factors
A statistical Design of Experiments (DOE) method was employed as a research tool to develop
an experimentation strategy for influential factor determination. Factors investigated included:
acid concentration, leaching time, temperature and solid to liquid ratio. The significance of each
factor and associated interactive effects were evaluated using a two-level, four-factor full
factorial statistical design (24) and dissolved aluminium was taken as the measured response.
The design of experiments (DOE) and statistical method approach were able to convincingly
determine statistically significant and insignificant factors.
Acid concentration and solid to liquid ratio were found to be statistically insignificant while
leaching time and temperature were statistically significant. This means that acid concentration
and solid to liquid ratio did not significantly influence aluminium extraction while leaching time
and temperature had significant influence on the alumina extraction process. The results also
indicated that aluminium extraction was maximized at higher temperature and longer leaching
time values. This means that in order to achieve optimal aluminium extraction, temperature and
leaching time need to be kept at high factor levels. The interaction of parameters among the
variables was found to be statistically insignificant.
Page 120
Extraction of Aluminium from CFA Alan Shemi
Page 108
8.1.4 Optimization of Significant Factors
Optimization using a statistically-based approach called response surface methodology (RSM)
was employed to determine optimum conditions for the significant factors. This was a follow up
to diagnostic (screening) experiments (Box et al., 1978).
A second order quadratic polynomial regression model for factor optimization was derived using
computer simulation software by applying least squares method based on the experimental
design. The data for fitting the model was collected by using the central composite rotatable
design (CCRD) and a fitted predictive model was developed as a mathematical expression of
aluminium extraction from CFA. The experimental conditions for optimizing the significant
factors, temperature and leaching time were 6M acid concentration and 1:4 solid to liquid ratio.
These factor levels were chosen because they were adopted as appropriate levels in the
preliminary acid leach experiments.
From the prediction model, an optimal aluminium extraction efficiency of 23.95% was obtained
at optimal values of 82°C temperature and 10.2 hrs leaching time. A confirmatory test showed an
extraction efficiency of 24.8%, an error margin of 3.4%, and a linear correlation coefficiency of
97.8%, hence verifying the fitting of experimental data and the fitness of the model. The 24.8%
aluminium extraction represents 89.3% extraction of aluminium from the CFA amorphous phase.
Therefore, it can be concluded from the experimental results that CFA can be optimally leached
to achieve alumina dissolution from the amorphous phase by using sulphuric acid.
8.1.5 Kinetic Analysis
Mathematical modeling of fluid-solid systems is usually used to interpret experimental results
and to gain insight into these reaction mechanisms. The shrinking core model and activation
energy models were employed in the modeling of the CFA leaching system.
The experimental kinetic data for determining reaction mechanisms was collected by running
kinetic experiments at 50°C, 70°C and 82°C with intermittent aliquot sampling. The leaching
condition for the experiments were 6M acid concentration, 1:4 solid to liquid ratio and 10hrs
Page 121
Extraction of Aluminium from CFA Alan Shemi
Page 109
leaching time. The acid concentration and solid to liquid ratio factor levels were chosen because
they were adopted as appropriate levels in preliminary experiments. The 10hrs leaching time was
chosen in order to allow for as much aluminium extraction as possible.
From the activation energies governing rate controlling mechanisms, the calculated activation
energies were found to be 18.3kJmol-1
for the lower temperature range (50°C - 70°C) and
7.7kJmol-1
for the higher temperature range (70°C - 82°C). Both activation energies were found
to be characteristic of a product layer controlled mechanism. The shrinking core model predicted
similar results for the leaching reactions at 50°C and 82°C. However, at 70°C, the model
predicted differently, showing chemical reaction control as the rate controlling mechanism. This
inconsistency in prediction by the shrinking core model may have been due to the lack of
coupling the PSD with the shrinking model which can lead to an erroneous prediction of the rate
controlling mechanism.
8.1.6 Post-sinter Leaching
The CFA pre-treatment approach using pelletization and sintering was able to transform the
mullite phase into another leachable phase which was amenable to inorganic acid leaching.
A post-sinter (second stage) aluminium extraction efficiency of 84.3% was achieved from the
leaching of sintered residue-CFA whereas 85.2% was obtained from the leaching of sintered
raw-CFA showing that residue-CFA pre-conditioning is vital to alumina extraction. The post-
sinter aluminium extraction efficiency of sintered residue-CFA was found to be comparable to
that of sintered raw-CFA. This indicates possibility of higher aluminium extractions from
sintered residue-CFA if reaction conditions are varied in favour of more mullite transformation
to the easily leachable plagioclase phase.
Analysis of the sinter performance results showed that 83.6% post-sinter aluminium extraction
from the mullite phase using the pre-sinter and post-sinter (two-step acid leach) method were
achieved. However, a post-sinter aluminium extraction of 79.5% from the mullite phase using
the lime-sinter process was obtained under the same sintering and leaching conditions.
Page 122
Extraction of Aluminium from CFA Alan Shemi
Page 110
An extraction efficiency of 3.5% was obtained from the leaching of sintered residue-CFA using
recycled leach liquor. This showed that leaching with fresh sulphuric acid compared with the
recycled leach liquor from the first leach stage has a distinct advantage. This also showed that
recycled leach liquor was not effective in leaching and therefore has no advantage over fresh
sulphuric acid solution.
.
The transformation of the mullite phase to the plagioclase phase and subsequent successful
leaching of the formed phase showed that mullite phase transformation is a key factor in the
post-sinter (second stage) aluminium extraction process. This study, therefore, has demonstrated
that residue-CFA can be pre-treated and leached to optimally extract aluminium from CFA using
sulphuric acid.
A pre-sinter aluminium extraction efficiency of 89.3% from the amorphous phase and a post-
sinter extraction efficiency of 83.6% from the mullite phase yielded a total aluminium extraction
efficiency of 88.2% whereas an aluminium extraction efficiency of 85.2% was obtained from the
conventional (single-step acid leach) lime-sinter method.
8.1.7 Specific Outcomes
This study has added a new dimension to the potential of developing an alternative process
technology for the production of smelter grade alumina from CFA. The possible extraction of
smelter grade alumina from CFA will result in the achievement of specific outcomes such as:
Alumina import substitution
Promotion of self-sufficiency for the aluminium industry in the country
Savings on disposal and containment costs
Environmental protection
Employment creation and economic empowerment
Page 123
Extraction of Aluminium from CFA Alan Shemi
Page 111
8.2 Recommendations
With the knowledge gained from this work, the following recommendations for further studies
are proposed:
The role of calcium sulphate formation in alumina dissolution
This work had shown that when CFA is directly leached with sulphuric acid, aluminium
extraction decreased with increase in acid concentration due to calcium sulphate formation at
acid concentrations higher than 6M. In contrast, aluminium extraction increased with increase in
acid concentration between 1M and 6M due to decrease in calcium sulphate formation within
this acid range. This phenomenon may need to be investigated against the background of the
aqueous-sulphate system characteristics. In aqueous-sulphate systems, sulphate ions (SO4-2
) are
known to decrease with increase in pH to form bisulphate (HSO4-1
) ions. This leads to a
depletion of sulphate ions and an increase in bisulphate ions. A speciation study can be done to
investigate the influence of the various species in the acid solution as leaching progresses. The
study could look at how these species in solution impact on calcium sulphate formation and
aluminium extraction. In addition, the study could look at the possibility of some mineralogical
phase transformations or precipitates formed that also contributed to the significant drop in
aluminium extraction in the presence of acid concentrations. This study could also investigate the
nature of calcium sulphate encapsulation which is assumed to be in and around the pores of the
CFA particle and how it can be eliminated to enhance alumina dissolution. Further, this work can
be extended to find an explanation for the drop in calcium sulphate content from 45-60°C and a
sharp increase from 60-70°C.
Recycle of pre-sinter leach liquor
In acid leaching processes acid recovery is a mitigating factor to operational costs. This work had
shown that leach liquor from pre-sinter (first stage) leaching could not be effectively used in the
subsequent post-sinter (second stage) leaching. This work can be extended to experimentally see
why the recycled leach liquor was not effective as well as study measures required to improve its
effectiveness.
Page 124
Extraction of Aluminium from CFA Alan Shemi
Page 112
Economic Analysis
This work had shown that by employing a two-step acid leach method based on a leach-sinter-
leach method, CFA can be optimally leached. This can be extended to a comparative study of
economic aspects associated with the pre-sinter and post-sinter (two-step acid leach) process, the
conventional lime-sinter process and the Bayer process. In particular, the study can look at
economic aspects such as reagent consumption, processing time and energy usage by doing a
cost benefit analysis. Further economic assessment is required to see if the 3% increase in
aluminium extraction efficiency from 85.2 – 88.2% is economically justifiable.
Optimization of post-sinter leaching
In this study, parameters used in the second leaching stage were based on literature and
optimized parameters from the pre-sinter leaching. This work can be extended to study the
optimization of sintering and post-sinter leaching conditions. In particular, the study can look at
optimizing parameters such as: sinter feed mixing ratio (residue-CFA: Coal: CaO), sintering
temperature, sintering time, leaching time, leaching temperature, solid to liquid ratio and acid
concentration.
Kinetics of leaching processes
In this work, controlling reaction mechanisms were modelled using the shrinking core models
and activation energy rate controlling mechanisms. The shrinking core model showed an
inconsistency in predicting the controlling reaction mechanism when compared to the activation
energy model prediction. Extant literature (Gbor and Jia, 2004) suggests that coupling the PSD to
the shrinking core model yields better prediction of reaction mechanisms. This work can be
extended to investigate the use of a model that takes into account CFA particle size distribution
to see its effect on the accuracy of reaction mechanism prediction.
Page 125
Extraction of Aluminium from CFA Alan Shemi
Page 113
REFERENCES
Aluminium., 2013. Encyclopedia Britannica, Internet Version <http://www.britannica.com>.
Retrieved 16 February 2013.
ASTM® Manual., 2012. Form and Style for American Society for Testing and Materials
International. ASTM® International, Pennsylvania.
Authier-Martin, M., Forte, G., Ostap, S., See, J., 2001. The Mineralogy of Bauxite for Producing
Smelter Grade Alumina. Journal of the Minerals, Metals and Materials Society, Vol. 53, No.
12, pp. 36-40.
Babcock and Wilcox Company., 2007. Steam, Its Generation and Use. Internet Version
<http://www.Gutenberg.org>. Retrieved 16 February 2013.
Barrentine, L.B., 1999. An Introduction to Design of Experiments: A Simplified Approach. ASQ
Quality Press, Wisconsin.
Biegler, L.T., 2010. Nonlinear programming. Concepts, Algorithms, and Applications to
Chemical Processes. MOS-SIAM, Philadelphia.
Box, G.E.P., Hunter, W.G., Hunter, J.S., 1978. Statistics for Experimenters: An Introduction to
Design, Data Analysis and Model Building. John Wiley and Sons, New York.
Burnet, G., Murtha, M.J., Dunker, J.W., 1984. Recovery of metals from coal ash. Ames
Laboratory, US DOE Iowa State University Ames, Iowa 50011.
Chang, R., 2005. Physical Chemistry for the Biosciences. University Science Books, Sausalito
(CA), pp. 311-347.
Czitrom, V., 1999. One-Factor-At-a-Time Versus Designed Experiments. The American
Statistician, Vol. 53, No. 2, pp. 126 – 131.
Daniel, C., 1959. Use of Half Normal plots in Interpreting Factorial Two Level Experiments.
Technometrics, 1 (4), 311-341.
Page 126
Extraction of Aluminium from CFA Alan Shemi
Page 114
Dean, J.A., 1992. Lange‟s Handbook of Chemistry. McGraw Hill, New York.
Design Expert® 6 Manual., 2010. Internet Version <http://www.statease.com>. Stat-Ease,
Incorporation, Minneapolis. Retrieved 5 February 2013.
Duval, D.J., Risbud, S.H., Shackelford, J.F., 2008. Ceramic and Glass Materials Structure,
Properties and Processing. Springer, New York.
Earnshaw, A., Greenwood, N.N., 1997. Chemistry of the Elements (2nd
Edition). Butterworth-
Heinemann, Oxford.
Edgar, T.F., Himmelblau, D. M., 1988. Optimisation of Chemical Processes.
McGraw-Hill, New York.
ELGA LabWater, 2009. Pure Lab Water Guide – An Essential Overview of Lab water
Purification, Applications, Monitoring and Standards. <http://www.elgawater.com>.
Retrieved 18 February 2013.
Gbor, P.K., Jia, C.Q., 2004. Critical Evaluation of Coupling Particle Size Distribution with the
Shrinking Core Model. Chemical Engineering Science, Vol. 59, pp. 1979-1987.
Gilliam, T.M., Canon, R.M., Egan, B.Z., Kelmers, A.D., Seeley, F.G., and Watson, J.S., 1982.
Economic Metal Recovery from Fly Ash. Resources and Conservation, pp. 155-168.
Grades of chemicals., 2008. Internet Version <http://www.reagents.com>. Retrieved 18 February
2013.
Gupta, C, K., 2003. Chemical Metallurgy: Principles and Practice. Wiley-VCH Verlag GmbH &
Co. KGaA, Weinheim.
Habashi, F., 1969. Principles of Extractive Metallurgy: General principles. Gordon and Breach,
New York.
Habashi, F., 2005. A Short History of Hydrometallurgy. Hydrometallurgy, Vol. 79, pp. 15-22.
Halada, K., Shimada, M., Ijima, K., 2008. Forecasting of the Consumption of metals up to 2050.
Materials Transactions, Vol. 49, No. 3, pp. 402 – 410.
Page 127
Extraction of Aluminium from CFA Alan Shemi
Page 115
Hansen, K.R.N., von Rahden, H.V.R., Regester, W.V., McCulloch, H.W., 1966. The Extraction
of Alumina from Sasol Coal Ash. National Institute for Metallurgy, Research report No. 30.
Housecroft, C.E., Sharpe, A.G., 2008. Inorganic Chemistry (3rd
Edition). Pearson, England.
Jackson, E., 1986. Hydrometallurgical Extraction and Reclamation. John Wiley and Sons, New
York.
Jinping, L.I., Haobo, H., Jinhua, G., Shujing Z., Yongjie, X., 2007. Extraction of Aluminium and
Iron from Boiler Slag by sulphuric acid. Wuhan University Journal of Natural Sciences, Vol.
12, No. 3, pp. 541-547.
Kelmers, A.D., Canon, R.M., Egan, B.Z., Felker, L.K., Gilliam, T.M., Jones, G., Owen, G.D.,
Seeley, F.G., Watson, J.S., 1982. Chemistry of the direct leach, Calsinter, and Pressure
Digested Acid leach methods for the recovery of Alumina from Fly Ash. Resources and
Conservation, pp. 271-279.
Khuri, A. I., Cornell, J. A., 1987. Response Surfaces: Designs and Analyses. Marcel
Dekker, Inc., New York.
Kutchko, B.G., Kim, A.G., 2006. Fly Ash Characterization by SEM-EDS, Fuel, pp. 2537-2544.
Kuusik, R., Saikkonen, P., Niinisto, L., 1985. Thermal Decomposition of Calcium Sulphate in
Carbon Monoxide. Journal of Thermal Analysis, Vol. 30, pp. 187-193.
Laidler, K., 1984. Development of the Arrhenius Equation. Journal of Chemical Education, Vol.
61, No. 6, pp. 494.
Landman, A.A., 2003. Aspects of Solid-state Chemistry of Fly Ash and Ultramarine Pigments:
Literature review of Fly Ash. University of Pretoria ETD. Retrieved 28 March 2010.
Levenspiel, O., 1972. Chemical Reaction Engineering. John Willey and Sons, New York.
Lide, D, R, ed., CRC Handbook of Chemistry and Physics, Internet Version 2007 (87th
Edition),
<http://www.hbcpnetbase.com>. Retrieved 18 August 2012.
Page 128
Extraction of Aluminium from CFA Alan Shemi
Page 116
Logan, S.R., 1982. The Origin and Status of the Arrhenius Equation. Journal of Chemical
Education, Vol. 59, No. 4, pp. 279.
Loubser, M., Verryn, S., 2008. Combining XRF and XRD analyses and sample preparation to
solve mineralogical problems. South African Journal of Geology, Vol. 111, pp. 229-238.
Maleka, E.M., Mashimbye, L., Goyns, P., 2010. South African Energy Synopsis 2010, Internet
Version 2010, <http://www.energy.gov.za>, Department of Energy, Pretoria. Retrieved 8
February 2013.
Mason, R.L., Gunst, R.F., Hess, J.L., 1989. Statistical Design and Analysis of Experiments. John
Wiley and Sons, New York.
Matjie, R.H., Bunt, J.R., Van Heerden J.H.P., 2005. Extraction of Alumina from Coal Fly Ash
generated from a selected low rank bituminous South African coal. Minerals Engineering,
Vol. 18, pp. 299-310.
McCabe, W.L., Smith, J.C., Harriott, P., 1993. Unit Operations of Chemical Engineering (5th
Edition). McGraw-Hill, New York.
McDowell, W.J., Seeley, F.G., 1981a. Recovery of Aluminum and other Metal Values from Fly
Ash. Oak Ridge, patent US4252777.
McDowell, W.J., Seeley, F.G., 1981b. Salt-Soda sinter process for recovering Aluminum from
Fly Ash. Oak Ridge, patent US4254088.
Montgomery, D.C., 1976. Design and Analysis of Experiments. John Wiley and Sons, New
York.
Montgomery, D.C., 1997. Design and Analysis of Experiments. John Wiley and Sons, New
York.
Montgomery, D.C., 2005. Design and Analysis of Experiments. John Wiley and Sons, New
Jersey.
Murtha, M.J., 1983. Process for the Recovery of Alumina from Fly Ash. Patent US4397822.
Page 129
Extraction of Aluminium from CFA Alan Shemi
Page 117
Murtha, M.J., Burnet, G., 1983. Power Plant Fly Ash – Disposal and Utilization. Environmental
Progress, Vol. 2, No.3
Napier-Munn, T. J., 2000. The Central Composite Rotatable Design. JKMRC, The
University of Queensland, Brisbane, Australia, pp. 1-9.
Nayak, N., Chitta, R. P., 2009. Aluminium extraction and leaching characteristics of Talcher
Thermal Power Station Fly Ash with Sulphuric Acid. Fuel, pp. 53-58.
Nehari, S., Hasharon R., Gorin, C., Haim, K., Israel, L. J., 1999. Process for recovery of Alumina
and Silica. Patent US5993758.
NIST/SEMATECH e-Handbook of Statistical Methods., 2012. Internet Version
<http://www.itl.nist.gov/div898/handbook>. Retrieved 19 February 2013.
Padilla, R., Sohn, H. Y., 1985. Sintering Kinetics and Alumina Yield in Lime-Soda-Sinter
Process for Alumina from Coal Waste. Metallurgical Transactions, Vol. 16, pp. 385.
Perry, R.; Green D., Maloney, J., 1984. Perry's Chemical Engineers' Handbook (6th
Edition).
McGraw-Hill, New York.
Phillips, C.V., Wills, K.J., 1982. A Laboratory study of the extraction of Alumina of Smelter
grade from China Clay Micaceous residues by a Nitric Acid Route. Hydrometallurgy, pp. 15-
28.
Potgieter, J.H., Kabemba, M.A., Teodorovic, A., Potgieter-Vermaak, S.S., Augustyn, W.G.,
2006. An investigation into the feasibility of recovering valuable metals from solid oxide
compounds by gas phase extraction in a fluidized bed. Minerals Engineering, Vol. 19, pp.
140-146.
Quality Guide., 2012. Pareto Analysis. <http://erc.msh.org/quality/pstools/pspareto.cfm.>
Retrieved 25 March 2013.
Richardson, J.F., Harker, J.H., Backhurst, J.R., 2002. Particle Technology and Separation
Processes, Chemical Engineering (5th
Edition). Butterworth-Heinmann, Oxford.
Page 130
Extraction of Aluminium from CFA Alan Shemi
Page 118
Saeed, M.T., Ahmad, J., Shaheen, M.Y., 2009. Commercial Application of Extracting Reagents
for Metal Recovery. Journal of Pakistani Institute of Chemical Engineers, Vol. 13, No. 59,
pp. 1- 4.
Sakamoto, T., Shibata, K., Takanashi, L., Owari, M., Nihei, Y., 2003. Analysis of surface
composition and internal structure of fly ash particles using an iron and electron multibeam
micro analyzer. Applied Surface Science, pp. 762-766.
SD Fine-Chemicals Price List., 2012. Internet Version <http://www.sdfine.com>, Retrieved 28
January 2013.
Segal, I.H., 1975. Enzyme Kinetics: Behaviour and Analysis of Rapid Equilibrium and Steady
State Enzyme Systems. John Wiley and Sons, New York. pp. 931-933.
Seidel, A., Sluszny, A., Shelef, G., Zimmels, Y., 1998. Self inhibition of Aluminum leaching
from Coal Fly Ash by Sulphuric acid, Chemical Engineering Journal, pp. 195-207.
Seidel, A., Zimmels, Y., 1998. Mechanism and Kinetics of Aluminium and Iron leaching from
coal fly ash by Sulphuric acid. Chemical Engineering Science, Vol. 53, No. 22, pp. 3835-
3852.
Seidel, A., Zimmels, Y., and Armon, R., 2001. Mechanism of bioleaching of coal fly ash by
Thiobacillus thiooxidans. Chemical Engineering Journal, pp. 123-130.
Shcherban, S., Raizman V., Pevzner, I., 1995. Technology of Coal Fly Ash Processing into
Metallurgical and Silicate Chemical Products. Kazakh Politechnical University, Alma-Ata.
Simate, G.S., Ndlovu, S., 2008. Bacterial leaching of nickel laterites using chemolithotropic
microorganisms: Identifying influential factors using statistical design of experiments.
International Journal of Mineral Process, Vol. 88, pp. 31-36.
Simate, G.S., Ndlovu, S., Gericke, M., 2009. Bacterial leaching of nickel laterites using
chemolithotropic microorganisms: Process optimization using response surface methodology
and central composite rotatable design. Hydrometallurgy, Vol. 98, pp. 241-246.
Tague, N.R., 2004. The Quality Toolbox, Second Edition, ASQ Quality Press, Wisconsin.
Page 131
Extraction of Aluminium from CFA Alan Shemi
Page 119
Thiemann, M., Scheibler, E., Wiegand, K.W., 2005. Nitric acid, Nitrous acid and Nitrogen
Oxides – Ullmann Encyclopedia of Industrial Chemistry, Wiley-VCH, Weinheim.
Thompson, J.V., 1995. Alumina: Simple Chemistry - Complex plants. Engineering and Mining
Journal 42.
Tripathy, S.K., Murthy, Y.R., 2012. Modeling and optimization of spiral concentrator for
separation of ultrafine chromite. Powder Technology, Vol.221, pp. 387-394.
Van, H., Kent, R, (ed)., 1967. Aluminium, Design and Application (Volume 2). American
Society for Metals, Ohio.
Wen, C.Y., 1968. Non-catalytic Heterogeneous Solid-fluid Reaction Models. Industrial and
Engineering Chemistry, Vol. 60, pp. 34-54
Wilkinson, L., 2006. Revising the Pareto chart. American Statistician, Vol. 60, No.4, pp. 332-
334.
Page 132
Extraction of Aluminium from CFA Alan Shemi
Page 120
APPENDICES
Page 133
Extraction of Aluminium from CFA Alan Shemi
Page 121
APPENDIX A
SAMPLE CALCULATIONS
Page 134
Extraction of Aluminium from CFA Alan Shemi
Page 122
%Aluminium Extraction
The % aluminium extraction during the leaching of CFA was calculated as a percentage of the
aluminium in the liquid phase to that in the CFA.
Example
Pre-sinter (first stage) Aluminium Extraction
Basis of calculation:
CFA weight (actual) before leaching = 100g
% Al2O3 content in CFA (XRF analysis) = 30.5 wt%
Al2O3 molecular weight = 102gmol-1
Al molecular weight = 27gmol-1
Al moles in Al2O3 = 2
Calculations
Al content in CFA =
After Leaching:
Leach liquor volume = 500 mL (500*10-3
Litres)
Al in leach liquor (ICP analysis) = 8020 ppm (8020*10-3
gpl)
Al content in 500mL =
∴ % Aluminium extraction =
Actual residue-CFA weight after leaching = 92.47g
Al content in residue-CFA =
Page 135
Extraction of Aluminium from CFA Alan Shemi
Page 123
Sinter Feed Mixture
Pelletization
Residue CFA weight =
Mixing ratio (CFA: Coal: CaCO3) =
CFA =
Coal =
CaCO3 =
Total weight of sinter feed mixture =
Aluminium from Coal material
% Al in coal material = 1.05% (Chapter 3 section 3.2.3)
Aluminium in mixture from coal =
Sintering
Pellet mixture before sintering = (actual weight)
Pellets mixture after sintering = (actual weight)
% weight loss due to sintering =
Actual weight loss =
∴ % Al in clinker from coal addition =
Page 136
Extraction of Aluminium from CFA Alan Shemi
Page 124
Post-sinter (second stage) aluminium Extraction
Basis of calculation:
Sintered residue-CFA weight (actual) = 50g
% Al2O3 in sintered residue-CFA (XRF analysis) = 25.89 wt%
Aluminium from coal material in residue-CFA = 0.62%
Al2O3 molecular weight = 102gmol-1
Al molecular weight = 27gmol-1
Al moles in Al2O3 = 2
Calculations
Al content in residue-CFA =
Aluminium from coal in residue-CFA =
Al in residue-CFA less aluminium from coal* =
After Leaching:
Leach liquor volume = 500 mL (500*10-3
Litres) = 0.5L
Al in leach liquor (ICP analysis) = 11640 ppm =11.64 gpl
Al content in 0.5L =
Al in leach liquor less aluminium from coal* =
∴ % Post-sinter aluminium extraction =
* The leachability of aluminium in coal was not investigated and therefore not known. However,
it was assumed that the aluminium was leachable. Therefore, in order to get a true reflection of
the actual aluminium extraction from residue-CFA, the aluminium in coal was deducted from
both the residue-CFA feed and leach liquor.
Page 137
Extraction of Aluminium from CFA Alan Shemi
Page 125
Pre-sinter and Post-sinter Combined Aluminium Extraction
Pre-sinter aluminium extraction
Basis of calculation
CFA weight (actual) before leaching = 100g
% Al2O3 content in CFA (XRF analysis) = 30.52 wt%
Al2O3 molecular weight = 102gmol-1
Al molecular weight = 27gmol-1
Al moles in Al2O3 = 2
Al content in CFA =
Pre-sinter (first stage) extraction efficiency =
∴ Extracted aluminium =
Al remaining in residue-CFA =
Residue-CFA weight (actual) =
Pelletization
Residue-CFA weight (actual) =
Mixing ratio (CFA: Coal: CaCO3) =
CFA =
Coal =
CaCO3 =
Total weight of mixture =
Page 138
Extraction of Aluminium from CFA Alan Shemi
Page 126
Sintering
Residue-CFA pellets before sintering (actual) =
Sintered residue-CFA pellets after sintering (actual) =
Post-sinter aluminium extraction
Basis of calculation
Al from CFA in residue-CFA= Al content in pelletized residue-CFA= Al in sintered residue-
CFA= (equation 7.6)
Post-sinter Al extraction efficiency = 84.3%
∴ Extracted aluminium =
Combined extraction
Extracted aluminium from first stage leaching =
Extracted aluminium from second stage leaching =
Total extracted aluminium =
∴ Combined aluminium extraction efficiency =
Page 139
Extraction of Aluminium from CFA Alan Shemi
Page 127
Sinter Performance
Sinter performance was calculated as a percentage of the total aluminium extracted in the pre-
sinter and post-sinter leaching less the aluminium from the amorphous phase to that in the
mullite phase.
Pre-sinter and post sinter technique
Total aluminium extracted in pre-sinter leaching = 4.01g
Total alumina in amorphous phase = 4.49g
Unextracted alumina from amorphous phase = 0.48g
Mullite phase alumina in residue
Alumina extracted from mullite phase =
% Sinter performance =
Conventional lime-sinter technique
Extraction efficiency from raw-CFA = 85.2%
Total aluminium in CFA = 16.16g
Total aluminium extracted =
Total alumina in amorphous phase = 4.49g
Aluminium extracted from mullite phase =
Total aluminium in mullite phase =
% Sinter performance =
Page 140
Extraction of Aluminium from CFA Alan Shemi
Page 128
A Phase Quantification of Alumina in CFA
A phase quantification of alumina in CFA was determined based on the difference between the
total alumina in CFA as per the XRF analysis and the mullite phase alumina as per the XRD
analysis.
Example
Basis of calculation:
Sample weight = 100g
% Al2O3 in raw CFA (XRF analysis) = 30.52%wt
Aluminium molecular weight = 27gmol-1
Silicon molecular weight = 28gmol-1
Oxygen molecular weight = 16gmol-1
Al2O3 molecular weight = 102gmol-1
Mullite (3Al2O3·2SiO2) molecular weight = 426gmol-1
In a 100g sample,
Total Al2O3 in CFA = 30.52g ……………………….①
Total Al in CFA = ……………….②
% Amorphous in raw CFA (XRD analysis) = 52.9%wt
% Mullite (3Al2O3·2SiO2 or Al6Si2O13) in raw CFA (XRD analysis) = 30.68%wt
In a 100g sample,
Total mullite = 30.68g ………………………..③
Al2O3 in mullite phase = …………………………….④
Al in mullite phase = …….……………………….⑤
Page 141
Extraction of Aluminium from CFA Alan Shemi
Page 129
From equations ① and ④
% Al2O3 in mullite phase = ……………………………⑥
From equations ② and ⑤
% Al in mullite phase = …………………………….⑦
From equations ① and ④
Al2O3 in amorphous phase =
% Al2O3 in amorphous phase = …..⑧
From equations ② and ⑤
% Al in amorphous phase = ……⑨
Raw CFA
Phase Amorphous (52.9%) Mullite (30.68%wt) Other (16.42%)
Al2O3 27.8% 72.2% -
Al 27.8% 72.2% -
% Calcium sulphate content in CFA
Calcium sulphate content in CFA was calculated as a percentage of the total calcium sulphate in
the anhydrous and hydrous phase to the CFA sample weight.
Example
Basis of calculation
CFA sample weight = 100 g
Gypsum (CaSO4·2H2O) content in CFA (XRD analysis) = 1.56 wt%
Gypsum (CaSO4·2H2O) molecular weight = 172 gmol-1
Page 142
Extraction of Aluminium from CFA Alan Shemi
Page 130
CaSO4·2H2O molecular weight = 136 gmol-1
Calcium sulphate moles in CaSO4·2H2O = 1
Calcium sulphate content in CFA from gypsum =
Anhydrite (CaSO4) content in CFA (XRD analysis) = 6.93 wt%
CaSO4 content in CFA from anhydrite = 6.93 g
% Total CaSO4 content in CFA = = 8.2%
Determination of Activation Energies
Example
From the kinetics experiment, alumina dissolution in sulphuric acid was considered to proceed
according to the following reaction:
CaO + Al2O3 + 4H2SO4 → Al2 (SO4)3 + CaSO4 + 4H2O
The changing rate in alumina dissolution was observed, at different temperatures, by monitoring
the concentration of aluminium sulphate [Al2(SO4)3].
The rate of reaction at any instant of time was determined by measuring the slope of the
curve at that time. This also corresponds to the rate of reaction at an instant of
concentration.
From the rate of reaction at an instant of concentration, the rates of reaction versus
concentrations were determined and plotted.
The slopes from the plots of rates of reaction versus concentrations gave the values for the
rate constants k1, k2 and k3 as 6.3 x 10⁻⁵
, 9.7 x10⁻⁵
and 10.7 x10⁻⁵
respectively at
corresponding temperatures of T1 = 50°C= 323K, T2=70°C=343K and T3= 82°C=355K.
Using the Arrhenius equation previously derived in Chapter 2 section 2.4 (Chang, 2005; Segal,
1975; Laidler, 1984; Logan, 1982),
Page 143
Extraction of Aluminium from CFA Alan Shemi
Page 131
And,
,
,
.
At,
,
,
.
Activation energy between T1 and T2 is calculated as follows:
,
,
∴
Similarly using above Arrhenius equation for T2 and T3 we have,
,
And activation energy between T2 and T3 is calculated as follows:
,
,
.
Page 144
Extraction of Aluminium from CFA Alan Shemi
Page 132
Design of Experiments
Main Effect
An effect is the difference in response averages that are applicable to the levels of the factor. The
effect of factor A on the response can be obtained by taking the difference between the average
response when A is high and the average response when A is low.
Effect of factor A = Average response at A high – Average response at A low
Example
Replicate 1 Table C2
Average response at A high, is given by averaging the results obtained by running experiments 2,
4, 6, 8, 10, 12, 14 and 16, and average response at A low by averaging the results obtained from
running experiments 1, 3, 5, 7, 9, 11, 13 and 15.
Average extractions at A high =
14.45
Average extractions at A low =
Difference =
∴ Effect of factor A =
Effect of factor A is also referred to as a main effect.
Interaction Effect
An interaction is a cross product of two or more factors. The net sign of the interaction is also a
cross product of the individual signs of the factors. The identity of an interaction comes from the
identity of the individual factors involved in the cross product. A cross product of factor A and
factor B yields a two factor interaction AB.
Page 145
Extraction of Aluminium from CFA Alan Shemi
Page 133
An interactive effect is the difference in response averages that are applicable to the levels of the
interaction. The interactive effect of interaction AB on the response can be obtained by taking
the difference between the average response when AB is high and the average response when
AB is low.
Effect of interaction AB = Average response at AB high – Average response at AB low
Example
Replicate 1 Table C2
Average response at AB high, is given by averaging the results obtained by running experiments
2, 4, 6, 8, 10, 12, 14 and 16, and average response at AB low by averaging the results obtained
from running experiments 1, 3, 5, 7, 9, 11, 13 and 15.
Average response at AB high =
Average response at AB low =
Difference =
∴ Effect of interaction AB =
Applying the same approach as above to the rest of the factorial design in replicate 1 Table C2
the main and interactive effects are calculated and arranged in ascending order of magnitude as
shown in Table A1.
Table A1 Main and interactive effects
Order
Number
i
1 2 3 4 5 6 7 8 9 10 11 12 13 14 15
Effect -0.77 -0.74 -0.70 -0.60 -0.49 -0.46 -0.16 -0.01 0.35 0.40 0.91 0.97 1.05 2.19 4.91
Identity
of effect
AD ACD D BD A CD ABD AC BCD BC ABCD AB ABC B C
Page 146
Extraction of Aluminium from CFA Alan Shemi
Page 134
Normal probability plots
Normal probability plots are a plot of probability for
where m = the number of effects under consideration, excluding the average, on the y-axis
against effects in Table A1 on the x-axis.
Computing for and adding the obtained values to
Table A1 gives the effects for normal probability plots as shown in Table A2.
Table A2 Normal probability plots
Order
Number
i
1 2 3 4 5 6 7 8 9 10 11 12 13 14 15
Effect -0.77 -0.74 -0.70 -0.60 -0.49 -0.46 -0.16 -0.01 0.35 0.40 0.91 0.97 1.05 2.19 4.91
Identity
of effect
AD ACD D BD A CD ABD AC BCD BC ABCD AB ABC B C
P=100(i-
1/2)/15
3.3 10 16.7 23.3 30.0 36.7 43.3 50.0 56.7 63.3 70.0 76.7 83.3 90.0 96.7
Modeling the significant effects for extraction prediction
Beginning with effects with magnitudes close to zero, 13 of the estimates fit reasonably well on a
straight line. Those corresponding to B and C do not fit on the straight line. It can therefore be
concluded that the effects B and C are not easily explained as chance occurrences. This suggests
that all effects with the exception of the average extraction 14.68, B= 2.19 and C = 4.91 can be
explained by noise.
Therefore, +
Where, Ῡ represents the average of all the data for the runs (i.e. average of all extractions) and
XB and XC are the predictor variables (i.e. +1 or -1), B and C are effects.
The coefficients that appear in the equations are half the calculated effects because a change
from x = -1 to x = +1 is a change of two units along the x-axis.
Page 147
Extraction of Aluminium from CFA Alan Shemi
Page 135
Therefore,
Predicted extraction,
Y =
=
The predicted extraction is calculated by substituting an appropriate predictor variable in a
particular run.
Example
Replicate 1 Table C2
In run1, the predictor variables are XB = -1, XC = -1
Predicted extraction =
The positive signs of the variables of the prediction model equation indicate that in order to
maximize the acid leaching of CFA, these factors must be kept in high levels.
Residual
This is the difference between the actual extraction and the predicted extraction for each run.
Example
Replicate 1 Table C2
Actual extraction = 11.7, predicted extraction = 11.14
Residual =
Page 148
Extraction of Aluminium from CFA Alan Shemi
Page 136
APPENDIX B
PRELIMINARY ACID LEACHING
Page 149
Extraction of Aluminium from CFA Alan Shemi
Page 137
Table B1 Aluminium concentration (ppm)
Conditions for acid leaching of CFA at different acid concentrations:
Leaching time 8hrs, temperature 60°C, solid to liquid ratio 1:4
Acid concentration
(M)
ppm ppm
2
4
6
8
10
2446
2592
2662
2313
1698
2212
2724
2468
2224
1902
Table B2 Aluminium extraction (%)
Conditions for acid leaching of CFA at different acid concentrations:
Leaching time 8hrs, temperature 60°C, solid to liquid ratio 1:4
Acid concentration
(M)
% %
2
4
6
8
10
15.1
16.0
16.5
14.3
10.5
13.7
16.9
15.3
13.8
11.8
Page 150
Extraction of Aluminium from CFA Alan Shemi
Page 138
Table B3 Aluminium concentration (ppm)
Conditions for acid leaching of CFA at different leaching times:
acid concentration 6M, temperature 60°C, solid to liquid ratio 1:4
Leaching time
(hrs)
ppm ppm
4
6
8
10
12
2172
2618
2662
2755
2556
2392
2840
2468
2534
2335
Table B4 Aluminium extraction (%)
Conditions for acid leaching of CFA at different leaching times:
acid concentration 6M, temperature 60°C, solid to liquid ratio 1:4
Leaching time
(hrs)
% %
4
6
8
10
12
13.4
16.2
16.5
17.1
15.8
14.8
17.6
15.3
15.7
14.5
Page 151
Extraction of Aluminium from CFA Alan Shemi
Page 139
Table B5 Aluminium concentration (ppm)
Conditions for acid leaching of CFA at different leaching temperatures:
acid concentration 6M, time 8hrs, solid to liquid ratio 1:4
Leaching
temperature
(°C)
ppm ppm
30
45
60
75
80
85
1610
2361
2662
3804
3694
3740
1859
2210
2468
3479
3626
3526
Table B6 Aluminium extraction (%)
Conditions for acid leaching of CFA at different leaching temperatures:
acid concentration 6M, time 8hrs, solid to liquid ratio 1:4
Leaching
temperature
(°C)
% %
30
45
60
75
80
85
10.0
14.6
16.5
23.5
22.9
23.1
11.5
13.7
15.3
21.5
22.4
21.8
Page 152
Extraction of Aluminium from CFA Alan Shemi
Page 140
Table B7 Aluminium concentration (ppm)
Conditions for acid leaching of CFA at different solid to liquid ratios:
acid concentration 6M, time 8hrs, temperature 60°C
Solid to liquid ratio ppm ppm
1:2
1:3
1:4
1:5
1:6
2430
2484
2662
2617
2399
2339
2713
2468
2388
2307
Table B8 Aluminium extraction (%)
Conditions for acid leaching of CFA at different solid to liquid ratios:
acid concentration 6M, time 8hrs, temperature 60°C
Solid to liquid ratio % %
1:2
1:3
1:4
1:5
1:6
15.0
15.4
16.5
16.2
14.8
14.5
16.8
15.3
14.8
14.3
Page 153
Extraction of Aluminium from CFA Alan Shemi
Page 141
APPENDIX C
IDENTIFICATION OF SIGNIFICANT FACTORS
Page 154
Extraction of Aluminium from CFA Alan Shemi
Page 142
Table C1 Aluminium concentration (ppm) for 24 full factorial design
Acid leaching conditions: agitation rate 150 rpm. The actual factor levels coded as values of
(-1) and (+) in the table are as follows: A (Acid concentration): 4M (-1) and 8M (+1); B
(Leaching time): 6hrs (-1) and 10hrs (+1); C (Leaching temp): 45oC (-1) and 75
oC (+1); D
(Solid: Liquid ratio): 1:3(-1) and 1:5(+1)
Std
Runs
Control Factors
Replicate 1
Replicate 2
A B C D
1 -1 -1 -1 -1 1893 1807
2 +1 -1 -1 -1 1658 1575
3 -1 +1 -1 -1 2176 2198
4 +1 +1 -1 -1 2260 1855
5 -1 -1 +1 -1 2658 2460
6 +1 -1 +1 -1 2614 2276
7 -1 +1 +1 -1 2910 3089
8 +1 +1 +1 -1 3277 3467
9 -1 -1 -1 +1 1839 1791
10 +1 -1 -1 +1 1941 1660
11 -1 +1 -1 +1 2161 2143
12 +1 +1 -1 +1 1893 1777
13 -1 -1 +1 +1 2874 2671
14 +1 -1 +1 +1 2101 2223
15 -1 +1 +1 +1 2804 3052
16 +1 +1 +1 +1 2927 2763
Page 155
Extraction of Aluminium from CFA Alan Shemi
Page 143
Table C2 Aluminium extraction (%) for 24 full factorial design
Acid leaching conditions: agitation rate 150 rpm. The actual factor levels coded as values of
(-1) and (+) in the table are as follows: A (Acid concentration): 4M (-1) and 8M (+1); B
(Leaching time): 6hrs (-1) and 10hrs (+1); C (Leaching temp): 45oC (-1) and 75
oC (+1); D
(Solid: Liquid ratio): 1:3(-1) and 1:5(+1)
Std
Runs
Control Factors
Replicate 1
Replicate 2
A B C D
1 -1 -1 -1 -1 11.7 11.2
2 +1 -1 -1 -1 10.3 9.8
3 -1 +1 -1 -1 13.5 13.6
4 +1 +1 -1 -1 14.0 11.5
5 -1 -1 +1 -1 16.4 15.2
6 +1 -1 +1 -1 16.2 14.0
7 -1 +1 +1 -1 18.0 19.1
8 +1 +1 +1 -1 20.3 21.5
9 -1 -1 -1 +1 11.4 11.1
10 +1 -1 -1 +1 12.0 10.3
11 -1 +1 -1 +1 13.4 13.3
12 +1 +1 -1 +1 11.7 11.0
13 -1 -1 +1 +1 17.8 16.5
14 +1 -1 +1 +1 13.0 13.7
15 -1 +1 +1 +1 17.3 18.9
16 +1 +1 +1 +1 18.1 17.1
Page 156
Extraction of Aluminium from CFA Alan Shemi
Page 144
Table C3 Aluminium concentration (ppm) for centre points design
Acid leaching conditions: agitation rate 150 rpm. The actual factor levels coded as values of (0)
in the table are centre point values and are as follows: A (Acid concentration): 6M (0); B
(Leaching time): 8hrs (0); C (Leaching temp): 60oC (0); D (Solid: Liquid ratio): 1:4(0)
Table C4 Aluminium extraction (%) for centre points design
Acid leaching conditions: agitation rate 150 rpm. The actual factor levels coded as values of (0)
in the table are centre point values and are as follows: A (Acid concentration): 6M (0); B
(Leaching time): 8hrs (0); C (Leaching temp): 60oC (0); D (Solid: Liquid ratio): 1:4(0)
Run
Control Factors
A B C D
1 0 0 0 0 2265 2175
2 0 0 0 0 2468 2405
3 0 0 0 0 2304 2120
4 0 0 0 0 2441 2455
5 0 0 0 0 2229 2249
6 0 0 0 0 2402 2007
Run
Control Factors
Replicates 1
Replicate 2
A B C D
1 0 0 0 0 14.0 13.5
2 0 0 0 0 15.3 14.9
3 0 0 0 0 14.3 13.1
4 0 0 0 0 15.1 15.2
5 0 0 0 0 13.8 13.9
6 0 0 0 0 14.9 12.4
Page 157
Extraction of Aluminium from CFA Alan Shemi
Page 145
APPENDIX D
OPTIMIZATION OF SIGNIFICANT FACTORS
Page 158
Extraction of Aluminium from CFA Alan Shemi
Page 146
Table D1 Aluminium concentrations (ppm)
Acid leaching conditions: agitation rate 150 rpm. The actual factor levels coded as values of
– λ, -1, 0, +1, + λ were as follows: for temperature, °C (A): 68 (- λ), 70 (-1), 75 (0), 80 (+1), 82
(+ λ); time, hrs (B): 7.34 (- λ), 7.75 (-1), 8.75 (0), 9.75 (+1), 10.16 (+ λ)
Standard
Run
Coded
Replicate
1
Replicate
2
A
B
1 -1 -1 3244 3263
2 +1 -1 3626 3664
3 -1 +1 3359 3313
4 +1 +1 3784 3695
5 - λ 0 3210 3279
6 + λ 0 3764 3602
7 0 - λ 3456 3409
8 0 + λ 3540 3575
9 0 0 3522 3109
10 0 0 3526 3509
11 0 0 3568 3342
12 0 0 3490 3295
13 0 0 3506 3432
Page 159
Extraction of Aluminium from CFA Alan Shemi
Page 147
Table D2 Aluminium extractions (%)
Acid leaching conditions: agitation rate 150 rpm. The actual factor levels coded as values of
– λ, -1, 0, +1, + λ were as follows: for temperature, °C (A): 68 (- λ), 70 (-1), 75 (0), 80 (+1), 82
(+ λ); time, hrs (B): 7.34 (- λ), 7.75 (-1), 8.75 (0), 9.75 (+1), 10.16 (+ λ)
Standard
Run
Coded
Replicate
1
Replicate
2
A
B
1 -1 -1 20.1 20.2
2 +1 -1 22.5 22.7
3 -1 +1 20.8 20.5
4 +1 +1 23.4 22.9
5 - λ 0 19.9 20.3
6 + λ 0 23.3 22.3
7 0 - λ 21.4 21.1
8 0 + λ 21.9 22.1
9 0 0 21.8 19.3
10 0 0 21.8 21.7
11 0 0 22.1 20.7
12 0 0 21.6 20.4
13 0 0 21.7 21.3
Page 160
Extraction of Aluminium from CFA Alan Shemi
Page 148
Table D3 Confirmatory tests
Acid Leaching conditions: acid concentration 6M, leaching time 10.16hrs, temperature 82°C,
solid to liquid ratio 1:4. Agitation rate 150 rpm.
Aluminium concentrations (ppm)
Run
1 3888
2 4140
3 4063
4 3994
Aluminium extractions (%)
Run
1 24.1
2 25.5
3 25.1
4 24.6
Avg. 24.8
Page 161
Extraction of Aluminium from CFA Alan Shemi
Page 149
APPENDIX E
POST-SINTER LEACHING
Page 162
Extraction of Aluminium from CFA Alan Shemi
Page 150
Table E1 Aluminium concentrations (ppm)
Conditions for post-sinter leaching of CFA:
acid concentration 6M, temperature 82°C, solid to liquid ratio 1:4
Leaching time
(hrs)
ppm ppm
10.2
13623
13350
Table E2 Aluminium extractions (%)
Conditions for post-sinter leaching of CFA:
acid concentration 6M, temperature 82°C, solid to liquid ratio 1:4
Leaching time
(hrs)
% %
10.2
84.3
82.6
Page 163
Extraction of Aluminium from CFA Alan Shemi
Page 151
CFA - XRD Analysis Results
Table E3 Raw CFA before pre-sinter (first stage) leaching
AS104
Amorphous 52.9 1.59
Hematite 0.8 0.27
Magnetite 1.65 0.21
Mullite 30.68 1.29
Quartz 13.97 0.84
Figure E1. X-Ray Diffractogram of raw-CFA before first stage leaching
Position [°2Theta] (Cobalt (Co))
10 20 30 40 50 60 70
Counts
0
400
1600
3600
6400
As104_Wits
Peak List
Mullite, syn; Al6 Si2 O13
Silicon, syn; Si
Quartz Low; Si O2
Hematite; Fe2 O3
Magnetite; Fe3 O4
Page 164
Extraction of Aluminium from CFA Alan Shemi
Page 152
Table E4 Raw-CFA after pre-sinter (first stage) leaching
AS105
Amorphous 58.49
Anhydrite 7.12
Mullite 23.94
Quartz 10.45
Figure E2. X-Ray Diffractogram of raw-CFA after first stage leaching
Position [°2Theta] (Cobalt (Co))
10 20 30 40 50 60 70
Counts
0
2500
10000 As105_Wits
Peak List
Anhydrite; Ca1 O4 S1
Mullite, syn; Al6 Si2 O13
Silicon, syn; Si
Quartz Low; Si O2
Page 165
Extraction of Aluminium from CFA Alan Shemi
Page 153
Table E5 Sintered residue-CFA Before post-sinter (second stage) leaching
AS130
Amorphous 23.03 1.89
Anhydrite 0.22 0.1
Cristobalite 8.07 1.41
Mullite 8.02 0.66
Plagioclase 54.07 1.08
Quartz 6.6 0.36
Figure E3. X-Ray Diffractogram of sintered residue-CFA before second stage leaching
Position [°2Theta] (Cobalt (Co))10 20 30 40 50 60 70
Counts
0
5000
10000
15000 Wits_Ex_AS130
Peak List
Mullite; Al4.52 O9.74 Si1.48
Quartz; Si O2
Hematite, syn; Fe2 O3
Silicon, syn; Si
Anorthite; Al2 Ca0.71 Na0.25 O8 Si2
Cristobalite, low; Si O2
Page 166
Extraction of Aluminium from CFA Alan Shemi
Page 154
Table E6 Sintered residue-CFA after post-sinter (second stage) leaching
AS129
Amorphous 52.91 1.11
Anhydrite 23.18 0.42
Calcite 0.26 0.15
Cristobalite 4.68 0.78
Gypsum 2.89 0.28
Mullite 8.98 0.6
Quartz 7.09 0.33
Figure E4. X-Ray Diffractogram of sintered residue-CFA after second stage leaching
10 20 30 40 50 60 70
Counts
0
5000
10000
Wits_Alan_Ex-A5129_Fly Ash
Peak List Anhydrite; Ca1 O4 S1 Quartz low; O2 Si1 Cristobalite low; O2 Si1 Mullite; Al4.64 O9.68 Si1.36 Calcite; C1 Ca1 O3 Gypsum; H4 Ca1 O6 S1 Silicon; Si1
Page 167
Extraction of Aluminium from CFA Alan Shemi
Page 155
Calcium sulphate content in leached raw-CFA (Tables E7 – E12)
Table E7
Ex_AS_367 Ex_AS_369 Ex_AS_384
Amorphous 48.44 0.93 Alunogen 4.51 0.57 Amorphous 46.56 0.99
Anhydrite 6.93 0.33 Amorphous 44.25 1.11 Anhydrite 0.29 0.18
Gypsum 1.56 0.3 Anhydrite 6.35 0.3 Gypsum 6.33 0.3
Mullite 30.35 0.66 Gypsum 0.71 0.22 Mullite 33.07 0.78
Quartz 12.72 0.42 Mullite 28.95 0.63 Quartz 13.75 0.45
Pyrophyllite 2.88 0.48
Quartz 12.36 0.39
Table E8
Ex_AS_385 Ex_AS_386 Ex_AS_387
Amorphous 47.44 1.02 Amorphous 49.2 0.99 Amorphous 45.98 0.99
Anhydrite 2.92 0.33 Anhydrite 0.95 0.21 Anhydrite 0.5 0.21
Gypsum 2.69 0.24 Gypsum 3.72 0.25 Gypsum 4.43 0.27
Mullite 32.91 0.75 Mullite 31.79 0.75 Mullite 34.01 0.78
Quartz 14.05 0.45 Quartz 14.34 0.42 Quartz 15.08 0.45
Table E9
Ex_AS_388 Ex_AS_431 Ex_AS_432
Amorphous 48.34 0.9 Amorphous 50.36 1.02 Amorphous 49.68 0.99
Anhydrite 0.39 0.15 Anhydrite 0.14 0.1 Anhydrite 0.21 0.14
Gypsum 4.48 0.26 Gypsum 5.15 0.28 Gypsum 5.46 0.27
Mullite 32.51 0.69 Mullite 31.04 0.81 Mullite 31.64 0.78
Quartz 14.28 0.42 Quartz 13.31 0.48 Quartz 13.01 0.45
Table E10
Ex_AS_433 Ex_AS_435 Ex_AS_488
Amorphous 49.35 1.02 Amorphous 45.79 0.96 Amorphous 48.2 1.02
Anhydrite 0.18 0.15 Anhydrite 2.21 0.19 Anhydrite 3.96 0.3
Gypsum 4.55 0.27 Gypsum 5.17 0.26 Gypsum 3.54 0.24
Mullite 32.14 0.78 Mullite 32.53 0.72 Mullite 31.11 0.75
Quartz 13.78 0.45 Quartz 14.31 0.42 Quartz 13.2 0.42
Page 168
Extraction of Aluminium from CFA Alan Shemi
Page 156
Table E11
Ex_AS_489 Ex_AS_490 Ex_AS_491
Amorphous 49.43 0.99 Alunogen 3.55 0.45 Amorphous 52.48 2.97
Anhydrite 4.81 0.33 Amorphous 41.21 2.1 Anhydrite 5.93 0.36
Gypsum 2.91 0.23 Anhydrite 5.56 0.36 Gypsum 1.02 2.76
Mullite 30.24 0.72 Gypsum 4.36 1.77 Mullite 26.19 0.69
Quartz 12.61 0.42 Mullite 29.73 0.72 Pyrophyllite 4.13 0.66
Pyrophyllite 3.31 0.45 Quartz 10.25 0.42
Quartz 12.27 0.42
Table E12
Ex_AS_492
Alunogen 4.33 0.48
Amorphous 46.5 17.7
Anhydrite 5.5 0.33
Gypsum 1.3 17.7
Mullite 27.53 0.69
Pyrophyllite 3.85 0.6
Quartz 10.95 0.42