Extrusion Intelligence, OEE (Overall Equipment Effectiveness) for extrusion plants Second part “Performance” This is the second article of a series of three concerning the application of OEE method in extrusion, wherein the production performances will be deepened. The goal is to go beyond the basic analysis of a generic KPI “Performance”, to create and manage more specific KPIs that allow an immediate identification of any lack of performances and the related causes and possible solutions: define more specific KPIs is needed as a generic one is just a simple average, although a weighted one. Design and analyze more specific KPIs allows to know and improve situations that a generic KPI can highlight as good ones but that actually have vast room for improvement. To reach this goal, as specified in the previous article, it must be defined an analysis path that, starting from aggregated data related to the productivity, allows to analyze the single specific detail. How to measure production Performances? The pic. A shows the generic KPI Performance = D/C (Real net Kg/h / Theoretical net Kg/h; highlighted with the red rectangle) which measures the lack of performances due to extrusion speed decreases, missing billet optimizations, technical scraps and a bad planning. This document will analyze the performances increase function of technical scraps decrease and define the basic KPIs needed to check them. Check and analyze the KPIs related to the production is mandatory to apply the continuous improvement philosophy. The performances analysis does not consider the downtimes occurred during the production process as they were already considered in the first article (“Availability KPI”). Pic. A
Transcript
Extrusion Intelligence, OEE (Overall Equipment Effectiveness) for extrusion plants
Second part “Performance”
This is the second article of a series of three concerning the application of OEE method in extrusion,
wherein the production performances will be deepened.
The goal is to go beyond the basic analysis of a generic KPI “Performance”, to create and manage more
specific KPIs that allow an immediate identification of any lack of performances and the related causes and
possible solutions: define more specific KPIs is needed as a generic one is just a simple average, although a
weighted one.
Design and analyze more specific KPIs allows to know and improve situations that a generic KPI can
highlight as good ones but that actually have vast room for improvement.
To reach this goal, as specified in the previous article, it must be defined an analysis path that, starting from
aggregated data related to the productivity, allows to analyze the single specific detail.
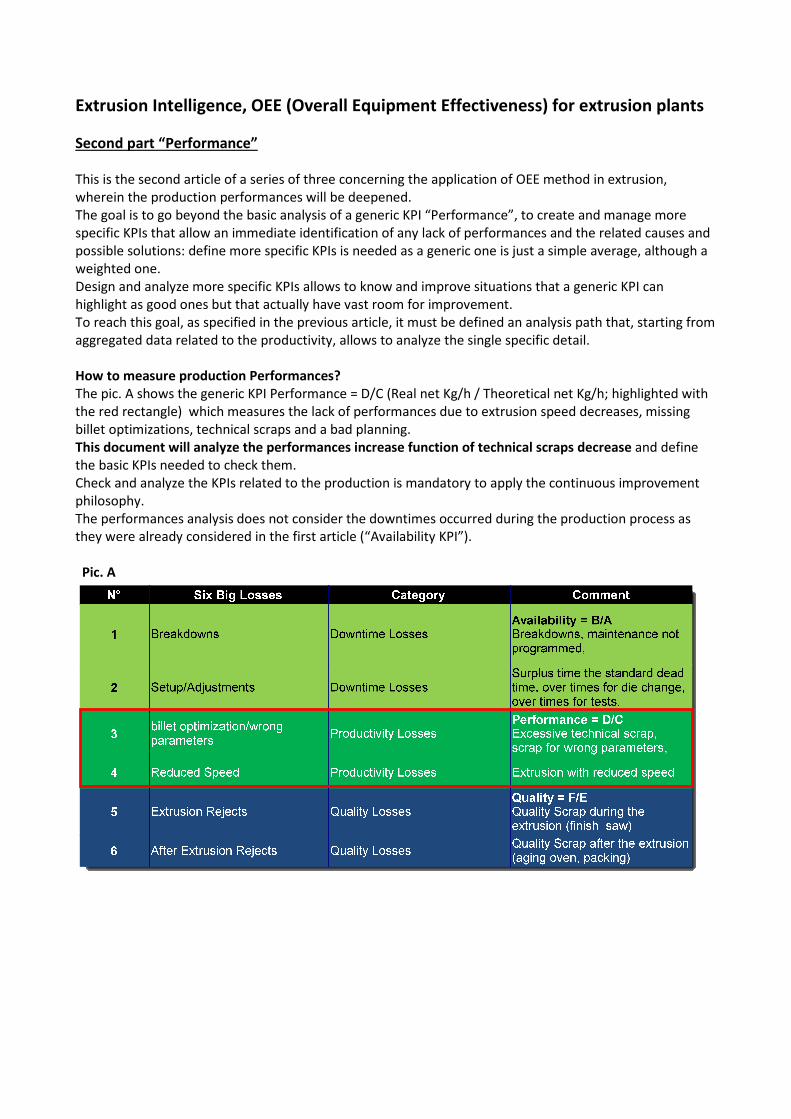
How to measure production Performances?
The pic. A shows the generic KPI Performance = D/C (Real net Kg/h / Theoretical net Kg/h; highlighted with
the red rectangle) which measures the lack of performances due to extrusion speed decreases, missing
billet optimizations, technical scraps and a bad planning.
This document will analyze the performances increase function of technical scraps decrease and define
the basic KPIs needed to check them.
Check and analyze the KPIs related to the production is mandatory to apply the continuous improvement
philosophy.
The performances analysis does not consider the downtimes occurred during the production process as
they were already considered in the first article (“Availability KPI”).
Pic. A
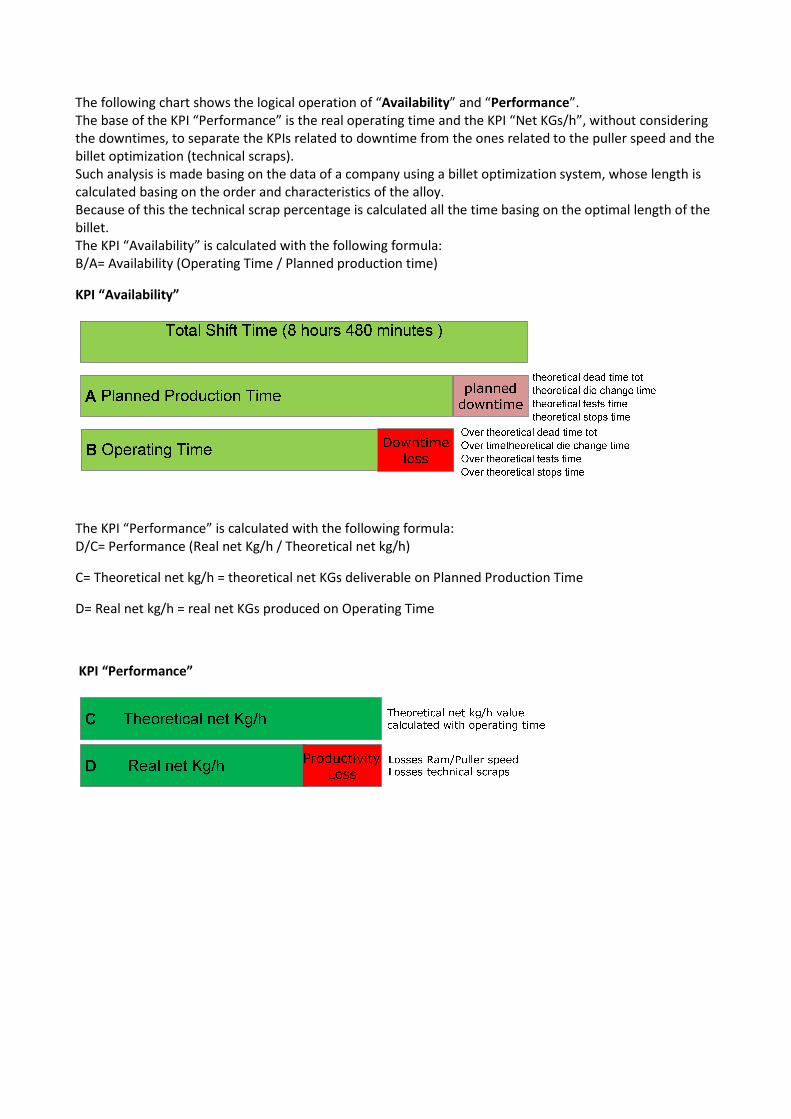
The following chart shows the logical operation of “Availability” and “Performance”.
The base of the KPI “Performance” is the real operating time and the KPI “Net KGs/h”, without considering
the downtimes, to separate the KPIs related to downtime from the ones related to the puller speed and the
billet optimization (technical scraps).
Such analysis is made basing on the data of a company using a billet optimization system, whose length is
calculated basing on the order and characteristics of the alloy.
Because of this the technical scrap percentage is calculated all the time basing on the optimal length of the
billet.
The KPI “Availability” is calculated with the following formula:
B/A= Availability (Operating Time / Planned production time)
KPI “Availability”
The KPI “Performance” is calculated with the following formula:
D/C= Performance (Real net Kg/h / Theoretical net kg/h)
C= Theoretical net kg/h = theoretical net KGs deliverable on Planned Production Time
D= Real net kg/h = real net KGs produced on Operating Time
KPI “Performance”
The following table shows the KPIs recommended to be kept under control to have a good management of
the technical scraps; red-highlighted the ones analyzed in this document.
Description U.M.
Production (Gross KGs) Kg
Production (Net KGs) Kg
Total scrap (KGs) Kg
Theoretical net KGs/h (operating time) Kg/h
Real net KGs/h (without considering the first billet) Kg/h
Real net KGs/h (considering the first billet) Kg/h
Real net KGs/h (considering a longer first billet) Kg/h
Scrap (KGs/h) Kg/h
Total technical scrap (%) %
Technical scrap (%; without considering the first billet) %
Technical scrap (%;considering the first billet) %
Billet length weighted average mm
Handling table length weighted average mm
Lot size weighted average kg
Technical scraps
Technical scraps means head & tail scraps, joints & butt-ends, the billets required to form the profile and
the scraps generated at the shear, that is any scrap which cannot be eliminated but that can let you make a
better production run if optimized.
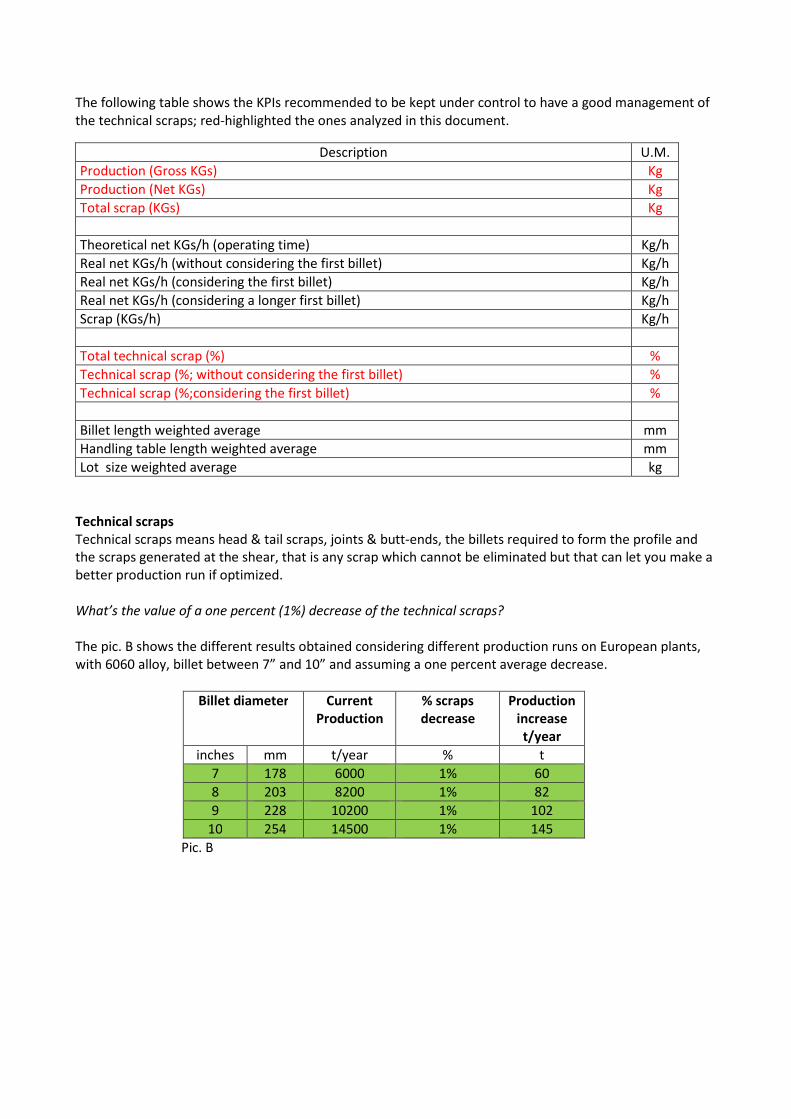
What’s the value of a one percent (1%) decrease of the technical scraps?
The pic. B shows the different results obtained considering different production runs on European plants,
with 6060 alloy, billet between 7” and 10” and assuming a one percent average decrease.
Billet diameter Current
Production
% scraps
decrease
Production
increase
t/year
inches mm t/year % t
7 178 6000 1% 60
8 203 8200 1% 82
9 228 10200 1% 102
10 254 14500 1% 145
Pic. B
The analysis will be based on data collected on a three-presses facility and a theoretical technical scrap KPI
equal to 10%.
The pic. C shows the daily production progress, highlighting gross KGs, net KGs and scrap percentage.
The weighted average of the real scrap, for the three presses, is equal to 10,9%; the graph shows a growing
trend but basically a positive situation with a 0,9% deviation from the theoretical KPI.
Starting from this data the user can check if there is room for improvement, so the causes of this scrap
must be understood and, above all, the economic advantages due to its decrease must be valued.
Pic. C
Besides a “what-if” analysis that, assuming to decrease to the theoretical KPI value (10%) any die exceeding
it, can be done: such analysis calculates the theoretical advantages due to this decrease.
drill down
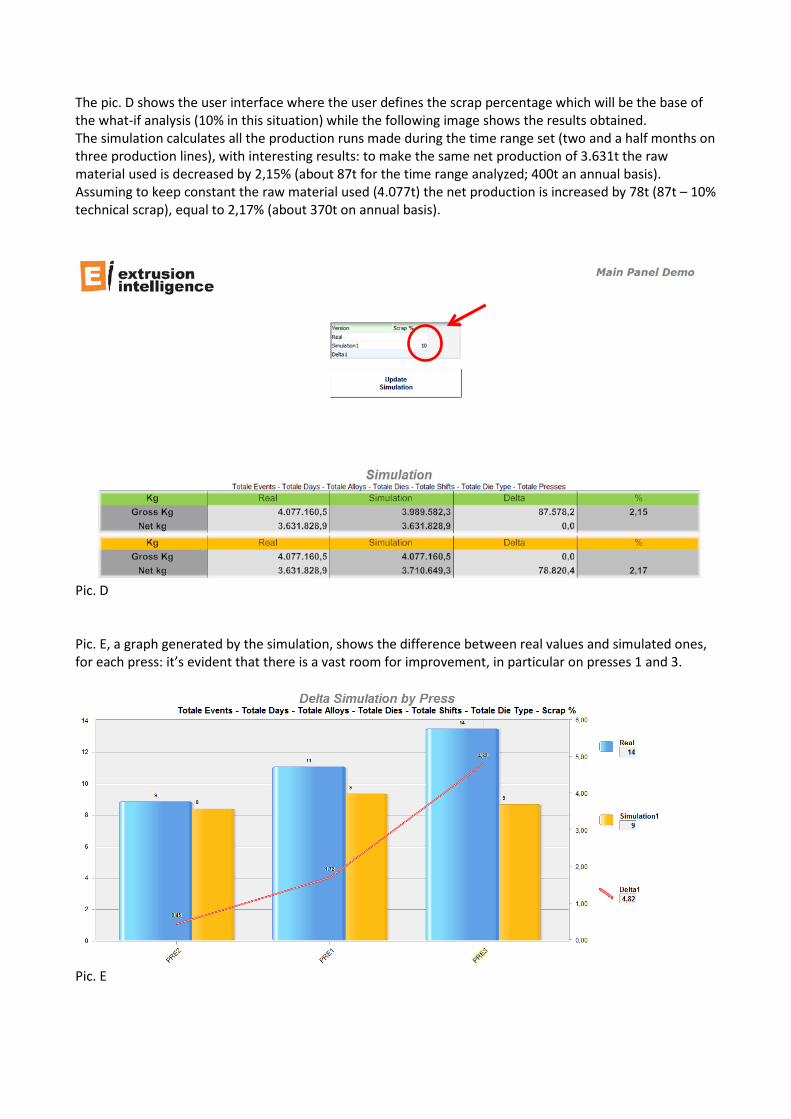
The pic. D shows the user interface where the user defines the scrap percentage which will be the base of
the what-if analysis (10% in this situation) while the following image shows the results obtained.
The simulation calculates all the production runs made during the time range set (two and a half months on
three production lines), with interesting results: to make the same net production of 3.631t the raw
material used is decreased by 2,15% (about 87t for the time range analyzed; 400t an annual basis).
Assuming to keep constant the raw material used (4.077t) the net production is increased by 78t (87t – 10%
technical scrap), equal to 2,17% (about 370t on annual basis).
Pic. D
Pic. E, a graph generated by the simulation, shows the difference between real values and simulated ones,
for each press: it’s evident that there is a vast room for improvement, in particular on presses 1 and 3.
Pic. E
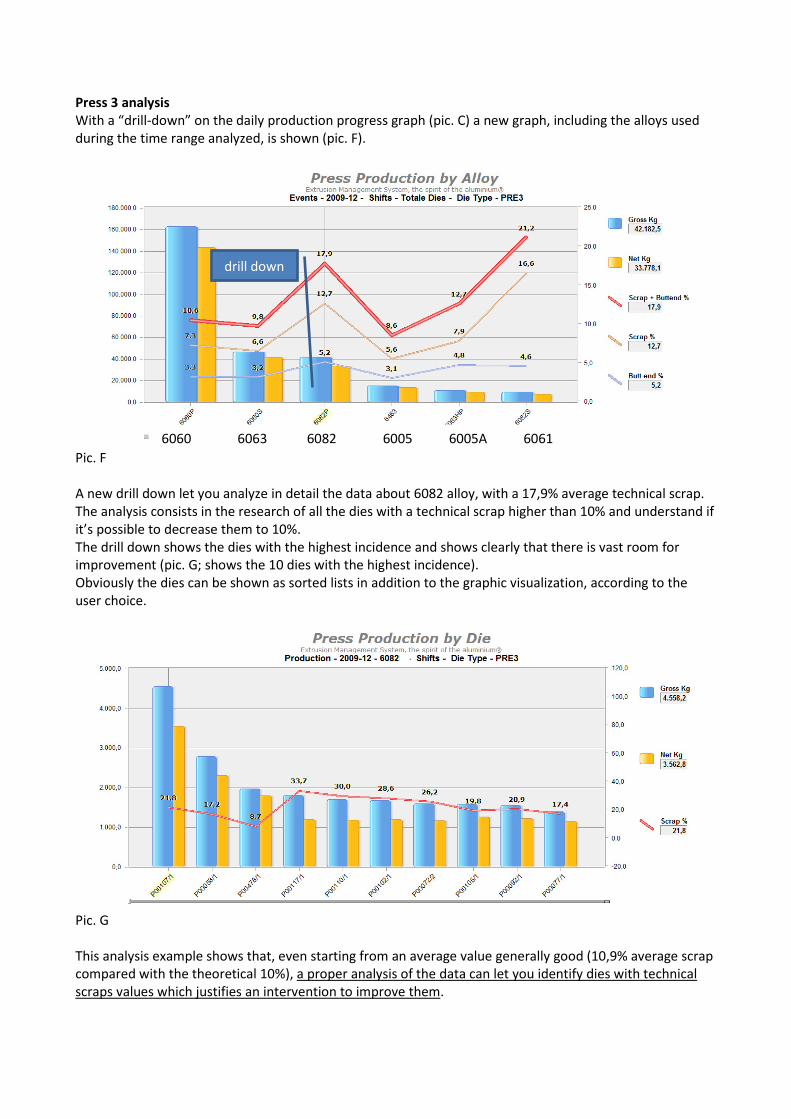
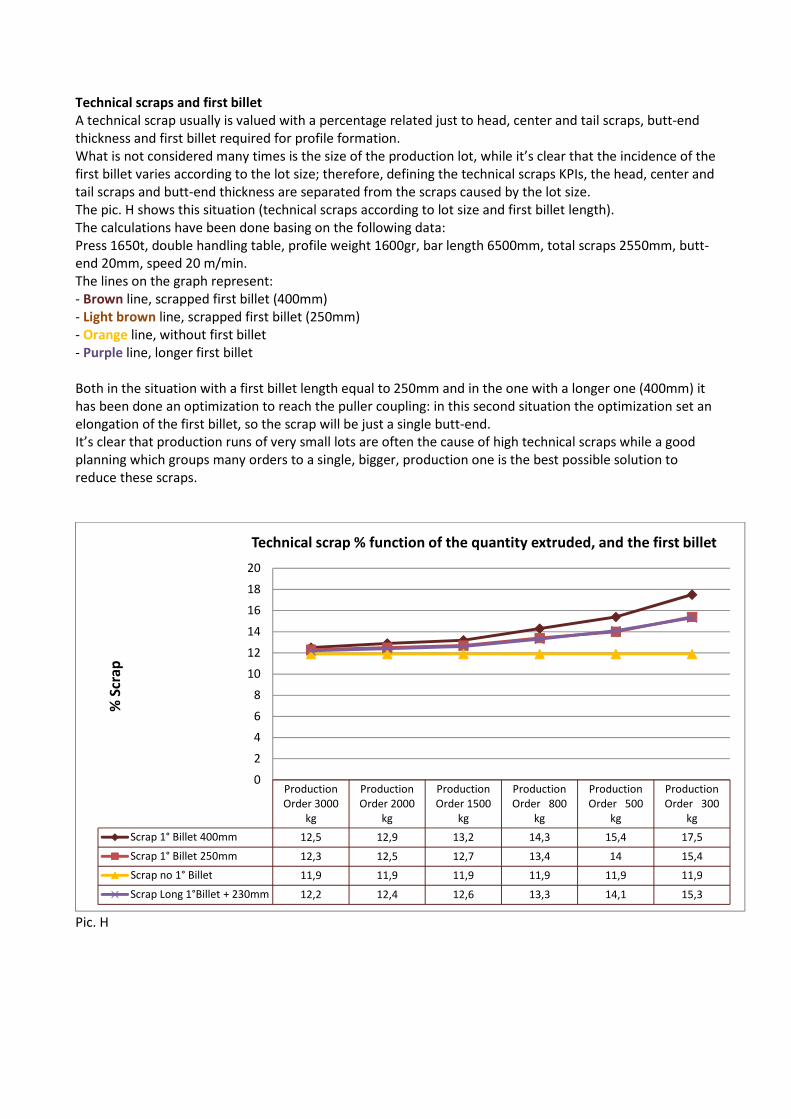
Press 3 analysis
With a “drill-down” on the daily production progress graph (pic. C) a new graph, including the alloys used
during the time range analyzed, is shown (pic. F).
Pic. F
A new drill down let you analyze in detail the data about 6082 alloy, with a 17,9% average technical scrap.
The analysis consists in the research of all the dies with a technical scrap higher than 10% and understand if
it’s possible to decrease them to 10%.
The drill down shows the dies with the highest incidence and shows clearly that there is vast room for
improvement (pic. G; shows the 10 dies with the highest incidence).
Obviously the dies can be shown as sorted lists in addition to the graphic visualization, according to the
user choice.
Pic. G
This analysis example shows that, even starting from an average value generally good (10,9% average scrap
compared with the theoretical 10%), a proper analysis of the data can let you identify dies with technical
scraps values which justifies an intervention to improve them.
drill down
6060 6063 6082 6005 6005A 6061
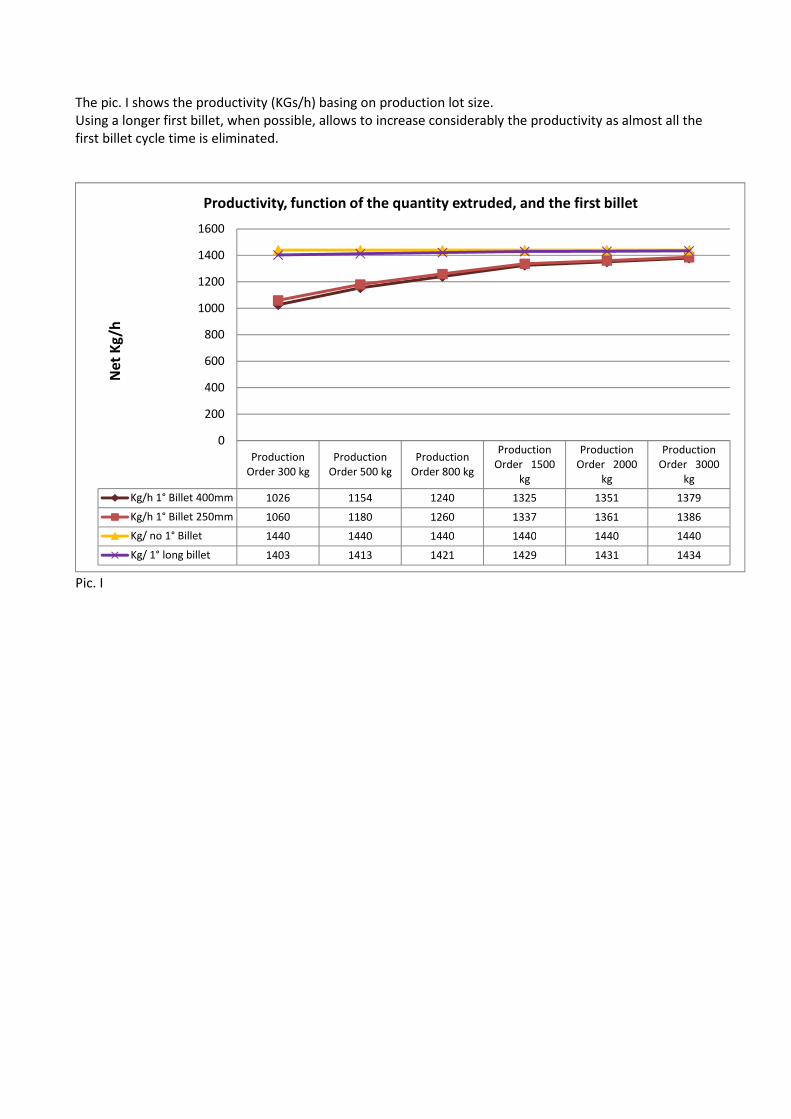
Technical scraps and first billet
A technical scrap usually is valued with a percentage related just to head, center and tail scraps, butt-end
thickness and first billet required for profile formation.
What is not considered many times is the size of the production lot, while it’s clear that the incidence of the
first billet varies according to the lot size; therefore, defining the technical scraps KPIs, the head, center and
tail scraps and butt-end thickness are separated from the scraps caused by the lot size.
The pic. H shows this situation (technical scraps according to lot size and first billet length).
The calculations have been done basing on the following data:
Press 1650t, double handling table, profile weight 1600gr, bar length 6500mm, total scraps 2550mm, butt-
end 20mm, speed 20 m/min.
The lines on the graph represent:
- Brown line, scrapped first billet (400mm)
- Light brown line, scrapped first billet (250mm)
- Orange line, without first billet
- Purple line, longer first billet
Both in the situation with a first billet length equal to 250mm and in the one with a longer one (400mm) it
has been done an optimization to reach the puller coupling: in this second situation the optimization set an
elongation of the first billet, so the scrap will be just a single butt-end.
It’s clear that production runs of very small lots are often the cause of high technical scraps while a good
planning which groups many orders to a single, bigger, production one is the best possible solution to